
Combining Semi-Targeted Metabolomics and Machine Learning to Identify Metabolic Alterations in the Serum and Urine of Hospitalized Patients with COVID-19
 , , and
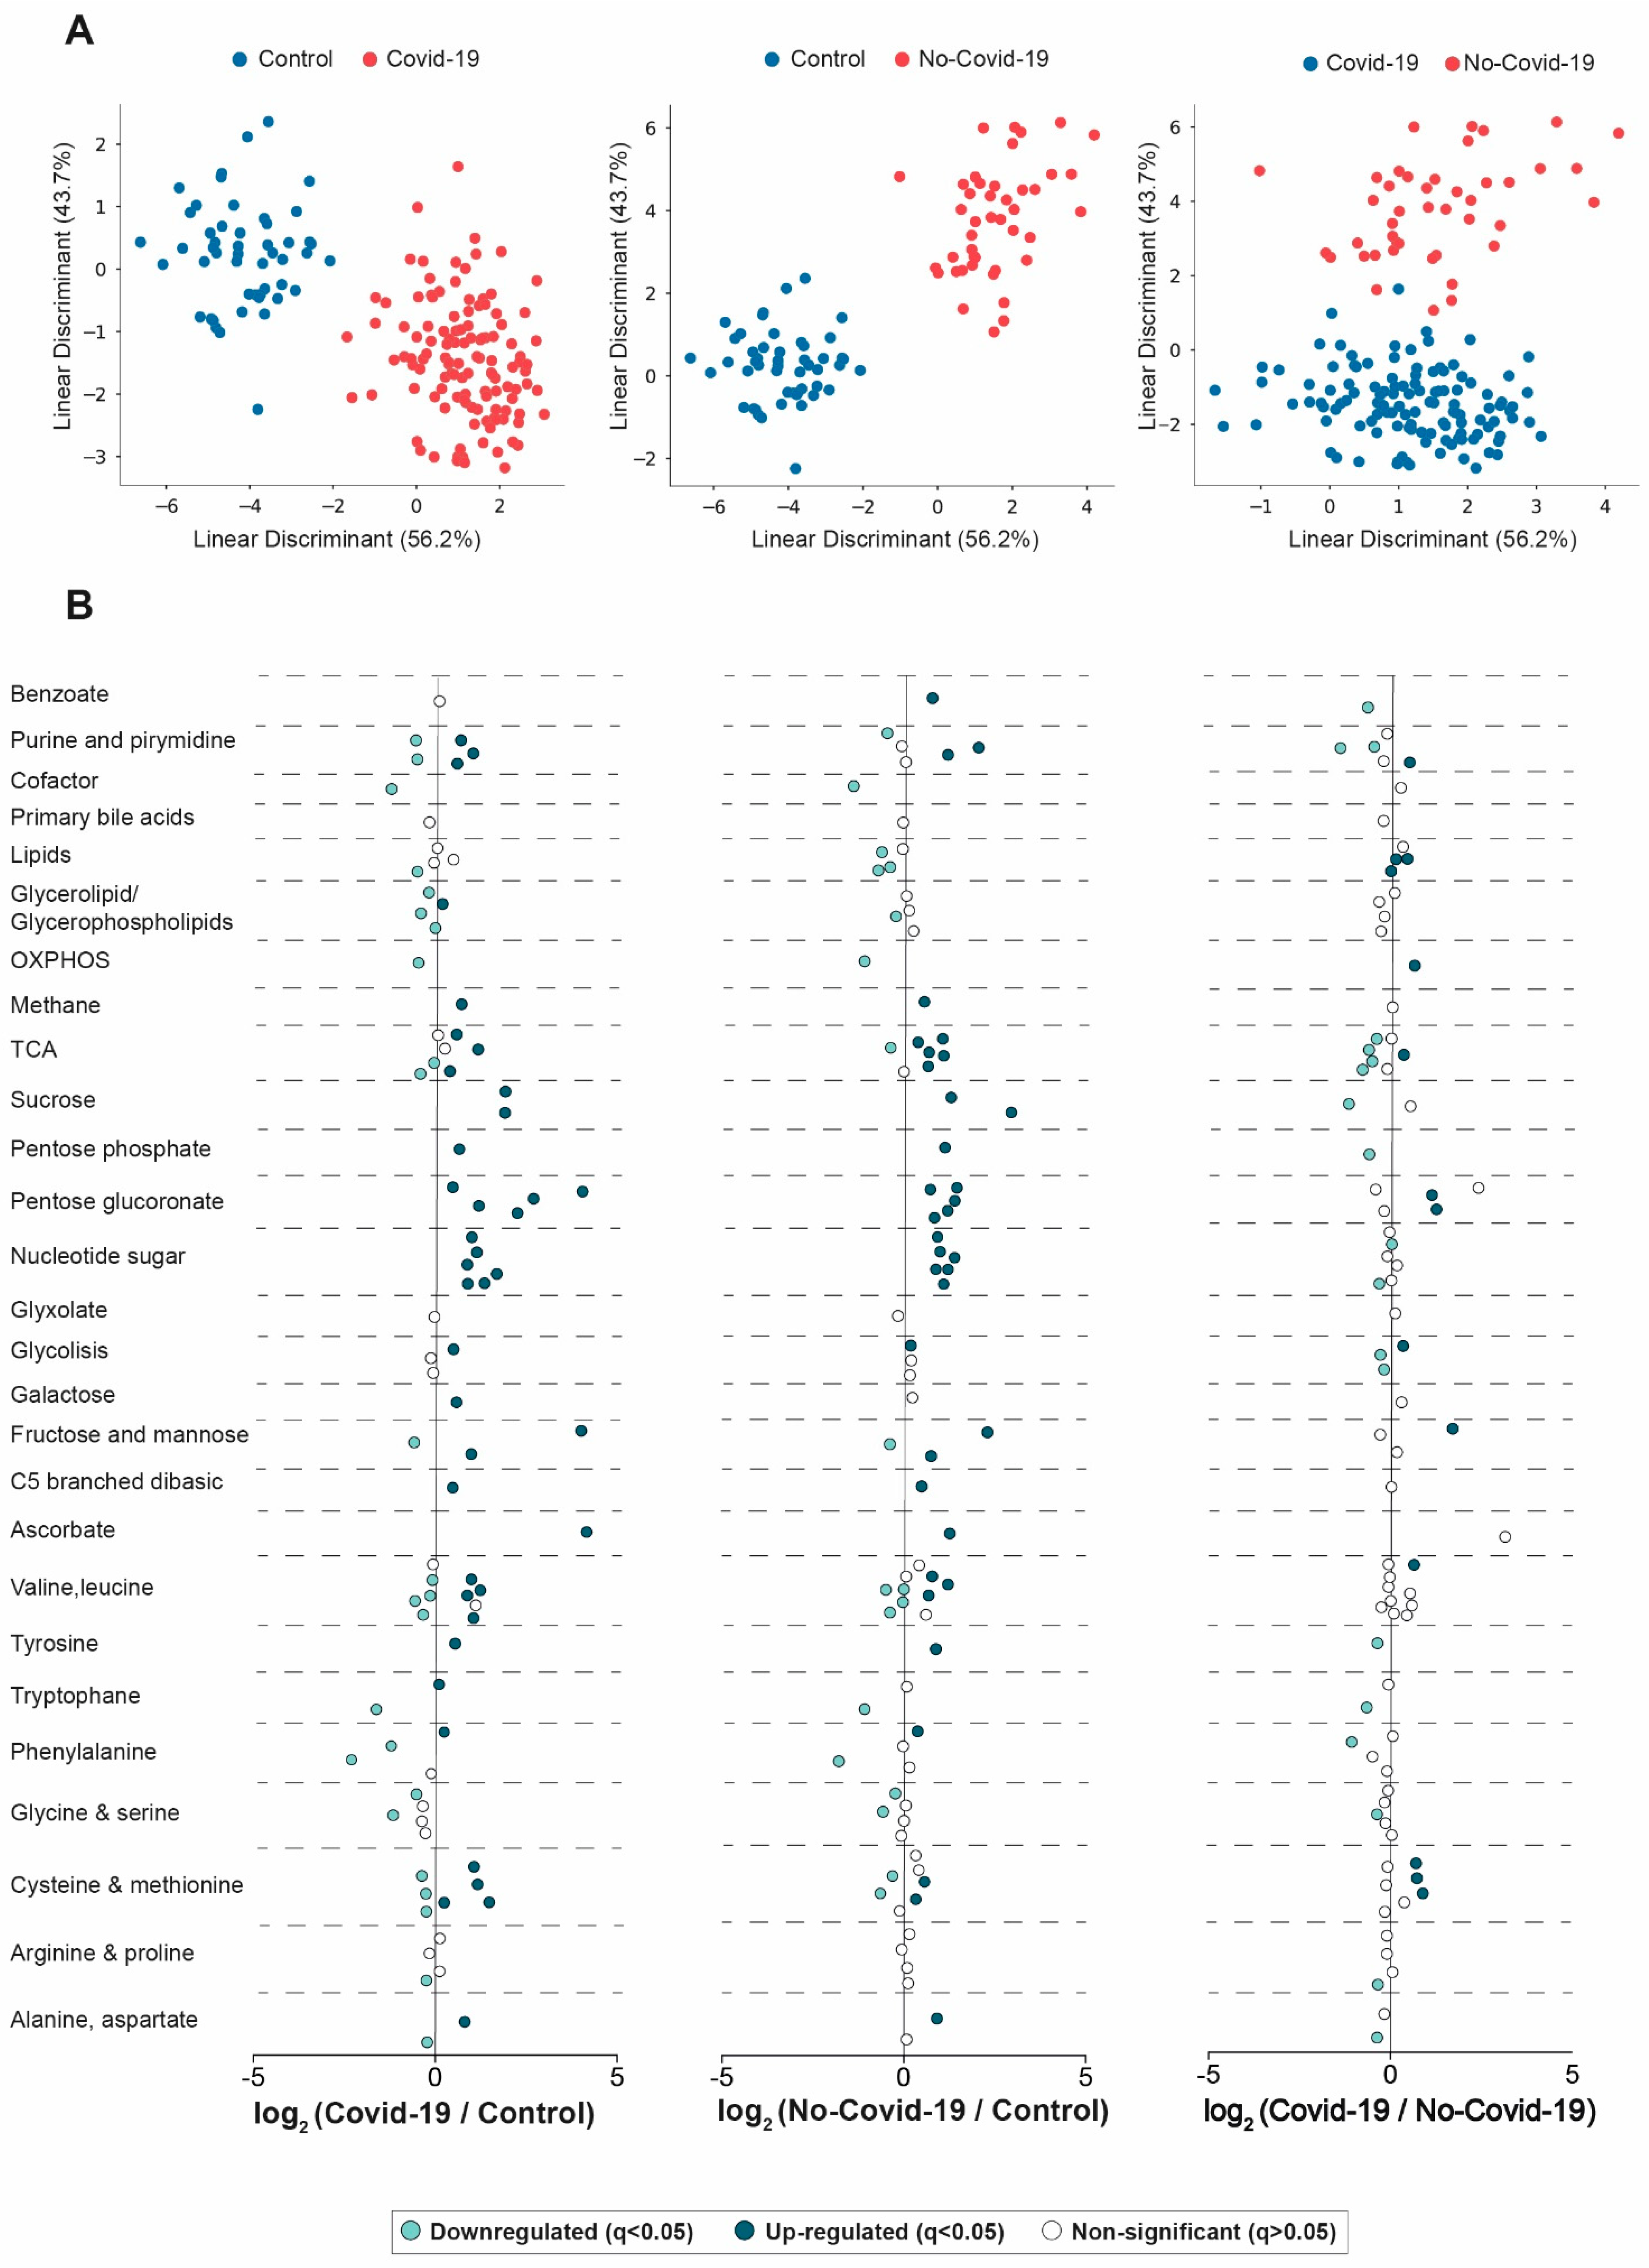
Abstract
:1. Introduction
2. Materials and Methods
2.1. Study Design and Participants
2.2. Targeted Metabolomics
2.3. Statistical Analyses
2.4. Dimensionality Reduction and Heatmap Analysis
2.5. Machine Learning Analysis
3. Results
3.1. Comparisons between the Serum Metabolic Signatures of the Different Groups of Participants
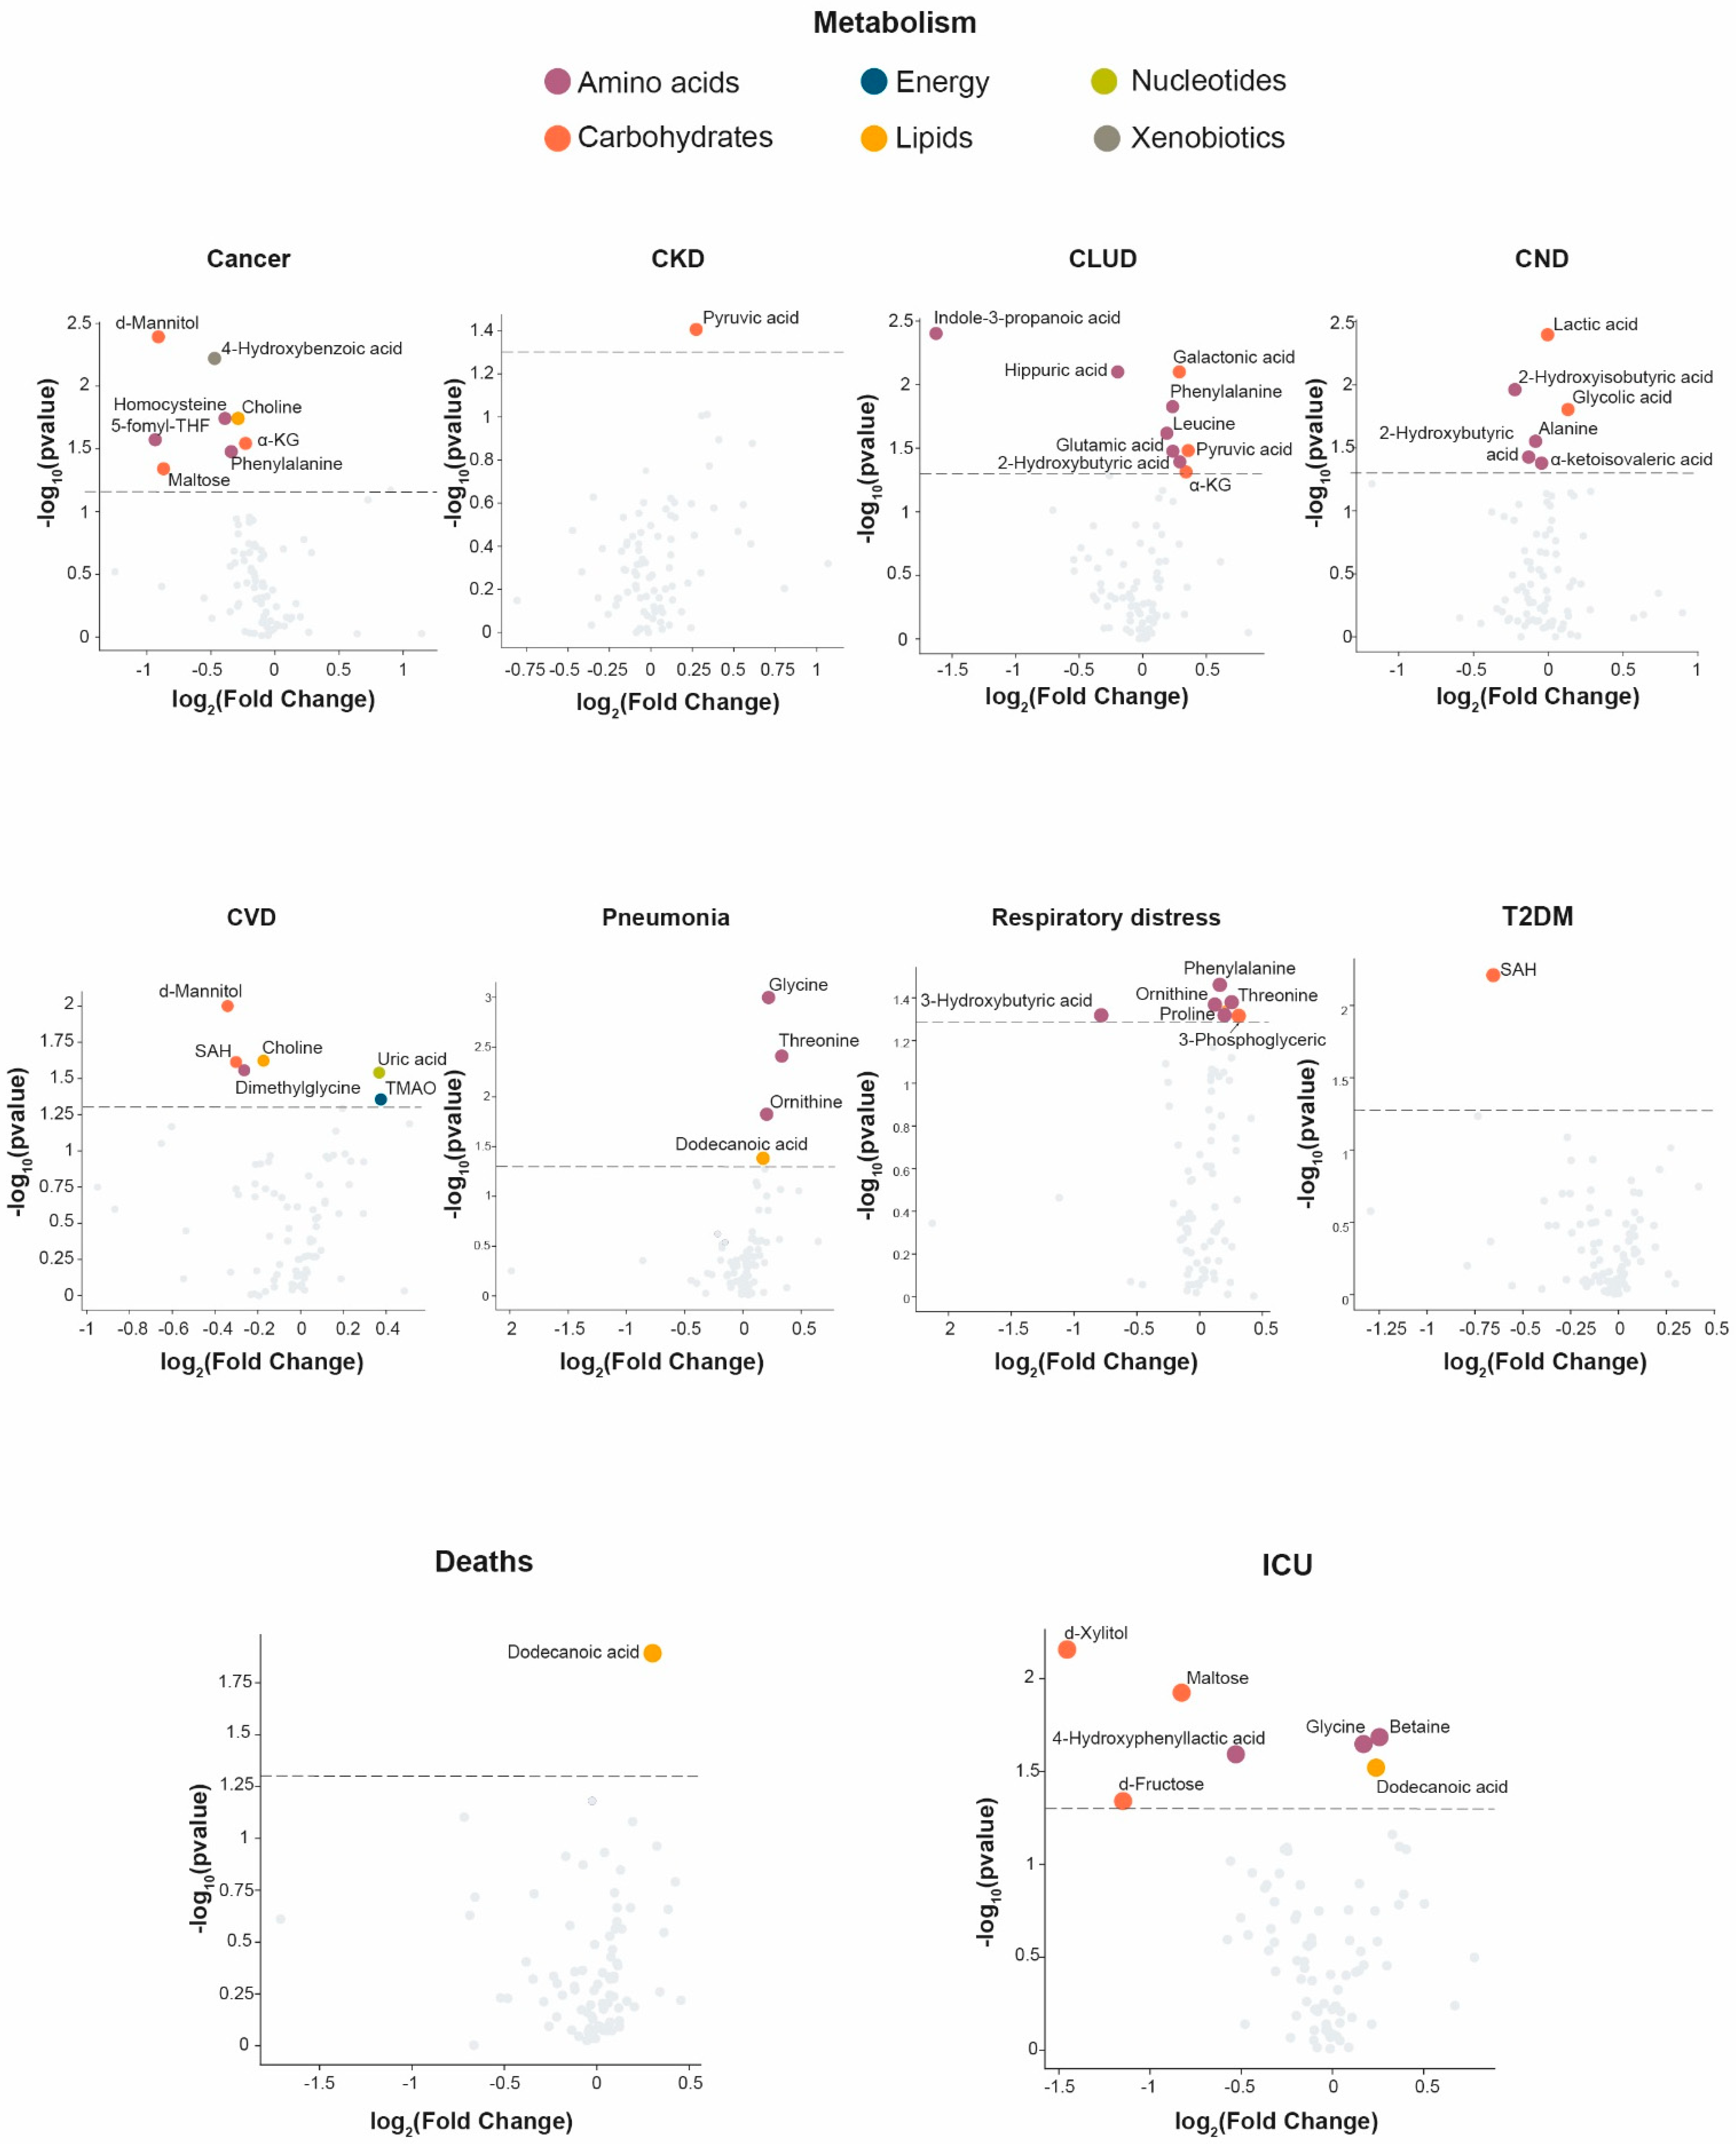
3.2. Clinical Characteristics Associated with Changes in the Serum Metabolome
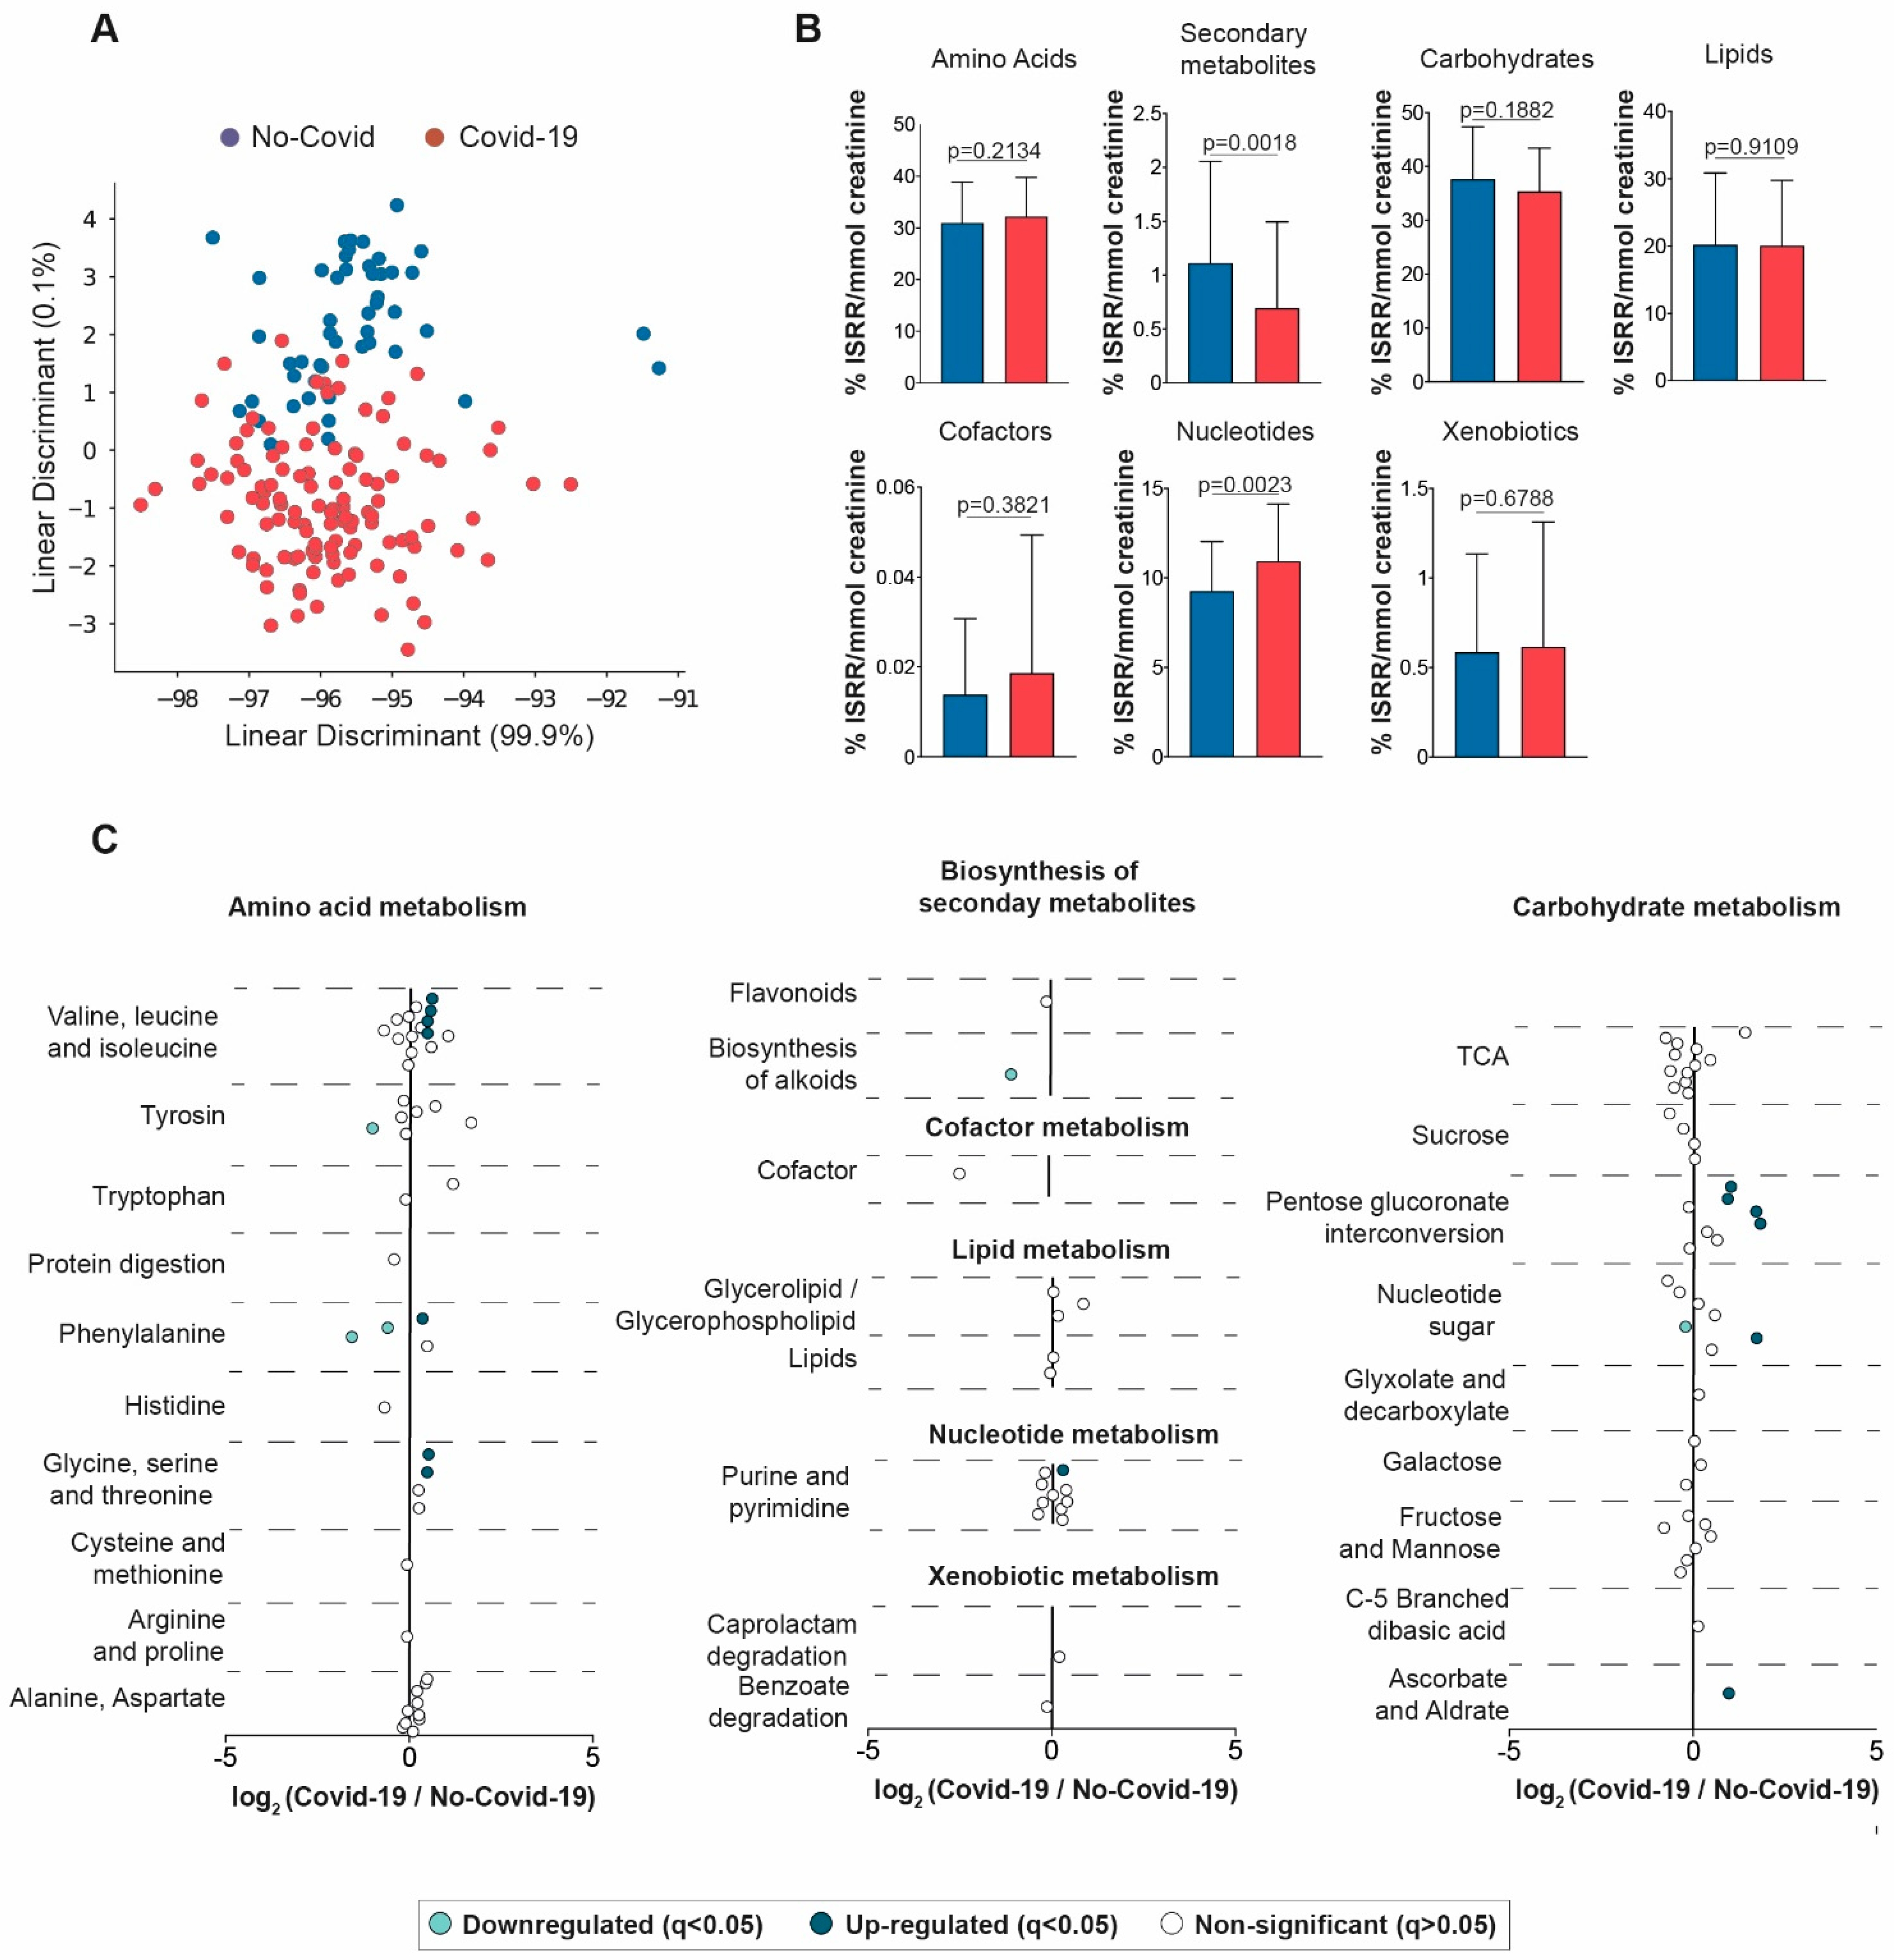
3.3. Comparisons between the Urine Metabolic Signatures of COVID-19-Positive and Negative Patients
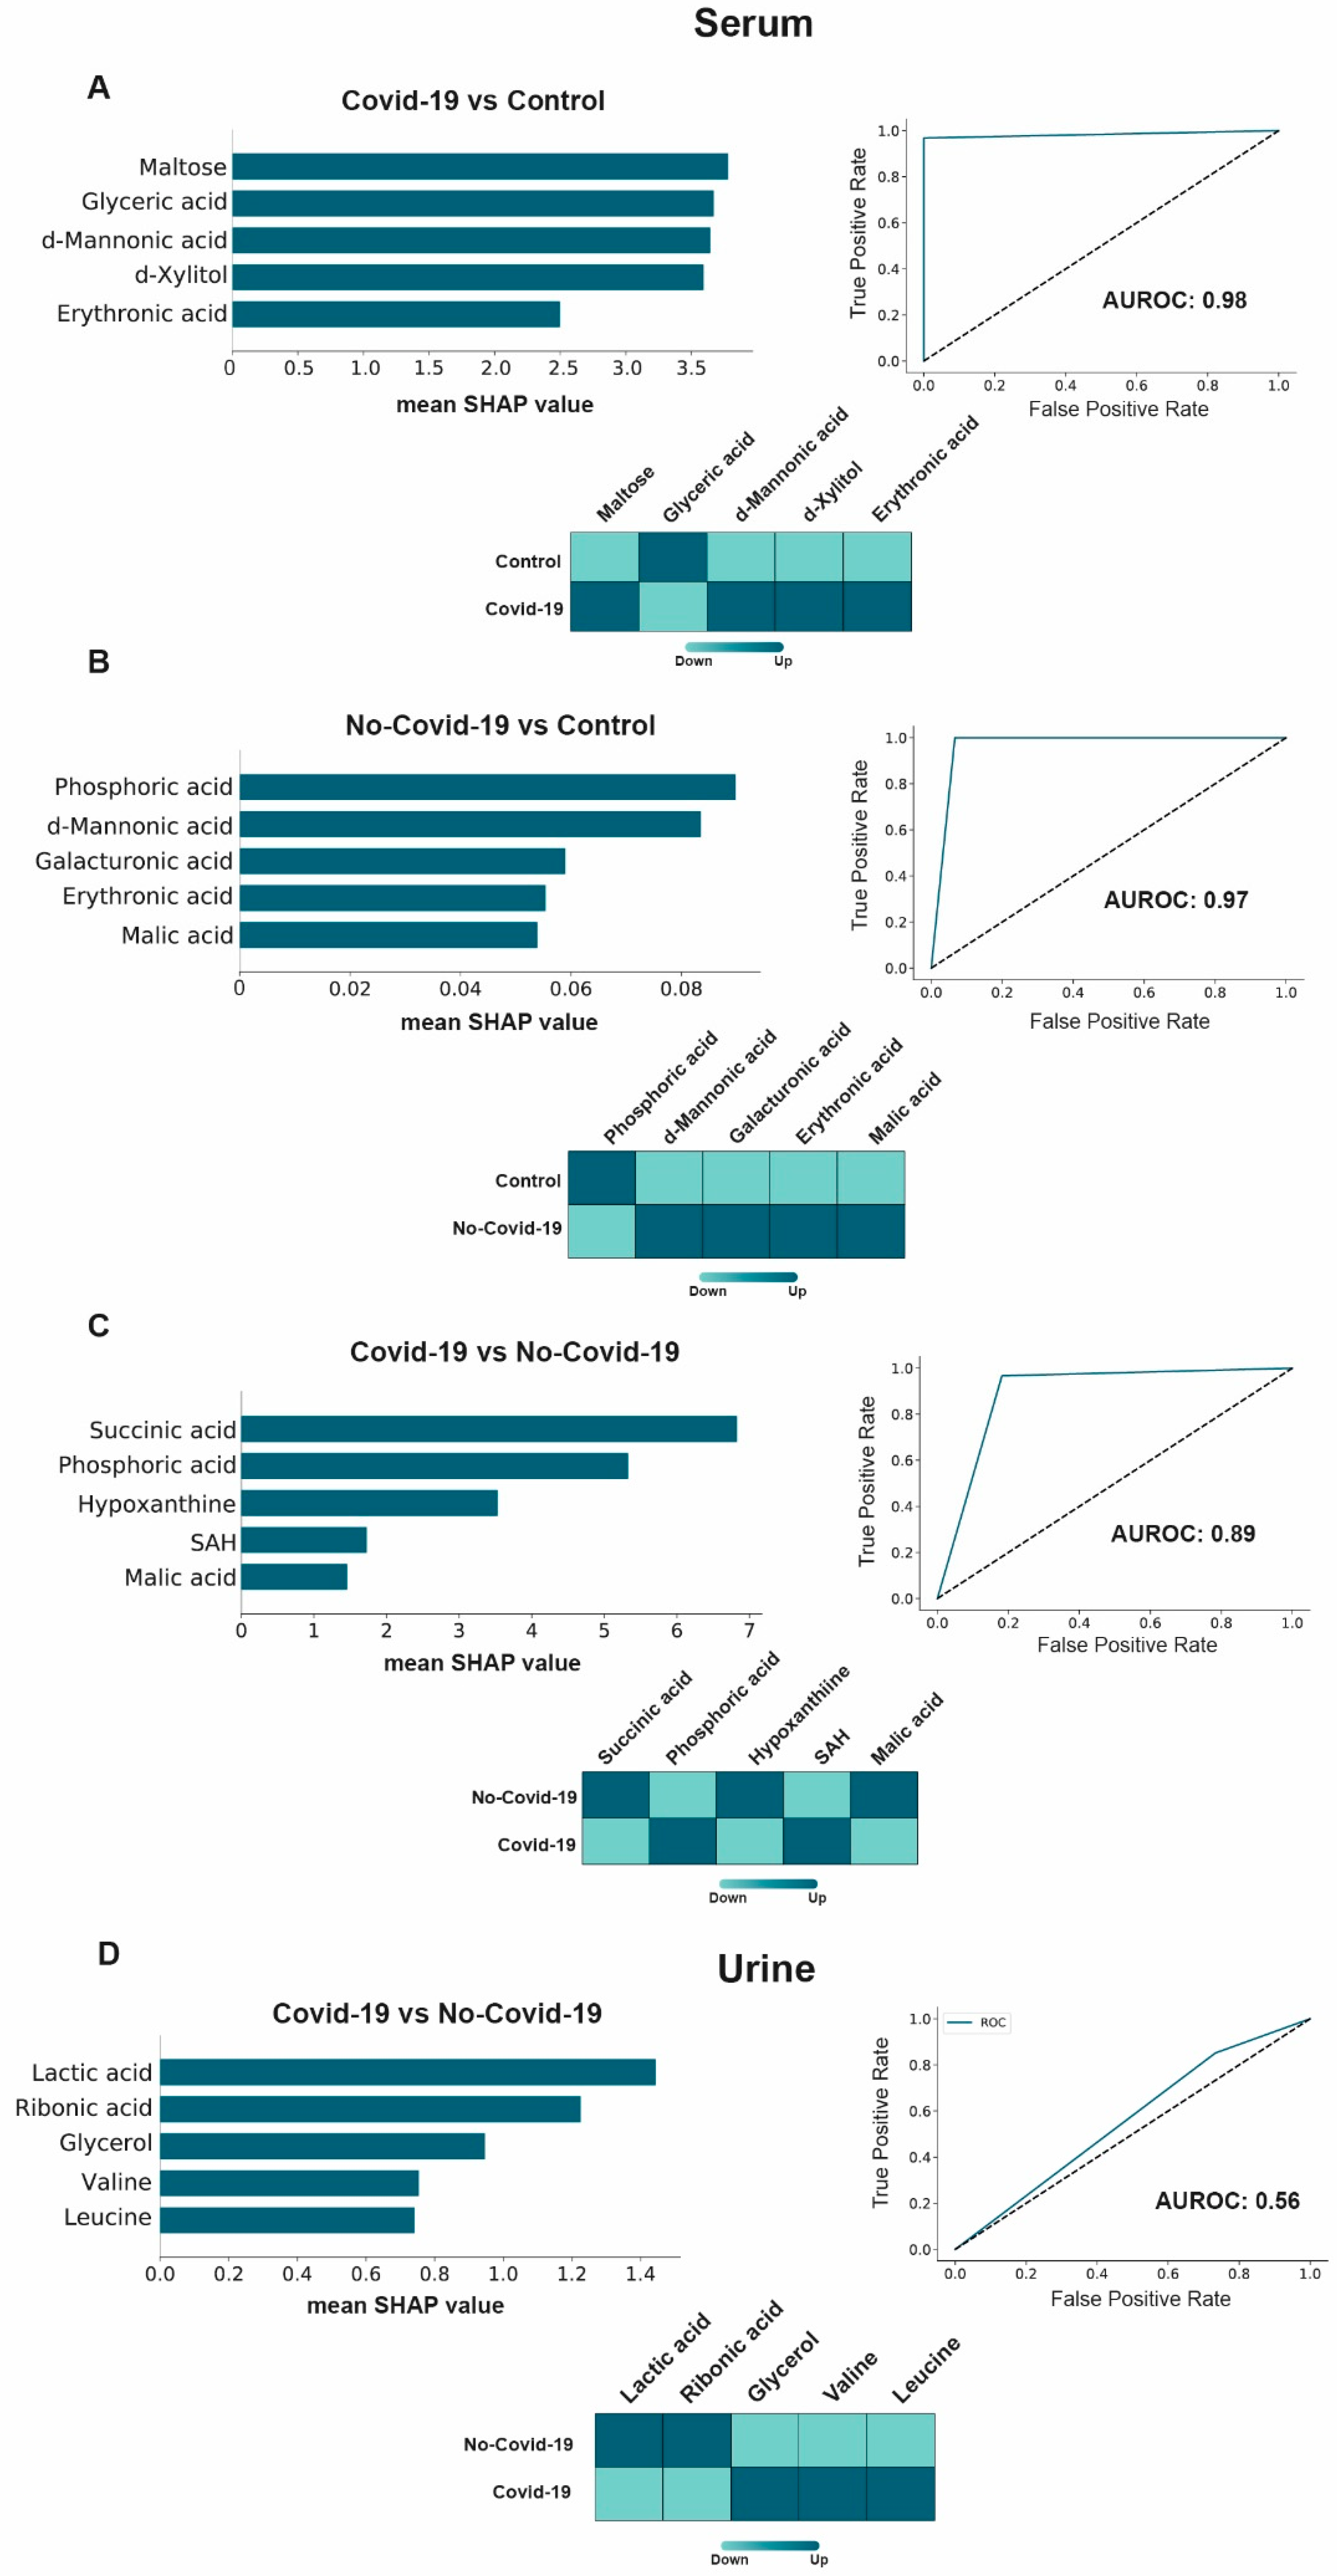
3.4. Machine Learning Potential Identified in COVID-19 Biomarkers in Serum, but Not in Urine
4. Discussion
5. Conclusions
Supplementary Materials
Author Contributions
Funding
Institutional Review Board Statement
Informed Consent Statement
Data Availability Statement
Acknowledgments
Conflicts of Interest
References
- Martins, M.; do Nascimento, G.M.; Nooruzzaman, M.; Yuan, F.; Chen, C.; Caserta, L.C.; Miller, A.D.; Whittaker, G.R.; Fang, Y.; Diel, D.G. The Omicron variant BA.1.1 presents a lower pathogenicity than B.1 D614G and delta variants in a feline model of SARS-CoV-2 infection. J. Virol. 2022, 96, e0096122. [Google Scholar] [CrossRef] [PubMed]
- Phillips, N. The coronavirus is here to stay—Here’s what that means. Nature 2021, 590, 382–384. [Google Scholar] [CrossRef] [PubMed]
- Camps, J.; Castañé, H.; Rodríguez-Tomàs, E.; Baiges-Gaya, G.; Hernández-Aguilera, A.; Arenas, M.; Iftimie, S.; Joven, J. On the role of paraoxonase-1 and chemokine ligand 2 (C-C motif) in metabolic alterations linked to inflammation and disease. A 2021 update. Biomolecules 2021, 11, 971. [Google Scholar] [CrossRef] [PubMed]
- Li, S.; Zhou, Y.; Yan, D.; Wan, Y. An update on the mutual impact between SARS-CoV-2 infection and gut microbiota. Viruses 2022, 14, 1774. [Google Scholar] [CrossRef] [PubMed]
- Wu, Q.; Zhou, L.; Sun, X.; Yan, Z.; Hu, C.; Wu, J.; Xu, L.; Li, X.; Liu, H.; Yin, P.; et al. Altered lipid metabolism in recovered SARS patients twelve years after infection. Sci. Rep. 2017, 7, 9110. [Google Scholar] [CrossRef] [Green Version]
- Byers, N.M.; Fleshman, A.C.; Perera, R.; Molins, C.R. Metabolomic insights into human arboviral infections: Dengue, Chikungunya, and Zika viruses. Viruses 2019, 11, 225. [Google Scholar] [CrossRef] [Green Version]
- Fujiogi, M.; Camargo, C.A., Jr.; Raita, Y.; Bochkov, Y.A.; Gern, J.E.; Mansbach, J.M.; Piedra, P.A.; Hasegawa, K. Respiratory viruses are associated with serum metabolome among infants hospitalized for bronchiolitis: A multicenter study. Pediatr. Allergy Immunol. 2020, 31, 755–766. [Google Scholar] [CrossRef]
- Liptak, P.; Baranovicova, E.; Rosolanka, R.; Simekova, K.; Bobcakova, A.; Vysehradsky, R.; Duricek, M.; Dankova, Z.; Kapinova, A.; Dvorska, D.; et al. Persistence of metabolomic changes in patients during post-COVID phase: A prospective, observational study. Metabolites 2022, 12, 641. [Google Scholar] [CrossRef]
- Iftimie, S.; López-Azcona, A.F.; Vicente-Miralles, M.; Descarrega-Reina, R.; Hernández-Aguilera, A.; Riu, F.; Simó, J.M.; Garrido, P.; Joven, J.; Camps, J.; et al. Risk factors associated with mortality in hospitalized patients with SARS-CoV-2 infection. A prospective, longitudinal, unicenter study in Reus, Spain. PLoS ONE 2020, 15, e0234452. [Google Scholar] [CrossRef]
- Iftimie, S.; López-Azcona, A.F.; Vallverdú, I.; Hernández-Flix, S.; de Febrer, G.; Parra, S.; Hernández-Aguilera, A.; Riu, F.; Joven, J.; Andreychuk, N.; et al. First and second waves of coronavirus disease-19: A comparative study in hospitalized patients in Reus, Spain. PLoS ONE 2021, 16, e0248029. [Google Scholar] [CrossRef]
- Castañé, H.; Baiges-Gaya, G.; Hernández-Aguilera, A.; Rodríguez-Tomàs, E.; Fernández- Arroyo, S.; Herrero, P.; Delpino-Rius, A.; Canela, N.; Menendez, J.A.; Camps, J.; et al. Coupling machine learning and lipidomics as a tool to investigate metabolic dysfunction-associated fatty liver disease. A general overview. Biomolecules 2021, 11, 473. [Google Scholar] [CrossRef]
- Ma, J.; Deng, Y.; Zhang, M.; Yu, J. The role of multi-omics in the diagnosis of COVID-19 and the prediction of new therapeutic targets. Virulence 2022, 13, 1101–1110. [Google Scholar] [CrossRef]
- Baros-Steyl, S.S.; Al Heialy, S.; Semreen, A.H.; Semreen, M.H.; Blackburn, J.M.; Soares, N.C. A review of mass spectrometry-based analyses to understand COVID-19 convalescent plasma mechanisms of action. Proteomics 2022, 22, e2200118. [Google Scholar] [CrossRef]
- Costanzo, M.; Caterino, M.; Fedele, R.; Cevenini, A.; Pontillo, M.; Barra, L.; Ruoppolo, M. COVIDomics: The proteomic and metabolomic signatures of COVID-19. Int. J. Mol. Sci. 2022, 23, 2414. [Google Scholar] [CrossRef]
- Castañé, H.; Iftimie, S.; Baiges-Gaya, G.; Rodríguez-Tomàs, E.; Jiménez-Franco, A.; López-Azcona, A.F.; Garrido, P.; Castro, A.; Camps, J.; Joven, J. Machine learning and semi-targeted lipidomics identify distinct serum lipid signatures in hospitalized COVID-19-positive and COVID-19-negative patients. Metabolism 2022, 131, 155197. [Google Scholar] [CrossRef]
- Iftimie, S.; García-Heredia, A.; Pujol, I.; Ballester, F.; Fort-Gallifa, I.; Simó, J.M.; Joven, J.; Camps, J.; Castro, A. Preliminary study on serum paraoxonase-1 status and chemokine (C-C motif) ligand 2 in hospitalized elderly patients with catheter-associated asymptomatic bacteriuria. Eur. J. Clin. Microbiol. Infect. Dis. 2016, 35, 1417–1424. [Google Scholar] [CrossRef]
- Fort-Gallifa, I.; García-Heredia, A.; Hernández-Aguilera, A.; Simó, J.M.; Sepúlveda, J.; Martín-Paredero, V.; Camps, J.; Joven, J. Biochemical indices of oxidative stress and inflammation in the evaluation of peripheral artery disease. Free Radic. Biol. Med. 2016, 97, 568–576. [Google Scholar] [CrossRef]
- Kreger, B.E.; Craven, D.E.; Carling, P.C.; McCabe, W.R. Gram-negative bacteremia. III. Reassessment of etiology, epidemiology and ecology in 612 patients. Am. J. Med. 1980, 68, 332–343. [Google Scholar] [CrossRef]
- Berkman, L.F.; Leo-Summers, L.; Horwitz, R.I. Emotional support and survival after myocardial infarction. A prospective, population-based study of the elderly. Ann. Intern. Med. 1992, 117, 1003–1009. [Google Scholar] [CrossRef] [Green Version]
- Riera-Borrull, M.; Rodríguez-Gallego, E.; Hernández-Aguilera, A.; Luciano, F.; Ras, R.; Cuyàs, E.; Camps, J.; Segura-Carretero, A.; Menendez, J.A.; Joven, J.; et al. Exploring the process of energy generation in pathophysiology by targeted metabolomics: Performance of a simple and quantitative method. J. Am. Soc. Mass Spectrom. 2016, 27, 168–177. [Google Scholar] [CrossRef]
- Abraham, A.; Pedregosa, F.; Eickenberg, M.; Gervais, P.; Mueller, A.; Kossaifi, J.; Gramfort, A.; Thirion, B.; Varoquaux, G. Machine learning for neuroimaging with scikit-learn. Front. Neuroinform. 2014, 8, 14. [Google Scholar] [CrossRef] [PubMed] [Green Version]
- Lundberg, S.; Lee, S.I. A unified approach to interpreting model predictions. arXiv 2017, arXiv:170.07874. [Google Scholar]
- Fahrmann, J.F.; Grapov, D.D.; Wanichthanarak, K.; DeFelice, B.C.; Salemi, M.R.; Rom, W.N.; Gandara, D.R.; Phinney, B.S.; Fiehn, O.; Pass, H.; et al. Integrated metabolomics and proteomics highlight altered nicotinamide- and polyamine pathways in lung adenocarcinoma. Carcinogenesis 2017, 38, 271–280. [Google Scholar] [CrossRef] [PubMed] [Green Version]
- Li, Y.; Zhang, D.; Gao, X.; Wang, X.; Zhang, L. 2’- and 3’-ribose modifications of nucleotide analogues establish the structural basis to inhibit the viral replication of SARS-CoV-2. J. Phys. Chem. Lett 2022, 13, 4111–4118. [Google Scholar] [CrossRef] [PubMed]
- Guo, X.; Wu, S.; Li, N.; Lin, Q.; Liu, L.; Liang, H.; Niu, Y.; Huang, Z.; Fu, X. Accelerated metabolite levels of aerobic glycolysis and the pentose phosphate pathway are required for efficient replication of infectious spleen and kidney necrosis virus in Chinese perch brain cells. Biomolecules 2019, 9, 440. [Google Scholar] [CrossRef] [Green Version]
- Sen, S.; Kaminiski, R.; Deshmane, S.; Langford, D.; Khalili, K.; Amini, S.; Datta, P.K. Role of hexokinase-1 in the survival of HIV-1-infected macrophages. Cell Cycle 2015, 14, 980–989. [Google Scholar] [CrossRef] [Green Version]
- Stincone, A.; Prigione, A.; Cramer, T.; Wamelink, M.M.C.; Campbell, K.; Cheung, E.; Olin-Sandoval, V.; Grüning, N.-M.; Krüger, A.; Alam, M.T.; et al. The return of metabolism: Biochemistry and physiology of the pentose phosphate pathway. Biol. Rev. Camb. Philos. Soc. 2015, 90, 927–963. [Google Scholar] [CrossRef] [Green Version]
- Chen, I.T.; Aoki, T.; Huang, Y.T.; Hirono, I.; Chen, T.C.; Huang, J.Y. White spot Syndrome virus induces metabolic changes resembling the Warburg effect in shrimp hemocytes in the early stage of infection. J. Virol. 2011, 85, 12919–12928. [Google Scholar] [CrossRef] [Green Version]
- Pérez-Torres, I.; Soto, M.E.; Guarner-Lans, V.; Manzano-Pech, L.; Soria-Castro, E. The possible role of glucose-6-phosphate dehydrogenase in the SARS-CoV-2 infection. Cells 2022, 11, 1982. [Google Scholar] [CrossRef]
- Bojkova, D.; Costa, R.; Reus, P.; Bechtel, M.; Jaboreck, M.C.; Olmer, R.; Martin, U.; Ciesek, S.; Michaelis, M.; Cinatl, J., Jr. Targeting the pentose phosphate pathway for SARS-CoV-2 therapy. Metabolites 2021, 11, 699. [Google Scholar] [CrossRef]
- Sun, H.; Zhang, A.H.; Song, Q.; Fang, H.; Liu, X.Y.; Su, J.; Yang, L.; Yu, M.D.; Wang, X.J. Functional metabolomics discover pentose and glucuronate interconversion pathways as promising targets for Yang Huang syndrome treatment with Yinchenhao Tang. RSC Adv. 2018, 8, 36831–36839. [Google Scholar] [CrossRef]
- Chen, S.; Niu, C.; Lv, W. Multi-omics insights reveal the remodeling of gut mycobiome with P. gingivalis. Front. Cell. Infect. Microbiol. 2022, 12, 937725. [Google Scholar] [CrossRef]
- Lu, X.; Liu, T.; Zhou, J.; Liu, J.; Yuan, Z.; Guo, L. Subgingival microbiome in periodontitis and type 2 diabetes mellitus: An exploratory study using metagenomic sequencing. J. Periodontal Implant. Sci. 2022, 52, 282–297. [Google Scholar] [CrossRef]
- Xiong, H.; Li, N.; Zhao, L.; Li, Z.; Yu, Y.; Cui, X.; Liu, Q.; Zhao, C. Integrated serum pharmacochemistry, metabolomics, and network pharmacology to reveal the material basis and mechanism of Danggui Shaoyao San in the treatment of primary dysmenorrhea. Front. Pharmacol. 2022, 13, 942955. [Google Scholar] [CrossRef]
- Wu, Y.; Li, K.; Zeng, M.; Qiao, B.; Zhou, B. Serum metabolomics analysis of the anti-inflammatory effects of gallic acid on rats with acute inflammation. Front. Pharmacol. 2022, 13, 830439. [Google Scholar] [CrossRef]
- Isaacs, C.E.; Kim, K.S.; Thormar, H. Inactivation of enveloped viruses in human bodily fluids by purified lipids. Ann. N. Y. Acad. Sci. 1994, 724, 457–464. [Google Scholar] [CrossRef]
- Nefedova, E.; Koptev, V.; Bobikova, A.S.; Cherepushkina, V.; Mironova, T.; Afonyushkin, V.; Shkil, N.; Donchenko, N.; Kozlova, Y.; Sigareva, N.; et al. The infectious bronchitis coronavirus pneumonia model presenting a novel insight for the SARS-CoV-2 dissemination route. Vet. Sci. 2021, 8, 239. [Google Scholar] [CrossRef]
- Thormar, H.; Isaacs, C.E.; Brown, H.R.; Barshatzky, M.R.; Pessolano, T. Inactivation of enveloped viruses and killing of cells by fatty acids and monoglycerides. Antimicrob. Agents Chemother. 1987, 31, 27–31. [Google Scholar] [CrossRef] [Green Version]
- Cheudjeu, A. Correlation of D-xylose with severity and morbidity-related factors of COVID-19 and possible therapeutic use of D-xylose and antibiotics for COVID-19. Life Sci. 2020, 260, 118335. [Google Scholar] [CrossRef]
- Ferreira, A.S.; Ad Souza, M.; Raposo, N.R.B.; Ferreira, A.P.; Silva, S.S. Xylitol inhibits J774A.1 macrophage adhesion in vitro. Braz. Arch. Biol. Technol. 2011, 54, 1211–1216. [Google Scholar] [CrossRef] [Green Version]
- Xu, M.L.; Wi, G.; Kim, H.J.; Kim, H.J. Ameliorating effect of dietary xylitol on human respiratory syncytial virus (hRSV) infection. Biol. Pharm. Bull. 2016, 39, 540–546. [Google Scholar] [CrossRef] [PubMed]
- Yin, S.Y.; Kim, H.J.; Kim, H.J. Protective effect of dietary xylitol on influenza A virus infection. PLoS ONE 2014, 9, e84633. [Google Scholar] [CrossRef] [PubMed] [Green Version]
- Anand, S.; Mande, S.S. Diet, microbiota and gut-lung connection. Front. Microbiol. 2018, 9, 2147. [Google Scholar] [CrossRef] [PubMed] [Green Version]
- Shukla, S.D.; Budden, K.F.; Neal, R.; Hansbro, P.M. Microbiome effects on immunity, health and disease in the lung. Clin. Transl. Immunol. 2017, 6, e133. [Google Scholar] [CrossRef] [PubMed]
- Russell, S.L.; Gold, M.J.; Willing, B.P.; Thorson, L.; Mcnagny, K.M.; Finlay, B.B. Perinatal antibiotic treatment affects murine microbiota, immune responses and allergic asthma. Gut Microbes 2013, 4, 158–164. [Google Scholar] [CrossRef]
- Looft, T.; Allen, H.K. Collateral effects of antibiotics on mammalian gut microbiomes. Gut Microbes 2012, 3, 463–467. [Google Scholar] [CrossRef]
- Xie, J.; Cho, H.; Lin, B.M.; Pillai, M.; Heimisdottir, L.H.; Bandyopadhyay, D.; Zou, F.; Roach, J.; Divaris, K.; Wu, D. Improved metabolite prediction using microbiome data-based elastic net models. Front. Cell. Infect. Microbiol. 2021, 11, 734416. [Google Scholar] [CrossRef]
- Wan, J.; Zhang, Y.; He, W.; Tian, Z.; Lin, J.; Liu, Z.; Li, Y.; Chen, M.; Han, S.; Liang, J.; et al. Gut microbiota and metabolite changes in patients with ulcerative colitis and Clostridioides difficile infection. Front. Microbiol. 2022, 13, 802823. [Google Scholar] [CrossRef]
- Colonetti, K.; de Carvalho, E.L.; Rangel, D.L.; Pinto, P.M.; Roesch, L.F.W.; Pinheiro, F.C.; Schwartz, I.V.D. Are the bacteria and their metabolites contributing for gut inflammation on GSD-Ia patients? Metabolites 2022, 12, 873. [Google Scholar] [CrossRef]
- Liu, A.; Ma, T.; Xu, N.; Jin, H.; Zhao, F.; Kwok, L.Y.; Zhang, H.; Zhang, S.; Sun, Z. Adjunctive probiotics alleviates asthmatic symptoms via modulating the gut microbiome and serum metabolome. Microbiol. Spectr. 2021, 9, e0085921. [Google Scholar] [CrossRef]
- Tong, W.; Hannou, S.A.; Wang, Y.; Astapova, I.; Sargsyan, A.; Monn, R.; Thiriveedi, V.; Li, D.; McCann, J.R.; Rawls, J.F.; et al. The intestine is a major contributor to circulating succinate in mice. FASEB J. 2022, 36, e22546. [Google Scholar] [CrossRef]
- Nagata, N.; Takeuchi, T.; Masuoka, H.; Aoki, R.; Ishikane, M.; Iwamoto, N.; Sugiyama, M.; Suda, W.; Nakanishi, Y.; Terada-Hirashima, J.; et al. Human gut microbiota and its metabolites impact immune responses in COVID-19 and its complications. Gastroenterology 2022, in press. [Google Scholar] [CrossRef]
- Liao, J.; Li, Q.; Lei, C.; Yu, W.; Deng, J.; Guo, J.; Han, Q.; Hu, L.; Li, Y.; Pan, J.; et al. Toxic effects of copper on the jejunum and colon of pigs: Mechanisms related to gut barrier dysfunction and inflammation influenced by the gut microbiota. Food Funct. 2021, 12, 9642–9657. [Google Scholar] [CrossRef]
- Yu, W.; Shang, J.; Guo, R.; Zhang, F.; Zhang, W.; Zhang, Y.; Wu, F.; Ren, H.; Liu, C.; Xiao, J.; et al. The gut microbiome in differential diagnosis of diabetic kidney disease and membranous nephropathy. Ren. Fail. 2020, 42, 1100–1110. [Google Scholar] [CrossRef]
- Yin, J.; Li, Y.; Han, H.; Liu, Z.; Zeng, X.; Li, T.; Yin, Y. Long-term effects of lysine concentration on growth performance, intestinal microbiome, and metabolic profiles in a pig model. Food Funct. 2018, 9, 4153–4163. [Google Scholar] [CrossRef]
- Zhou, J.; Zhong, L. Applications of liquid chromatography-mass spectrometry based metabolomics in predictive and personalized medicine. Front. Mol. Biosci. 2022, 9, 1049016. [Google Scholar] [CrossRef]
- Su, Y.; Chen, D.; Yuan, D.; Lausted, C.; Choi, J.; Dai, C.L.; Voillet, V.; Duvvuri, V.R.; Scherler, K.; Troisch, P.; et al. Multi-omics resolves a sharp disease-state shift between mild and moderate COVID-19. Cell 2020, 183, 1479–1495. [Google Scholar] [CrossRef]
- Song, J.W.; Lam, S.M.; Fan, X.; Cao, W.J.; Wang, S.Y.; Tian, H.; Chua, G.H.; Zhang, C.; Meng, F.P.; Xu, Z.; et al. Omics-driven systems interrogation of metabolic dysregulation in COVID-19 pathogenesis. Cell Metab 2020, 32, 188–202.e5. [Google Scholar] [CrossRef]
- Sindelar, M.; Stancliffe, E.; Schwaiger-Haber, M.; Anbukumar, D.S.; Adkins-Travis, K.; Goss, C.W.; O’Halloran, J.A.; Mudd, P.A.; Liu, W.C.; Albrecht, R.A.; et al. Longitudinal metabolomics of human plasma reveals prognostic markers of COVID-19 disease severity. Cell Rep. Med. 2021, 2, 100369. [Google Scholar] [CrossRef]
- Wu, P.; Chen, D.; Ding, W.; Wu, P.; Hou, H.; Bai, Y.; Zhou, Y.; Li, K.; Xiang, S.; Liu, P.; et al. The trans-omics landscape of COVID-19. Nat. Commun. 2021, 12, 4543. [Google Scholar] [CrossRef]


Disclaimer/Publisher’s Note: The statements, opinions and data contained in all publications are solely those of the individual author(s) and contributor(s) and not of MDPI and/or the editor(s). MDPI and/or the editor(s) disclaim responsibility for any injury to people or property resulting from any ideas, methods, instructions or products referred to in the content. |
© 2023 by the authors. Licensee MDPI, Basel, Switzerland. This article is an open access article distributed under the terms and conditions of the Creative Commons Attribution (CC BY) license (https://creativecommons.org/licenses/by/4.0/).
Share and Cite
Baiges-Gaya, G.; Iftimie, S.; Castañé, H.; Rodríguez-Tomàs, E.; Jiménez-Franco, A.; López-Azcona, A.F.; Castro, A.; Camps, J.; Joven, J. Combining Semi-Targeted Metabolomics and Machine Learning to Identify Metabolic Alterations in the Serum and Urine of Hospitalized Patients with COVID-19. Biomolecules 2023, 13, 163. https://doi.org/10.3390/biom13010163
Baiges-Gaya G, Iftimie S, Castañé H, Rodríguez-Tomàs E, Jiménez-Franco A, López-Azcona AF, Castro A, Camps J, Joven J. Combining Semi-Targeted Metabolomics and Machine Learning to Identify Metabolic Alterations in the Serum and Urine of Hospitalized Patients with COVID-19. Biomolecules. 2023; 13(1):163. https://doi.org/10.3390/biom13010163
Chicago/Turabian StyleBaiges-Gaya, Gerard, Simona Iftimie, Helena Castañé, Elisabet Rodríguez-Tomàs, Andrea Jiménez-Franco, Ana F. López-Azcona, Antoni Castro, Jordi Camps, and Jorge Joven. 2023. "Combining Semi-Targeted Metabolomics and Machine Learning to Identify Metabolic Alterations in the Serum and Urine of Hospitalized Patients with COVID-19" Biomolecules 13, no. 1: 163. https://doi.org/10.3390/biom13010163