
Epithelial Cell Line Derived from Endometriotic Lesion Mimics Macrophage Nervous Mechanism of Pain Generation on Proteome and Metabolome Levels

 , , ,
, , ,  , , , and
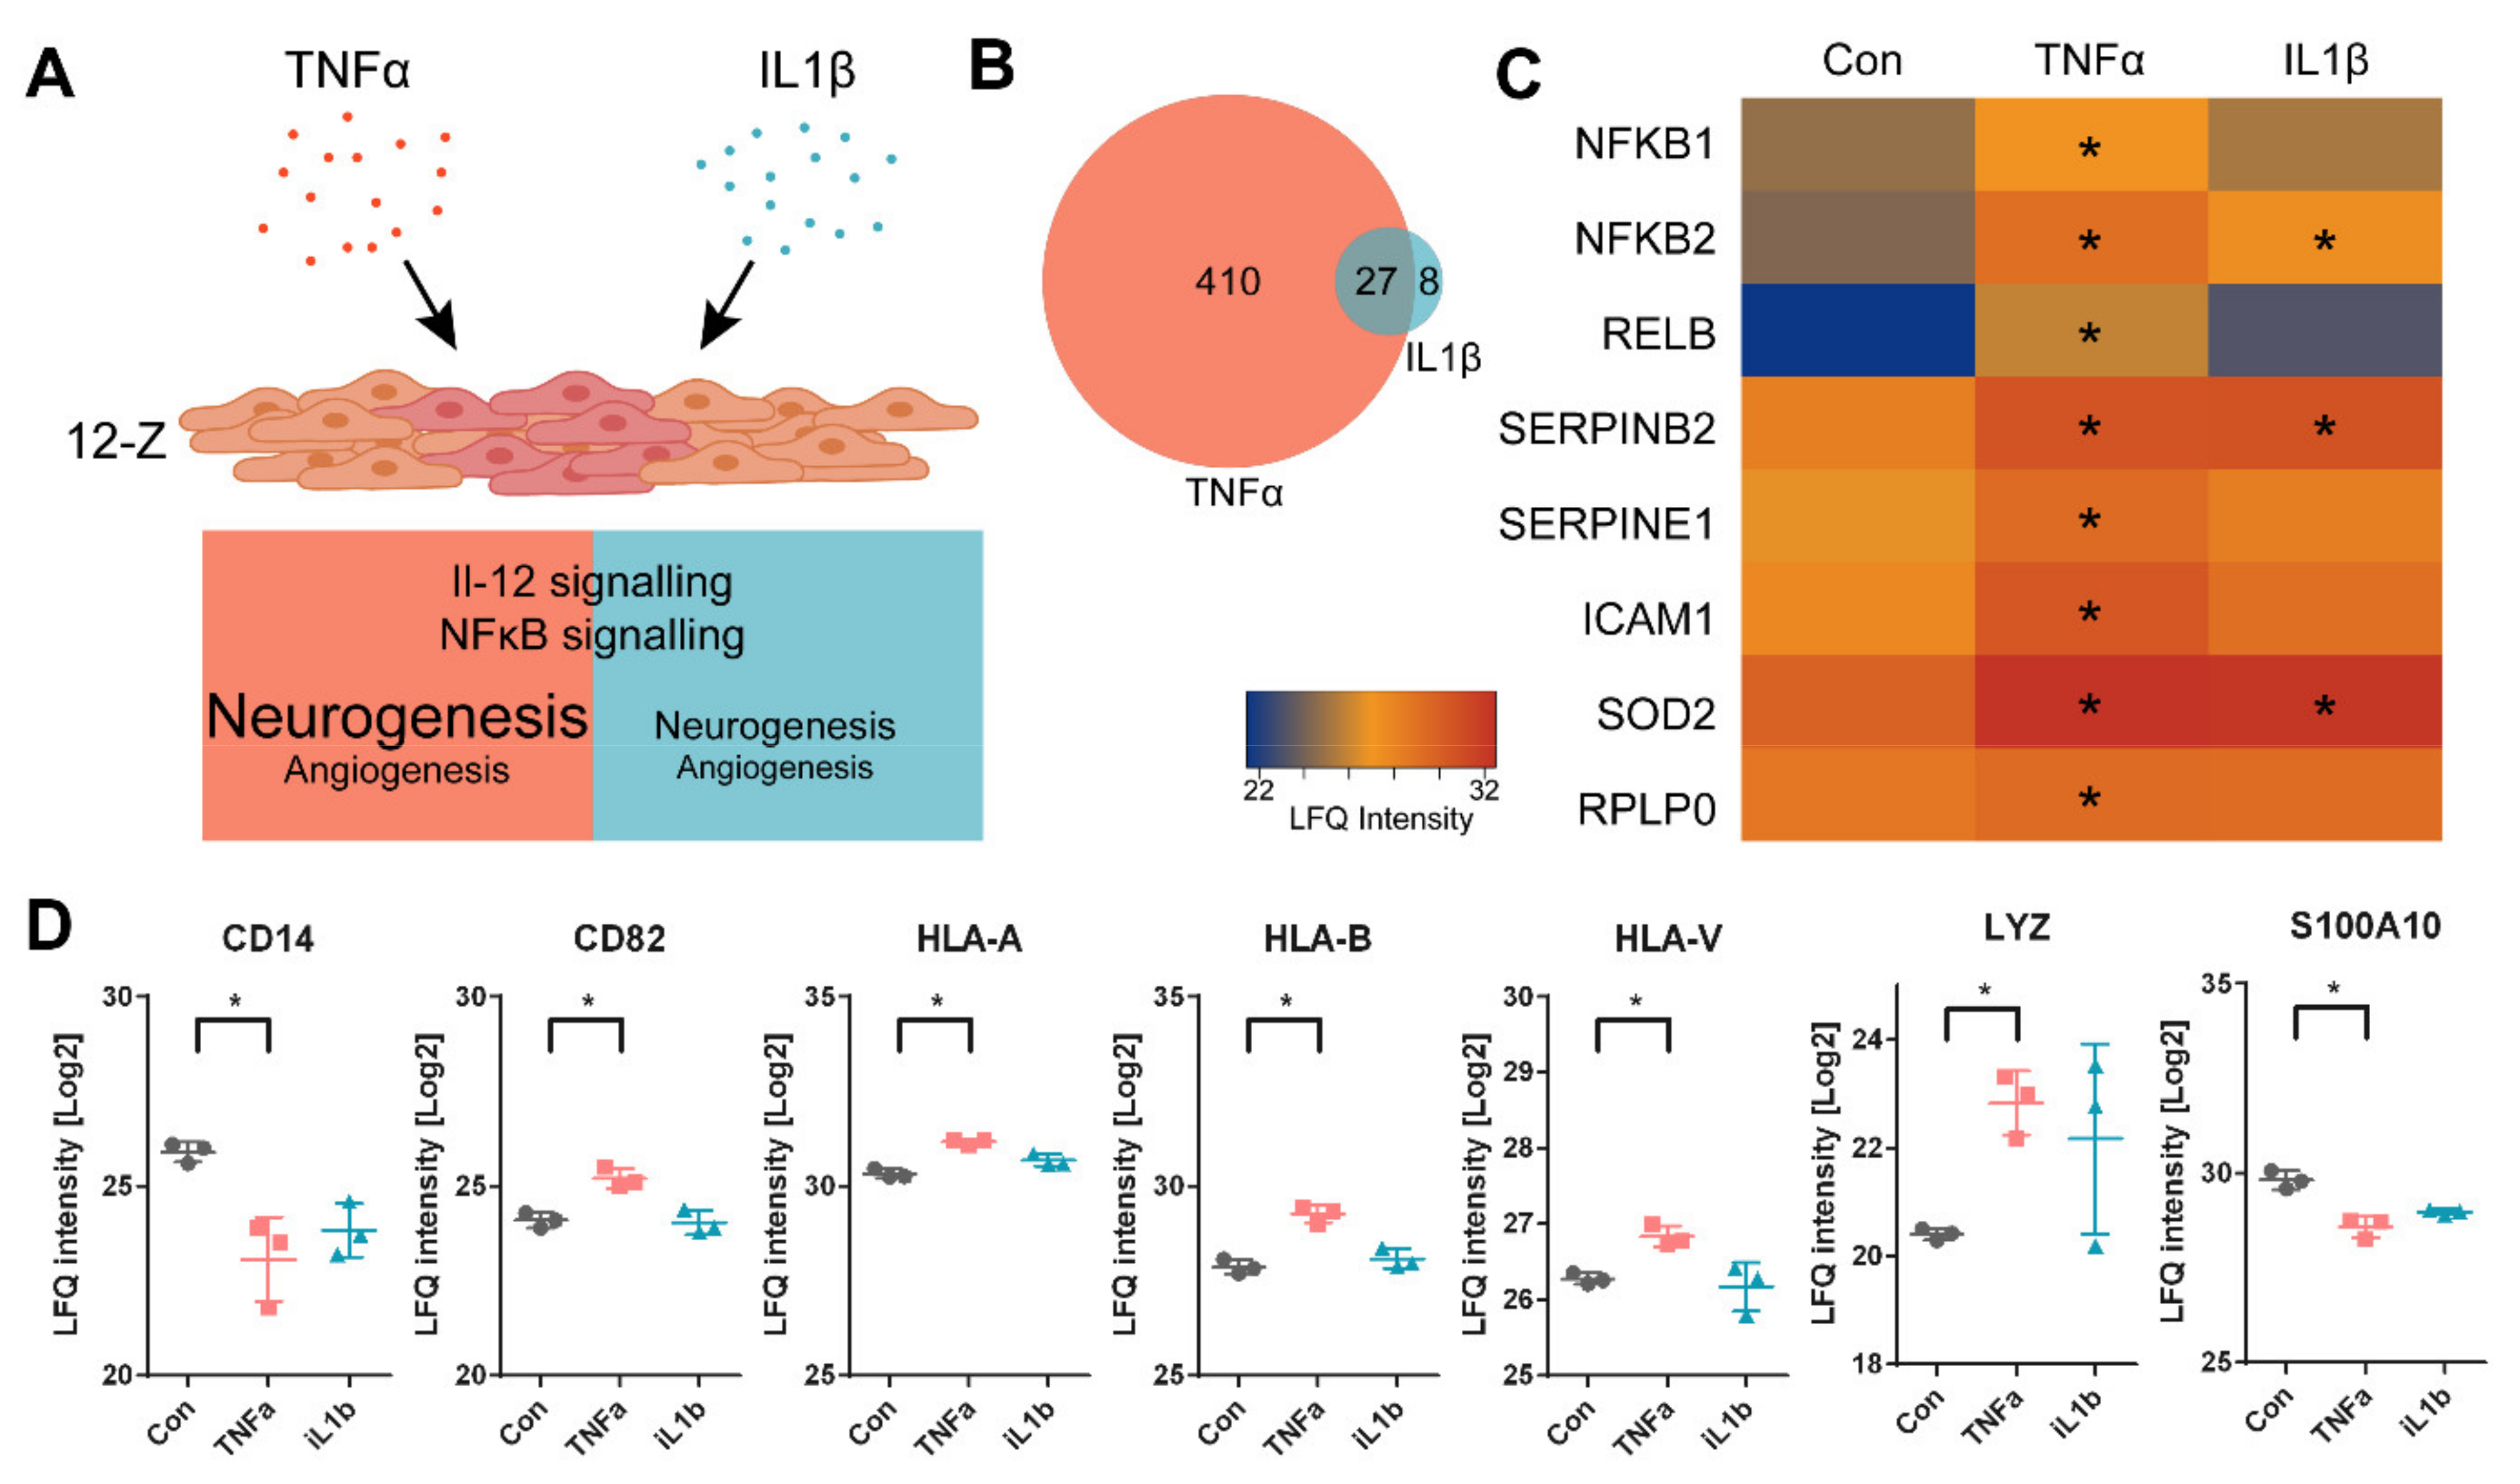
Abstract
:1. Introduction
2. Material & Methods
2.1. Cell Culture
2.2. Proteomics
2.3. Eicosanoid Analysis
2.4. Metabolomics
2.5. Cell Cycle Analysis
3. Results
3.1. Eicosanoid Analysis Reveals the Uptake of Eicosanoid Precursors by 12-Z Cells from the Growth Medium
3.2. TNFα- and IL1β-Stimulated 12-Z Cells Show Enhanced Proliferation and Activation of IL-12 and NF-κB Signaling Pathways
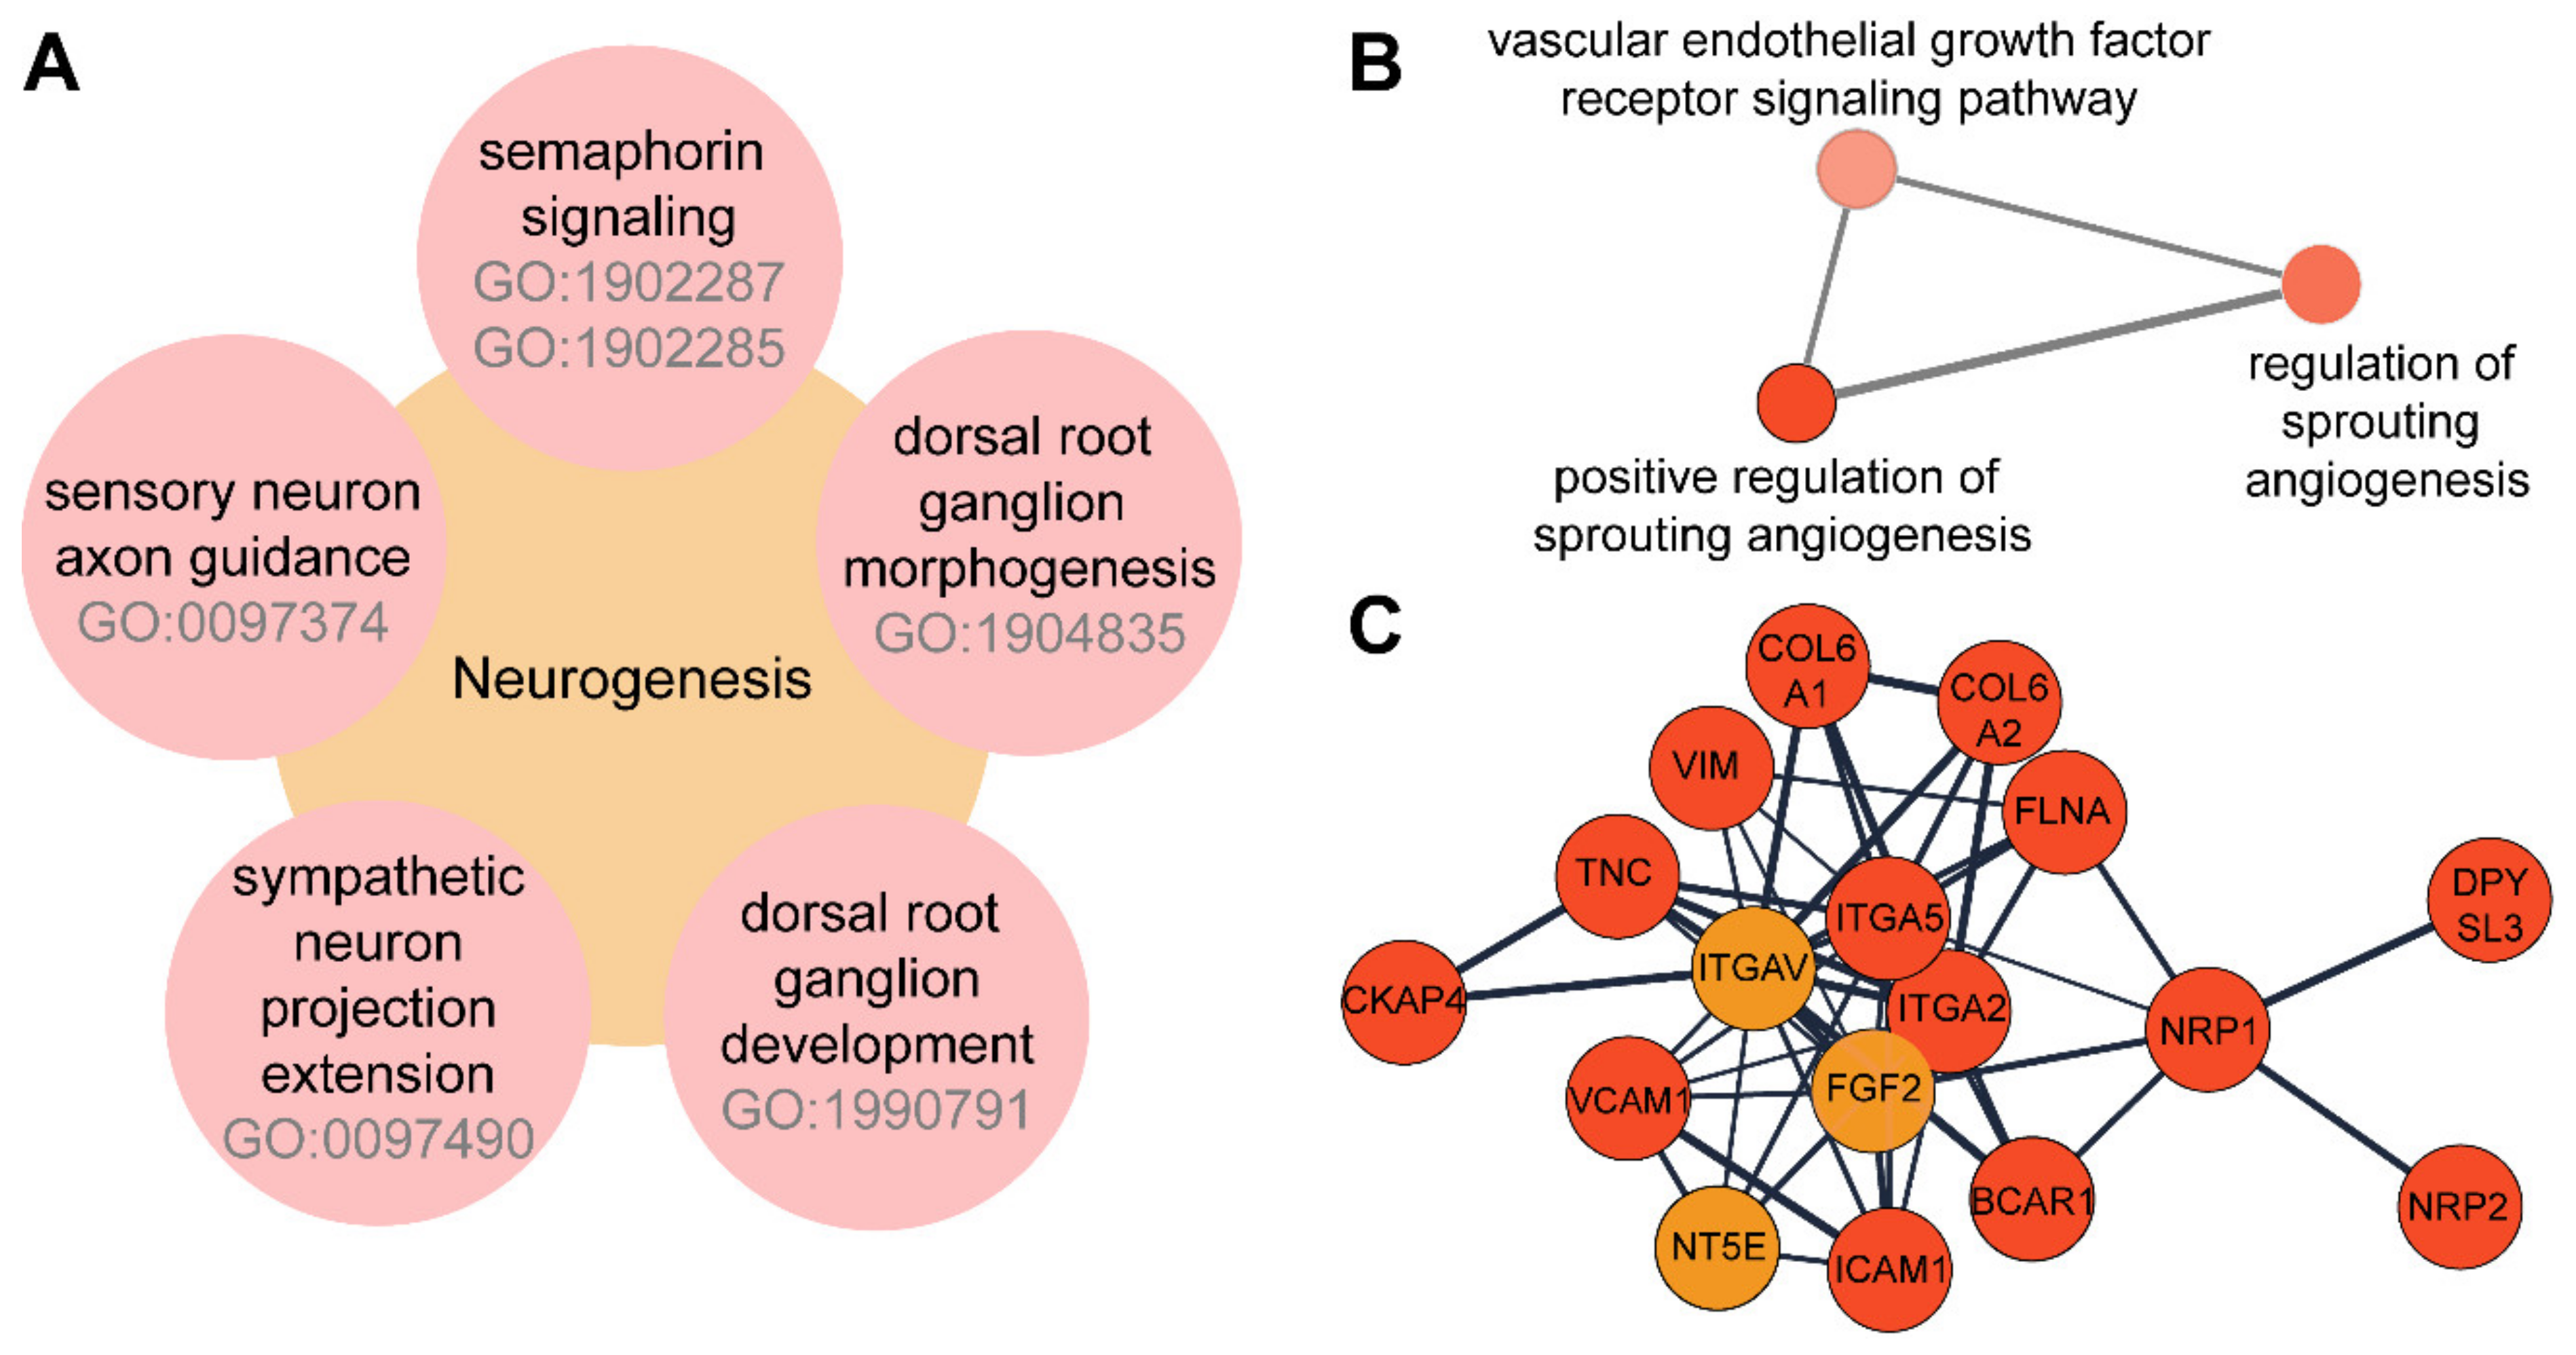
3.3. TNFα Induces the Expression of Proteins Involved in Neuroangiogenesis in 12-Z Cells
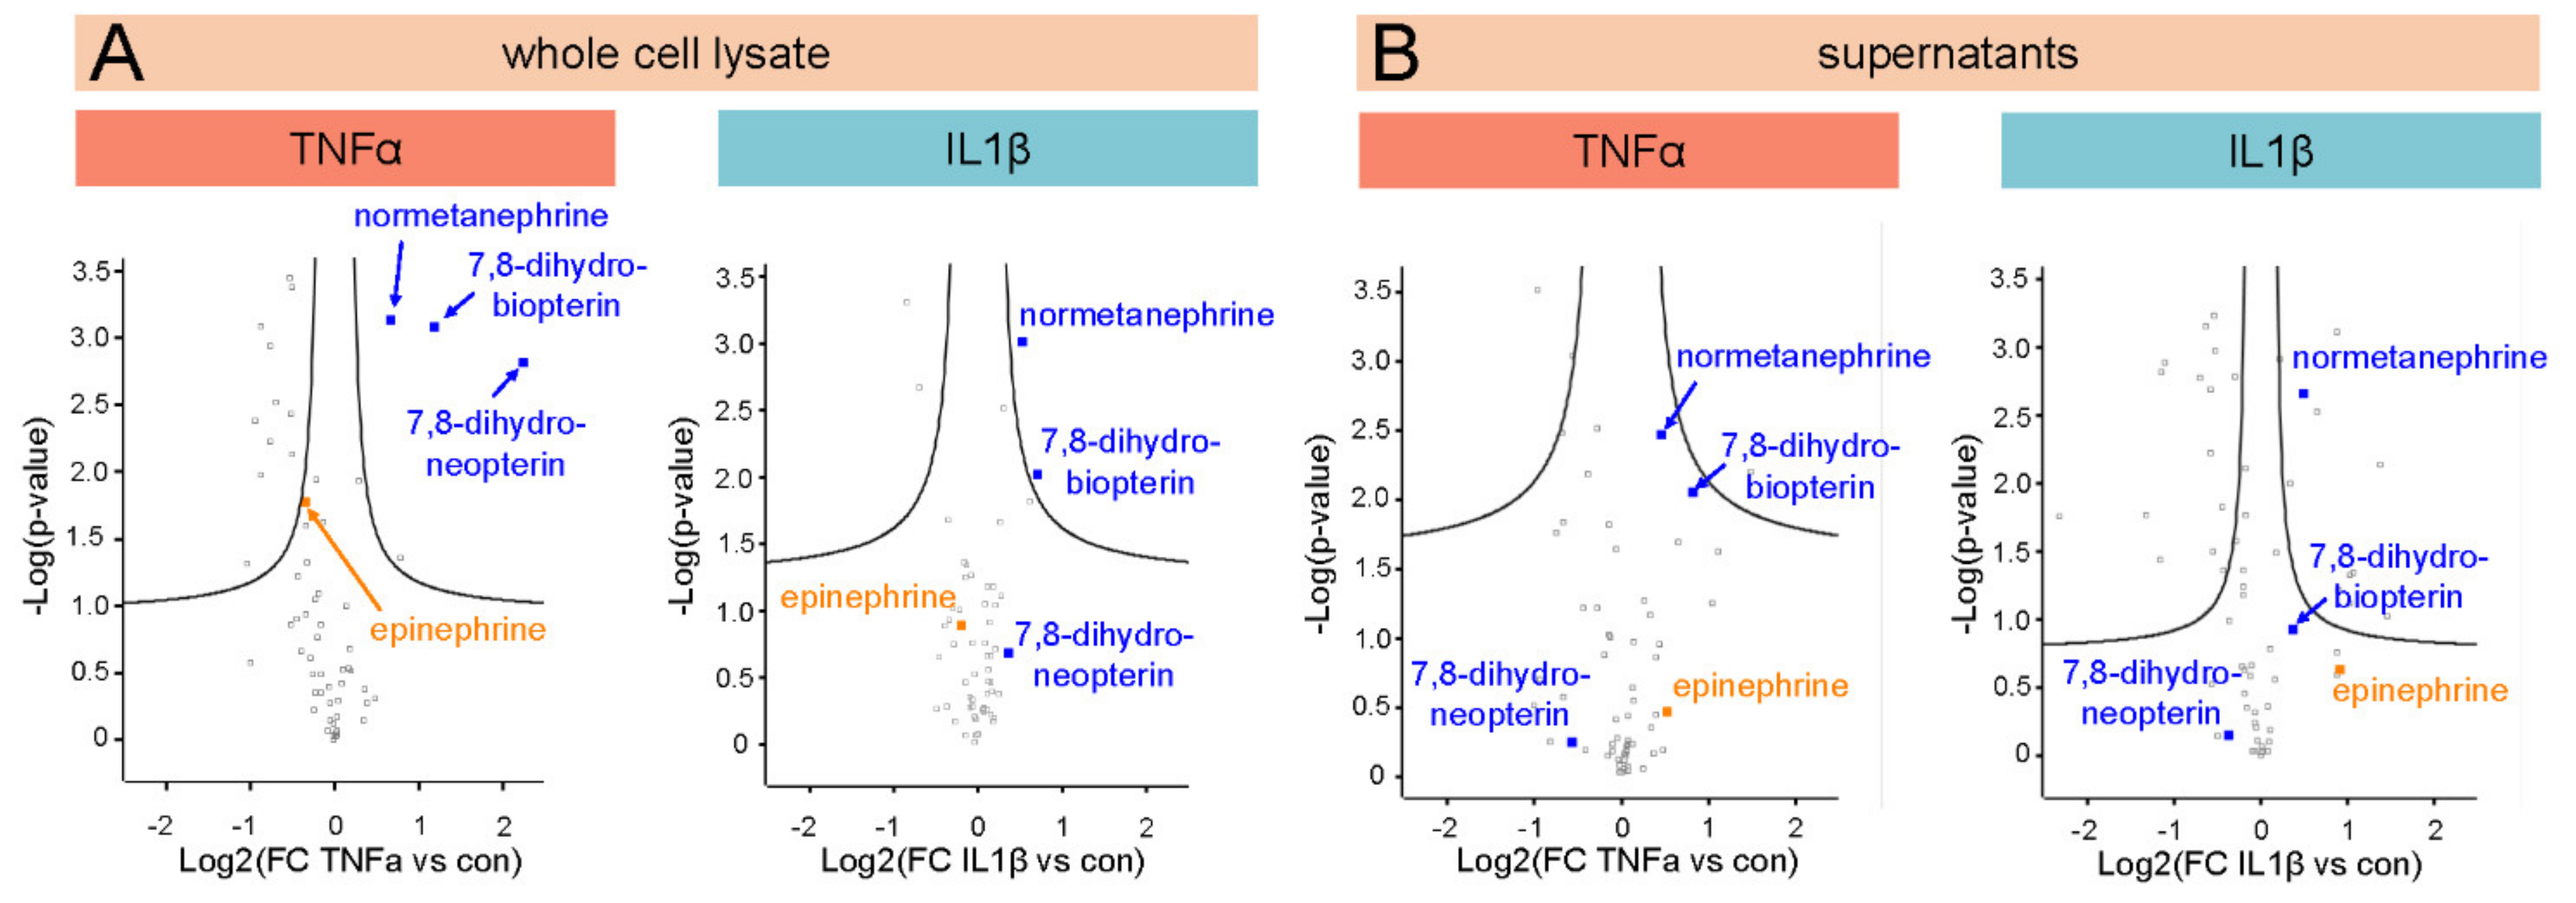
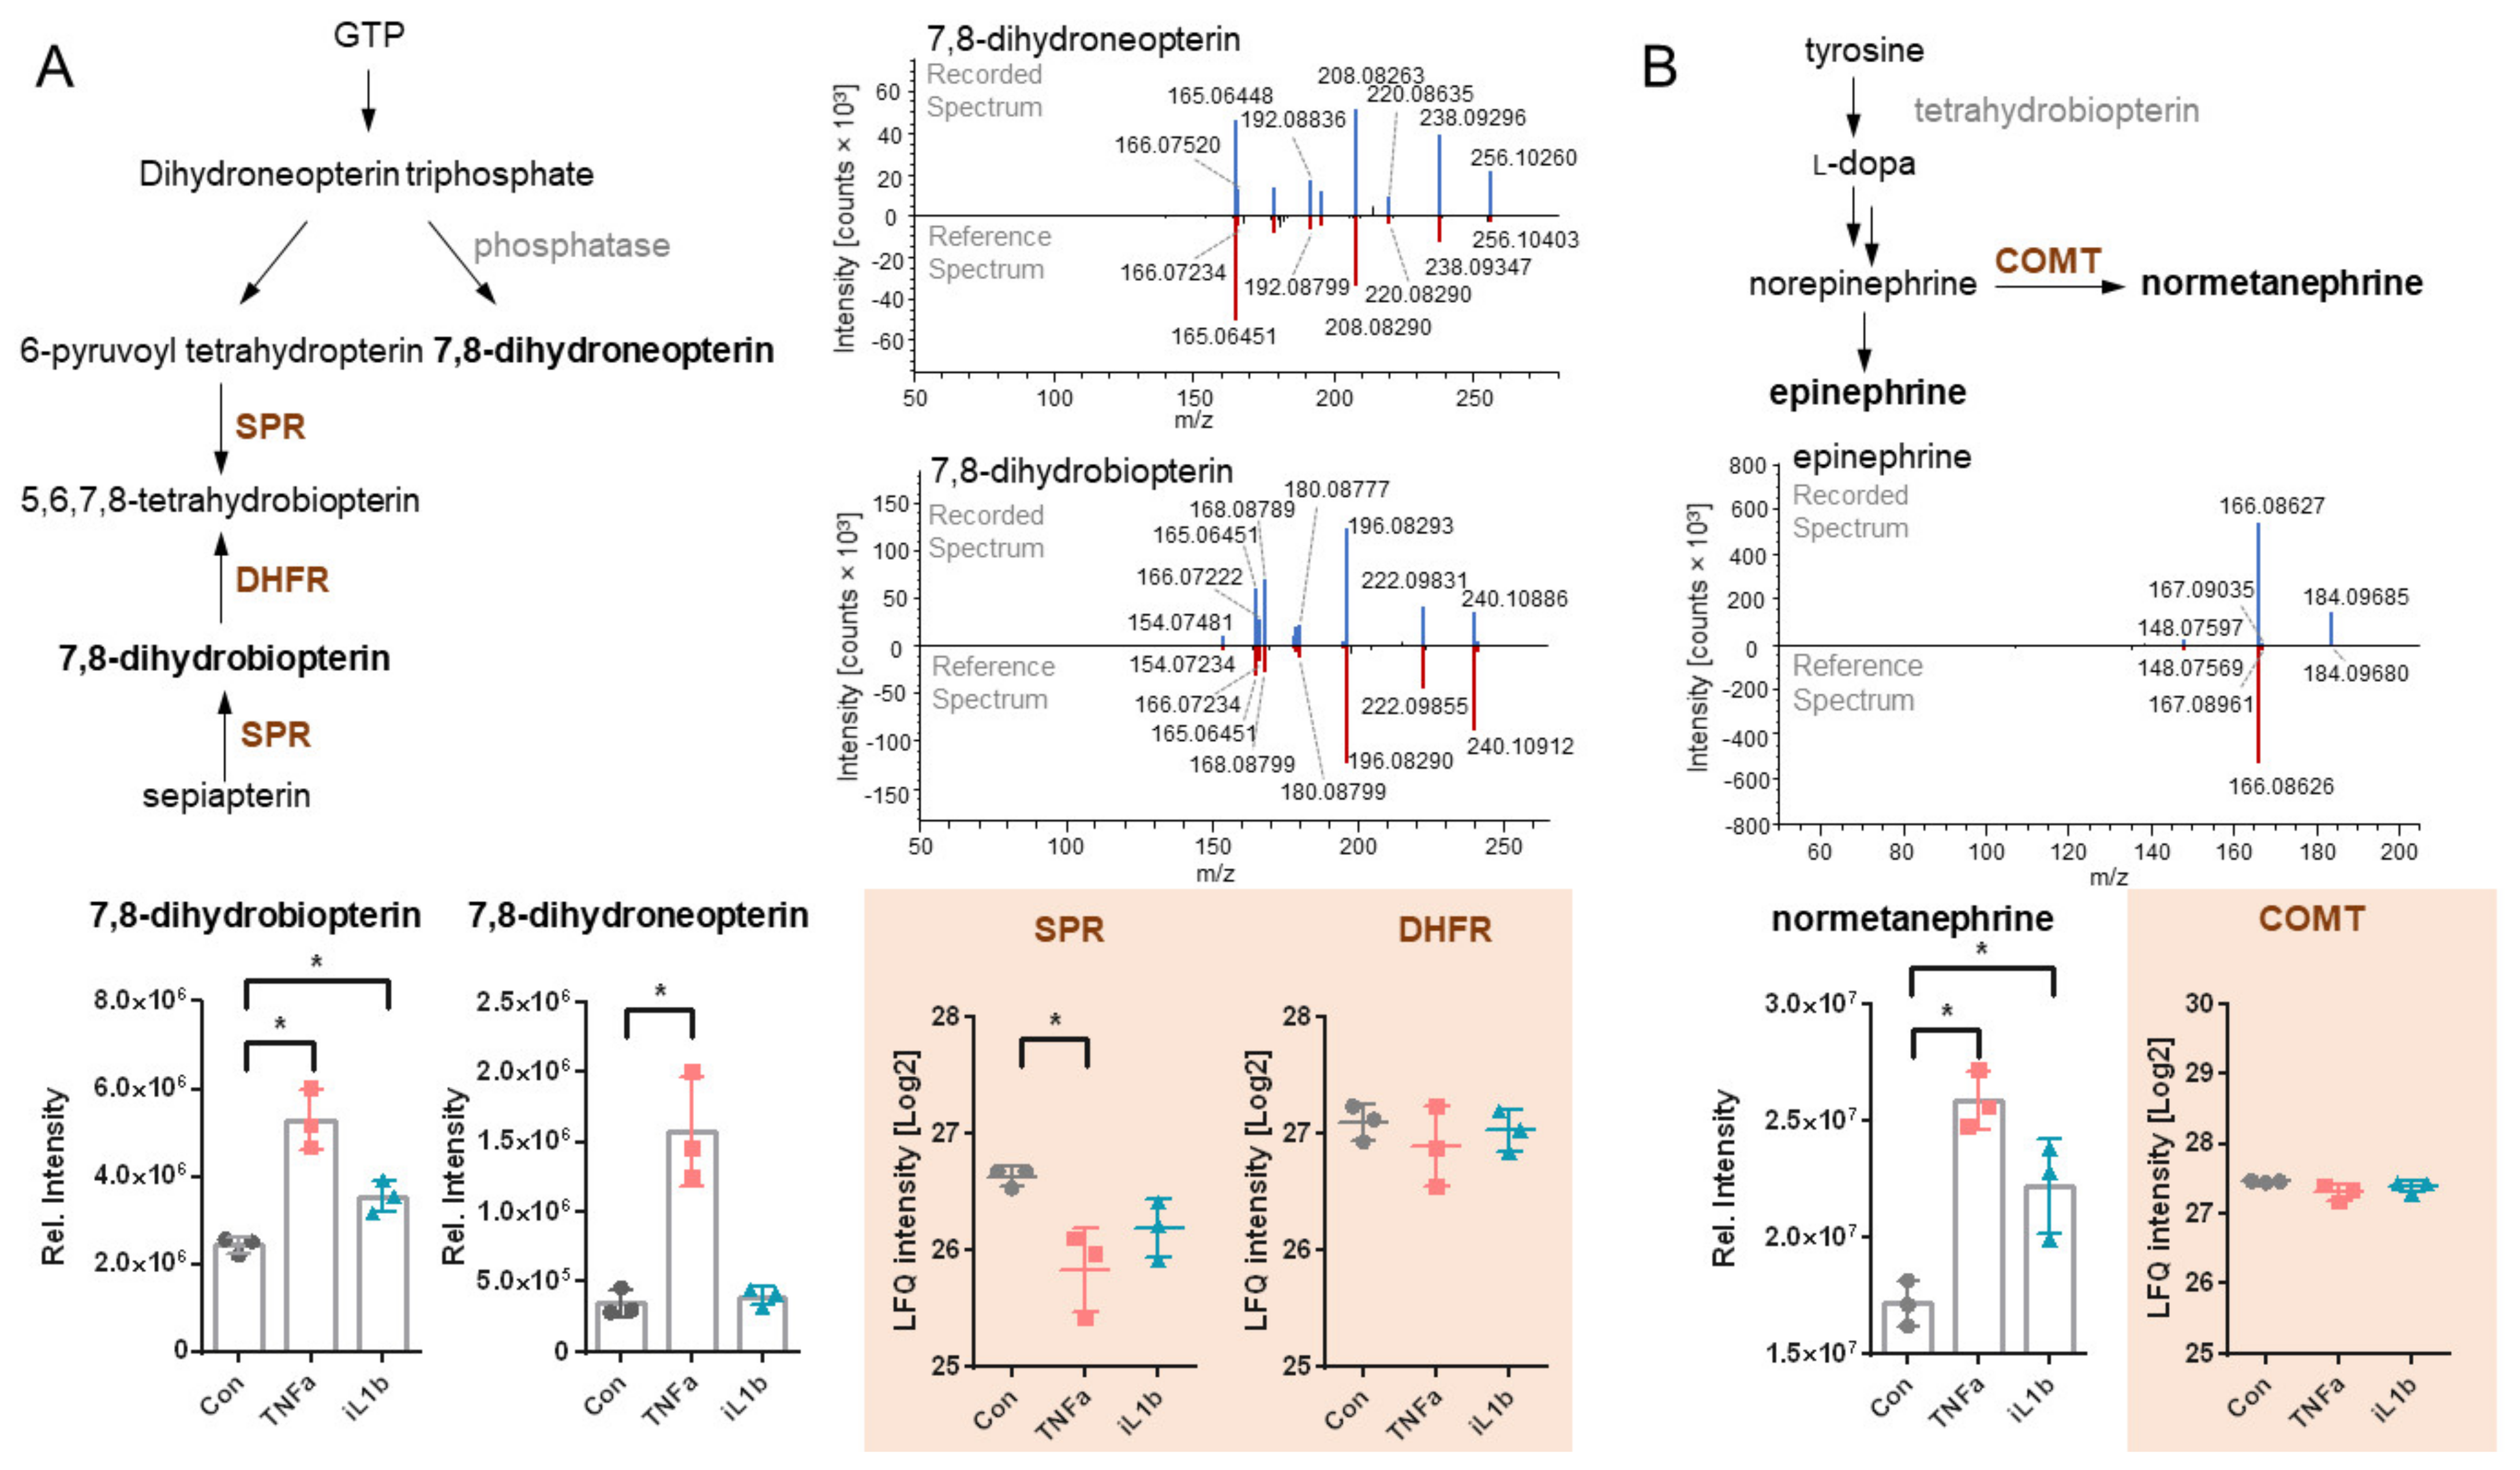
3.4. Untargeted Metabolomics Reveals the Upregulation of 7,8-Dihydroneopterin, 7,8-Dihydrobiopterin (BH2) and Normetanephrine in 12-Z Cells
4. Discussion
5. Conclusions
Supplementary Materials
Author Contributions
Funding
Data Availability Statement
Acknowledgments
Conflicts of Interest
References
- Sonavane, S.K.; Kantawala, K.P.; Menias, C.O. Beyond the boundaries-endometriosis: Typical and atypical locations. Curr. Probl. Diagn. Radiol. 2011, 40, 219–232. [Google Scholar] [CrossRef] [PubMed]
- Renner, S.P.; Strissel, P.L.; Beckmann, M.W.; Lermann, J.; Burghaus, S.; Hackl, J.; Fasching, P.A.; Strick, R. Inhibition of adhesion, proliferation, and invasion of primary endometriosis and endometrial stromal and ovarian carcinoma cells by a nonhyaluronan adhesion barrier gel. Biomed. Res. Int. 2015, 2015, 450468. [Google Scholar] [CrossRef] [PubMed]
- McKinnon, B.D.; Kocbek, V.; Nirgianakis, K.; Bersinger, N.A.; Mueller, M.D. Kinase signalling pathways in endometriosis: Potential targets for non-hormonal therapeutics. Hum. Reprod. Update 2016, 22, 382–403. [Google Scholar] [CrossRef] [PubMed] [Green Version]
- Imanaka, S.; Maruyama, S.; Kimura, M.; Nagayasu, M.; Kobayashi, H. Towards an understanding of the molecular mechanisms of endometriosis-associated symptoms (Review). World Acad. Sci. J. 2020, 2, 12. [Google Scholar] [CrossRef]
- Haas, D.; Shebl, O.; Shamiyeh, A.; Oppelt, P. The rASRM score and the Enzian classification for endometriosis: Their strengths and weaknesses. Acta Obstet. Gynecol. Scand. 2013, 92, 3–7. [Google Scholar] [CrossRef]
- Morotti, M.; Vincent, K.; Becker, C.M. Mechanisms of pain in endometriosis. Eur. J. Obstet. Gynecol. Reprod. Biol. 2017, 209, 8–13. [Google Scholar] [CrossRef]
- Zhang, X.; Yao, H.; Huang, X.; Lu, B.; Xu, H.; Zhou, C. Nerve fibres in ovarian endometriotic lesions in women with ovarian endometriosis. Hum. Reprod. 2010, 25, 392–397. [Google Scholar] [CrossRef] [Green Version]
- Walch, K.; Kernstock, T.; Poschalko-Hammerle, G.; Gleiss, A.; Staudigl, C.; Wenzl, R. Prevalence and severity of cyclic leg pain in women with endometriosis and in controls—Effect of laparoscopic surgery. Eur. J. Obstet. Gynecol. Reprod. Biol. 2014, 179, 51–57. [Google Scholar] [CrossRef]
- Porpora, M.G.; Koninckx, P.R.; Piazze, J.; Natili, M.; Colagrande, S.; Cosmi, E.V. Correlation between endometriosis and pelvic pain. J. Am. Assoc. Gynecol. Laparosc. 1999, 6, 429–434. [Google Scholar] [CrossRef]
- Bloski, T.; Pierson, R. Endometriosis and Chronic Pelvic Pain: Unraveling the Mystery Behind this Complex Condition. Nurs. Womens Health 2008, 12, 382–395. [Google Scholar] [CrossRef] [Green Version]
- Klemmt, P.A.B.; Starzinski-Powitz, A. Molecular and Cellular Pathogenesis of Endometriosis. Curr. Womens Health Rev. 2018, 14, 106–116. [Google Scholar] [CrossRef] [PubMed]
- Lian, Y.L.; Cheng, M.J.; Zhang, X.X.; Wang, L. Elevated expression of transient receptor potential vanilloid type 1 in dorsal root ganglia of rats with endometriosis. Mol. Med. Rep. 2017, 16, 1920–1926. [Google Scholar] [CrossRef] [Green Version]
- Izumi, G.; Koga, K.; Takamura, M.; Makabe, T.; Satake, E.; Takeuchi, A.; Taguchi, A.; Urata, Y.; Fujii, T.; Osuga, Y. Involvement of immune cells in the pathogenesis of endometriosis. J. Obstet. Gynaecol. Res. 2018, 44, 191–198. [Google Scholar] [CrossRef] [Green Version]
- Chuang, P.C.; Wu, M.H.; Shoji, Y.; Tsai, S.J. Downregulation of CD36 results in reduced phagocytic ability of peritoneal macrophages of women with endometriosis. J. Pathol. 2009, 219, 232–241. [Google Scholar] [CrossRef]
- Herington, J.L.; Bruner-Tran, K.L.; Lucas, J.A.; Osteen, K.G. Immune interactions in endometriosis. Expert Rev. Clin. Immunol. 2011, 7, 611–626. [Google Scholar] [CrossRef] [PubMed] [Green Version]
- Dmowski, W.P.; Gebel, H.M.; Braun, D.P. The role of cell-mediated immunity in pathogenesis of endometriosis. Acta Obstet. Gynecol. Scand. Suppl. 1994, 159, 7–14. [Google Scholar]
- Nanda, A.; Thangapandi, K.; Banerjee, P.; Dutta, M.; Wangdi, T.; Sharma, P.; Chaudhury, K.; Jana, S.K. Cytokines, Angiogenesis, and Extracellular Matrix Degradation are Augmented by Oxidative Stress in Endometriosis. Ann. Lab. Med. 2020, 40, 390–397. [Google Scholar] [CrossRef] [PubMed]
- Liang, Y.; Xie, H.; Wu, J.; Liu, D.; Yao, S. Villainous role of estrogen in macrophage-nerve interaction in endometriosis. Reprod. Biol. Endocrinol. 2018, 16, 122. [Google Scholar] [CrossRef] [Green Version]
- Greaves, E.; Temp, J.; Esnal-Zufiurre, A.; Mechsner, S.; Horne, A.W.; Saunders, P.T. Estradiol is a critical mediator of macrophage-nerve cross talk in peritoneal endometriosis. Am. J. Pathol. 2015, 185, 2286–2297. [Google Scholar] [CrossRef] [PubMed]
- Capobianco, A.; Rovere-Querini, P. Endometriosis, a disease of the macrophage. Front. Immunol. 2013, 4, 9. [Google Scholar] [CrossRef] [Green Version]
- Sondell, M.; Sundler, F.; Kanje, M. Vascular endothelial growth factor is a neurotrophic factor which stimulates axonal outgrowth through the flk-1 receptor. Eur. J. Neurosci. 2000, 12, 4243–4254. [Google Scholar] [CrossRef] [PubMed]
- Sheveleva, T.; Bejenar, V.; Komlichenko, E.; Dedul, A.; Malushko, A. Innovative approach in assessing the role of neurogenesis, angiogenesis, and lymphangiogenesis in the pathogenesis of external genital endometriosis. Gynecol. Endocrinol. 2016, 32, 75–79. [Google Scholar] [CrossRef] [PubMed] [Green Version]
- Vallve-Juanico, J.; Houshdaran, S.; Giudice, L.C. The endometrial immune environment of women with endometriosis. Hum. Reprod. Update 2019, 25, 564–591. [Google Scholar] [CrossRef] [PubMed]
- Weiss, G.; Goldsmith, L.T.; Taylor, R.N.; Bellet, D.; Taylor, H.S. Inflammation in reproductive disorders. Reprod. Sci. 2009, 16, 216–229. [Google Scholar] [CrossRef] [Green Version]
- Wang, X.M.; Ma, Z.Y.; Song, N. Inflammatory cytokines IL-6, IL-10, IL-13, TNF-alpha and peritoneal fluid flora were associated with infertility in patients with endometriosis. Eur. Rev. Med. Pharmacol. Sci. 2018, 22, 2513–2518. [Google Scholar] [CrossRef]
- Casazza, A.; Laoui, D.; Wenes, M.; Rizzolio, S.; Bassani, N.; Mambretti, M.; Deschoemaeker, S.; Van Ginderachter, J.A.; Tamagnone, L.; Mazzone, M. Impeding macrophage entry into hypoxic tumor areas by Sema3A/Nrp1 signaling blockade inhibits angiogenesis and restores antitumor immunity. Cancer Cell 2013, 24, 695–709. [Google Scholar] [CrossRef] [PubMed] [Green Version]
- Wu, J.; Xie, H.; Yao, S.; Liang, Y. Macrophage and nerve interaction in endometriosis. J. Neuroinflamm. 2017, 14, 53. [Google Scholar] [CrossRef] [PubMed] [Green Version]
- Brawn, J.; Morotti, M.; Zondervan, K.T.; Becker, C.M.; Vincent, K. Central changes associated with chronic pelvic pain and endometriosis. Hum. Reprod. Update 2014, 20, 737–747. [Google Scholar] [CrossRef]
- Vitonis, A.F.; Vincent, K.; Rahmioglu, N.; Fassbender, A.; Buck Louis, G.M.; Hummelshoj, L.; Giudice, L.C.; Stratton, P.; Adamson, G.D.; Becker, C.M.; et al. World Endometriosis Research Foundation Endometriosis Phenome and Biobanking Harmonization Project: II. Clinical and covariate phenotype data collection in endometriosis research. Fertil. Steril. 2014, 102, 1223–1232. [Google Scholar] [CrossRef]
- Song, N.; Leng, J.H.; Lang, J.H. Expression of transient receptor potentials of vanilloid subtype 1 and pain in endometriosis. Zhonghua Fu Chan Ke Za Zhi 2012, 47, 333–336. [Google Scholar]
- Hey-Cunningham, A.J.; Peters, K.M.; Zevallos, H.B.; Berbic, M.; Markham, R.; Fraser, I.S. Angiogenesis, lymphangiogenesis and neurogenesis in endometriosis. Front. Biosci. 2013, 5, 1033–1056. [Google Scholar] [CrossRef]
- Morotti, M.; Vincent, K.; Brawn, J.; Zondervan, K.T.; Becker, C.M. Peripheral changes in endometriosis-associated pain. Hum. Reprod. Update 2014, 20, 717–736. [Google Scholar] [CrossRef] [PubMed] [Green Version]
- Irungu, S.; Mavrelos, D.; Worthington, J.; Blyuss, O.; Saridogan, E.; Timms, J.F. Discovery of non-invasive biomarkers for the diagnosis of endometriosis. Clin. Proteom. 2019, 16, 1–16. [Google Scholar] [CrossRef] [Green Version]
- Hudson, Q.J.; Perricos, A.; Wenzl, R.; Yotova, I. Challenges in uncovering non-invasive biomarkers of endometriosis. Exp. Biol. Med. 2020, 245, 437–447. [Google Scholar] [CrossRef] [PubMed]
- Ortiz, C.N.; Torres-Reverón, A.; Appleyard, C.B. Metabolomics in endometriosis: Challenges and perspectives for future studies. Reprod. Fertil. 2021, 2, R35–R50. [Google Scholar] [CrossRef]
- Khanapure, S.; Garvey, D.; Janero, D.; Gordon Letts, L. Eicosanoids in Inflammation: Biosynthesis, Pharmacology, and Therapeutic Frontiers. Curr. Top. Med. Chem. 2007, 7, 311–340. [Google Scholar] [CrossRef] [PubMed]
- Medzhitov, R. Origin and physiological roles of inflammation. Nature 2008, 454, 428–435. [Google Scholar] [CrossRef] [PubMed]
- Zeitvogel, A.; Baumann, R.; Starzinski-Powitz, A. Identification of an invasive, N-cadherin-expressing epithelial cell type in endometriosis using a new cell culture model. Am. J. Pathol. 2001, 159, 1839–1852. [Google Scholar] [CrossRef] [Green Version]
- Malutan, A.M.; Drugan, T.; Costin, N.; Ciortea, R.; Bucuri, C.; Rada, M.P.; Mihu, D. Pro-inflammatory cytokines for evaluation of inflammatory status in endometriosis. Cent. Eur. J. Immunol. 2015, 40, 96–102. [Google Scholar] [CrossRef] [PubMed]
- Neuditschko, B.; Janker, L.; Niederstaetter, L.; Brunmair, J.; Krivanek, K.; Izraely, S.; Sagi-Assif, O.; Meshel, T.; Keppler, B.K.; Del Favero, G.; et al. The Challenge of Classifying Metastatic Cell Properties by Molecular Profiling Exemplified with Cutaneous Melanoma Cells and Their Cerebral Metastasis from Patient Derived Mouse Xenografts. Mol. Cell. Proteom. 2020, 19, 478–489. [Google Scholar] [CrossRef] [Green Version]
- Zougman, A.; Selby, P.J.; Banks, R.E. Suspension trapping (STrap) sample preparation method for bottom-up proteomics analysis. Proteomics 2014, 14, 1006–1010. [Google Scholar] [CrossRef] [PubMed]
- Mayer, R.L.; Schwarzmeier, J.D.; Gerner, M.C.; Bileck, A.; Mader, J.C.; Meier-Menches, S.M.; Gerner, S.M.; Schmetterer, K.G.; Pukrop, T.; Reichle, A.; et al. Proteomics and metabolomics identify molecular mechanisms of aging potentially predisposing for chronic lymphocytic leukemia. Mol. Cell. Proteom. 2018, 17, 290–303. [Google Scholar] [CrossRef] [Green Version]
- Cox, J.; Mann, M. MaxQuant enables high peptide identification rates, individualized p.p.b.-range mass accuracies and proteome-wide protein quantification. Nat. Biotechnol. 2008, 26, 1367–1372. [Google Scholar] [CrossRef] [PubMed]
- Gerner, M.C.; Niederstaetter, L.; Ziegler, L.; Bileck, A.; Slany, A.; Janker, L.; Schmidt, R.L.J.; Gerner, C.; Del Favero, G.; Schmetterer, K.G. Proteome analysis reveals distinct mitochondrial functions linked to interferon response patterns in activated CD4+ and CD8+ T cells. Front. Pharmacol. 2019, 10, 727. [Google Scholar] [CrossRef] [PubMed]
- Bileck, A.; Kreutz, D.; Muqaku, B.; Slany, A.; Gerner, C. Comprehensive assessment of proteins regulated by dexamethasone reveals novel effects in primary human peripheral blood mononuclear cells. J. Proteome Res. 2014, 13, 5989–6000. [Google Scholar] [CrossRef] [PubMed]
- Shannon, P.; Markiel, A.; Ozier, O.; Baliga, N.S.; Wang, J.T.; Ramage, D.; Amin, N.; Schwikowski, B.; Ideker, T. Cytoscape: A software environment for integrated models of biomolecular interaction networks. Genome Res. 2003, 13, 2498–2504. [Google Scholar] [CrossRef]
- Bindea, G.; Mlecnik, B.; Hackl, H.; Charoentong, P.; Tosolini, M.; Kirilovsky, A.; Fridman, W.H.; Pages, F.; Trajanoski, Z.; Galon, J. ClueGO: A Cytoscape plug-in to decipher functionally grouped gene ontology and pathway annotation networks. Bioinformatics 2009, 25, 1091–1093. [Google Scholar] [CrossRef] [PubMed] [Green Version]
- Szklarczyk, D.; Gable, A.L.; Lyon, D.; Junge, A.; Wyder, S.; Huerta-Cepas, J.; Simonovic, M.; Doncheva, N.T.; Morris, J.H.; Bork, P.; et al. STRING v11: Protein-protein association networks with increased coverage, supporting functional discovery in genome-wide experimental datasets. Nucleic Acids Res. 2019, 47, D607–D613. [Google Scholar] [CrossRef] [PubMed] [Green Version]
- Perez-Riverol, Y.; Csordas, A.; Bai, J.; Bernal-Llinares, M.; Hewapathirana, S.; Kundu, D.J.; Inuganti, A.; Griss, J.; Mayer, G.; Eisenacher, M.; et al. The PRIDE database and related tools and resources in 2019: Improving support for quantification data. Nucleic Acids Res. 2019, 47, D442–D450. [Google Scholar] [CrossRef]
- Fahy, E.; Sud, M.; Cotter, D.; Subramaniam, S. LIPID MAPS online tools for lipid research. Nucleic Acids Res. 2007, 35, W606–W612. [Google Scholar] [CrossRef] [Green Version]
- Karin, M.; Greten, F.R. NF-kappaB: Linking inflammation and immunity to cancer development and progression. Nat. Rev. Immunol. 2005, 5, 749–759. [Google Scholar] [CrossRef]
- Kapellos, T.S.; Bonaguro, L.; Gemünd, I.; Reusch, N.; Saglam, A.; Hinkley, E.R.; Schultze, J.L. Human Monocyte Subsets and Phenotypes in Major Chronic Inflammatory Diseases. Front. Immunol. 2019, 10, 2035. [Google Scholar] [CrossRef] [PubMed] [Green Version]
- Brooks, S.S.; Wall, A.L.; Golzio, C.; Reid, D.W.; Kondyles, A.; Willer, J.R.; Botti, C.; Nicchitta, C.V.; Katsanis, N.; Davis, E.E. A novel ribosomopathy caused by dysfunction of RPL10 disrupts neurodevelopment and causes X-linked microcephaly in humans. Genetics 2014, 198, 723–733. [Google Scholar] [CrossRef] [PubMed]
- Laschke, M.W.; Menger, M.D. Basic mechanisms of vascularization in endometriosis and their clinical implications. Hum. Reprod. Update 2018, 24, 207–224. [Google Scholar] [CrossRef] [PubMed]
- Somanath, P.R.; Malinin, N.L.; Byzova, T.V. Cooperation between integrin alphavbeta3 and VEGFR2 in angiogenesis. Angiogenesis 2009, 12, 177–185. [Google Scholar] [CrossRef] [Green Version]
- Shoieb, S.M.; El-Sherbeni, A.A.; El-Kadi, A.O.S. Subterminal hydroxyeicosatetraenoic acids: Crucial lipid mediators in normal physiology and disease states. Chem. Biol. Interact. 2019, 299, 140–150. [Google Scholar] [CrossRef]
- Kraemer, R.; Bednar, M.M.; Hatala, M.A.; Mullane, K.M. A neutrophil-derived cytochrome P450-dependent metabolite of arachidonic acid modulates neutrophil behavior. Am. J. Pathol. 1987, 128, 446–454. [Google Scholar] [PubMed]
- Liang, Y.; Wang, W.; Huang, J.; Tan, H.; Liu, T.; Shang, C.; Liu, D.; Guo, L.; Yao, S. Potential Role of Semaphorin 3A and Its Receptors in Regulating Aberrant Sympathetic Innervation in Peritoneal and Deep Infiltrating Endometriosis. PLoS ONE 2015, 10, e0146027. [Google Scholar] [CrossRef] [Green Version]
- Koncina, E.; Roth, L.; Gonthier, B.; Bagnard, D. Role of semaphorins during axon growth and guidance. Adv. Exp. Med. Biol. 2007, 621, 50–64. [Google Scholar] [CrossRef]
- Markovinovic, A.; Cimbro, R.; Ljutic, T.; Kriz, J.; Rogelj, B.; Munitic, I. Optineurin in amyotrophic lateral sclerosis: Multifunctional adaptor protein at the crossroads of different neuroprotective mechanisms. Prog. Neurobiol. 2017, 154, 1–20. [Google Scholar] [CrossRef] [PubMed]
- Hu, S.; Zhu, L. Semaphorins and Their Receptors: From Axonal Guidance to Atherosclerosis. Front. Physiol. 2018, 9, 1236. [Google Scholar] [CrossRef] [PubMed] [Green Version]
- Malik, S.; Vinukonda, G.; Vose, L.R.; Diamond, D.; Bhimavarapu, B.B.; Hu, F.; Zia, M.T.; Hevner, R.; Zecevic, N.; Ballabh, P. Neurogenesis continues in the third trimester of pregnancy and is suppressed by premature birth. J. Neurosci. 2013, 33, 411–423. [Google Scholar] [CrossRef] [PubMed] [Green Version]
- Shchepetkina, A.A.; Hock, B.D.; Miller, A.; Kennedy, M.A.; Gieseg, S.P. Effect of 7,8-dihydroneopterin mediated CD36 down regulation and oxidant scavenging on oxidised low-density lipoprotein induced cell death in human macrophages. Int. J. Biochem. Cell Biol. 2017, 87, 27–33. [Google Scholar] [CrossRef]
- Levine, J.D.; Khasar, S.G.; Green, P.G. Neurogenic inflammation and arthritis. Ann. N. Y. Acad. Sci. 2006, 1069, 155–167. [Google Scholar] [CrossRef] [PubMed]
- Gosain, A.; Jones, S.B.; Shankar, R.; Gamelli, R.L.; DiPietro, L.A. Norepinephrine modulates the inflammatory and proliferative phases of wound healing. J. Trauma 2006, 60, 736–744. [Google Scholar] [CrossRef]
- Grailer, J.; Haggadone, M.; Ward, P. Catecholamines promote an M2 macrophage activation phenotype (P1299). J. Immunol. 2013, 190, 63–67. [Google Scholar]
- Grailer, J.J.; Haggadone, M.D.; Sarma, J.V.; Zetoune, F.S.; Ward, P.A. Induction of M2 regulatory macrophages through the beta2-adrenergic receptor with protection during endotoxemia and acute lung injury. J. Innate Immun. 2014, 6, 607–618. [Google Scholar] [CrossRef]
- Qin, J.F.; Jin, F.J.; Li, N.; Guan, H.T.; Lan, L.; Ni, H.; Wang, Y. Adrenergic receptor beta2 activation by stress promotes breast cancer progression through macrophages M2 polarization in tumor microenvironment. BMB Rep. 2015, 48, 295–300. [Google Scholar] [CrossRef] [Green Version]
- Pertovaara, A. Noradrenergic pain modulation. Prog. Neurobiol. 2006, 80, 53–83. [Google Scholar] [CrossRef]
- Habler, H.J.; Janig, W.; Koltzenburg, M. Activation of unmyelinated afferents in chronically lesioned nerves by adrenaline and excitation of sympathetic efferents in the cat. Neurosci. Lett. 1987, 82, 35–40. [Google Scholar] [CrossRef]
- Medina, M.G.; Lebovic, D.I. Endometriosis-associated nerve fibers and pain. Acta Obstet. Gynecol. Scand. 2009, 88, 968–975. [Google Scholar] [CrossRef] [PubMed] [Green Version]
- Nichol, C.A.; Smith, G.K.; Duch, D.S. Biosynthesis and Metabolism of Tetrahydrobiopterin and Molybdopterin. Annu. Rev. Biochem. 1985, 54, 729–764. [Google Scholar] [CrossRef]
- Latremoliere, A.; Costigan, M. GCH1, BH4 and pain. Curr. Pharm. Biotechnol. 2011, 12, 1728–1741. [Google Scholar] [CrossRef] [PubMed]
- Rocha, M.G.; e Silva, J.C.; Ribeiro da Silva, A.; Candido Dos Reis, F.J.; Nogueira, A.A.; Poli-Neto, O.B. TRPV1 expression on peritoneal endometriosis foci is associated with chronic pelvic pain. Reprod. Sci. 2011, 18, 511–515. [Google Scholar] [CrossRef] [PubMed]


Publisher’s Note: MDPI stays neutral with regard to jurisdictional claims in published maps and institutional affiliations. |
© 2021 by the authors. Licensee MDPI, Basel, Switzerland. This article is an open access article distributed under the terms and conditions of the Creative Commons Attribution (CC BY) license (https://creativecommons.org/licenses/by/4.0/).
Share and Cite
Neuditschko, B.; Leibetseder, M.; Brunmair, J.; Hagn, G.; Skos, L.; Gerner, M.C.; Meier-Menches, S.M.; Yotova, I.; Gerner, C. Epithelial Cell Line Derived from Endometriotic Lesion Mimics Macrophage Nervous Mechanism of Pain Generation on Proteome and Metabolome Levels. Biomolecules 2021, 11, 1230. https://doi.org/10.3390/biom11081230
Neuditschko B, Leibetseder M, Brunmair J, Hagn G, Skos L, Gerner MC, Meier-Menches SM, Yotova I, Gerner C. Epithelial Cell Line Derived from Endometriotic Lesion Mimics Macrophage Nervous Mechanism of Pain Generation on Proteome and Metabolome Levels. Biomolecules. 2021; 11(8):1230. https://doi.org/10.3390/biom11081230
Chicago/Turabian StyleNeuditschko, Benjamin, Marlene Leibetseder, Julia Brunmair, Gerhard Hagn, Lukas Skos, Marlene C. Gerner, Samuel M. Meier-Menches, Iveta Yotova, and Christopher Gerner. 2021. "Epithelial Cell Line Derived from Endometriotic Lesion Mimics Macrophage Nervous Mechanism of Pain Generation on Proteome and Metabolome Levels" Biomolecules 11, no. 8: 1230. https://doi.org/10.3390/biom11081230