Article

Emergence and Enhancement of Ultrasensitivity through Posttranslational Modulation of Protein Stability

1
Department of Biomedical Engineering, Georgia Institute of Technology and Emory University, 950 Atlantic Drive, Atlanta, GA 30332, USA
2
Gangarosa Department of Environmental Health, Rollins School of Public Health, Emory University, 1518 Clifton Rd, Atlanta, GA 30322, USA
*
Authors to whom correspondence should be addressed.
Biomolecules 2021, 11(11), 1741; https://doi.org/10.3390/biom11111741
Submission received: 20 October 2021 / Revised: 15 November 2021 / Accepted: 18 November 2021 / Published: 22 November 2021
(This article belongs to the Special Issue Computational Approaches for the Study of Biomolecular Networks)

Abstract

:
Signal amplification in biomolecular networks converts a linear input to a steeply sigmoid output and is central to a number of cellular functions including proliferation, differentiation, homeostasis, adaptation, and biological rhythms. One canonical signal amplifying motif is zero-order ultrasensitivity that is mediated through the posttranslational modification (PTM) cycle of signaling proteins. The functionality of this signaling motif has been examined conventionally by supposing that the total amount of the protein substrates remains constant, as by the classical Koshland–Goldbeter model. However, covalent modification of signaling proteins often results in changes in their stability, which affects the abundance of the protein substrates. Here, we use mathematical models to explore the signal amplification properties in such scenarios and report some novel aspects. Our analyses indicate that PTM-induced protein stabilization brings the enzymes closer to saturation. As a result, ultrasensitivity may emerge or is greatly enhanced, with a steeper sigmoidal response, higher magnitude, and generally longer response time. In cases where PTM destabilizes the protein, ultrasensitivity can be regained through changes in the activities of the involved enzymes or from increased protein synthesis. Importantly, ultrasensitivity is not limited to modified or unmodified protein substrates—when protein turnover is considered, the total free protein substrate can also exhibit ultrasensitivity under several conditions. When full enzymatic reactions are used instead of Michaelis–Menten kinetics for the modeling, the total free protein substrate can even exhibit nonmonotonic dose–response patterns. It is conceivable that cells use inducible protein stabilization as a strategy in the signaling network to boost signal amplification while saving energy by keeping the protein substrate levels low at basal conditions.

1. Introduction

1.1. Regulation of Protein Stability through Posttranslational Modifications

It has been known for some time that posttranslational modifications (PTMs) are important mechanisms for regulating not only the activity of a protein, but also the abundance of a protein by means of changing its stability. A well-studied example is the DNA damage response. Once the tumor suppressor p53 is phosphorylated by upstream kinases, such as ATM (ataxia telangiectasia mutated), in response to DNA double-strand breaks, its half-life increases dramatically from less than 30 min to over 3 h (Figure 1A), which causes the accumulation of p53 that can induce target gene expression [1,2]. A second example, in some sense of the opposite nature, occurs in the germinal center response of B lymphocytes. B cell receptor-activated MAPK phosphorylates BCL6 (B-cell lymphoma 6), resulting in accelerated degradation of BCL6 by the ubiquitin/proteasome pathway (Figure 1B), which helps the B cells exit the germinal center response [3]. Many similar examples have been reported where protein stabilization or destabilization drives signaling, including IKK-mediated phosphorylation and degradation of IκB in the inflammatory response, Chk1-mediated phosphorylation and proteasomal degradation of Cdc25A during cell cycle arrest, and stabilization of ΔFosB by casein kinase 2-mediated phosphorylation, which might be responsible for long-term adaptation in the brain [4,5,6]. It is thus conceivable—and even likely—that altering protein stability and/or activity through the same PTM event may be an important controllable mode of dual regulation of cellular signaling networks in general. Expressed differently, if the abundance of a protein substrate can be fine-tuned through changes in protein stability, then these changes can in turn be used by the cell as modulators of both the dynamic and steady-state input-output (I/O) behaviors of covalent modification cycles (CMCs), which may or may not alter the activity of the protein.

1.2. Ultrasensitivity

Cell signaling networks display “ultrasensitivity” if small changes in input are amplified into much larger percentage changes in output [7,8]. An ultrasensitive I/O relationship is generally sigmoidal in shape and often approximated by a Hill function; the terminology suggests that an ultrasensitive response is steeper than the well-known hyperbolic trend of a Michaelian function [9,10]. Embedded in complex network structures such as feedback and feedforward loops, signal amplification is required for cells and organisms to achieve higher-order functions, including differentiation, proliferation, homeostasis, adaptation, and biological rhythms [11,12]. At least six major ultrasensitive response motifs (URM) have been identified in intracellular molecular networks, namely: (i) positive cooperative binding; (ii) homo-multimerization; (iii) multistep signaling; (iv) molecular titration; (v) zero-order CMCs; and (vi) positive feedback [12,13,14]. Each of these URMs has its own unique mechanism achieving signal amplification.

1.3. Ultrasensitivity through Zero-Order Covalent Modification Cycle

The ubiquitous zero-order CMC is particularly interesting, as it can generate nearly switch-like responses. A typical implementation is a modifying/demodifying cycle that is driven by PTMs involving phosphorylation, acetylation, oxidation, methylation, or sumoylation [15]. Specifically, protein activities can be regulated through covalent bonding of moieties to certain amino acid residues, such as phosphate to serine, threonine, and tyrosine in the case of phosphorylation, and an acetyl group to lysine in the case of acetylation. The local electrical charge, possibly accompanied by steric changes introduced by these moieties, can greatly affect the protein molecule’s interaction with other large or small molecules, thereby turning on or off the activity of the protein as an enzyme, transcription factor, or signaling molecule. Covalent modifications of proteins often require specific enzymes, such as kinases, acetyltransferases, methyltransferases, and oxidases, as well as counteracting (demodification) enzymes catalyzing the reverse reactions, such as phosphatases, deacetylases, demethylases, and reductases.
Signal amplification through CMCs was first predicted and analyzed with a mathematical model by Goldbeter and Koshland Jr. in the early 1980s [16,17]. It occurs when the two opposing enzymes driving the modification cycle of a protein are operating near saturation. In a phosphorylation–dephosphorylation cycle, for example, zero-order ultrasensitivity arises when the amount of protein substrate is at a concentration high enough to saturate the available kinase and phosphatase. Here, the terminology “protein substrate” is used to distinguish this protein from the involved enzymes. Under these conditions, small changes in the amount or activity of either the kinase or phosphatase can dramatically change the steady-state fraction of the amounts of phosphorylated or dephosphorylated substrates. Since the theoretical predictions by the Goldbeter–Koshland model, zero-order ultrasensitivity via covalent modification has been reported in numerous biological settings, in both prokaryotes and eukaryotes [18,19,20,21,22,23].

1.4. Caveat of the Goldbeter–Koshland Model Suggests a Mechanism of Signaling Control

One important conceptual simplification of the original Goldbeter–Koshland model is that the total abundance of the protein substrate in the CMC is regarded as constant, which ignores turnover via de novo protein synthesis and degradation. This omission is possibly critical in the context of protein signaling, as proteins are constantly synthesized and degraded. The assumption of constancy may largely be valid when the signaling events driven by PTM occur rapidly in comparison to the protein substrate turnover. However, even if signaling is fast, it is possible—and indeed a frequent observation as mentioned before—that the PTM alters the stability of the protein substrate, which secondarily affects the total amount of the protein substrate. We first reported that, due to the “leakiness” caused by protein turnover, zero-order ultrasensitivity is compromised when turnover is present, and that the steepness of the sigmoidal response deteriorates as the overall protein turnover rate increases [24]. More recently, Mallela et al. further elaborated on the importance of protein synthesis and turnover in affecting zero-order ultrasensitivity of CMCs, especially in the context of multiple PTM cascades sharing the same E3 ligase responsible for protein degradation [25]. Thus, the formerly simple results described by Goldbeter and Koshland are in truth more complicated, as they depend on the kinetic features of the involved enzymes, their saturation, and the degree of protein synthesis and turnover.
Here, we pursue the question how cells may use alternate PTM-induced changes in protein stability as an additional layer of control to modulate the zero-order ultrasensitive response of a CMC. In particular, we ask whether such modulations are sufficient to render or enhance ultrasensitivity by stabilizing the protein substrate, or diminish or destroy it by destabilizing the protein substrate. To answer these questions, we systematically study the governing kinetic features of the protein cycle one by one, with mathematical modeling, which allows us to modify many aspects or combinations of aspects of a protein signaling cycle with full knowledge of the system features and behaviors. We demonstrate that ultrasensitivity can be gained, enhanced, or attenuated for the modified, unmodified, and total protein substrates depending on the conditions affecting stability.

2. Methods

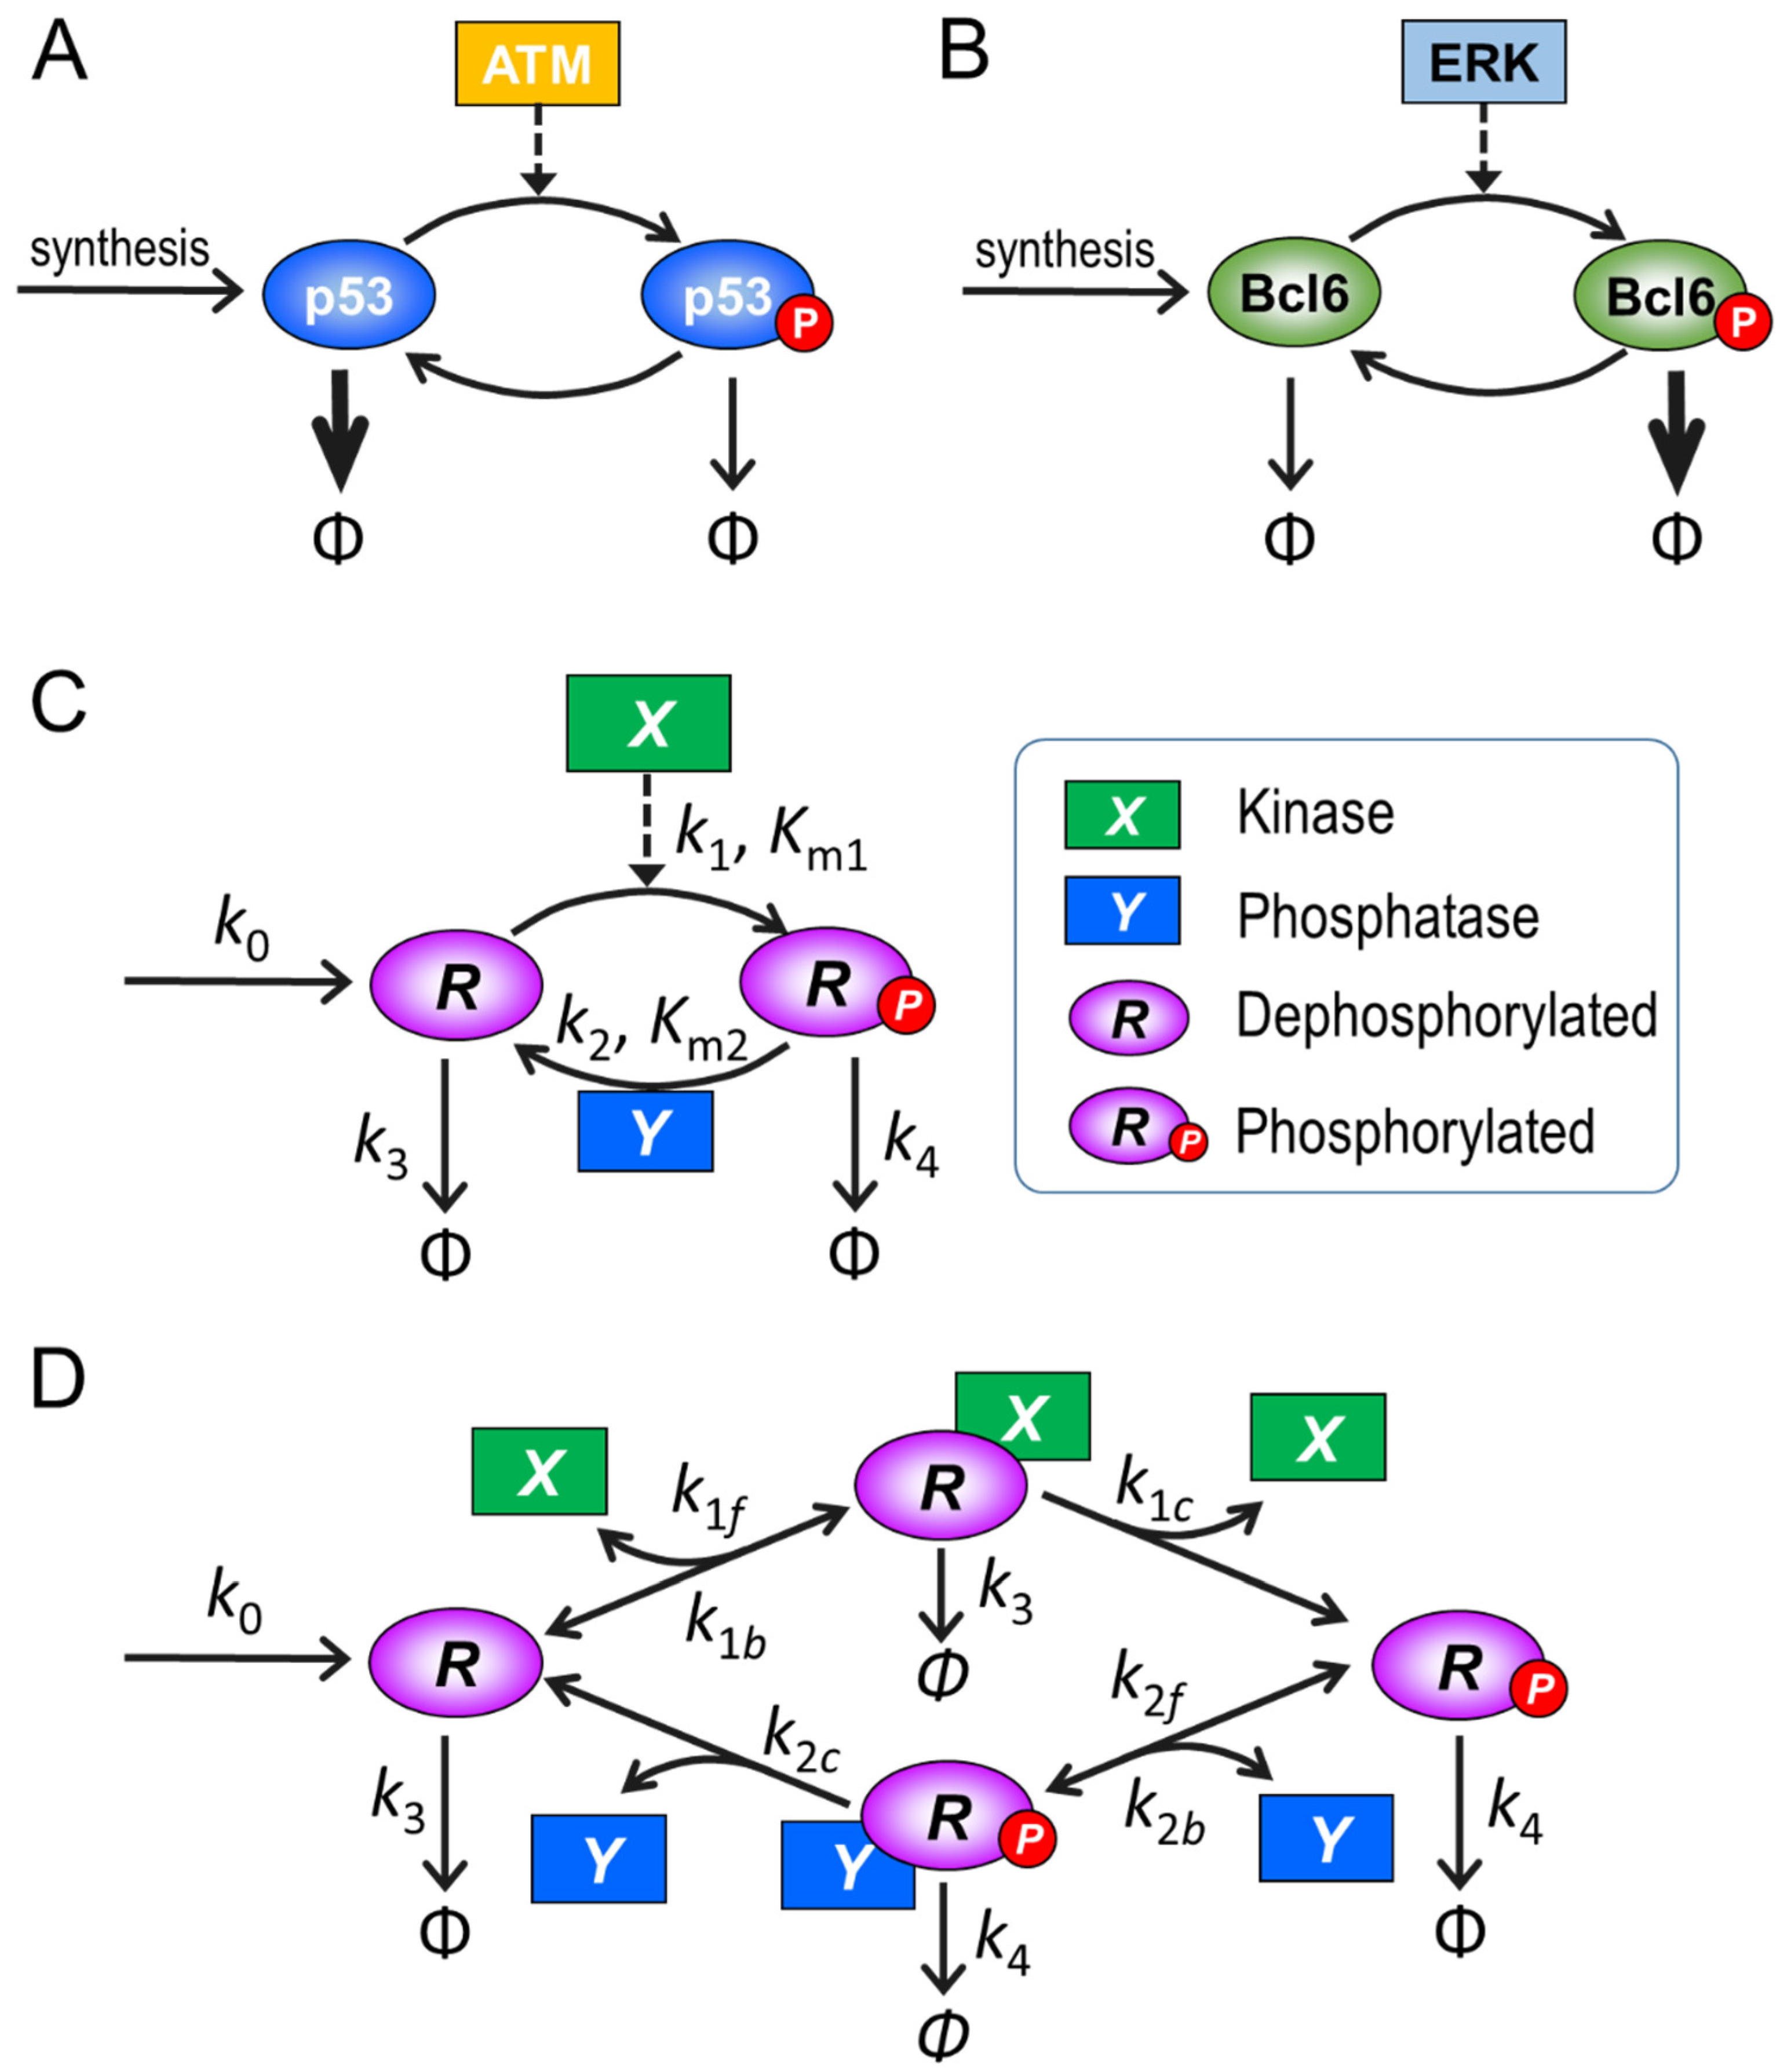
2.1. Model Structure and Parameterization

Our goal is to explore how the behavior of a CMC is affected if protein turnover, protein stability, and kinetic features of the governing enzymes are explicitly taken into account. For this exploration, we consider the generic signaling motif of a protein phosphorylation–dephosphorylation cycle (Figure 1C) as an “order-of-magnitude” model, i.e., a numerical model without absolutely precise determination of parameter values and with an expectation of qualitative, rather than quantitative results.
We started with a simple model consisting of two ordinary differential equations (ODEs), formulated in the tradition of mass-action and Michaelis–Menten (MM) kinetics:
d R d t = k 0 k 1 X × R ( K m 1 + R ) + k 2 Y × R p ( K m 2 + R p ) k 3 × R ,
d R p d t = k 1 X × R ( K m 1 + R ) k 2 Y × R p ( K m 2 + R p ) k 4 × R p
In the following, this model is referred to as the MM model. R is the protein substrate that is newly synthesized with rate k0. It can either be phosphorylated into Rp by a kinase X which, as a default, follows typical MM kinetics with Michaelis constant Km1 and maximal velocity Vmax1 = k1X, or it can be degraded with a first-order rate constant k3. Analogously, Rp can be dephosphorylated by a phosphatase Y that follows MM kinetics with a Michaelis constant Km2 and maximal velocity Vmax2 = k2Y. Rp can also be degraded, in this case with a first-order rate constant k4.
Default parameter values are presented in Table 1. Since covalent protein modifications such as phosphorylation and dephosphorylation occur rapidly, at the order of seconds to minutes, while protein degradation occurs at a much slower rate, often with half-lives at the order of hours, the time scales between these two types of processes are often clearly separated by two or more orders of magnitude. Accordingly, we set default values for k3 and k4 to be 1/100 of k1/Km1 and k2/Km2, respectively, because these two ratios approximate the apparent first-order time constants at which phosphorylation and dephosphorylation occur when the kinase and phosphatase are far from saturation. Unless otherwise specified, Y is kept constant with value 1.
It is well known that the MM kinetics is a simplification that approximates the full mass-action enzymatic kinetics with certain constrains [26]. These constraints include that the substrate exists in excess of the enzyme and the substrate–enzyme complex quickly reaches a quasi-steady state. In many cellular circumstances, some of the assumptions may not be valid. An example is the case where the substrate and enzyme are proteins with comparable concentrations [27,28]. Under conditions where the assumptions are not satisfied, the full kinetic model should be utilized. Indeed, it has been shown that implementing the full model can generate nonlinear dynamics that may be missed by simple MM kinetics [26,29]. To assess the role of these differences, we used the full kinetic model (Figure 1D and Table 2) to validate or refute the findings based on the approximating MM model. The ODEs for the full model are provided in the Supplemental Material. In this full model, we assume that R or Rp, complexed with their respective enzymes X or Y, can still be independently degraded like the respective free forms and with the same half-lives, and when they are destroyed, X and Y are released and recycled. That a protein component in a multimeric protein complex can be specifically targeted and degraded by the ubiquitination/proteasomal pathway has been well established [30,31,32]. This matter is discussed further in the Discussion section.

2.2. Metrics of Ultrasensitivity

Simulations start with the initial values of variables equal to the respective steady-state concentrations, which are achieved when X = 0 for the MM model or Xtot = 0 for the full model, where the initial values of Rp, RX, and RpY are always zero. For fair comparisons, all dose–response (DR) curves are obtained once the model has achieved steady state. The increment size of the input level of X is 1% within the dose range indicated. The degree of ultrasensitivity of a steady-state DR curve can be evaluated with two related metrics that are commonly used in the field. First, the Hill coefficient, nH, may be approximated from the equation
n H = ln 81 ln X 0.9 X 0.1
where X0.9 and X0.1 are the concentrations of X that produce 90% and 10%, respectively, of the maximal response (after subtracting the background response level when X = 0) [12]. nH represents the overall steepness or global degree of ultrasensitivity of the DR curve. Second, we evaluate the local response coefficient (LRC) of a DR curve by calculating all slopes of the curve on dual-log scales, which are equivalent to the ratios of the fractional change in response (R) to the fractional change in dose (D) [7]:
L R C = dln R dln D
The maximal |LRC| of a DR curve (|LRC|max) represents the maximal amplification capacity of the signaling motif. The comparison between nH and LRC is important as these quantities are not necessarily equivalent and they vary depending on the basal response level and the shape of the DR curve. Typical ultrasensitive responses have |nH| and |LRC|max values substantially above 1. However, if a DR curve is very sigmoidal with high |nH|, but its |LRC|max < 1, then there is no signal amplification, and higher-order cellular functions such as bistability, robust adaptation, and oscillation cannot be achieved [12,33,34]. Thus, nH alone can misrepresent the actual degree of signal amplification and must be cross-examined with LRC.

2.3. Simulation Tools

The models were coded in MATLAB (MathWorks, Natick, MA, USA) and all simulations were run with differential equation solver ode15s. The model codes in MATLAB format as well as in R format are available as additional Supplemental files and can also be accessed at the GitHub repository https://github.com/pulsatility/Effects-of-Protein-Stability-on-Ultrasensitivity.git, accessed on: 17 November 2021.

3. Results

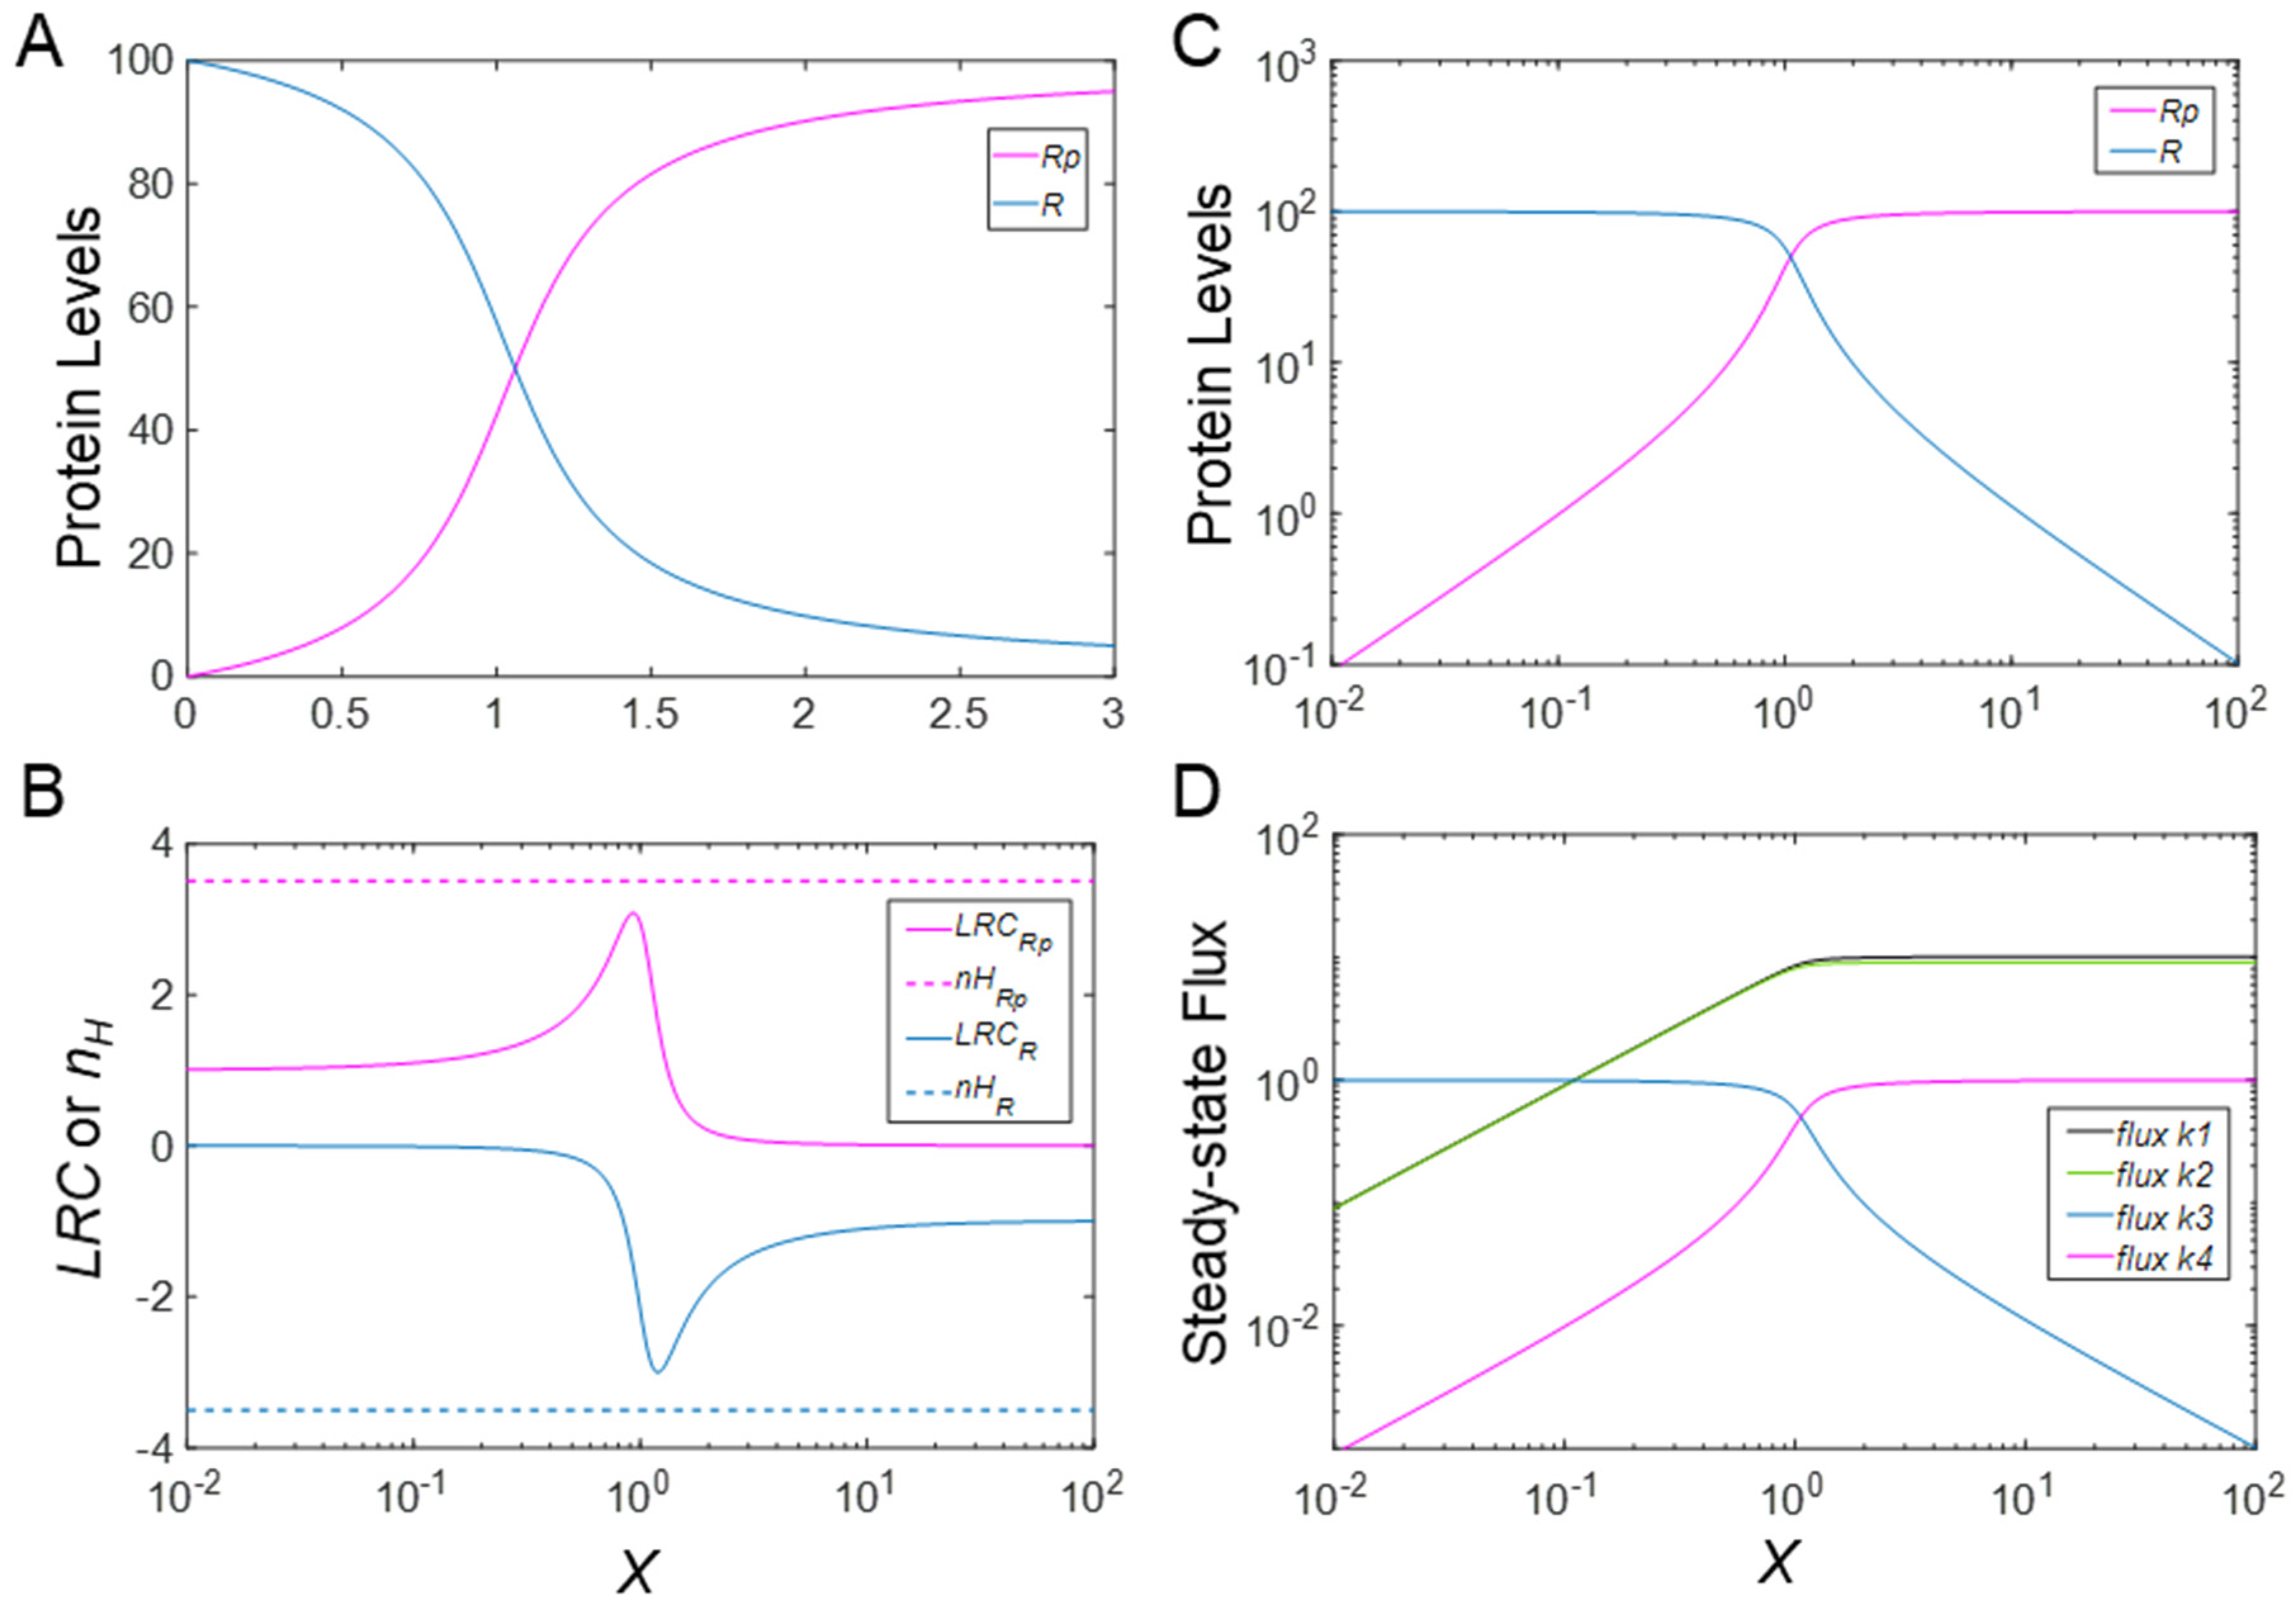
3.1. Ultrasensitivity in the Absence of PTM-Induced Changes in Protein Stability

To create a baseline, we start with the default setting k3 = k4 = 0.01, which reflects that the phosphorylation status of R does not affect its stability. As a consequence, the total steady-state protein substrate concentration Rtot (=R + Rp) remains constant even if the activity of the kinase X varies. Additionally, the k3 and k4 values are very small in comparison to k1 and k2. Since Rtot typically exceeds Km1 and Km2 by 10-fold or more, and as expected for the CMC motif, the steady-state DR curves of R vs. X and Rp vs. X are sigmoidal on the linear scale (Figure 2A) with nH at −3.51 and 3.51, respectively (Figure 2B); the negative sign for nH indicates a decreasing or inhibitory response. On a log scale, the quasi-exponential rise in Rp and decay of R flatten toward straight lines (Figure 2C).
The degree of local ultrasensitivity, as measured by LRC, varies across the range of X and peaks in the center of the DR curves at approximately −3.0 and +3.1 for R and Rp, respectively (Figure 2B). Thus, |nH| in this case is a slight overestimate of the corresponding |LRC|max. The phosphorylation and dephosphorylation fluxes (with rates k1 and k2, respectively) are dominant over the relatively small protein turnover fluxes with rates k3 and k4 at the steady state for large input values of X (Figure 2D). In a logarithmic representation, these MM fluxes increase essentially linearly as X increases before approaching plateaus (Figure 2D). When protein production and degradation are considered negligible, by setting k0, k3 and k4 to zero, the ultrasensitive responses are slightly enhanced, and the Hill coefficients and (|LRC|max rise in magnitude to 3.74 and 3.45 for Rp and −3.74 and −3.34 for R (simulation results not shown).

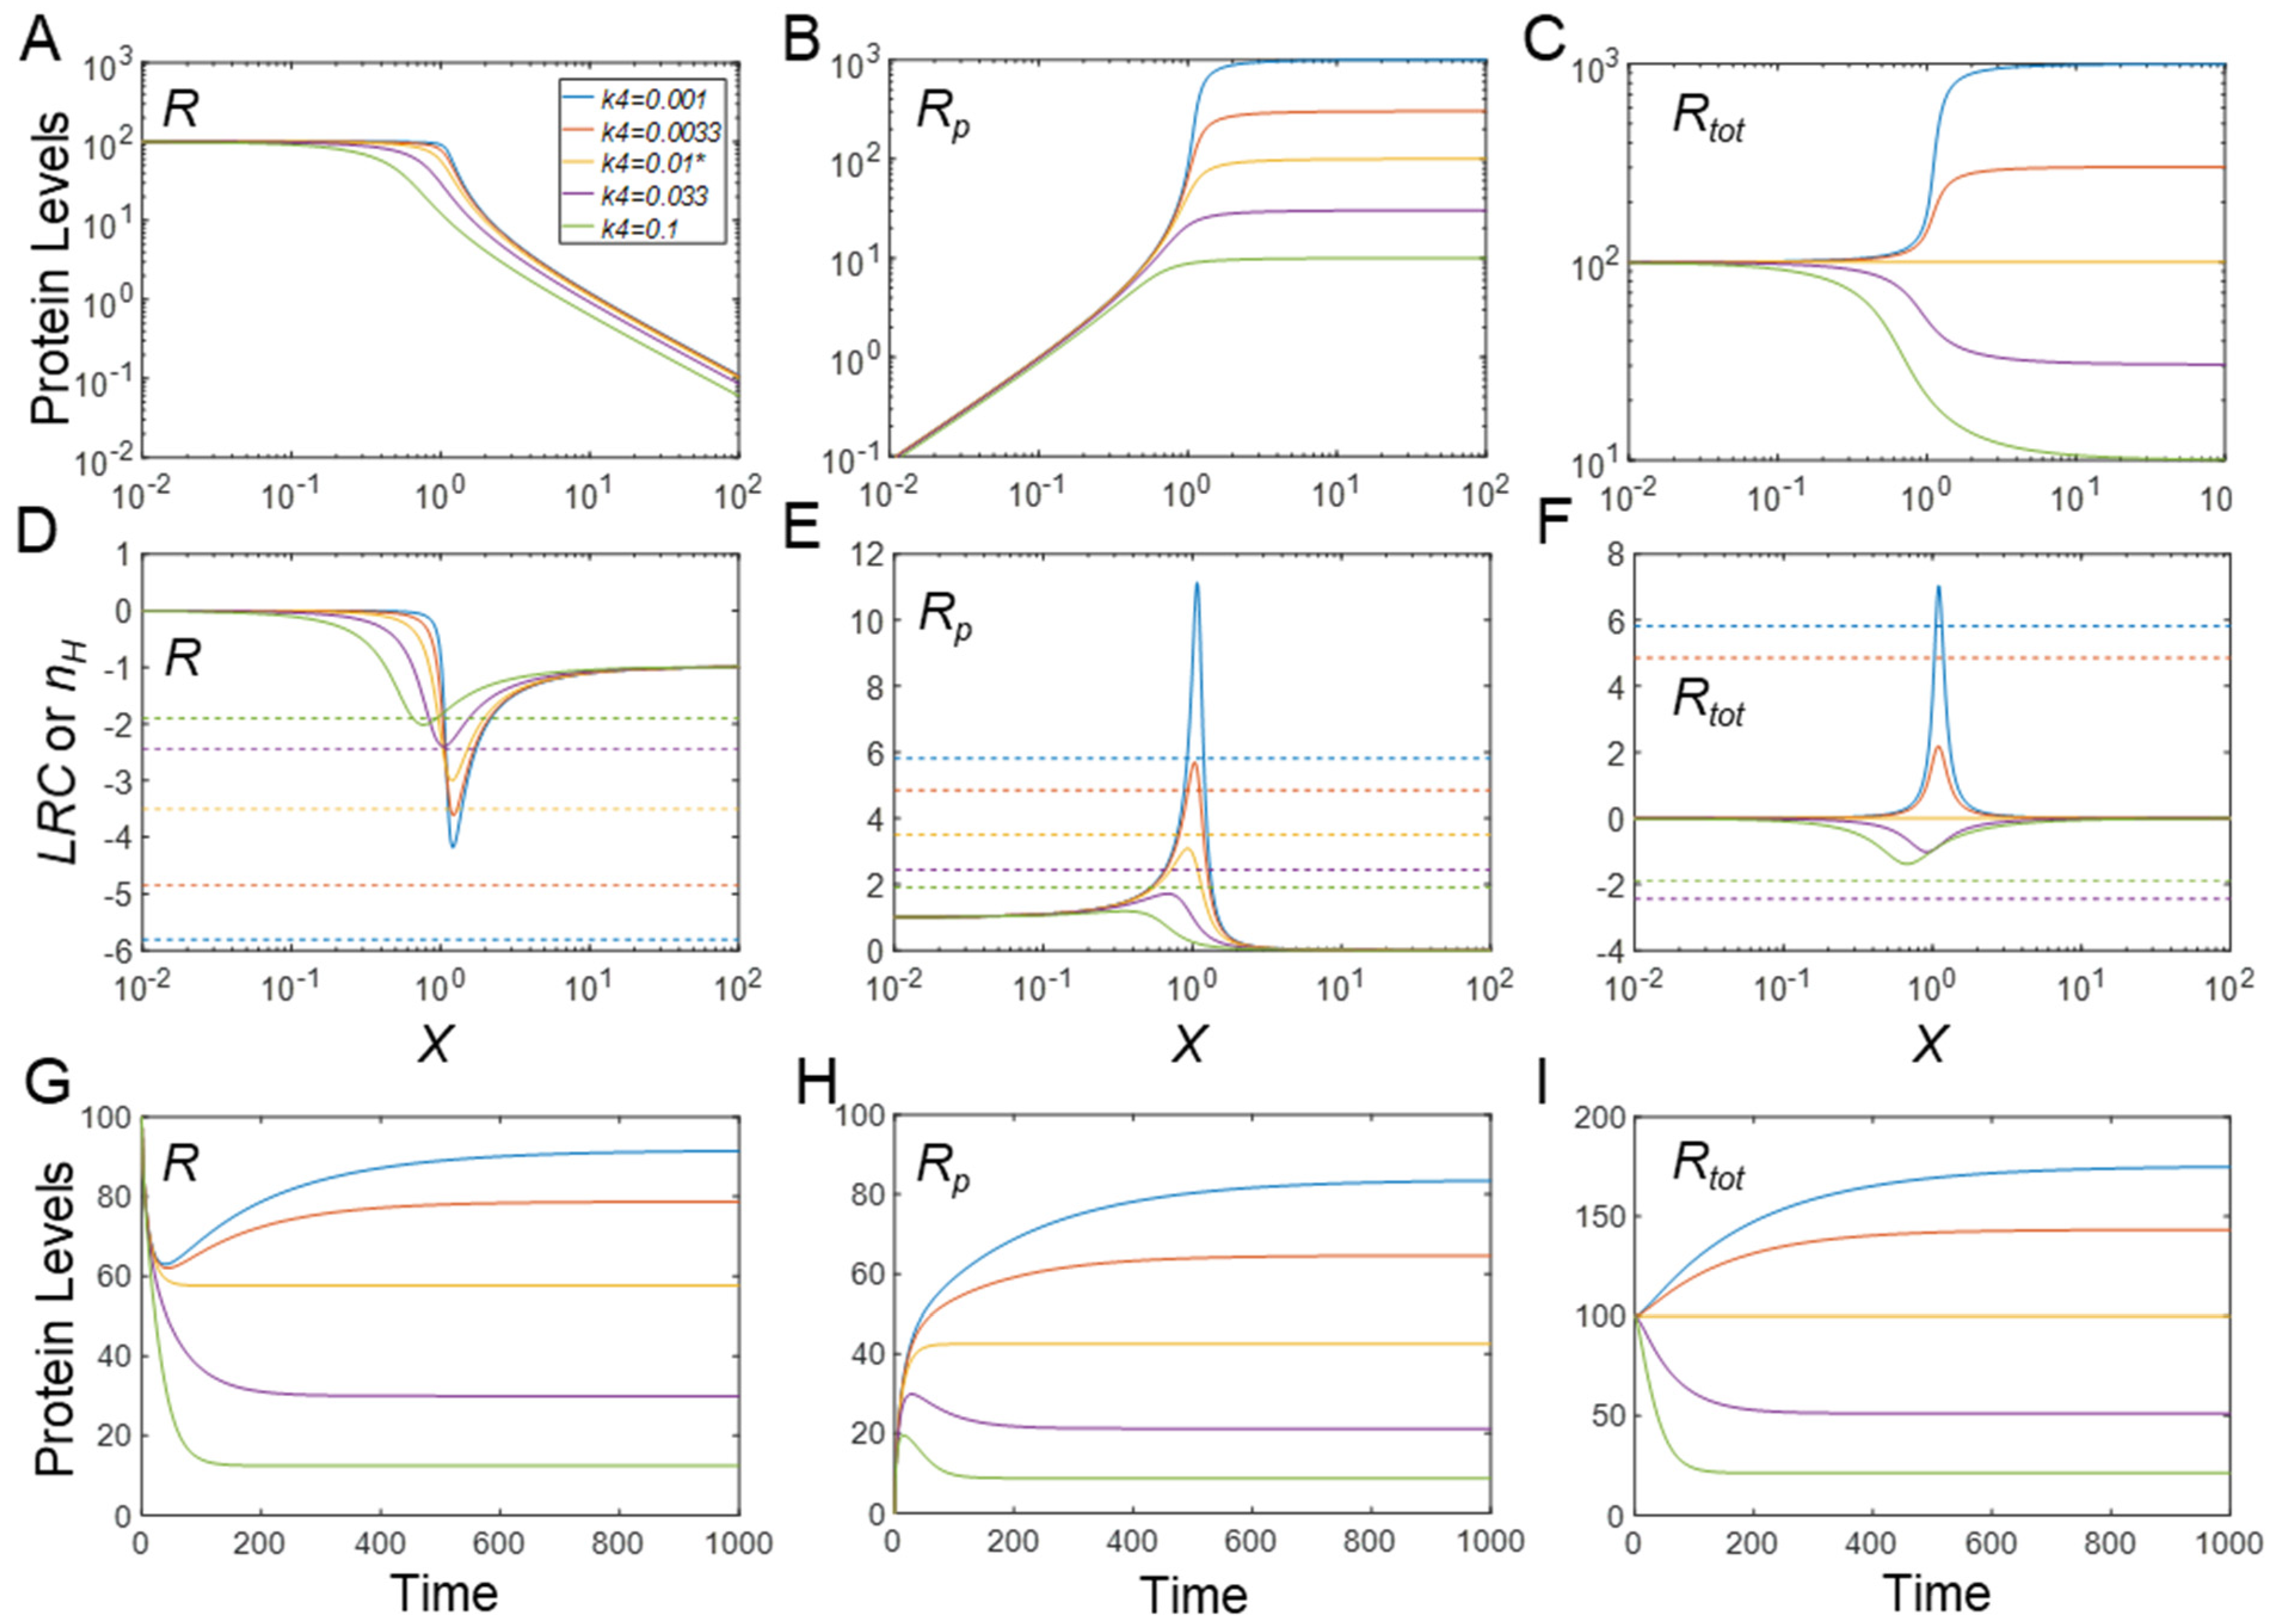
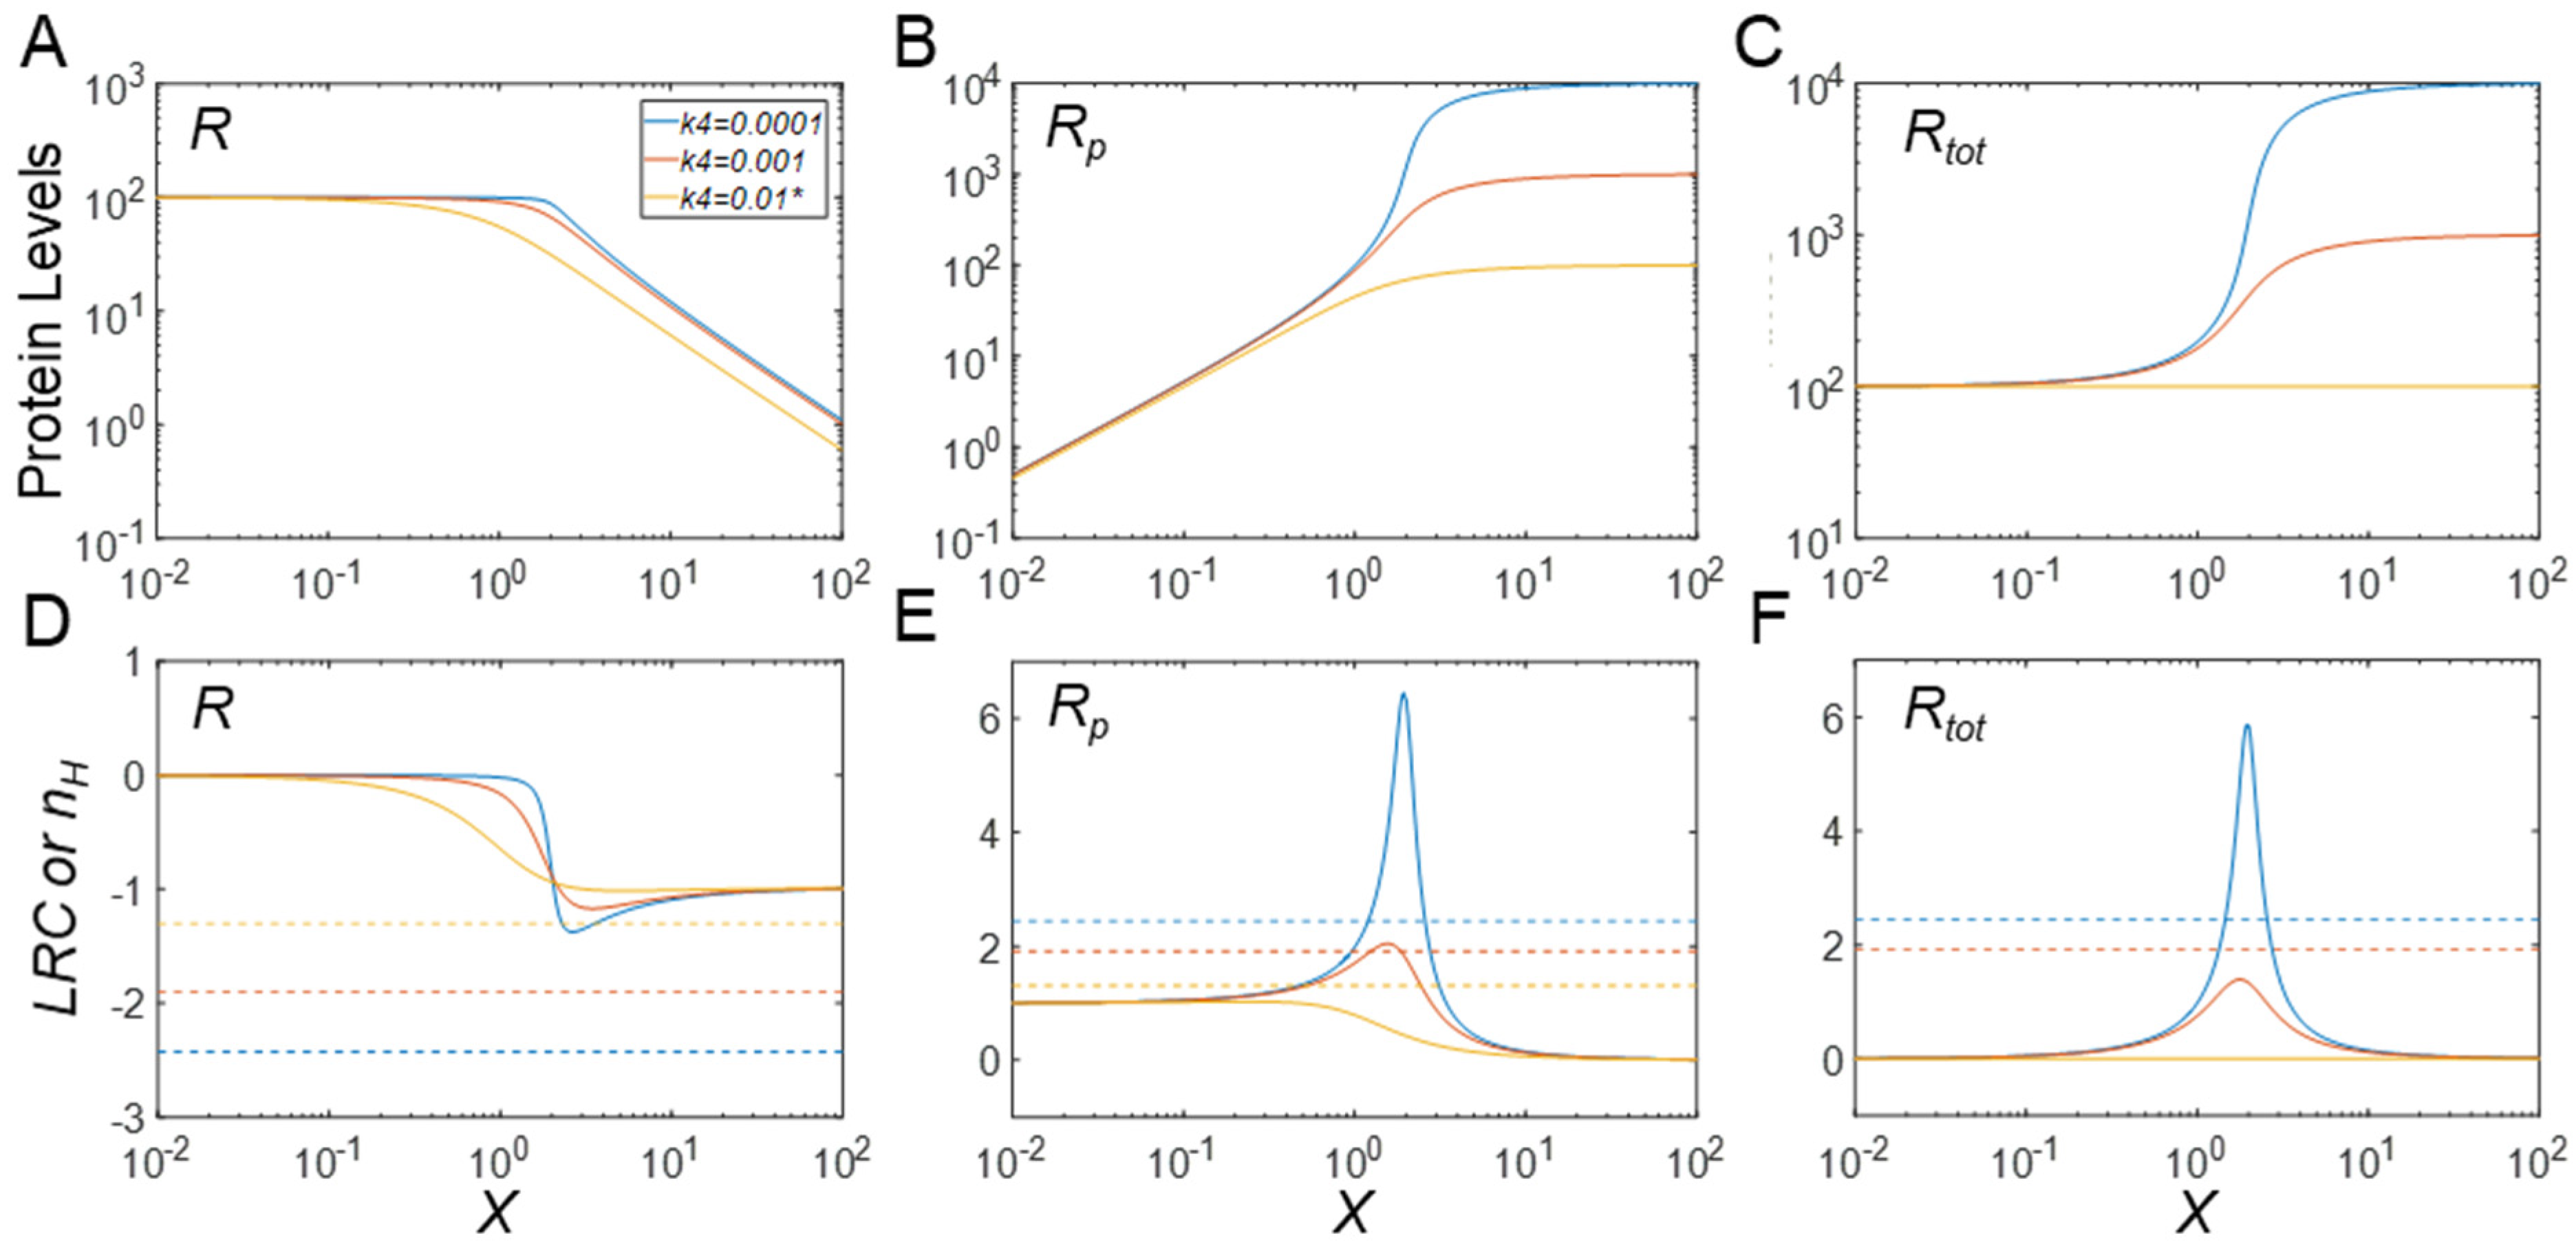
3.2. Effects of Protein Stability on Ultrasensitivity

In this section, we suppose that changes in the stability of Rp can be introduced by the PTM, and thus by means of the kinase X, as it has been observed numerous times [1,3,4,5,6]. When the protein substrate R is phosphorylated to Rp, the stability of Rp is affected, which translates into an increasing or decreasing rate of degradation, k4. In particular, if the PTM stabilizes Rp, i.e., k4 decreases, the amount of Rp increases, and Rtot is expected to increase accordingly. This rise in Rtot secondarily alters the degree of saturation of the phosphorylation and dephosphorylation reactions and, consequently, is expected to affect the degree of ultrasensitivity in the DR curves. These overall effects could theoretically also be caused by changes in k3, but we focus on k4 because the PTM directly affects the stability of Rp, whereas R is affected only in a secondary manner.

3.2.1. Effects on Steady-State R

When the PTM increases the stability of Rp, i.e., k4 decreases, the steady−state DR curves of R vs. X (Figure 3A) and Rp vs. X (Figure 3B) both become steeper; conversely, when the stability of Rp decreases, i.e., k4 increases, the two curves become shallower. The changes in the steepness of the DR curves can be quantified by nH as well as the maximal local ultrasensitivity, |LRC|max. Both increase as k4 decreases (Figure 3D,E). Interestingly, however, for k4 values comparable to or below the default value, |LRC|max is generally lower than |nH| for the R vs. X response, which is an indication that the Hill coefficient overestimates the maximal degree of signal amplification in these situations (Figure 3D). For k4 values rising above the default value, |LRC|max starts to match up with |nH| and eventually exceeds it. For very large k4 values, |nH| approaches a constant value of approximately 1.58 and |LRC|max approaches a constant value of approximately 1.72. Thus, there is still ultrasensitivity, but its degree is modest. The value of the kinase activity X at which |LRC| is maximal shifts to the left as k4 increases.

3.2.2. Effects on Steady-State Rp

The elevated steepness of the Rp vs. X response, with increased stability of Rp, is evidently due to the increasing maximal Rp level when k4 decreases (Figure 3B). Interestingly, and contrary to the effect on the response of R vs. X, LRCmax is generally higher than nH for k4 values below the default value, indicating that the Hill coefficient is underestimating the maximal degree of signal amplification (Figure 3E). For k4 values higher than the default value, LRCmax starts to match nH and eventually drops below its value. For very large k4 values, nH approaches 1.58, whereas LRCmax settles at approximately 1. The value of kinase activity X for which LRC is maximal shifts to the left as k4 increases.

3.2.3. Effects on Steady-State Rtot

In the Goldbeter–Koshland model of the CMC, either R or Rp is regarded as the output, because the activities of either one may change by the phosphorylation status. However, in some situations, the covalent modification status of an amino acid residue may only affect protein stability without affecting protein activity [35,36]. In these cases, Rtot should be viewed as the output. Depending on the values of k4, the response of Rtot vs. X can be either stimulatory or inhibitory (Figure 3C), because either more or less Rp is removed from the system. At the default level of k4, which is equal to k3, Rtot does not change with X. However, as the PTM stabilizes Rp, i.e., k4 decreases from the default value, the steady-state response of Rtot vs. X increases monotonically to a higher plateau than before and also becomes increasingly steeper, with LRCmax surpassing nH for very low k4 values (Figure 3F). Conversely, as the PTM destabilizes Rp, the steady-state response of Rtot vs. X decreases monotonically toward a lower plateau and also becomes increasingly more sigmoidal (despite that the response of Rp itself is no longer ultrasensitive), with |LRC|max approaching 1.72 for very high k4 values. Surprisingly, |nH| changes in the opposite direction to |LRC|max for k4 values above the default value (Figure 3F). A small increase in k4 above the default value first results in a very high |nH|, but as k4 increases further, |nH| drops back and approaches 1.58. This inverse relationship between |LRC|max and |nH| demonstrates again that these two metrics do not always conform to each other and that reliance on the Hill coefficient as an estimate of the degree of signal amplification can be misleading. In summary, both stabilization and destabilization of Rp can lead to the enhancement of ultrasensitivity in the steady-state response curve of Rtot vs. X.
While Rp and R are expected to exhibit ultrasensitivity due to the zero-order covalent modification effect, as revealed by the Goldbeter–Koshland model, it is interesting to note that Rtot also exhibits various degrees of ultrasensitivity depending on the value of k4, i.e., the stability of Rp. To dissect this mechanism leading to ultrasensitivity for Rtot, we use the following two steady-state flux and mass conservation equations to solve for Rtot:
k 0 = k 3 R + k 4 R P
R t o t = R + R p
By substituting either R or Rp from Equation (5) in Equation (6), we obtain two equations that exhibit symmetry with respect to k3 and k4, namely
R t o t = k 0 k 3 + ( 1 k 4 k 3 ) R P
R t o t = k 0 k 4 + ( 1 k 3 k 4 ) R
The equations say that except for cases where k3 and k4 are equal, the steady-state Rtot scales linearly with both Rp or R. When k3 > k4, i.e., phosphorylation results in Rp stabilization, Rtot has a basal level determined by k0/k3 and increases as Rp increases (Equation (7)). For very small k4, Rtotk0/k3 + Rp. Since the response curve Rp vs. X is always monotonically increasing (Figure 3B), its ultrasensitivity is passed to Rtot with comparable nH values. By contrast, the LRC of the Rtot response will be lower than that of the Rp response due to the presence of the basal level at k0/k3 (Figure 3E vs. Figure 3F). Conversely, if phosphorylation results in Rp destabilization, i.e., k3 < k4, Rtot has a minimal level determined by k0/k4 (Equation (8)). For very large k4, Rtotk0/k4 + R. Since the response curve of R vs. X is always monotonically decreasing (Figure 3A), its ultrasensitivity is passed to Rtot with comparable nH values, and again, the |LRC| of the Rtot response is lower than that of the R response, due to the presence of the minimal level k0/k4 (Figure 3D vs. Figure 3F).

3.2.4. Effects on Timing of Signaling

PTMs can have an effect on the timing of signaling. When they induce changes in protein stability, the time it takes the signaling motif to reach steady state in response to X is no longer determined only by the covalent modification reactions, but also by the half-lives of the protein substrate. Not surprisingly, for k4 lower than the default value, it takes much longer time for R, Rp and Rtot to reach their steady state (Figure 3G–I). The trajectory of R is nonmonotonic—it first decreases quickly as a result of the phosphorylation of pre-existing R and then rises slowly (because Rtot increases) to settle at a new steady state (Figure 3G). In comparison, Rp first shoots up quickly as a result of the phosphorylation of pre-existing R into Rp, and then rises slowly toward its new steady state (Figure 3H). Rtot does not exhibit a biphasic trend and instead increases gradually toward its new steady state (Figure 3I). For k4 higher than the default value, the time it takes to reach the steady state does not appear to be monotonically correlated with k4 (Figure 3G–I). For k4 values slightly higher than k3, the differential stability of R and Rp causes the system to approach the steady state slowly because the protein half-life, rather than the fast MM reactions, dominates the long-term kinetics (Figure 3G,H, purple vs. orange lines). However, as k4 increases further, the responses are overall faster since the overall protein half-life becomes shorter (Figure 3G–I, green vs. purple lines). Generally, R first decreases quickly as a result of phosphorylation of pre-existing R and then continues to decrease till it settles to a new steady state (Figure 3G). In comparison, Rp exhibits a nonmonotonic trajectory—it first rises quickly as a result of phosphorylation of pre-existing R into Rp, and then decreases (because Rtot decreases) slowly to settle at a new steady state (Figure 3H). Rtot has a similar monotonically decreasing profile as R (Figure 3I).

3.2.5. Behaviors of the Full Model

For the full model, the steady-state DR behavior of R, Rp and free Rtot (R + Rp) with respect to Xtot (the input parameter of the full model) and their dynamical responses are nearly identical to the simple MM model (simulation results not shown), indicating that the enhancement of ultrasensitivity by protein stabilization is a robust feature that is insensitive to implementation details under the current parameter conditions where the protein substrate is in excess of the enzymes (i.e., for the default setting Rtot = 100 vs. Ytot = 1). While such strong differences in molecular abundances may be encountered in cell signaling and metabolic pathways, this situation is not general. Instead, the covalent modification enzymes may be at comparable levels to their protein substrates including those involved in the MAPK signaling cascade [27,28], suggesting for simulation use of the full model rather than the simplifying MM model. In particular, the apparent Michaelis constants Km1 and Km2 are substituted with their original definitions as (k1b + k1c)/k1f and (k2b + k2c)/k2f, respectively. The consequence of increasing the enzyme level is shown in Figure 4: increasing Ytot to 100, up to a point where Ytot = Rtot, markedly weakens the degree of ultrasensitivity. Absent PTM-induced changes in Rp stability, both R and Rp are now only marginally ultrasensitive in response to Xtot (Figure 4A,B,D,E). However, when stabilization of Rp occurs with lower k4 values, the ultrasensitivity of Rp is enhanced to some extent while the ultrasensitivity of R remains basically unchanged. Compared with the MM model (Figure 3 B,E), the enhancement of the ultrasensitivity of Rp in the full model is not as strong. The reason is that the increase in the total protein substrate abundance, which can be achieved due to stabilization of Rp in the full model, is not as high as can be achieved in the MM model. In the full model, a significant amount of R is titrated in the complex with enzyme X and thus not stabilized. As a result, the total protein substrate, including free substrates and substrates complexed with the two enzymes, only approaches 2.3-fold of the basal level when k4 is decreased by 10-fold from the default value (results not shown), in contrast to the 10-fold increase in the MM model (Figure 3C). Interestingly, when free Rtot (R + Rp) is considered as the model output, it exhibits a monotonically decreasing but slightly ultrasensitive DR relationship at the default k4 value (Figure 4C). This outcome occurs because of sequestration of R and Rp by the enzymes X and Y, respectively, as Xtot increases. More interestingly, with stabilization of Rp where k4 value is further lowered, a nonmonotonic DR curve for free Rtot emerges, which results from a rising total abundance of the protein substrate due to stabilization at higher Xtot levels. When destabilization of Rp occurs, the DR profile of free Rtot follows R, the dominant free form, which is monotonically decreasing.

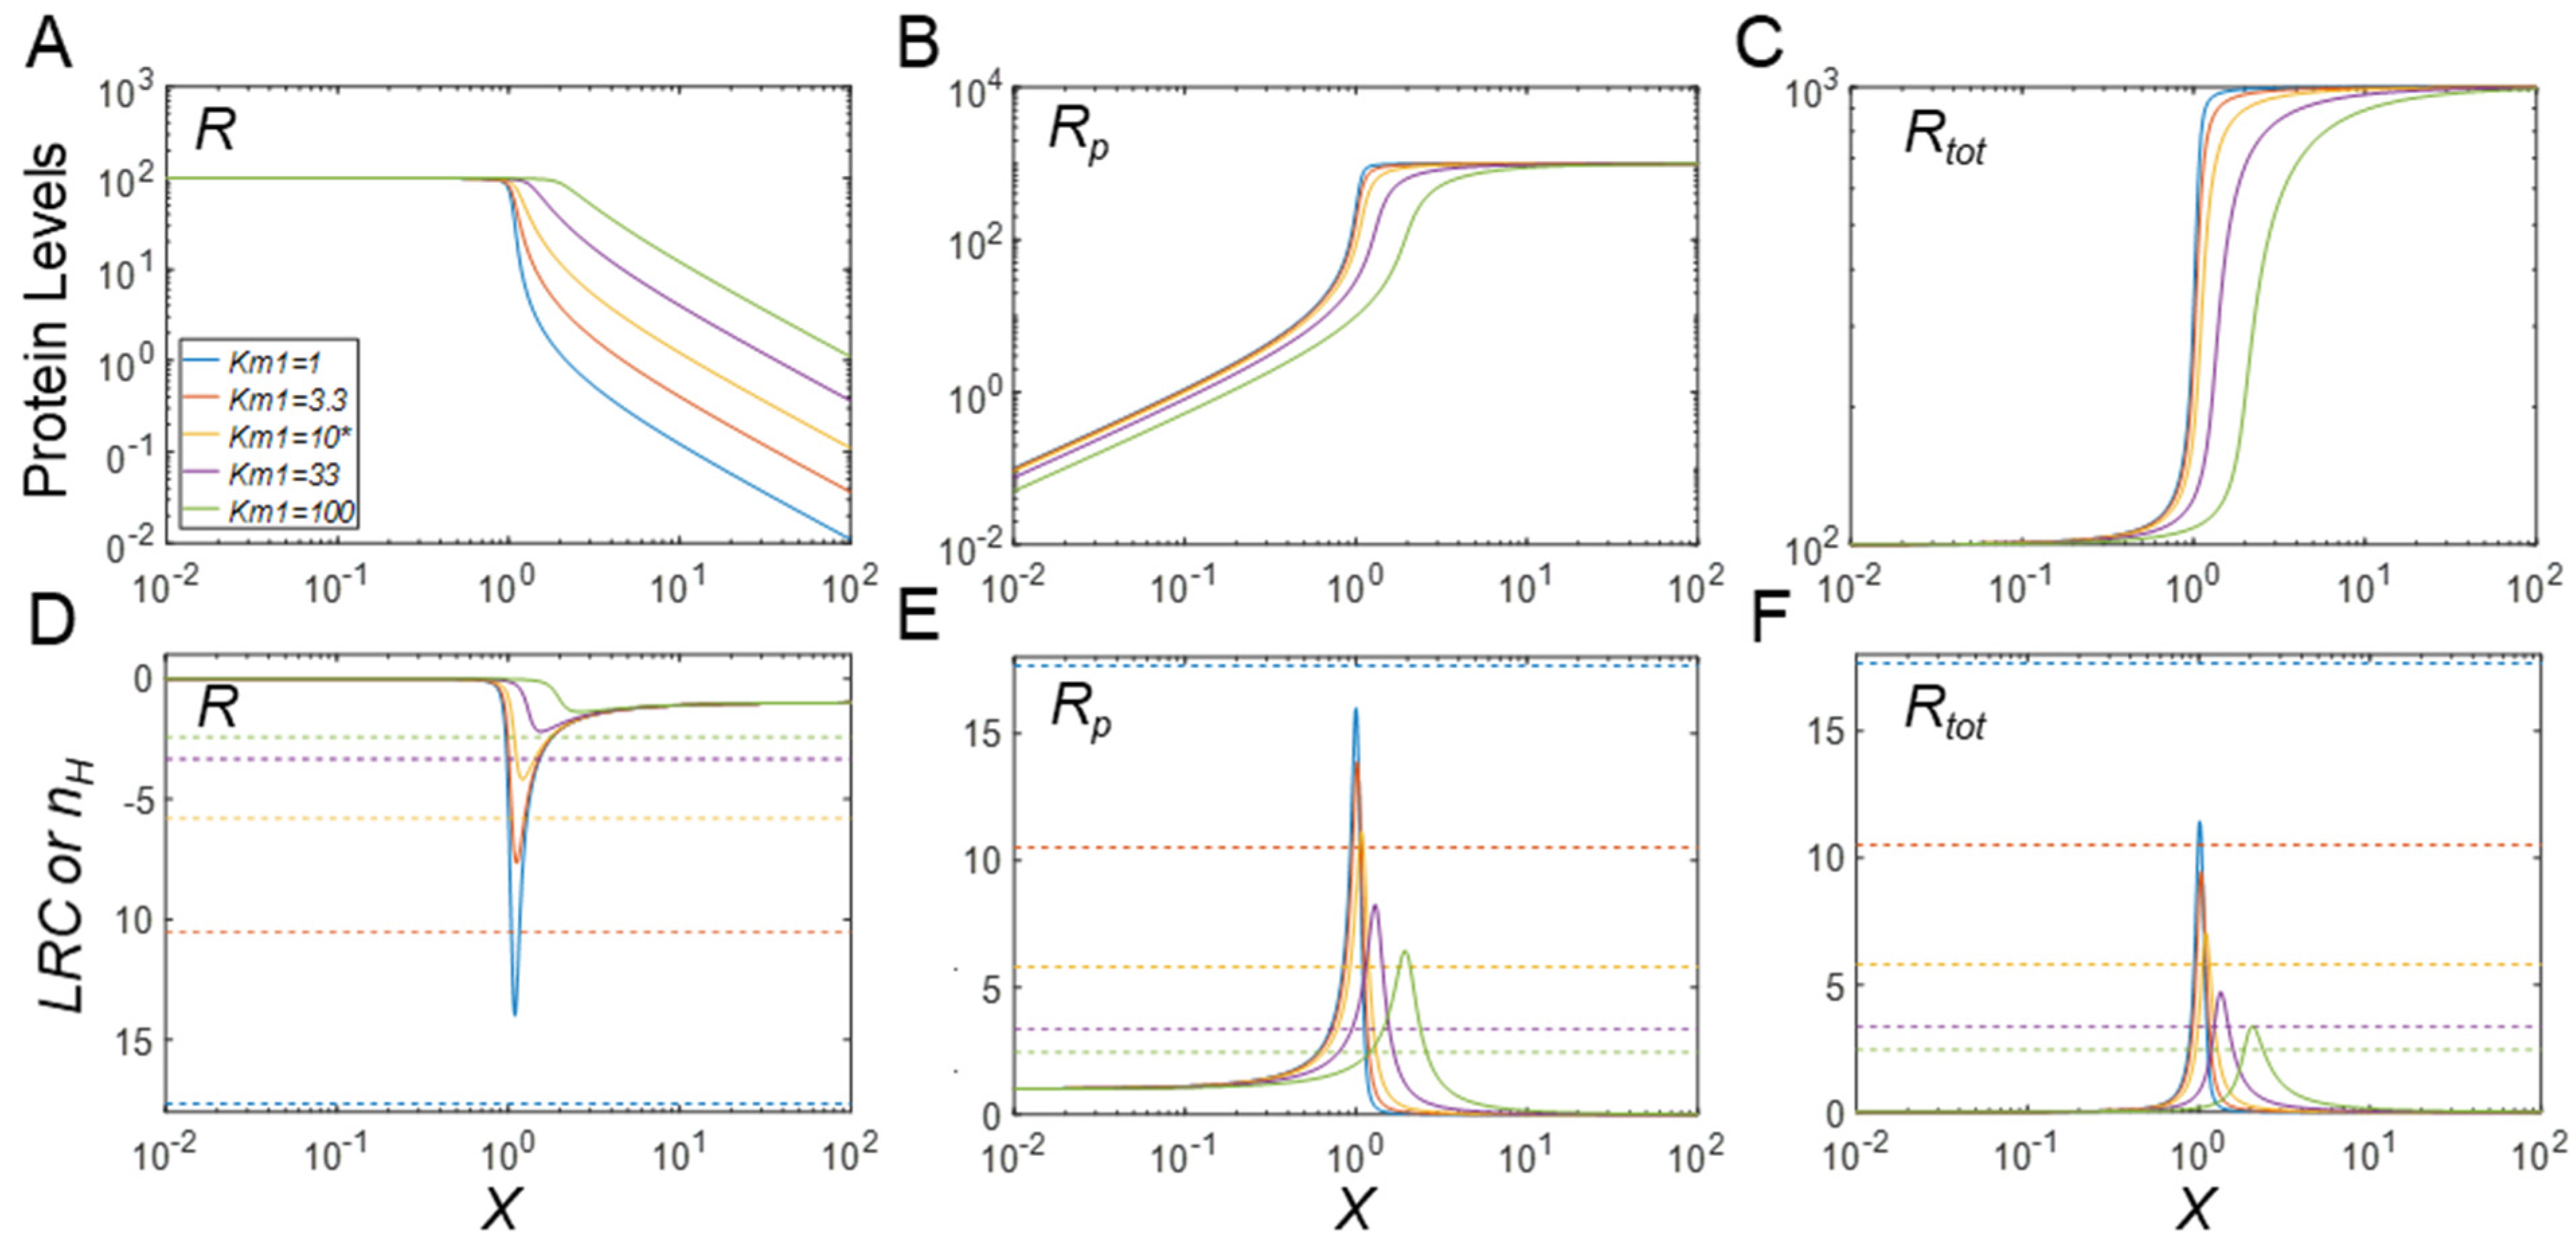
3.3. Protein Stabilization Can Lead to Emergence of Ultrasensitivity

As we demonstrated for a CMC with pre-existing ultrasensitivity, stabilization of Rp can enhance the degree of ultrasensitivity of the responses. In this section, we explore the possibility that stabilization of Rp can render a formerly non-ultrasensitive CMC ultrasensitive. To demonstrate this possibility, we first eliminate ultrasensitivity by raising the default values of the Michaelis constants 10-fold, such that in the MM model Km1 = Km2 = 100, a value that is the same as the substrate Rtot level with the default value of k4 at 0.01. As a result, the cycle no longer exhibits ultrasensitivity (Figure 5A–C), as evaluated by |LRC|max (Figure 5D–F). Starting with this new baseline, we now let k4 decrease below 0.01, which causes Rp to be more stable than R. Indeed, the responses, especially the steady-state DR curves for Rp vs. X and Rtot vs. X, all begin to show a trend toward ultrasensitivity, as the total protein substrate level approaches and eventually surpasses the Michaelis constants Km1 and Km2, thereby pushing the phosphorylation and dephosphorylation cycle toward saturation (Figure 5A–C). These results demonstrate that ultrasensitivity can emerge de novo with PTM-induced protein stabilization.
For comparison, we used the full model to validate the results of the simple MM model. Again, we eliminated ultrasensitivity by setting apparent Km1 = Km2 = 100, which was accomplished by increasing the values of both k1b and k2b to 990. With these settings, simulations show results that are nearly identical to those of the simple MM model; in particular, ultrasensitivity emerges for both free Rp and free Rtot (Figure S1). We also explored the situation where ultrasensitivity is eliminated from the full model by increasing the phosphatase Ytot level. When Ytot is gradually increased to 300, the ultrasensitivity of Rp basically disappears (Figure S2B). At this new baseline level, Ytot has a value 3 times the basal Rtot level. If k4 is now decreased to mimic stabilization of Rp, ultrasensitivity re-emerges for Rp, albeit only marginally, as indicated by |LRC|max (Figure S2B). The R response is also ultrasensitive but the degree is not affected by k4 (Figure S2A). Free Rtot exhibits a similar DR profile and ultrasensitivity as R (Figure S2C).

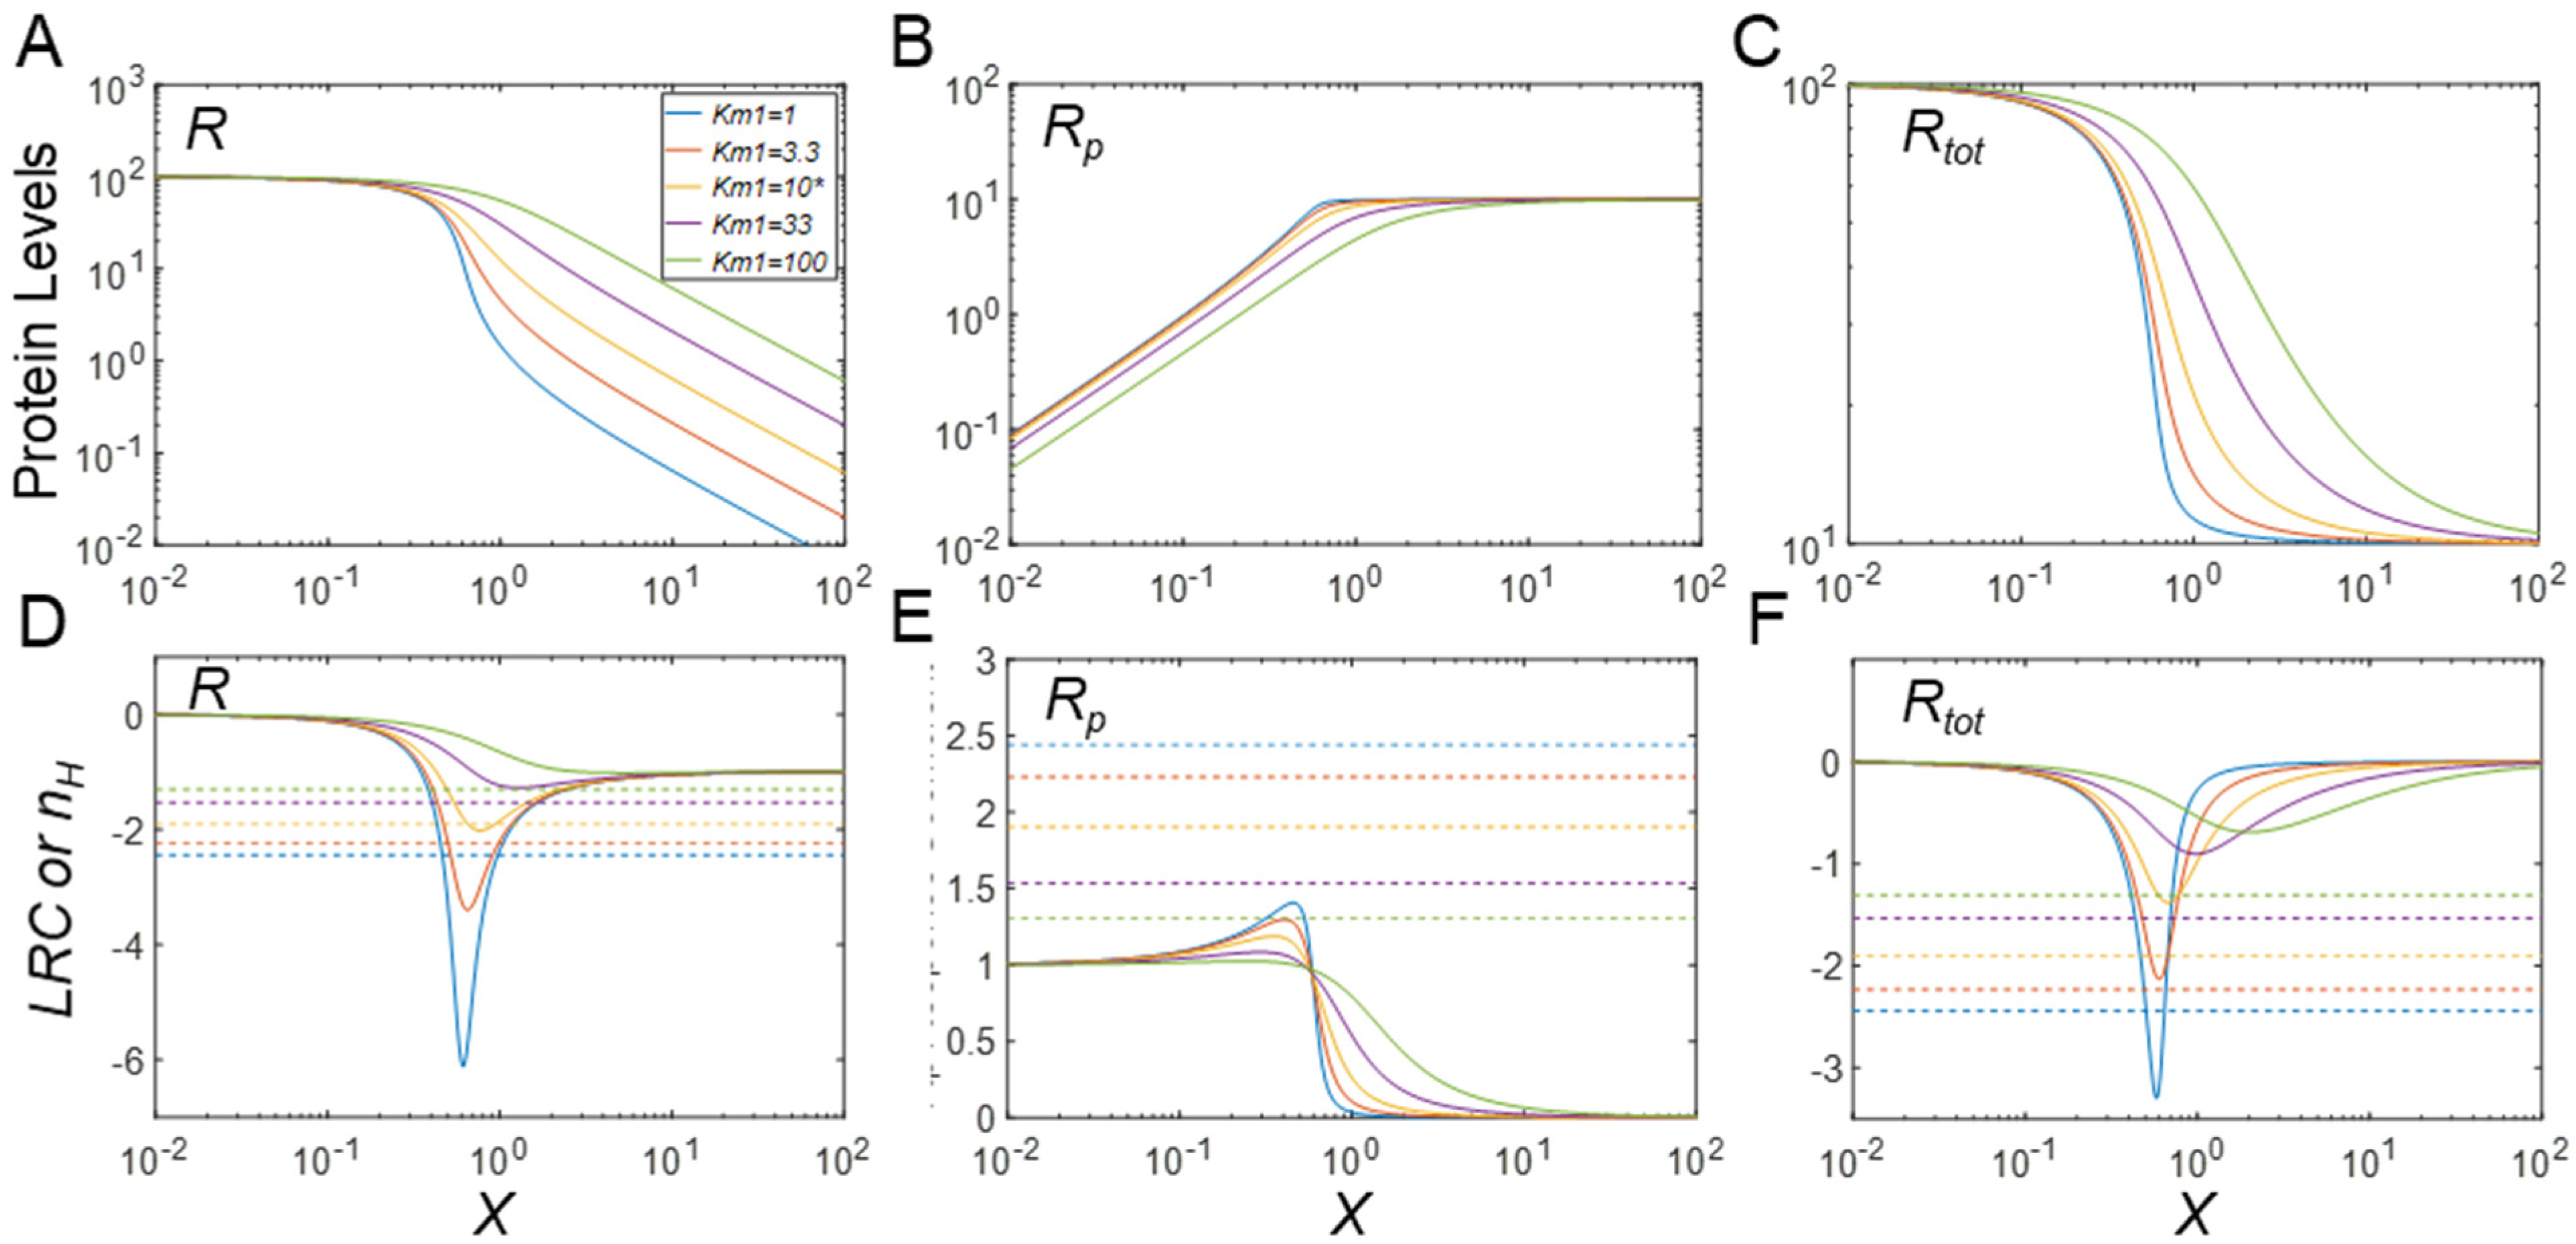
3.4. Regulation of Protein Modification Cycles through Alterations in Enzyme Features

Given the important role of enzyme saturation by the substrate in CMC-mediated ultrasensitivity, we explore further in this section whether changes in the kinetic features of the modifying or demodifying enzymes can modulate the DR curves and their ultrasensitivity. Specifically, we investigate how changes in the Michaelis constants Km1 and Km2 modulate the steady-state DR curves and their ultrasensitivity. As a first example, we consider Km1 and examine the case where phosphorylation of R to Rp results in destabilization, using as the baseline k4 = 0.1, which is 10-fold greater than k3. As Km1 decreases, the DR curves for R and Rtot in the MM model become increasingly more sigmoidal (Figure 6A,C), with limited changes in the Rp responses (Figure 6B). For low Km1 values, |LRC|max can be much greater than |nH|, whereas for high Km1 values, |nH| approaches 1.12, and |LRC|max approaches 1, indicating loss of ultrasensitivity (Figure 6A,D). For the Rp response, increasing Km1 reduces the steepness of the DR curve with |nH| approaching 1.25, and ultrasensitivity is lost for high Km1 values as indicated by |LRC| below 1 (Figure 6B,E). Lastly, increasing Km1 reduces the steepness of the DR curve for Rtot with |nH| approaching 1.25, and ultrasensitivity is lost for high Km1 values as indicated by |LRC| below 1 (Figure 6C,F). Varying the Michaelis constant Km2 of the phosphatase has a similar effect on ultrasensitivity (Figure S3). The full model produces very similar responses when the apparent Km1 is varied by either changing k1f or k1b, even for the situation where the basal substrate and enzyme levels are comparable (e.g., Ytot = 100; simulation results not shown).
The rationale for a second analysis is the situation where phosphorylation of R into Rp results in strong protein stabilization (k4 = 0.001, 10-fold lower than k3). When Km1 decreases below its baseline value of 10 in this situation in the MM model, the DR curves for R, Rp and Rtot become increasingly sigmoidal. For the response of R, |nH| obviously overestimates the degree of ultrasensitivity as evaluated by |LRC|max (Figure 7A,D). By contrast, for high Km1 values, |nH| approaches 1.93, and |LRC|max approaches 1, indicating loss of true ultrasensitivity. For the Rp response, increasing Km1 reduces the steepness of the DR curve with |nH| approaching 2.61, and |LRC|max is reduced to 4.97 with some, but not a complete loss of ultrasensitivity (Figure 7B,E). Except for very high Km1 values, |LRC|max is generally higher than |nH|. The reason that large Km1 values do not result in complete loss of ultrasensitivity is that Km2 is still kept at default value of 10, thus keeping the dephosphorylation step close to saturable. Lastly, increasing Km1 reduces the steepness of the DR curve for Rp with |nH| approaching 2.61, while |LRC|max is reduced to 2.34 with some loss of ultrasensitivity (Figure 7C,F). Except for very low Km1 values, |LRC|max is generally higher than |nH|. Varying Km2 has a similar effect on ultrasensitivity (Figure S4). The full model produces very similar responses when the apparent Km1 is varied by either changing k1f or k1b (simulation results not shown). For the condition when the basal substrate and enzyme levels are comparable by setting Ytot = 100, the degree of ultrasensitivity of the R and Rp responses is generally lower, but still increases as the apparent Km1 decreases. However, similar to Figure 4C, nonmonotonic dose response emerges for free Rtot (simulation results not shown). The response patterns of ultrasensitivity modulation by apparent Km2 are generally similar.
In addition, we studied the effects of changing the catalytic constant k2 (for the MM model) or k2c (for the full model) of the phosphatase reaction on ultrasensitivity. In a nutshell, changes in k2 barely affect the degree of ultrasensitivity when k3 < k4 (Figure S5), ultrasensitivity increases considerably as k2 increases when k3 > k4 (Figure S6). Varying k1 (for the MM model) or k1c (for the full model) merely shifts the DR curves horizontally without changing the degree of ultrasensitivity (simulation results not shown).

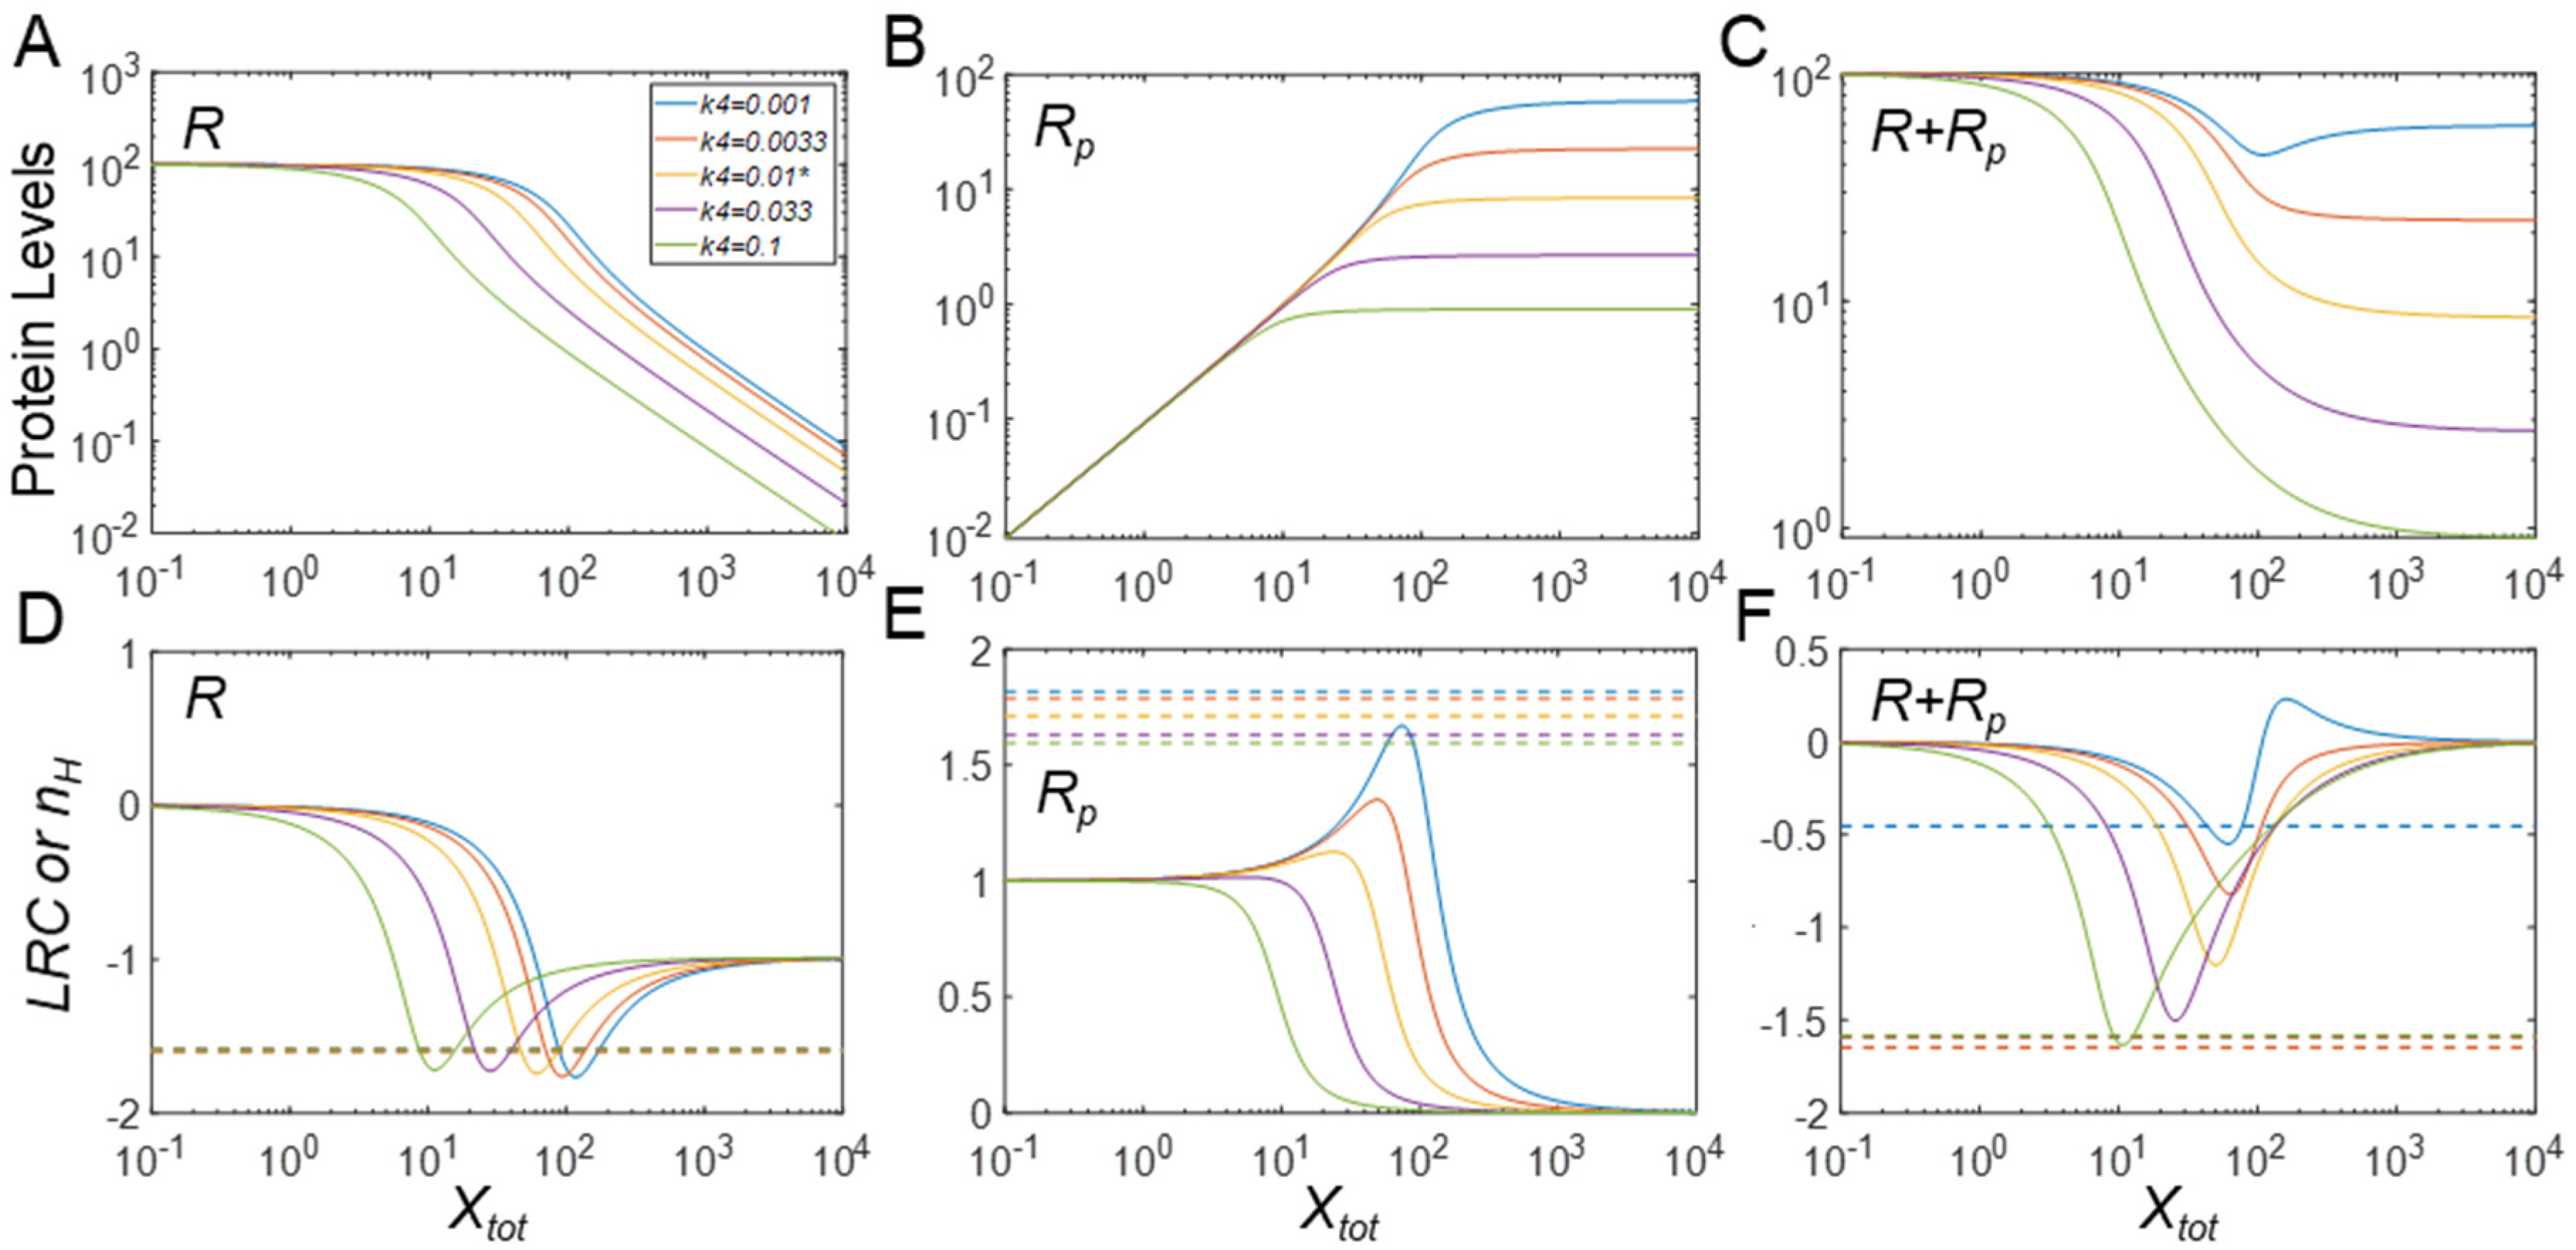
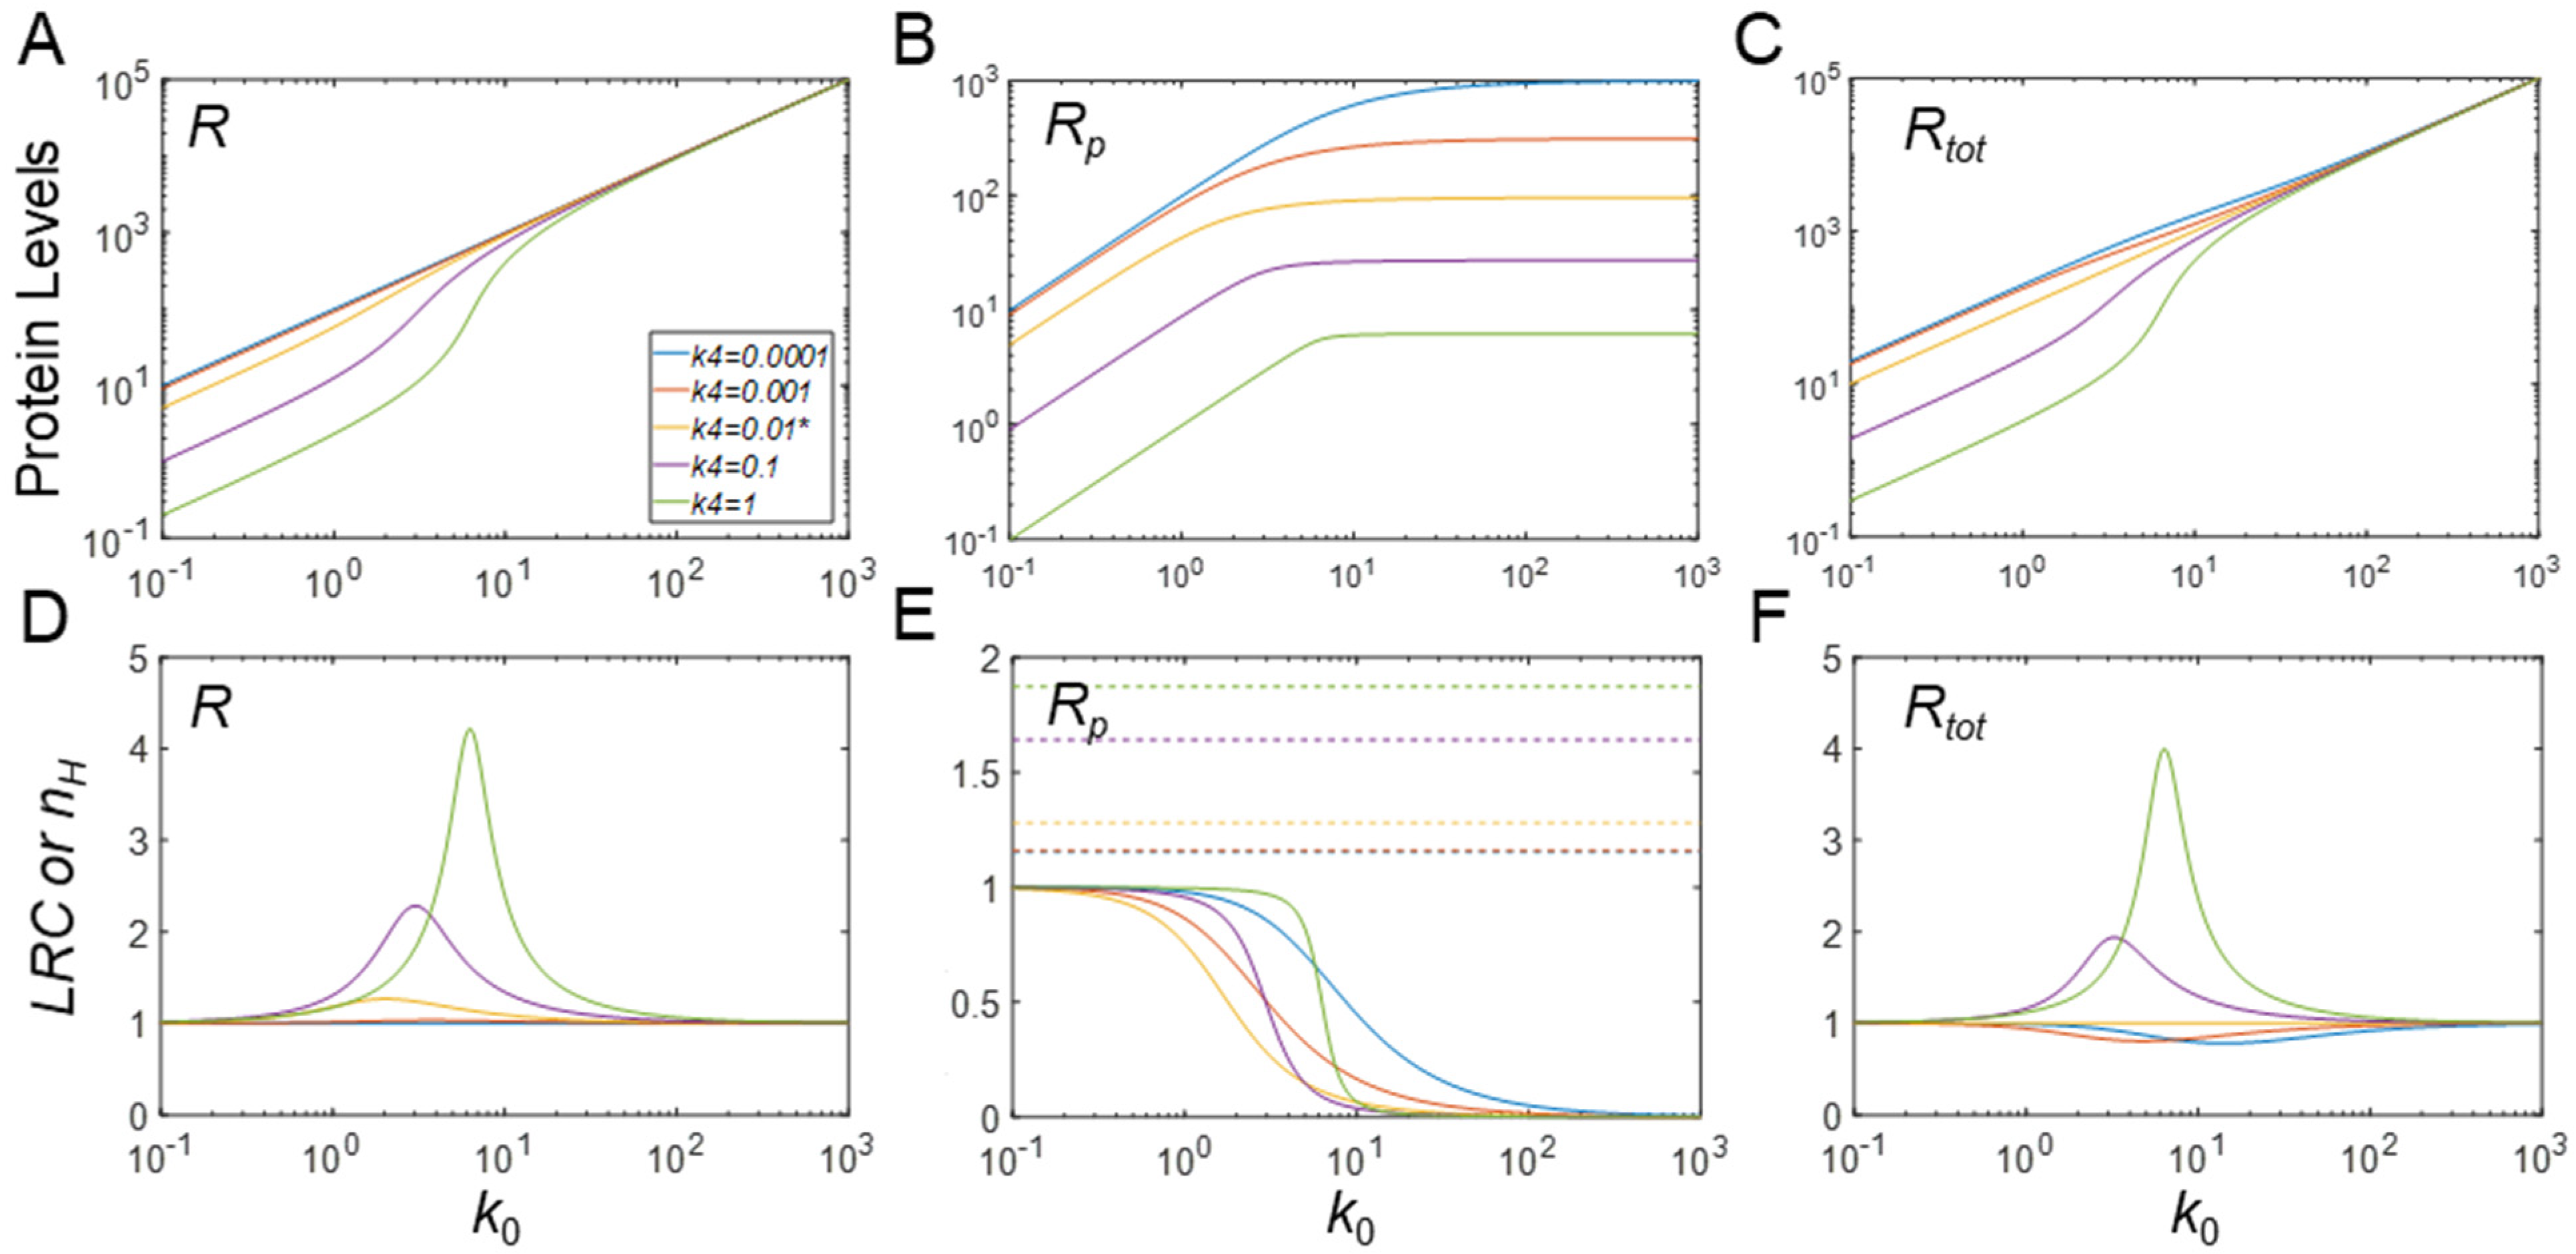
3.5. Ultrasensitivity in Response to Changes in Protein Synthesis Rate

Lastly, we examined whether changes in the synthesis of R can lead to ultrasensitivity when PTM induces changes in protein stability. Suppose the kinase X displays an intermediate activity level of 1 matching the Y level, and the rate of synthesis of R, k0, is varied. Interestingly, when Rp is destabilized in the MM model, i.e., k4 > k3, R and Rtot at steady state exhibit ultrasensitive responses for a certain range of values of k0 even though their responses never plateau (Figure 8A,C). By contrast, if k0 is gradually increased, Rp initially increases linearly (in log space), then plateaus, not exhibiting ultrasensitivity for any value of k0 (Figure 8B). When k3 = k4, Rtot is proportional to k0, and R is slightly ultrasensitive. For stabilization of Rp, and thus k3 > k4, the response of R vs. k0 is linear, while the response of Rtot vs. k0 exhibits slight subsensitivity, with LRC dipping below 1 for some range of k0 (Figure 8F).
The emergence of ultrasensitivity in the responses of R and Rtot for high k4 values may be counterintuitive, since destabilization of Rp is believed to drive the enzymes away from saturation. The reason for ultrasensitivity to occur is the saturation of the flux through the phosphorylation (k1) step: when k0 approaches a high value like 10, any further small increase only leads to an increase in R, but not Rp, and the result is ultrasensitivity. Actually, this mechanism of ultrasensitivity is a variant of zero-order degradation, which no longer requires the dephosphorylation reaction. By setting k2 = 0, i.e., disabling dephosphorylation, ultrasensitivity in the R and Rtot responses remains strong (Figure S7).
With the default parameter values, the full model produces responses that are nearly identical to the results from the MM model (simulation results not shown). In comparison, when both Xtot and Ytot are increased to 100, the ultrasensitivity of both R and free Rtot (R + Rp) in response to k0 is greatly enhanced, especially with high destabilization of Rp when k4 = 1, compared with the MM model (Figure S8A,C). This enhancement is likely due to the molecular titration effect by Xtot and Ytot. However, when there is no change in stability of Rp, or when it is stabilized, mild ultrasensitivity also occurs for R and free Rtot, which is missing in the MM model. Moreover, Rp also exhibits mild ultrasensitivity in response to k0, a feature that is missing in the MM model (Figure S8B). A summary of the main results is provided in Table 3.

4. Discussion

Cellular signal transduction pathways and gene regulatory networks regularly involve PTMs of protein components as a means of regulating their activities and abundances. Nearly all PTM reactions require participation of specific enzymes that add or remove particular functional groups to the appropriate protein substrates. When these enzymes operate near saturation with respect to their substrates, nonlinear signaling may occur, where input signals are amplified and switch output signals on or off [16,17]. When the protein substrates in a CMC are in excess relative to the modification or demodification enzymes, the degree of saturation of these enzymes depends on the Michaelis constants and the abundances of the contributing substrates.
The covalent modification status of a protein substrate not only modulates its activity, but may also alter its affinity as a substrate for the ubiquitination-proteasomal pathway that mediates the degradation of the majority of intracellular proteins [37]. Depending on whether the covalently modified protein molecule is a better or less suited substrate for ubiquitination, PTMs can either stabilize or destabilize a protein and thereby regulate its abundance. For instance, under normoxia, HIF-1α is oxidized by prolyl hydroxylase domain-containing proteins (PHD) in an oxygen-dependent manner and thereby targeted by the pVHL ubiquitination pathway for degradation, thus keeping the hypoxic transcriptional program under control [36,38]. As a different example, phosphorylation of p53 by ATM during the DNA damage response leads to its stabilization [1]. Therefore, the overall protein half-life and abundance do not remain constant in these situations, rather, they can change dynamically depending on the covalently modified fraction of the protein molecules. The altered protein substrate abundance in turn affects the degree of enzyme saturation, and hence creates an important nonlinearity in signaling.
A paradigm scenario of this type is PTM-induced protein stabilization on top of zero-order ultrasensitivity that pre-exists even for basal abundances of the protein substrates. In this scenario, as our simulations demonstrate, the degree of ultrasensitivity for the phosphorylated protein response (Rp) with respect to the kinase X is considerably elevated, with LRC and the Hill coefficient increasing sharply as the half-life of Rp is prolonged (Figure 3B,E). The enhancement of ultrasensitivity is due to the concurrently increased total protein substrate abundance as the input signal X increases, which pushes the kinase and phosphatase further into a saturated mode of operation. When the protein substrate is not high enough to enable zero-order ultrasensitivity at the basal condition, the increased protein substrate abundance induced by PTM can move the signaling motif toward saturation, thereby causing the emergence of ultrasensitivity, as demonstrated in Figure 5 and Figure S1. During the process of PTM-induced protein stabilization, the unmodified protein response is also enhanced for ultrasensitivity (Figure 3A,D) or rendered ultrasensitive (Figure 5A,D, Figures S1,D) although the response of R vs. X follows an inhibitory profile where R decreases as the input signal X increases.
An unexpected finding is the total protein response to the input signal (Rtot vs. X for the MM model and free Rtot vs. Xtot for the full model), which can also exhibit ultrasensitivity, for both cases of PTM-induced protein stabilization and destabilization (Figure 3C, Figures S1C and S2C). The original Goldbeter–Koshland model was intended to examine either the covalently modified or unmodified protein responses under the condition of zero-order ultrasensitivity, while the total protein abundance stayed constant. Here, our simulations show that ultrasensitivity can emerge when there is an imbalance in the stability of the modified and unmodified proteins. When the modified protein is more stable, the total protein mass is dominated by the modified protein and thus resembles the modified protein response albeit with a non-zero basal level. By contrast, when the modified protein is less stable, the total protein response is dominated by the unmodified protein and thus resembles the unmodified protein response. In both situations, the response of Rtot vs. X can be ultrasensitive because the modified or unmodified protein response is ultrasensitive. As an example, in the drosophila embryo, MAPK can phosphorylate transcriptional repressor Yan in response to morphogen gradients and thereby induce its degradation; this inducible degradation of Yan was proposed as part of a zero-order ultrasensitivity mechanism for the switch-like Yan response, which is responsible for the patterning of the embryonic ventral ectoderm [19]. Therefore, protein activity changes by PTM in a CMC are not mandatory for achieving zero-order ultrasensitivity if protein stability is also regulated by PTM. Using the full model, we also found that when there is a sufficient amount of demodifying enzyme to titrate the substrate, even under the condition that PTM results in protein stabilization, free total protein substrate Rtot (R + Rp) can display a mildly ultrasensitive, decreasing DR with respect to Xtot (Figure 4C and Figure S2C). Moreover, if Rp is further stabilized, free Rtot exhibits nonmonotonic responses (Figure 4C), which further demonstrates that PTM-induced changes in protein stability can bring about more complex dose–response patterns. We also demonstrate that if the input-driving signal is supposed to increase the production rate of the protein substrate, a saturable covalent modification reaction, coupled with decreased stability of the modified protein, can also lead to an ultrasensitive increase in either the unmodified or total protein levels (Figure 8A,C, Figure S8A,C); this result confirms a recent finding by Mallela et al. [25]. However, we additionally found that the ultrasensitivity is enhanced in the full model and also applies to the modified protein (Figure S8). One uncertainty in our full model lies in the treatment of the stability of the protein substrates in complexes with their catalyzing enzymes. Since a protein in a multimeric protein complex can be selectively ubiquitinated and degraded, leaving the remaining components intact [30,31,32], it seems reasonable to assume that the protein substrate in complex with its enzyme is degraded with equal rate constant as the free substrate. It is of course possible that the stability of protein substrate in the complex can differ from that of its free form. The impact of this uncertainty is expected to be small if the substrate–enzyme complex is only a small fraction of the total protein substrate. However, if the fraction is significantly large, depending on the direction of the stability change, additional dynamics and DR response profiles may emerge, which will warrant further investigation.
In the absence of PTM-induced changes in protein stability, the CMC motif can launch a quick response amenable to the time scale associated with covalent modification reactions catalyzed by enzymes. However, when protein stability is altered by PTM with half-lives at the order of hours, it can take much longer for this signaling motif to reach a steady state (Figure 3G–I). If the protein substrate or its downstream target is a transcription factor, such as p53, HIF-1, BCL-6 or Yan, a relatively slow rise or activation may not matter much as far as the timeliness of a response is concerned, because the ensuing transcriptional induction of downstream genes takes much more time to complete anyway. Importantly, we propose here that ultrasensitivity through protein stabilization can be a potential energy-saving strategy employed by cells, where maintaining a high, saturating level of the protein substrate at basal condition may no longer be necessary. In addition, the initial overshoot exhibited by the R or Rp response, as shown in Figure 3G,I, can also be a signaling strategy utilized by cells to accelerate transcriptional induction for gene production with long half-lives [39].
Throughout the result section and the Supplemental Materials, we have compared the degree of steepness of the steady-state DR curve as quantified by nH with the degree of true ultrasensitivity quantified by LRC and confirmed their known differences in describing ultrasensitive DR curves [12,34]. While the two metrics in most situations move in the same direction in response to changes in a parameter value, the corresponding |nH| for a particular DR curve can be higher or lower than |LRC|max. A higher |nH| value means an overestimate of the degree of amplification of the DR curve, which often occurs when the DR curve has a significant basal level. There are also scenarios where the DR curve exhibits a profile comprising of an almost linear response followed immediately by a plateau (Figure 8B and Figure S5B). Such a response profile may have an apparent nH = 2 despite the fact that its response is at most linear. We have also encountered DR curves having an |LRC|max value higher than |nH| (Figure S6B,C); in these situations, nH underestimates the degree of amplification. Therefore, when examining the ultrasensitivity of a DR curve, it is advisable to quantify both LRC and nH.
Building upon Goldbeter and Koshland’s concepts, Mallela et al. recently proposed mathematical models for protein modification cycles, focusing, in particular, on protein substrates that are ubiquitinated by the same E3 ligases, which mark both proteins for degradation [25]. Many E3 ligases are apparently promiscuous, thereby permitting competition between “similar” protein substrates. The authors observed that the sensitivity to incoming signals, as well as the ultrasensitivity of the response, is diminished or even destroyed when the protein substrate saturates the modifying enzyme. This ultrasensitivity-weakening effect is more dramatic if the cycling proteins are degraded at a relatively high rate, consistent with our earlier findings [24]. However, even though the authors used the full model, their study only considered the situation when the total protein substrate is at least 1000-fold higher than the demodifying enzyme, while in the present study we systemically examined the condition when these two quantities are comparable or even when the enzyme is at a higher level. Mallela and colleagues also found that signaling cycles, in which the coupling of protein substrates collectively leads to saturation of the enzymes, can lead to a coupled, switch-like response in all protein substrates, likely due to the competition or “crosstalk” of the substrate proteins with respect to the same E3 ligases. The effects of protein turnover on ultrasensitivity does not seem to be limited to the CMC motif explored here. It also plays a modulatory role in the ultrasensitivity arising from molecular titration or protein sequestration [40].
The signaling motif of a CMC can exhibit complex dynamic behaviors and has been extensively studied with computational means. Wang et al. investigated and decomposed the tunability of the zero-order ultrasensitivity [41]. Xu and Gunawardena examined some more realistic intracellular situations where multiple enzyme intermediates exist due to co-substrate binding for both reversible and irreversible reactions and found that these complications modulate the zero-order switching behavior [42]. The operation of the CMC in the face of protein expression noise has been explored more recently [43,44]. It seems important to have correlated expression of the paired modification and demodification enzymes to prevent switch flipping, and bifunctional enzymes in a CMC may be an ideal solution in this regard [44]. Using linear reactions of the modification and demodification reactions, Soyer demonstrated that the CMC motif, like negative feedback or incoherent feedforward loops, can exhibit transient or persistent dynamic responses depending on the difference in protein stability [45]. In the present study, we have added a new aspect by demonstrating that PTM-associated changes in protein stability, enzyme features, or protein synthesis offer the cell another level of sophistication regarding the complex response behaviors of this long-studied signaling motif.

Supplementary Materials

The following are available online at https://www.mdpi.com/article/10.3390/biom11111741/s1, Figures S1–S8, MATLAB and R model code.

Author Contributions

Conceptualization, Q.Z.; methodology, Q.Z., E.O.V.; formal analysis, C.M.K., Q.Z.; writing—original draft preparation, C.M.K., Q.Z.; writing—review and editing, C.M.K., Q.Z., E.O.V.; supervision, Q.Z., E.O.V.; funding acquisition, Q.Z. All authors have read and agreed to the published version of the manuscript.

Funding

The work was supported by NIEHS Superfund Research grant P42ES04911 (Norbert E. Kaminski, PI) and NIEHS HERCULES grant P30ES019776 (Carmen Marsit, PI).

Institutional Review Board Statement

Not applicable.

Informed Consent Statement

Not applicable.

Conflicts of Interest

The authors declare no conflict of interest.

References

  1. Stommel, J.M.; Wahl, G.M. Accelerated MDM2 auto-degradation induced by DNA-damage kinases is required for p53 activation. EMBO J. 2004, 23, 1547–1556. [Google Scholar] [CrossRef] [PubMed] [Green Version]
  2. Shieh, S.Y.; Ikeda, M.; Taya, Y.; Prives, C. DNA damage-induced phosphorylation of p53 alleviates inhibition by MDM2. Cell 1997, 91, 325–334. [Google Scholar] [CrossRef] [Green Version]
  3. Niu, H.; Ye, B.H.; Dalla-Favera, R. Antigen receptor signaling induces MAP kinase-mediated phosphorylation and degradation of the BCL-6 transcription factor. Genes Dev. 1998, 12, 1953–1961. [Google Scholar] [CrossRef] [Green Version]
  4. Goto, H.; Natsume, T.; Kanemaki, M.T.; Kaito, A.; Wang, S.; Gabazza, E.C.; Inagaki, M.; Mizoguchi, A. Chk1-mediated Cdc25A degradation as a critical mechanism for normal cell cycle progression. J. Cell Sci. 2019, 132, jcs223123. [Google Scholar] [CrossRef] [PubMed] [Green Version]
  5. Kanarek, N.; Ben-Neriah, Y. Regulation of NF-kappaB by ubiquitination and degradation of the IkappaBs. Immunol. Rev. 2012, 246, 77–94. [Google Scholar] [CrossRef] [PubMed]
  6. Ulery, P.G.; Rudenko, G.; Nestler, E.J. Regulation of DeltaFosB stability by phosphorylation. J. Neurosci. 2006, 26, 5131–5142. [Google Scholar] [CrossRef] [Green Version]
  7. Goldbeter, A.; Koshland, D.E., Jr. Sensitivity amplification in biochemical systems. Q. Rev. Biophys. 1982, 15, 555–591. [Google Scholar] [CrossRef]
  8. Kholodenko, B.N.; Hoek, J.B.; Westerhoff, H.V.; Brown, G.C. Quantification of information transfer via cellular signal transduction pathways. FEBS Lett. 1997, 414, 430–434. [Google Scholar] [CrossRef] [Green Version]
  9. Koshland, D.E., Jr.; Goldbeter, A.; Stock, J.B. Amplification and adaptation in regulatory and sensory systems. Science 1982, 217, 220–225. [Google Scholar] [CrossRef]
  10. Ferrell, J.E., Jr. Tripping the switch fantastic: How a protein kinase cascade can convert graded inputs into switch-like outputs. Trends Biochem. Sci. 1996, 21, 460–466. [Google Scholar] [CrossRef]
  11. Ferrell, J.E., Jr.; Ha, S.H. Ultrasensitivity part III: Cascades, bistable switches, and oscillators. Trends Biochem. Sci. 2014, 39, 612–618. [Google Scholar] [CrossRef] [PubMed] [Green Version]
  12. Zhang, Q.; Bhattacharya, S.; Andersen, M.E. Ultrasensitive response motifs: Basic amplifiers in molecular signalling networks. Open Biol. 2013, 3, 130031. [Google Scholar] [CrossRef] [PubMed]
  13. Ferrell, J.E., Jr.; Ha, S.H. Ultrasensitivity part I: Michaelian responses and zero-order ultrasensitivity. Trends Biochem. Sci. 2014, 39, 496–503. [Google Scholar] [CrossRef] [Green Version]
  14. Ferrell, J.E., Jr.; Ha, S.H. Ultrasensitivity part II: Multisite phosphorylation, stoichiometric inhibitors, and positive feedback. Trends Biochem. Sci. 2014, 39, 556–569. [Google Scholar] [CrossRef] [PubMed] [Green Version]
  15. Uy, R.; Wold, F. Posttranslational covalent modification of proteins. Science 1977, 198, 890–896. [Google Scholar] [CrossRef]
  16. Goldbeter, A.; Koshland, D.E., Jr. An amplified sensitivity arising from covalent modification in biological systems. Proc. Natl. Acad. Sci. USA 1981, 78, 6840–6844. [Google Scholar] [CrossRef] [Green Version]
  17. Goldbeter, A.; Koshland, D.E., Jr. Ultrasensitivity in biochemical systems controlled by covalent modification. Interplay between zero-order and multistep effects. J. Biol. Chem. 1984, 259, 14441–14447. [Google Scholar] [CrossRef]
  18. Cimino, A.; Hervagault, J.F. Experimental evidence for a zero-order ultrasensitivity in a simple substrate cycle. Biochem. Biophys. Res. Commun. 1987, 149, 615–620. [Google Scholar] [CrossRef]
  19. Melen, G.J.; Levy, S.; Barkai, N.; Shilo, B.Z. Threshold responses to morphogen gradients by zero-order ultrasensitivity. Mol. Syst. Biol. 2005, 1, 2005.0028. [Google Scholar] [CrossRef] [Green Version]
  20. Huang, C.Y.; Ferrell, J.E., Jr. Ultrasensitivity in the mitogen-activated protein kinase cascade. Proc. Natl. Acad. Sci. USA 1996, 93, 10078–10083. [Google Scholar] [CrossRef] [Green Version]
  21. Meinke, M.H.; Edstrom, R.D. Muscle glycogenolysis. Regulation of the cyclic interconversion of phosphorylase a and phosphorylase b. J. Biol. Chem. 1991, 266, 2259–2266. [Google Scholar] [CrossRef]
  22. Meinke, M.H.; Bishop, J.S.; Edstrom, R.D. Zero-order ultrasensitivity in the regulation of glycogen phosphorylase. Proc. Natl. Acad. Sci. USA 1986, 83, 2865–2868. [Google Scholar] [CrossRef] [PubMed] [Green Version]
  23. LaPorte, D.C.; Koshland, D.E., Jr. Phosphorylation of isocitrate dehydrogenase as a demonstration of enhanced sensitivity in covalent regulation. Nature 1983, 305, 286–290. [Google Scholar] [CrossRef] [PubMed]
  24. Zhang, Q.; Bhattacharya, S.; Conolly, R.B.; Andersen, M.E. Nonlinearities in cellular dose-response behaviors can be enhanced by protein stabilization. In Proceedings of the Society of Toxicology 54th Annual Meeting, San Diego, CA, USA, 22–26 March 2015. Abstract #719. [Google Scholar]
  25. Mallela, A.; Nariya, M.K.; Deeds, E.J. Crosstalk and ultrasensitivity in protein degradation pathways. PLoS Comput. Biol. 2020, 16, e1008492. [Google Scholar] [CrossRef] [PubMed]
  26. Kim, J.K.; Tyson, J.J. Misuse of the Michaelis-Menten rate law for protein interaction networks and its remedy. PLoS Comput. Biol. 2020, 16, e1008258. [Google Scholar] [CrossRef]
  27. Blüthgen, N.; Bruggeman, F.J.; Legewie, S.; Herzel, H.; Westerhoff, H.V.; Kholodenko, B.N. Effects of sequestration on signal transduction cascades. FEBS J. 2006, 273, 895–906. [Google Scholar] [CrossRef]
  28. Fujioka, A.; Terai, K.; Itoh, R.E.; Aoki, K.; Nakamura, T.; Kuroda, S.; Nishida, E.; Matsuda, M. Dynamics of the Ras/ERK MAPK cascade as monitored by fluorescent probes. J. Biol. Chem. 2006, 281, 8917–8926. [Google Scholar] [CrossRef] [Green Version]
  29. Jeynes-Smith, C.; Araujo, R.B. Ultrasensitivity and bistability in covalent-modification cycles with positive autoregulation. Proc. R. Soc. A 2021, 477, 20210069. [Google Scholar] [CrossRef]
  30. Verma, R.; McDonald, H.; Yates, J.R., 3rd; Deshaies, R.J. Selective degradation of ubiquitinated Sic1 by purified 26S proteasome yields active S phase cyclin-Cdk. Mol. Cell 2001, 8, 439–448. [Google Scholar] [CrossRef]
  31. Johnson, E.S.; Gonda, D.K.; Varshavsky, A. Cis-trans recognition and subunit-specific degradation of short-lived proteins. Nature 1990, 346, 287–291. [Google Scholar] [CrossRef]
  32. Prakash, S.; Inobe, T.; Hatch, A.J.; Matouschek, A. Substrate selection by the proteasome during degradation of protein complexes. Nat. Chem. Biol. 2009, 5, 29–36. [Google Scholar] [CrossRef] [PubMed] [Green Version]
  33. Legewie, S.; Bluthgen, N.; Herzel, H. Quantitative analysis of ultrasensitive responses. FEBS J. 2005, 272, 4071–4079. [Google Scholar] [CrossRef]
  34. Altszyler, E.; Ventura, A.C.; Colman-Lerner, A.; Chernomoretz, A. Ultrasensitivity in signaling cascades revisited: Linking local and global ultrasensitivity estimations. PLoS ONE 2017, 12, e0180083. [Google Scholar] [CrossRef]
  35. Breitschopf, K.; Haendeler, J.; Malchow, P.; Zeiher, A.M.; Dimmeler, S. Posttranslational modification of Bcl-2 facilitates its proteasome-dependent degradation: Molecular characterization of the involved signaling pathway. Mol. Cell Biol. 2000, 20, 1886–1896. [Google Scholar] [CrossRef] [PubMed] [Green Version]
  36. Huang, L.E.; Gu, J.; Schau, M.; Bunn, H.F. Regulation of hypoxia-inducible factor 1alpha is mediated by an O2-dependent degradation domain via the ubiquitin-proteasome pathway. Proc. Natl. Acad. Sci. USA 1998, 95, 7987–7992. [Google Scholar] [CrossRef] [PubMed] [Green Version]
  37. Glickman, M.H.; Ciechanover, A. The ubiquitin-proteasome proteolytic pathway: Destruction for the sake of construction. Physiol. Rev. 2002, 82, 373–428. [Google Scholar] [CrossRef]
  38. Maxwell, P.H.; Wiesener, M.S.; Chang, G.W.; Clifford, S.C.; Vaux, E.C.; Cockman, M.E.; Wykoff, C.C.; Pugh, C.W.; Maher, E.R.; Ratcliffe, P.J. The tumour suppressor protein VHL targets hypoxia-inducible factors for oxygen-dependent proteolysis. Nature 1999, 399, 271–275. [Google Scholar] [CrossRef]
  39. Zeisel, A.; Kostler, W.J.; Molotski, N.; Tsai, J.M.; Krauthgamer, R.; Jacob-Hirsch, J.; Rechavi, G.; Soen, Y.; Jung, S.; Yarden, Y.; et al. Coupled pre-mRNA and mRNA dynamics unveil operational strategies underlying transcriptional responses to stimuli. Mol. Syst. Biol. 2011, 7, 529. [Google Scholar] [CrossRef]
  40. Buchler, N.E.; Louis, M. Molecular titration and ultrasensitivity in regulatory networks. J. Mol. Biol. 2008, 384, 1106–1119. [Google Scholar] [CrossRef]
  41. Wang, G.; Zhang, M. Tunable ultrasensitivity: Functional decoupling and biological insights. Sci. Rep. 2016, 6, 20345. [Google Scholar] [CrossRef] [Green Version]
  42. Xu, Y.; Gunawardena, J. Realistic enzymology for post-translational modification: Zero-order ultrasensitivity revisited. J. Theor. Biol. 2012, 311, 139–152. [Google Scholar] [CrossRef] [Green Version]
  43. Jithinraj, P.K.; Roy, U.; Gopalakrishnan, M. Zero-order ultrasensitivity: A study of criticality and fluctuations under the total quasi-steady state approximation in the linear noise regime. J. Theor. Biol. 2014, 344, 1–11. [Google Scholar] [CrossRef] [PubMed] [Green Version]
  44. Dasgupta, T.; Croll, D.H.; Owen, J.A.; Vander Heiden, M.G.; Locasale, J.W.; Alon, U.; Cantley, L.C.; Gunawardena, J. A fundamental trade-off in covalent switching and its circumvention by enzyme bifunctionality in glucose homeostasis. J. Biol. Chem. 2014, 289, 13010–13025. [Google Scholar] [CrossRef] [PubMed] [Green Version]
  45. Soyer, O.S.; Kuwahara, H.; Csikasz-Nagy, A. Regulating the total level of a signaling protein can vary its dynamics in a range from switch like ultrasensitivity to adaptive responses. FEBS J. 2009, 276, 3290–3298. [Google Scholar] [CrossRef] [PubMed]
Figure 1. Schematic illustration of covalent modification cycles (CMCs) that result in altered protein stability and structures of computational models used here. (A) p53 stabilization by ATM-catalyzed phosphorylation. (B) BCL6 destabilization by ERK-catalyzed phosphorylation. (C) Generic model based on the phosphorylation–dephosphorylation cycle using Michaelis–Menten kinetics (MM model) and (D) generic model using mass-action kinetics (“full model”). Open arrow heads: mass fluxes, with thickness representing magnitude; dashed arrows with solid arrow heads: enzymatic catalysis.
Biomolecules 11 01741 g001
Figure 2. Steady−state does−response (DR) curves of R and Rp, associated fluxes, nH and LCR, as functions of kinase X activity in the MM model. (A) DR curves of R vs. X and Rp vs. X on linear scale. (B) nH and LRC of DR curves of R vs. X and Rp vs. X. (C) DR curves of R vs. X and Rp vs. X in a log-log representation. (D) Fluxes, named by associated rate constant, plotted against X. Specifically, flux k1: phosphorylation; flux k2: dephosphorylation; flux k3: degradation of R; and flux k4: degradation of Rp.
Biomolecules 11 01741 g002
Figure 3. Effects of phosphorylation−induced changes in protein stability on ultrasensitivity and response time in the MM model. (AC) Steady-state DR curves for R vs. X, Rp vs. X, and Rtot vs. X, respectively, for different values of k4, as indicated in panel (A). The same color scheme for k4 values holds for all panels. (DF) LRC (solid lines) and nH (dashed horizontal lines) pertain to R, Rp, and Rtot, respectively. (GI) Response of R, Rp, and Rtot over time, induced by X = 1, respectively. * k4 = 0.01 is the default value.
Biomolecules 11 01741 g003
Figure 4. Effects of phosphorylation-induced changes in protein stability on ultrasensitivity in the full model when enzyme and basal substrate levels are comparable. (AC) Steady-state DR curves for R vs. Xtot, Rp vs. Xtot, and free Rtot (R + Rp) vs. Xtot, respectively, for different values of k4, as indicated in panel (A). The same color scheme for k4 values holds for all panels. (DF) LRC (solid lines) and nH (dashed horizontal lines) pertain to R, Rp, and free Rtot, respectively. * k4 = 0.01 is the default value. For these simulations, Ytot was set to 100.
Biomolecules 11 01741 g004
Figure 5. Emergence of ultrasensitivity through phosphorylation-induced protein stabilization in the MM model. (AC) Steady−state DR curves for R vs. X, Rp vs. X, and Rtot vs. X, respectively, for different values of k4, as indicated in panel A. The same color scheme for k4 values holds for all panels. As k4 decreases, ultrasensitivity emerges for Rp and Rtot. (DF) LRC (solid lines) and nH (dashed horizontal lines) for R, Rp, and Rtot, respectively, for different values of k4. * k4 = 0.01 is the default value. For these simulations, the Michaelis constants were set to Km1 = Km2 = 100.
Biomolecules 11 01741 g005
Figure 6. Effects of Km1 on ultrasensitivity under phosphorylation-induced protein destabilization in the MM model (k4 = 0.1). (AC) Steady-state DR curves for R vs. X, Rp vs. X, and Rtot vs. X, respectively, for different values of Km1, as indicated in A. The same color scheme for Km1 values holds for all panels. The degree of ultrasensitivity increases for decreasing values of Km1. (DF) LRC (solid lines) and nH (dashed horizontal lines) for R, Rp, and Rtot, respectively. * Km1 = 10 is the default value.
Biomolecules 11 01741 g006
Figure 7. Effects of Km1 on ultrasensitivity under phosphorylation-induced protein stabilization in the MM model (k4 = 0.001). The results here pertain to a value of k4 that is 10-fold lower than the default. (AC) Steady-state DR curves for R vs. X, Rp vs. X, and Rtot vs. X, respectively, for different values of Km1, as indicated in A. The same color scheme for Km1 values holds for all panels. (DF) LRC (solid lines) and nH (dashed horizontal lines) for R, Rp, and Rtot, respectively. * Km1 = 10 is the default value.
Biomolecules 11 01741 g007
Figure 8. k0-driven ultrasensitivity with phosphorylation-induced changes in protein stability in the MM model. (AC) Steady-state DR curves for R vs. k0, Rp v.s k0, and Rtot vs. k0, respectively, for different values of k4, as indicated in (A). The same color scheme for k4 values is used for the other panels. (DF) LRC (solid lines) and nH (dashed horizontal lines) for R, Rp, and Rtot. * k4 = 0.01 is the default value. X = 1 for all conditions. Note that no nH was evaluated for R and Rtot because the responses do not saturate.
Biomolecules 11 01741 g008
Table 1. Default parameter values for the MM model in Figure 1C.
ParameterDescriptionDefault Value
k0Rate constant of synthesis of R1 (concentration/time)
k1Catalytic rate constant for phosphorylation10 (1/time)
Km1Michaelis constant for phosphorylation10 (concentration)
XKinase0 (concentration)
k2Catalytic rate constant for dephosphorylation10 (1/time)
Km2Michaelis constant for dephosphorylation10 (concentration)
k3Degradation rate constant of R0.01 (1/time)
k4Degradation rate constant of Rp0.01 (1/time)
YPhosphatase1 (concentration)
Table 2. Default parameter values for the full model in Figure 1D.
ParameterDescriptionDefault Value
k0Rate constant of synthesis of R1 (concentration/time)
k1fAssociation rate constant for R and X binding10 (1/concentration/time)
k1bDissociation rate constant for RX complex90 (1/time)
k1cCatalytic rate constant for phosphorylation10 (1/time)
XtotTotal kinase0 (concentration)
k2fAssociation rate constant for Rp and Y binding10 (1/concentration/time)
k2bDissociation rate constant for RpY complex90 (1/time)
k2cCatalytic rate constant for dephosphorylation10 (1/time)
k3Degradation rate constant of R and RX0.01 (1/time)
k4Degradation rate constant of Rp and RpY0.01 (1/time)
YtotTotal phosphatase1 (concentration)
Table 3. Summary of effects of varying parameters on ultrasensitivity.
Parameter VariedStability ConditionEffects on |LRC|max
R vs. XtotRp vs. XtotR + Rp vs. Xtot
k4k3 > k4↑#, – *↑#, ↓ *
k4k3 < k4↓#, – *
Km1, ↓Km2k3 > k4 or k3 < k4
Km1, ↑Km2k3 > k4 or k3 < k4
k1, ↑k21k3 > k4 or k3 < k4
k1, ↓k21k3 > k4 or k3 < k4
k2, ↑k2ck3 > k4
k2, ↑k2ck3 < k4
R vs. k0Rp vs. k0R + Rp vs. k0
k4k3 > k4
k4k3 < k4
Note: ↑, ↓, and – denote increase, decrease, and no/very small effect, respectively. Unless otherwise indicated, the effects apply to both MM and full models. # Change that occurs with MM model only. * Change that occurs with full model only.
Publisher’s Note: MDPI stays neutral with regard to jurisdictional claims in published maps and institutional affiliations.

