Article

Quantitative Morphological Analysis of Filamentous Microorganisms in Cocultures and Monocultures: Aspergillus terreus and Streptomyces rimosus Warfare in Bioreactors

Department of Bioprocess Engineering, Faculty of Process and Environmental Engineering, Lodz University of Technology, ul. Wolczanska 213, 90-924 Lodz, Poland
*
Author to whom correspondence should be addressed.
Biomolecules 2021, 11(11), 1740; https://doi.org/10.3390/biom11111740
Submission received: 30 October 2021 / Revised: 15 November 2021 / Accepted: 19 November 2021 / Published: 22 November 2021
(This article belongs to the Collection Feature Papers in Synthetic Biology and Bioengineering)

Abstract

:
The aim of this study was to quantitatively characterize the morphology of the filamentous microorganisms Aspergillus terreus ATCC 20542 and Streptomyces rimosus ATCC 10970, cocultivated in stirred tank bioreactors, and to characterize their mutual influence with the use of quantitative image analysis. Three distinct coculture initiation strategies were applied: preculture versus preculture, spores versus spores and preculture versus preculture with time delay for one of the species. Bioreactor cocultures were accompanied by parallel monoculture controls. The results recorded for the mono- and cocultures were compared in order to investigate the effect of cocultivation on the morphological evolution of A. terreus and S. rimosus. Morphology-related observations were also confronted with the analysis of secondary metabolism. The morphology of the two studied filamentous species strictly depended on the applied coculture initiation strategy. In the cocultures initiated by the simultaneous inoculation, S. rimosus gained domination or advance over A. terreus. The latter microorganism dominated only in these experiments in which S. rimosus was introduced with a delay.

1. Introduction

The application of microbial cocultures, understood as the simultaneous cultivation of two or more microorganisms in the individual closed environment, is a well-known strategy to improve their metabolic diversity. In natural habitats, filamentous microorganisms grow in various multispecies communities and establish interrelationships which can be based on the competition or coexistence [1,2]. In the first case, antifungal and antibacterial substances are produced by filamentous microorganisms in order to increase their advantage over other hostile microorganisms. In the second case, the compounds produced by one of the species can be biotransformed by the symbiotic microorganism. Owing to the aforementioned multilevel dependencies, microorganisms cultivated in the artificial laboratory bioreactor cocultures may activate biosynthetic pathways that are hidden or cryptic in the monocultures [3,4,5,6,7,8,9]. Therefore, the application of the cocultures can result in the enhancement of metabolites production [10].
Some of the better known cocultures are those of genera Aspergillus and Streptomyces due to their broad secondary metabolic repertoires. In recent years, numerous studies in this field were conducted. However, the cocultures of Aspergillus terreus and Streptomyces rimosus, chosen to be investigated in the present work, have not been investigated so far [8,11,12]. The results of the recent Aspergillus and Streptomyces coculture studies are presented in Table 1. What is more, only three results relate directly to microbial morphology and none of the listed reports dealt with the experiments made in stirred tank bioreactors. The broadest morphological description of the cocultured microorganisms was made by Siemieniewicz and Schrempf [13]. They conducted static flask cocultivations (without shaking) of Aspergillus proliferans and Streptomyces olivaceoviridis to prevent pellets formation. The mixture of A. proliferans and S. olivaceoviridis spores in the coculture provoked the germination and growth of the cultivated microorganisms in the medium without any carbon source. In the monocultures run in the same medium, either the spores of A. proliferans or S. olivaceoviridis did not enter the germination phase. Growth of the fungus was initiated by chitinase ChiO1 produced by S. olivaceoviridis. Morphological observations of germination were made with the phase-contrast optical microscope. In a different study, Caceres et al. [14] investigated the bioagents that reduce the concentration of carcinogenic aflatoxin B1. This mycotoxin is produced by Aspergillus flavus, a food-contaminating fungus. Agar plates with A. flavus and Streptomyces roseolus cocultures demonstrated the S. roseolus-dependent inhibition of A. flavus gene cluster responsible for aflatoxin B1 biosynthesis. Fungal morphology was described on the basis of Scanning Electronic Microscopy (SEM) observations. The main change caused by the introduction of S. roseolus into A. flavus culture was the increase in fungal spores quantity. In the research conducted by Yu et al. [15] microbial morphology was also investigated with SEM, however they presented images originating only from the cocultures, without referring to the monoculture controls, and there was no demonstration of quantitative morphological data. The results showed that the physical contact of Aspergillus flavipes and Streptomyces sp. in the cocultures was required for inducing the production of the bioactive cytochalasans (Table 1). A similar approach was presented by Schroeckh et al. [3]. In their research, the direct contact between the cultivated microorganisms, Aspergillus nidulans and Streptomyces hygroscopicus, was one of the ways for the elicitation of a silent polyketide synthase (PKS) gene cluster. Nevertheless, this paper focused on the physical interactions between the cocultured microorganisms instead of their morphology. König et al. [16], as one of very few research teams, showed the comparison of monocultures with cocultures. They conducted Aspergillus fumigatus and Streptomyces rapamycinicus agar plate cocultivations. Physical interactions between these two microorganisms led to the biosynthesis of fumicycline A, a prenylated polyphenol encoded by the PKS gene cluster that remained silent under monoculture conditions. The differences between A. fumigatus monoculture and A. fumigatus and S. rapamycinicus coculture were shown with the use of scanning electron micrographs. It should be mentioned, however, that the SEM technique was not the only method of coculture observation. Optical and fluorescence microscopy were used by Wu et al. [17] and Stroe et al. [18] to demonstrate the intimate interactions between cocultured microorganisms. However, their research was not specifically targeted at morphological issues. Upon literature review one can find that no quantitative studies linking the bioproduction and morphology in cocultures have been conducted so far. Nevertheless, it is well known that in the bioprocesses involving filamentous microorganisms’ morphology is one of the key factors influencing the production of metabolites and cultivation conditions, such as medium rheological properties or oxygen availability [19]. Therefore, deeper morphological studies of filamentous cocultures are crucial for the future development of bioproducts synthesis in these systems.
Numerous works on microbial cocultivation do not fill the lack of information about morphological development in submerged cocultures [13,20,21,22,23,24,25,26,27,28]. Only Wurster et al. [2] made an attempt to quantitatively describe the morphology of cocultured microorganisms in their research on A. fumigatus growth blocked by Pseudomonas aeruginosa. They proved that pyoverdine and pyocyanin produced by P. aeruginosa inhibited A. fumigatus branching and growth. Furthermore, bioreactor cocultures were almost uncharted due to the difficulties in controlling multispecies processes. Treloar et al. [29] worked on solving this problem, and as a result, they developed an approach of reinforcement learning. The method was based on artificial intelligence and could be used for maintaining cultivated microorganisms at the targeted levels. The issue of the metabolism of filamentous microorganisms in the stirred tank bioreactor cocultures was for the first time reported by Boruta et al. [30]. They studied the production of secondary metabolites and bioprocess kinetics in A. terreus and S. rimosus bioreactor cocultures and respective parallel monocultures of these microorganisms. Moreover, upon the analysis of the metabolic repertoire, the metabolically dominant microorganism was indicated in each conducted coculture. The present morphological studies deal with the same A. terreus and S. rimosus bioreactor cocultures and for this reason the comparison of the metabolism and morphological development of the cocultivated A. terreus and S. rimosus in stirred tank bioreactors became possible for the first time. All in all, the presented literature review shows how much research is still required to develop the cocultures for industrial processing and emphasizes the importance of the morphological studies focused on filamentous microorganisms.
The aim of the present study was to perform the first quantitative morphological analysis of the filamentous microorganisms A. terreus and S. rimosus cultivated in the stirred tank bioreactor cocultures and to correlate the obtained results with their respective metabolic profiles.

2. Materials and Methods

2.1. Strains

A fungus, Aspergillus terreus ATCC 20542, and an actinomycete, Streptomyces rimosus ATCC 10970, from the American Type Culture Collection (ATCC) (Lomianki, Poland) were cultivated. The microorganisms were stored on agar slants of the composition in accordance with the ATCC recommendations. Slants for A. terreus contained malt extract 20 g·L−1, casein peptone 5 g·L −1 and agar 20 g·L−1. S. rimosus was maintained on the commercial medium Difco ISP Medium 2. The slants were made as follows: Sterile water with suspended spores of the selected microorganism was poured into sterile slants. Next, slants were thermostated at 26 °C for 10 days and were stored at 4 °C for no longer than 2 weeks.

2.2. Bioreactor Experiments

All cultivations were conducted in fully controlled stirred tank bioreactors of 5.5 L working volume (Sartorius B-Plus, Sartorius Stedim, Germany) at 30 °C, equipped with pH, redox potential and dissolved oxygen sensors. The level of dissolved oxygen in the cultivation medium was set at 20% and controlled by air flow rate and stirring speed. Their values were in the following ranges: flow rate from 1.5 lair min−1 to 5.5 lair min−1 and stirring speed from 220 min−1 to 300 min−1.
Each individual experiment denoted from ATSR2 to ATSR9 contained three simultaneous bioreactor cultivations:
(1)
coculture of A. terreus and S. rimosus,
(2)
monoculture of A. terreus,
(3)
monoculture of S. rimosus.
The monocultures were the sources of the reference data for the cocultures.

2.3. Coculture Initiation Strategies and Cultivation Medium Compositions

The first stage of the study included 5 experiments (from ATSR2 to ATSR6) performed with the use of the following coculture initiation strategy: 24 h shaking flask precultures of A. terreus and S. rimosus were introduced to the bioreactor in the same moment. The precultures’ preparation was previously described by Boruta et al. [30]. Due to fact that the initial number of spores in the precultures should be equal to 109 per liter, spores were counted in a Thoma cell counting chamber and their number corrected, if required.
In the second stage of the study, two experiments (ATSR7 and ATSR8) were conducted. The coculture inoculation strategy in these two experiments was altered. A. terreus preculture was introduced to the bioreactor at the beginning of the cultivation while S. rimosus preculture introduction was delayed by 24 h. Therefore, S. rimosus monoculture also began 24 h later in comparison to A. terreus monoculture.
In the last stage of the study, a single experiment (ATSR9) was performed. In this case, the bioreactors intended for the coculture and monocultures were simultaneously inoculated by A. terreus spores and S. rimosus spores (109 spores per liter of the inoculum without prior preculture). As a result, the spores germinated in the bioreactor.

2.4. Media Compositions

Various cultivation medium compositions were used in the experiments. For the sake of eligibility, they are collected in Table 2. However, it should be emphasized that each of the three cultivations included in one experiment (coculture of A. terreus and S. rimosus, monoculture of A. terreus, monoculture of S. rimosus) were conducted in the same medium. Finally, if the experiments were started with precultures, their medium compositions were identical to those in the corresponding bioreactors.

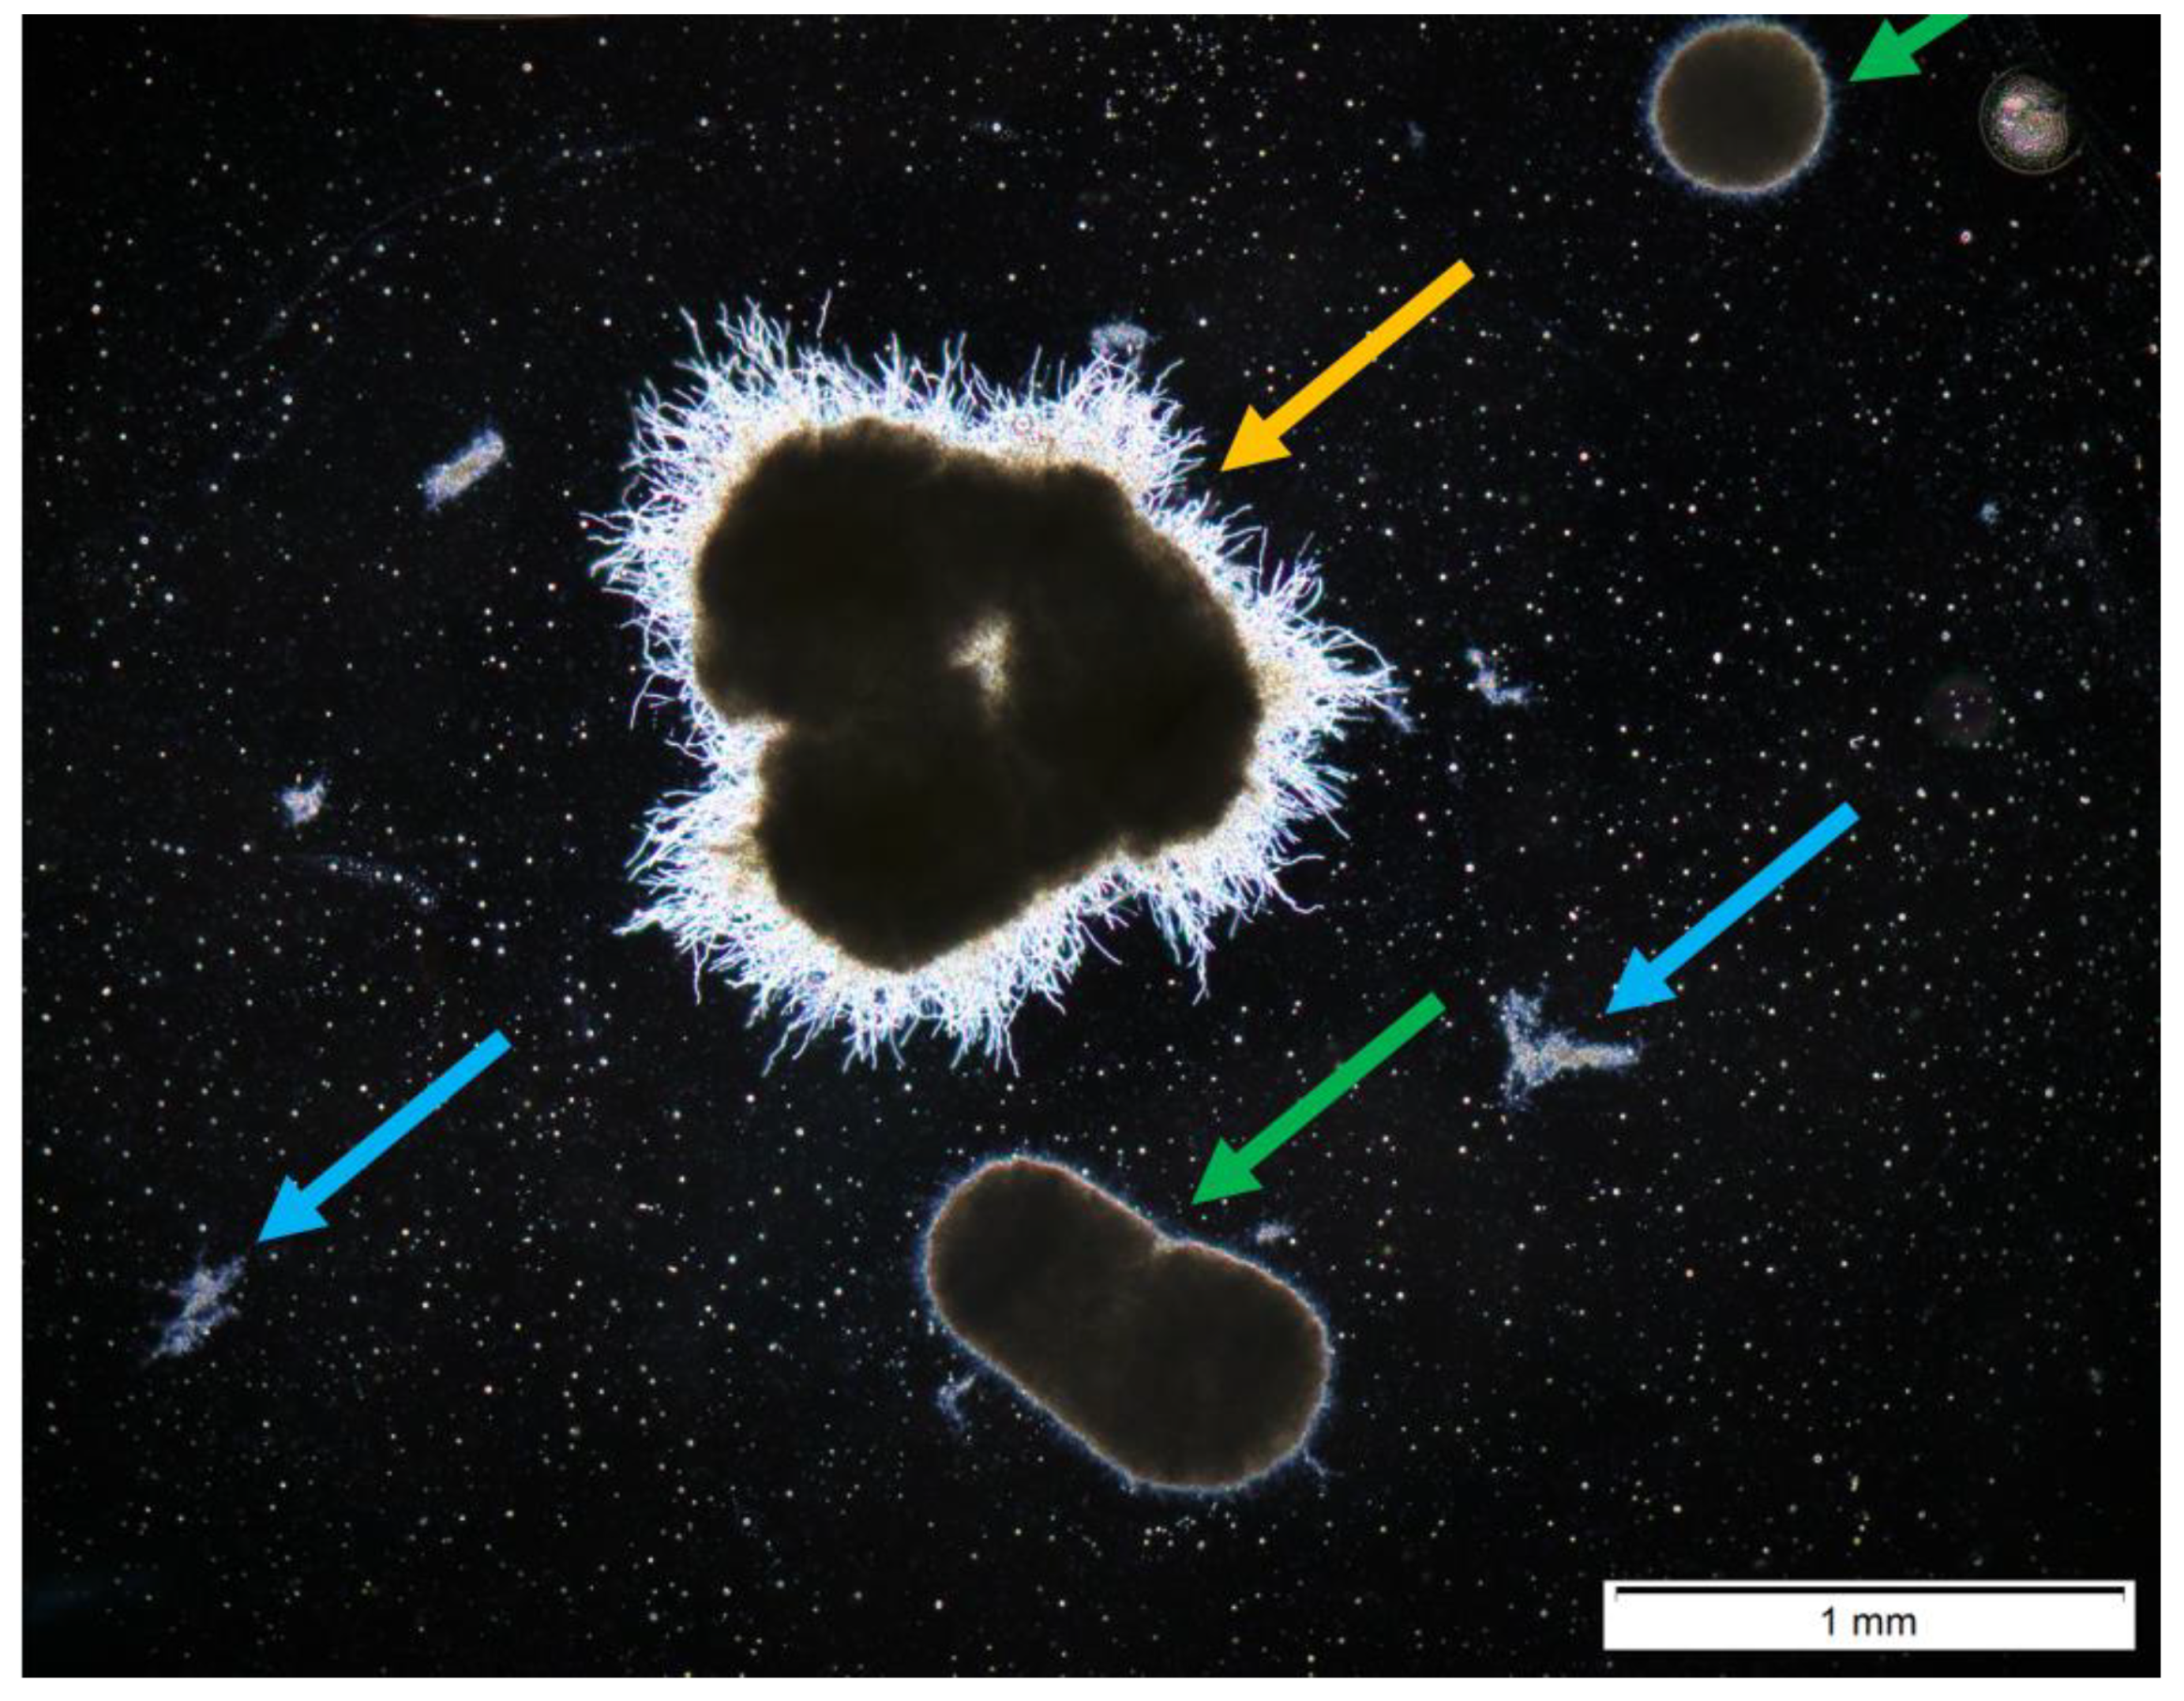
2.5. Morphological Analysis

Morphological analysis was conducted on the cultivation broth, collected every 24 h. The samples were taken from the coculture and both monocultures in parallel within an individual experiment. Next, vital slides were prepared and subjected to microscopic observations with the use of light phase contrast microscope (OLYMPUS BX53, Olympus Corporation, Japan). The images of the observed microorganisms were taken by the high-resolution RGB digital camera (OLYMPUS DP27) and analyzed with the use of image analysis software (OLYMPUS cellSens Dimension Desktop 1.16, Olympus Corporation, Japan). As a result, three morphological parameters, namely the projected area (A), elongation (E) and morphology number (Mo) defined by Wucherpfennig et al. [37], were obtained. Their detailed description was provided by Kowalska et al. [38]. Mean values of morphological parameters were calculated on the basis of at least 30 mycelial or actinomycete objects to assure the statistically significant data. A t-Student distribution with significance level α = 0.05 was used to calculate the confidence bands and a statistical t-test was applied to confirm the differences between the selected morphological parameters.

Semiautomatic Image Processing
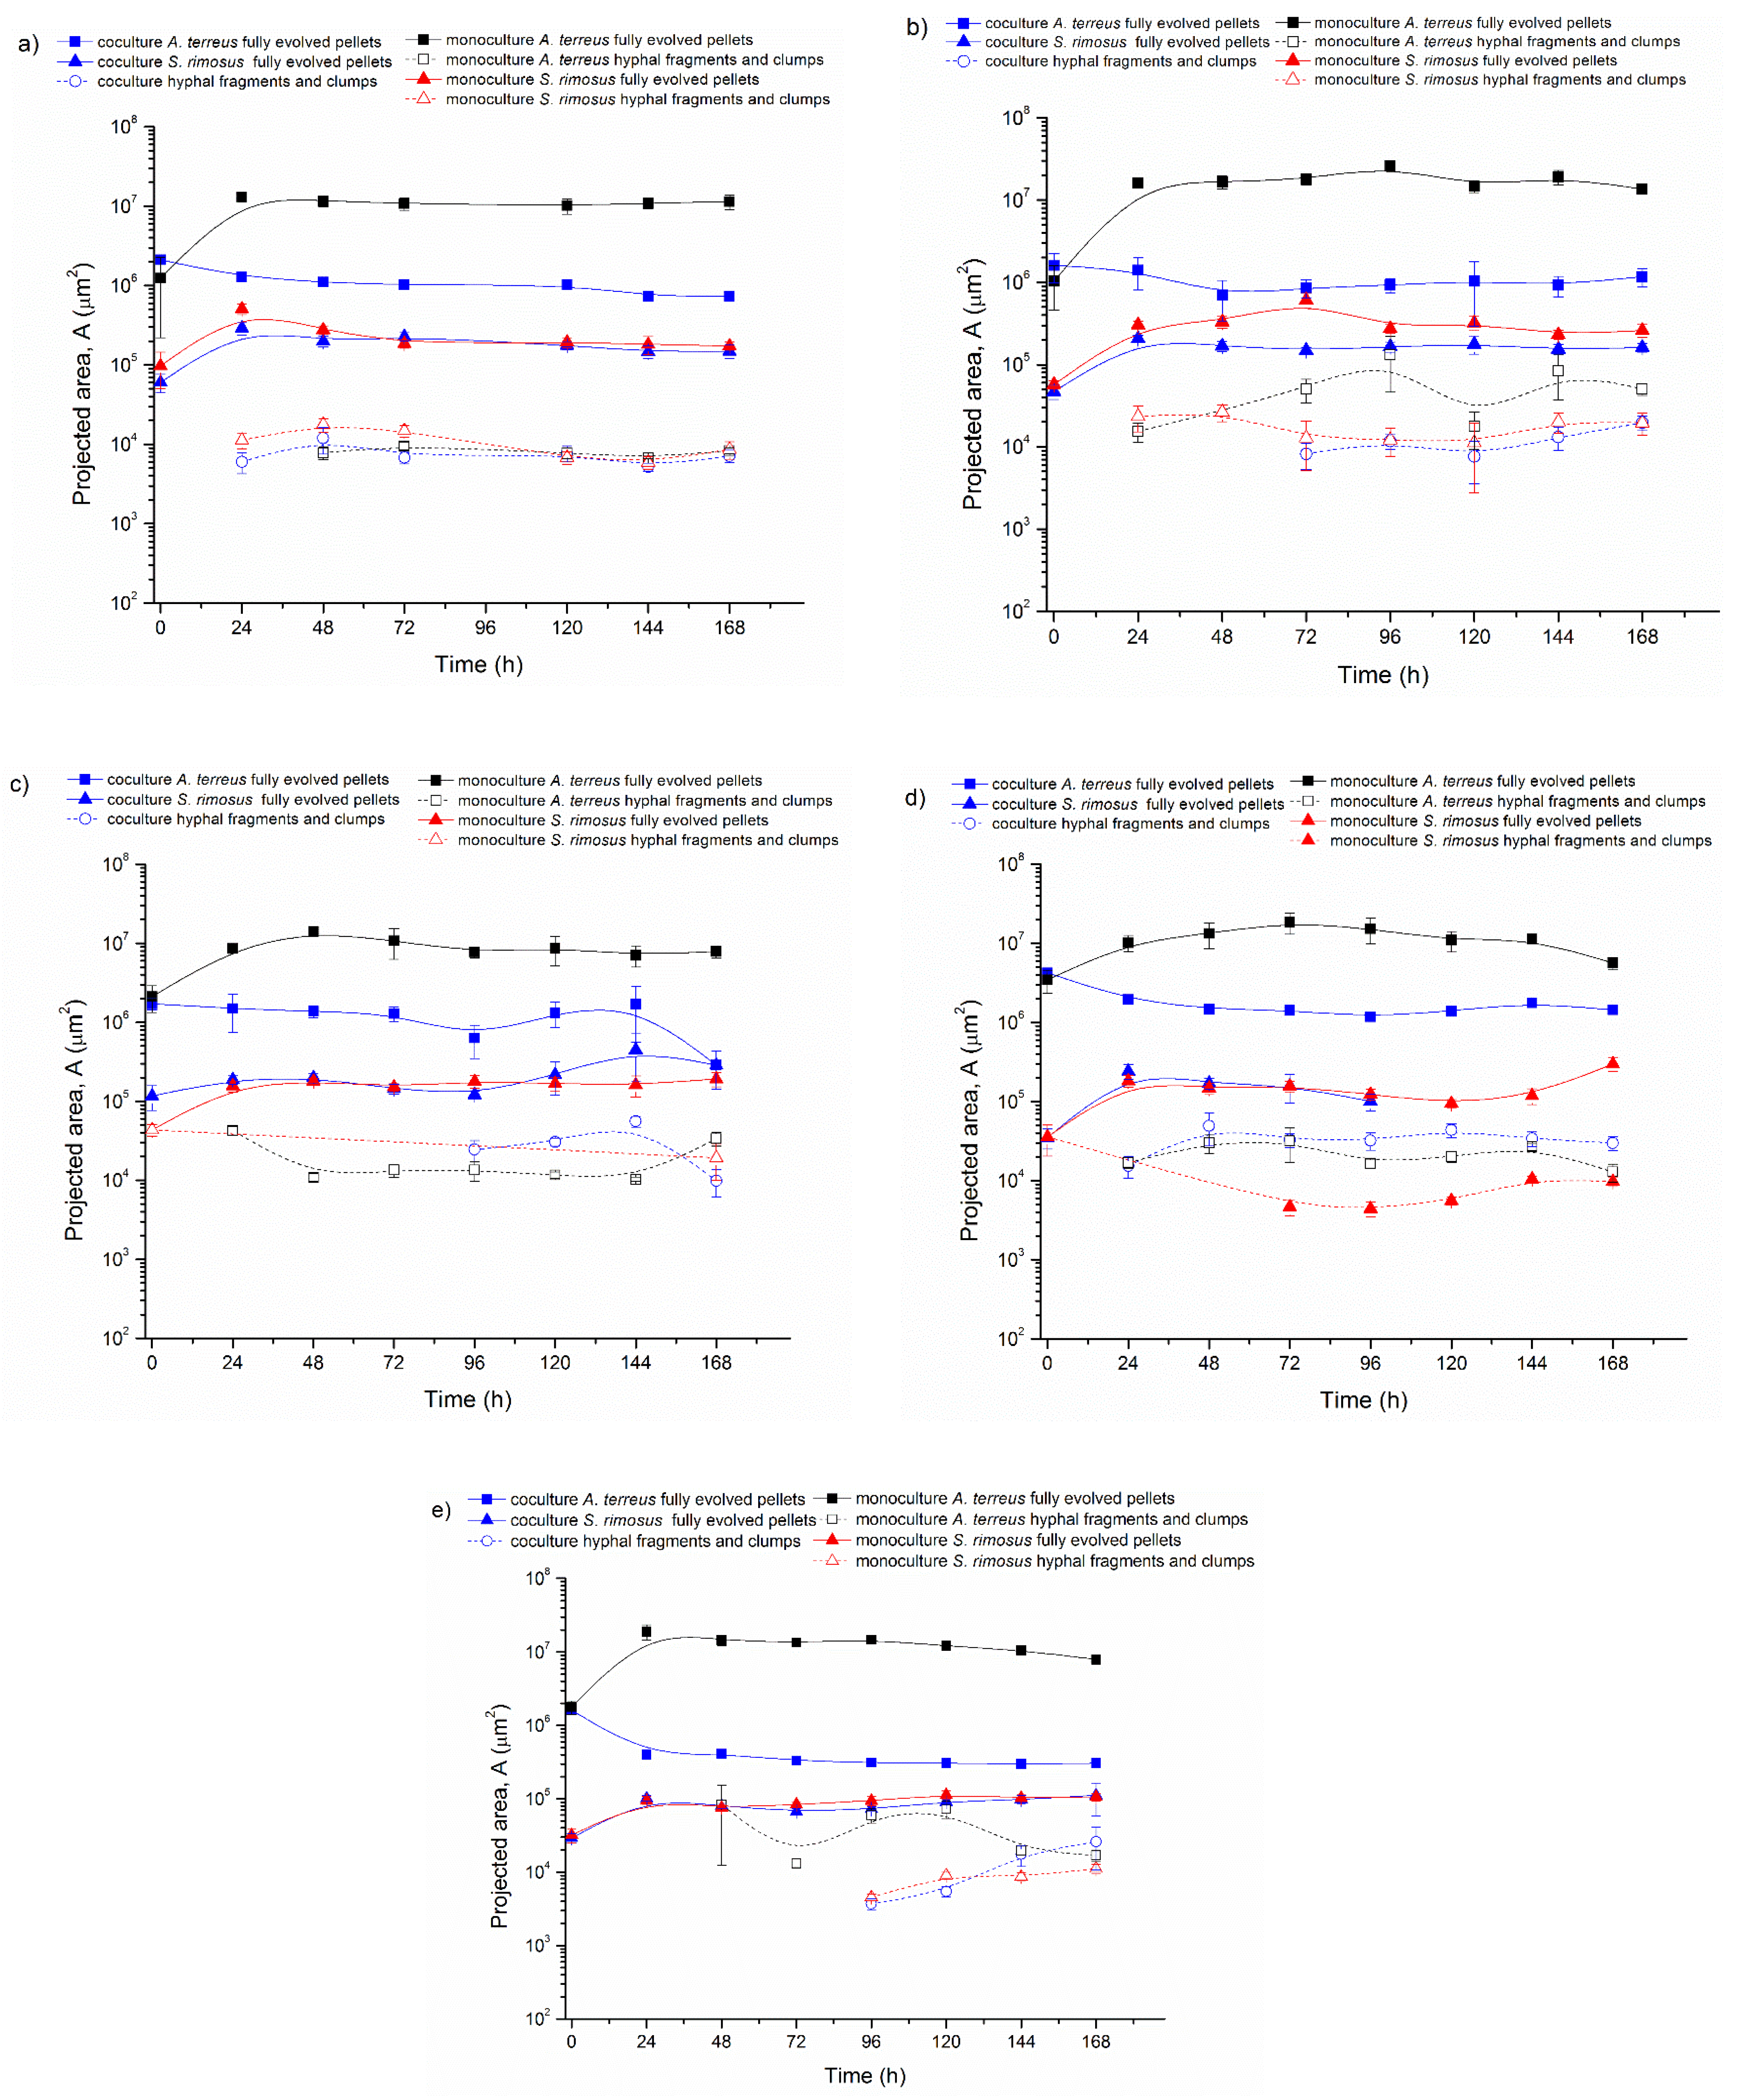
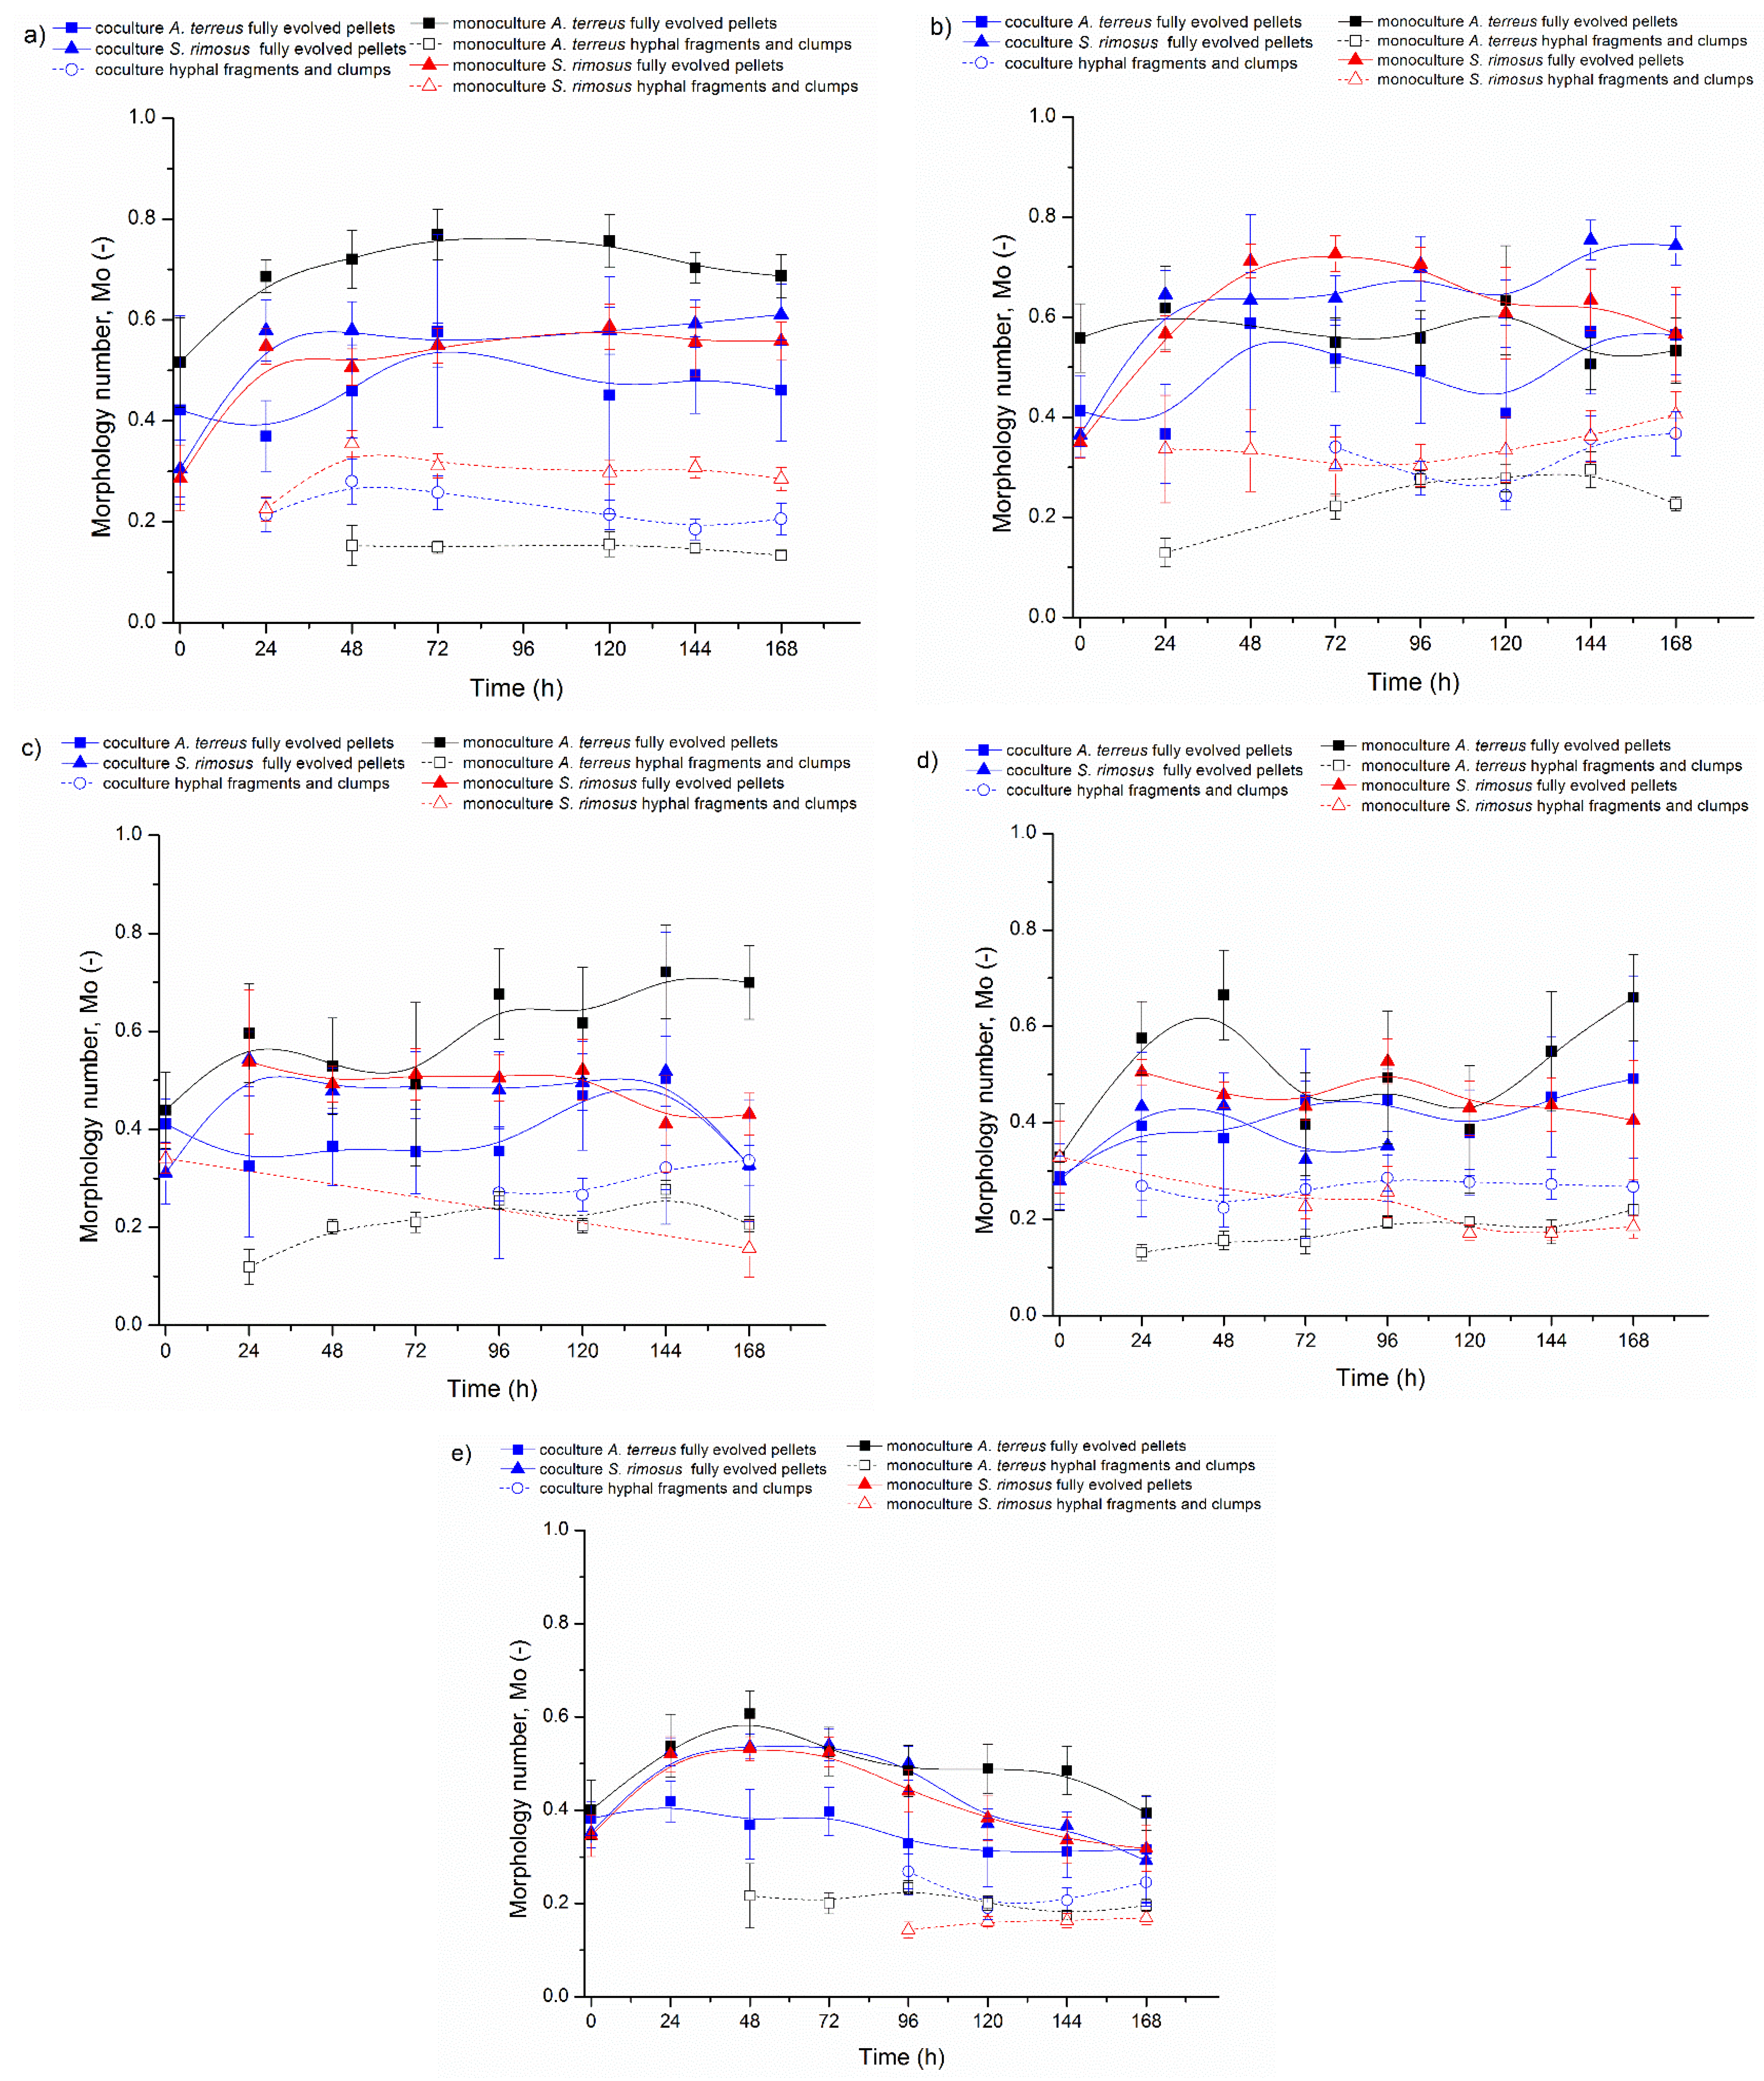
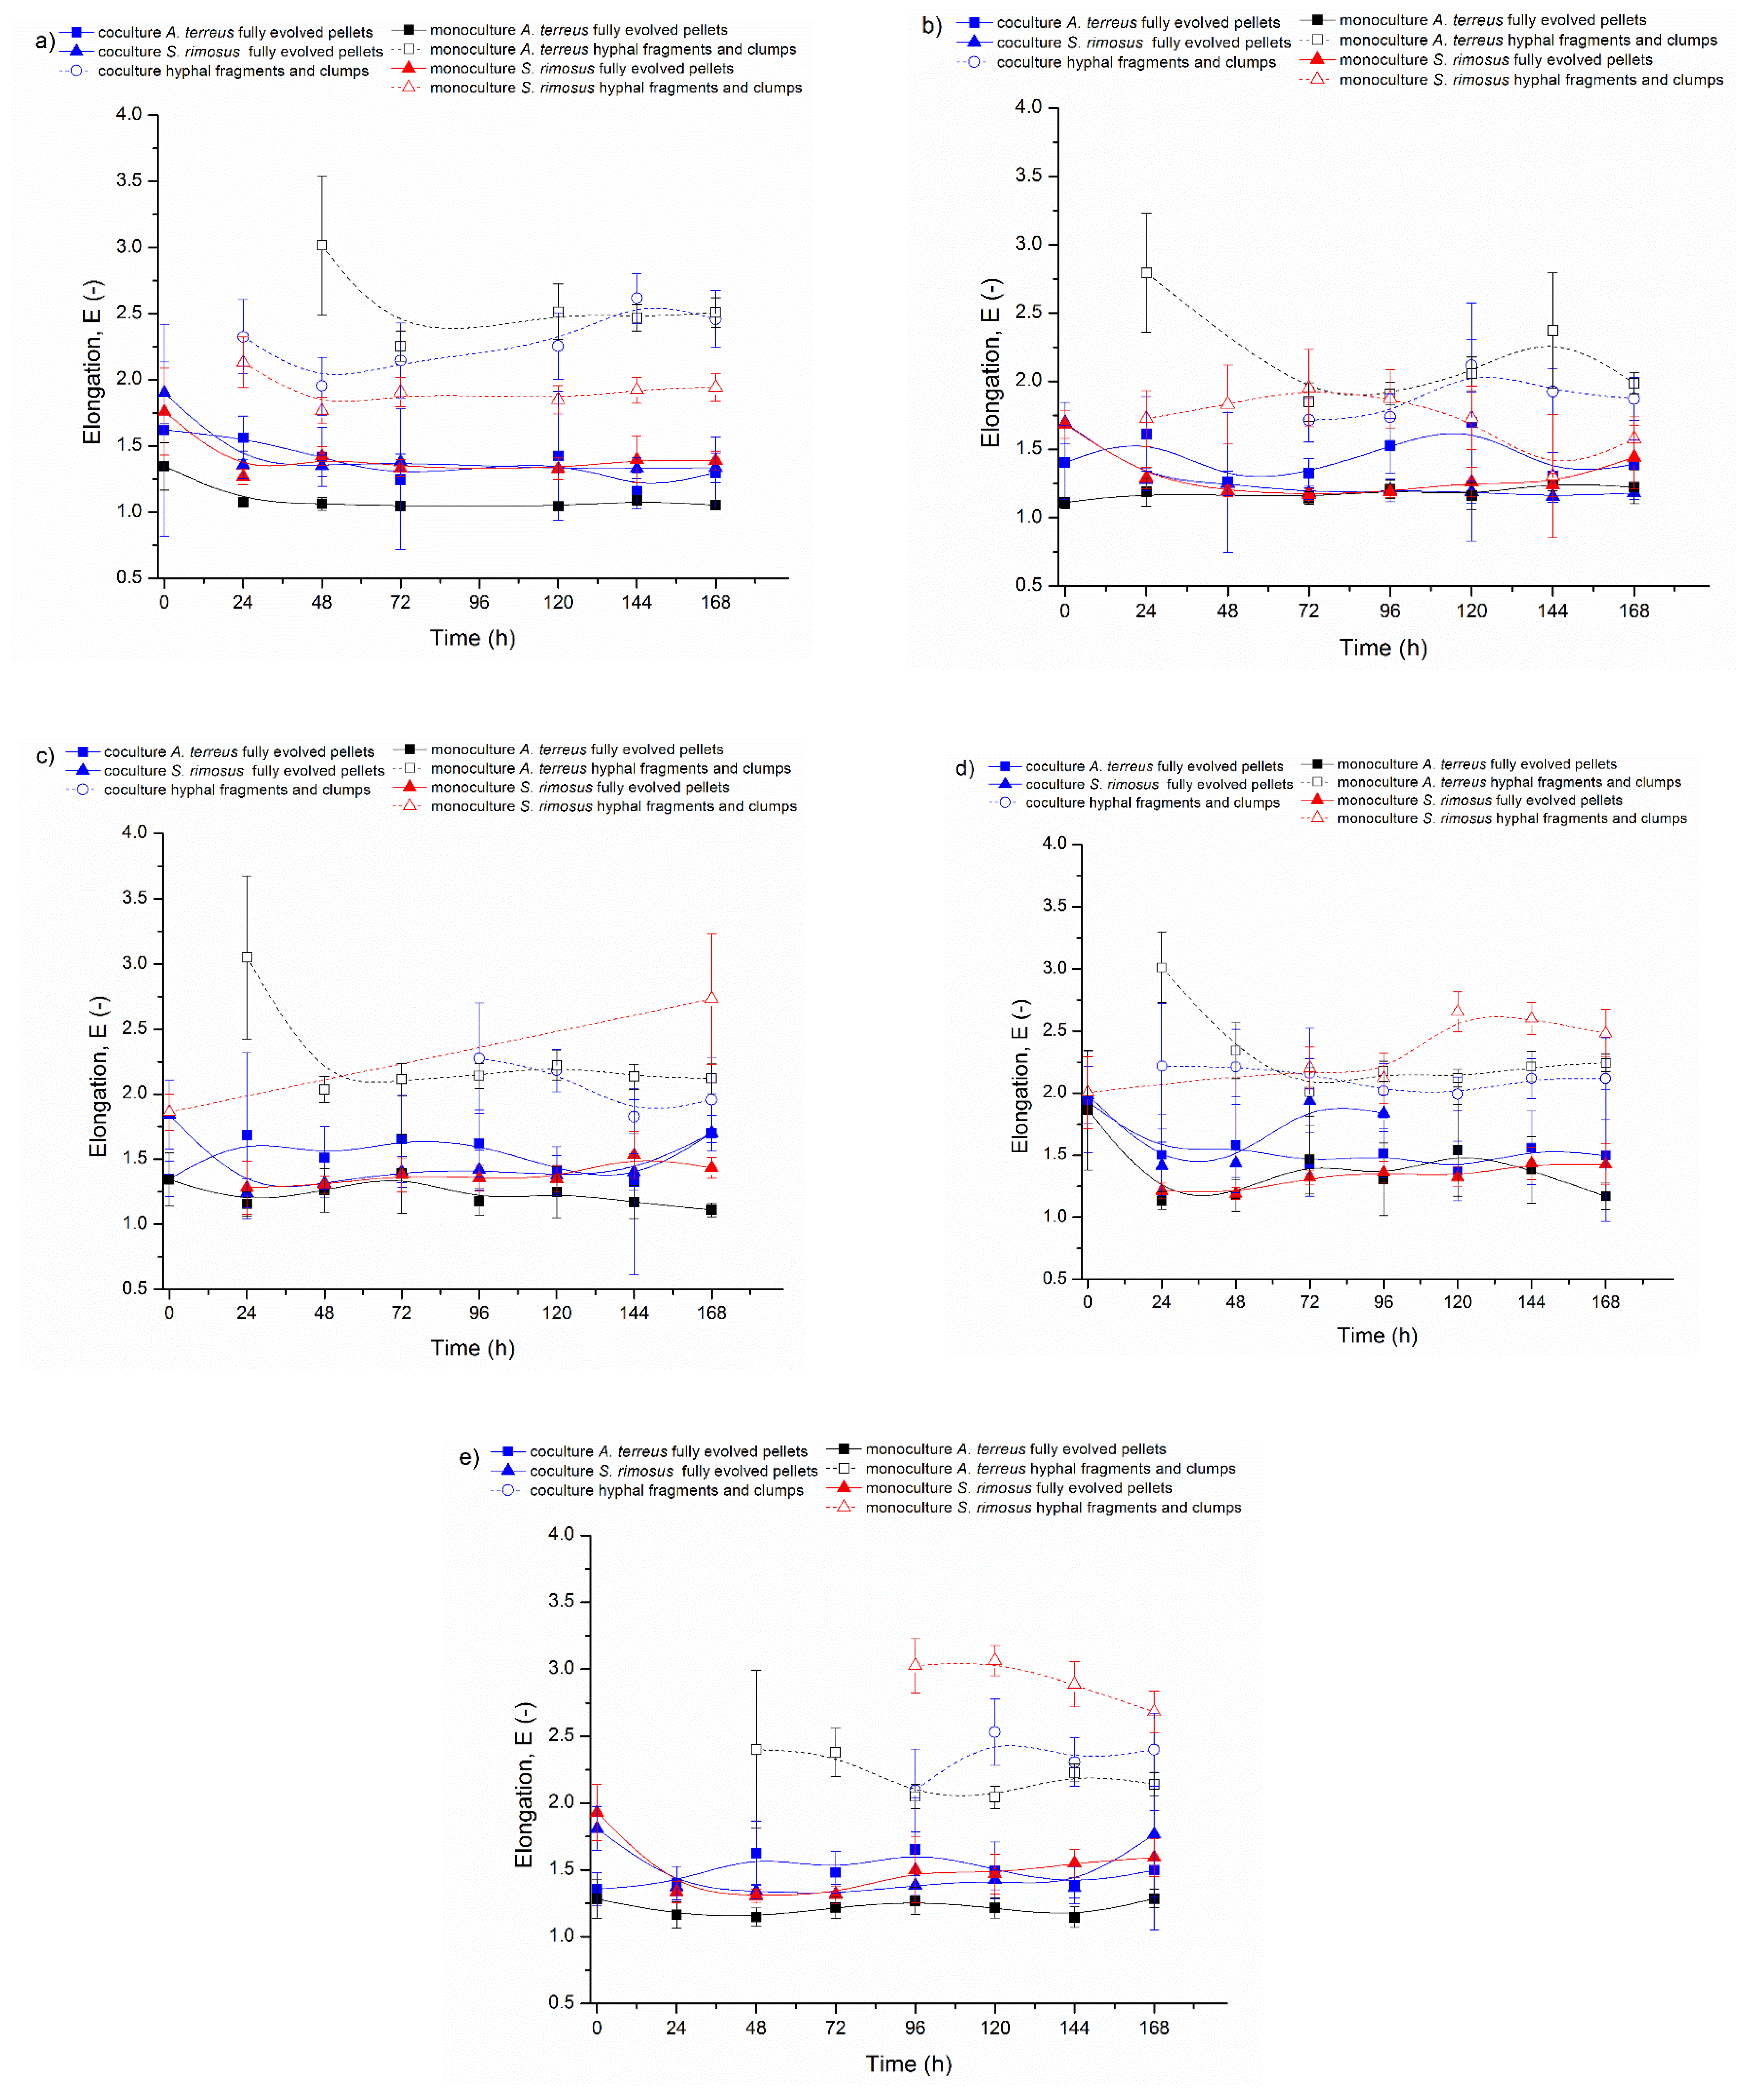
The semiautomatic image processing procedure began with the application the median filter and Sobel filter, to, respectively, smooth the edges of the objects and detect them. The next step was image segmentation, previously described in detail by Kowalska et al. [39]. The calculation of morphological parameters was conducted for A. terreus and S. rimosus separately. Even in the coculture, the objects were recognized and attributed to the studied species. This was performed using shape and size filters. Nevertheless, some of the A. terreus and S. rimosus objects turned out to be too similar for the automatic discrimination. In such cases, the operator made a decision regarding the species identification based on the observations of its morphological features. The last step of the image processing was the separation of two fractions within the data corresponding to a single microorganism: (1) the fully evolved pellets and (2) the hyphae and clumps. The shape and size filters were used for this purpose. The filter limit values were set by the operator depending on the morphology of the analyzed objects.

3. Results

The conducted experiments aimed at the identification of microbial morphology in coculture and finding the mutual influence between A. terreus and S. rimosus. Therefore, coculture initiation strategies and various cultivation medium compositions were taken into account. The full quantitative morphological analysis was performed by the calculation of the morphological parameters and discussed along with the changing culture conditions. Additionally, the morphological data were analyzed in the context of secondary metabolites production. Considering the cocultures, the terms “morphological domination” and “morphological advantage” were formulated to describe the “morphologically winning” microorganism. In the conducted cocultures, the morphological domination of one species was manifested by inhibiting the development of pellets of the competing microorganism. In the experiments in which the total destruction of pellets of one of the microorganisms did not occur, yet their sizes were significantly smaller, the term “morphological advantage” was applied.

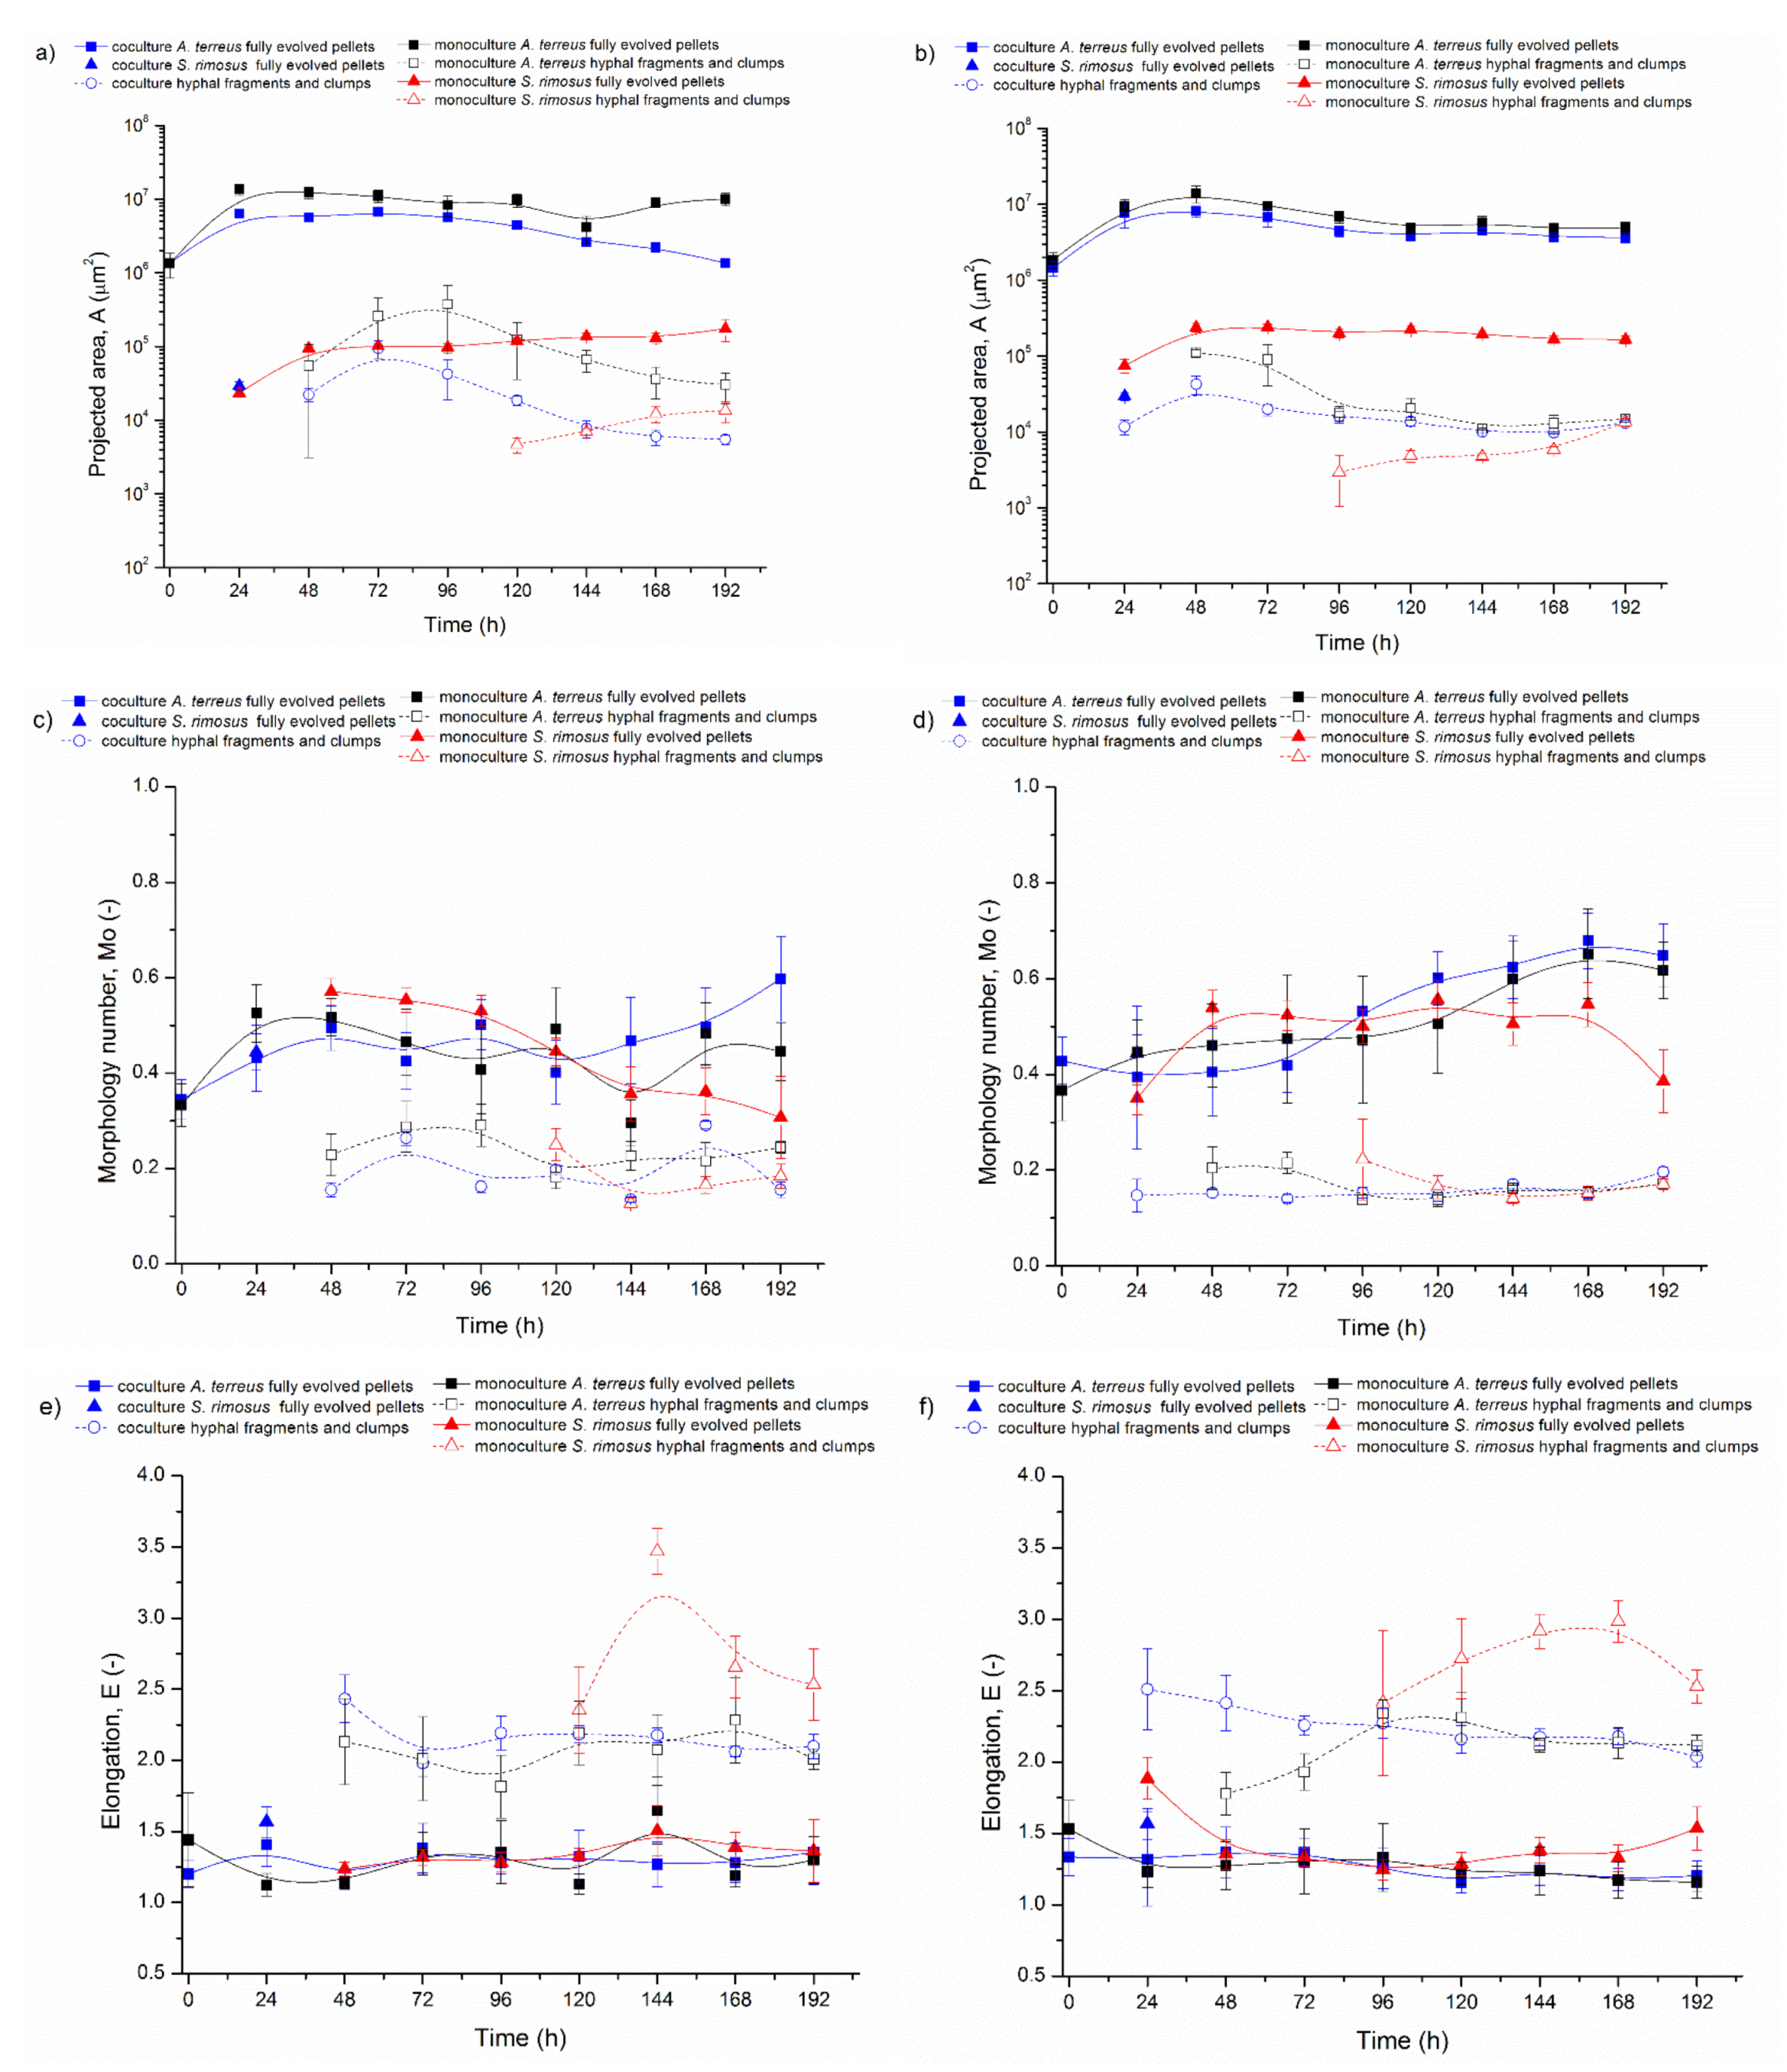
3.1. Bioreactor Cocultures Initiated by Simultaneous Introduction of A. terreus and S. rimosus Precultures

Five experiments on ATSR2 to ATSR6 were conducted using A. terreus and S. rimosus 24 h precultures for the coculture initiation in the bioreactor. Each individual experiment contained three parallel bioreactor cultivations: one A. terreus and S. rimosus coculture and two monoculture controls of the tested microorganisms. The obtained results are presented in Figure 1, Figure 2, Figure 3, Figure 4. Figure 2 shows the temporal changes of projected area (A). Each individual graph in Figure 2 corresponds to one experiment and contains the calculated values from the coculture and both corresponding monocultures. In this graph, the projected area values were separated into the distinct fractions of mycelial objects: fully evolved pellets and hyphae or clumps. For the sake of clarity, the examples of objects representing these fractions are depicted in Figure 1. So, a fully evolved pellet of A. terreus is denoted with a yellow arrow, the fully evolved pellets of S. rimosus are marked with green arrows, and the hyphae or clumps undistinguishable with regard to the species are indicated with blue arrows.
The other two morphological parameters, morphology number (Figure 3) and elongation (Figure 4), are presented in these figures using the same scheme as above.
Both A. terreus and S. rimosus are filamentous species which form pellets in the submerged bioreactor cultivations. Nevertheless, the mechanisms of the formation of their pellets are different. A. terreus is an agglomerative species, while S. rimosus exhibits nonagglomerative pellet formation. However, during growth of these microorganisms, one can also observe hyphae and clumps which can be formed in two cases. First, it happens at the beginning of the cultivation before pellets become fully evolved. Second, hyphae and clumps can be formed when pellets are “shaved” due to mechanical forces present in the bioreactor or due to mycelium aging.
At the beginning of ATSR2 (Figure 2a) in the monoculture, the projected area of the fully evolved A. terreus pellets (marked with solid black squares) was equal to 1.2 × 106 µm2 and increased over the next 24 h up to the value of 1.3 × 107 µm2. In the next hours of the cultivation, this parameter slightly decreased (A = 1.1 × 107 µm2 in 48 h) and then remained at this level. In the coculture, the projected area of A. terreus fully evolved pellets (marked with solid blue squares) showed a downward trend. Its initial value (at t = 0 h) was equal to 2.1 × 106 µm2 and in the last 168 h it decreased to 7.3 × 105 µm2.
The comparison of projected areas corresponding to A. terreus fully evolved pellets from the coculture and monoculture clearly indicated that A. terreus mycelial objects were significantly smaller when they evolved with competing S. rimosus (Figure S1). In 24 h of ATSR2, the difference between A. terreus pellets from coculture and monoculture amounted to an order of magnitude (A. terreus pellets: coculture A = 1.3 × 106 µm2, monoculture A = 1.3 × 107 µm2, p < 0.001).
The ATSR2 results obtained for the tested actinomycete were altogether different. The values of the projected area of S. rimosus fully evolved pellets (Figure 2a) in the coculture (marked with solid blue triangles) and monoculture (marked with solid red triangles) were almost identical. In 24 h, the projected area of S. rimosus pellets was equal to 2.9 × 105 µm2 in the coculture and 5.1 × 105 µm2 in the monoculture. Therefore, after the first day of the experiment, S. rimosus objects were the largest and their sizes showed the most significant difference between co- and mono-culture (p < 0.001). Next, a downward trend was observed. The final projected area for S. rimosus pellets equaled 1.5 × 105 µm2 in the coculture and 1.7 × 105 µm2 in the monoculture. Therefore, the S. rimosus objects were very similar (p > 0.05) irrespective of the presence or absence of the competing A. terreus in the coculture. The only exception was recorded in ATSR5. In this experiment, the pellets of S. rimosus vanished after 96 h. This could have been related to their irregular shapes, as indicated by the values of morphology number and elongation (Figure 2d).
Figure 2a also shows the hyphal fragments and clumps grown in ATSR2 (hollow marks). This kind of morphological object appeared in 24 h of S. rimosus monoculture and the coculture, whereas in A. terreus monoculture their presence was observed later in 48 h. The hyphal fragments and clumps’ sizes fluctuated on the level of 105 µm2 in all three ATSR2 cultivations (A. terreus monoculture, S. rimosus monoculture, A. terreus and S. rimosus coculture).
In ATSR2, S. rimosus gained the morphological advantage over A. terreus (Figure 2a). Therefore, in the next experiments from ATSR3 to ATSR6 (Figure 2b–e) the medium compositions were modified in order to weaken the aggressive S. rimosus (see Table 2). The last experiment conducted using the strategy of simultaneous co-inoculation with precultures (ATSR6) was run in the medium optimal for A. terreus growth and lovastatin biosynthesis (lactose as the sole carbon source, without ammonium sulphate and pH control). However, all these actions did not lead to a significant change in the final result of the cultivation. Comparing A. terreus pellets in the experiments from ATSR2 to ATSR6, their sizes were always significantly smaller in the cocultures than in the monocultures (Figure 2). Despite the minor differences in the size of the morphological objects caused by the medium modification, the following main trends were maintained in all described experiments from ATSR2 to ATSR6: the projected area of the A. terreus fully evolved pellets decreased due to S. rimosus presence in the coculture and S. rimosus fully evolved pellets projected area remained practically the same in mono- and co-cultures (Figure 2a–e). It can be concluded that in the experiments ATSR2-ATSR6, S. rimosus always gained the morphological advantage over A. terreus.
The next calculated parameter, namely morphology number (Mo) (Figure 3), is connected with shape and size of mycelial objects. An Mo value close to 1 corresponds with spherical and regular forms such as spores and pellets, yet an Mo value approaching 0 represents elongated hyphae. In the experiments from ATSR2 to ATSR6, the differences between the values of morphology number for A. terreus and S. rimosus were not as clear as in the case of the projected area.
Nevertheless, based on the results it can be concluded that the change of the cultivation medium caused the decrease in A. terreus morphology number in the monocultures (Figure 3a,e). The highest value of this parameter, equal to 0.77, was obtained in 72 h of ATSR2 for fully evolved A. terreus pellets in the monoculture, while the corresponding morphology number from ATSR6 was lower and equal to 0.53 (p < 0.001). In contrast to ATSR2, the highest morphology number in the ATSR6 experiment for fully evolved A. terreus pellets in the monoculture was only 0.61 (at t = 48 h). The statistically significant morphological changes of fully evolved A. terreus pellets in the monocultures were also confirmed by p value calculated for the highest morphology number from the first and the last experiment (72 h ATSR2 Mo = 0.77 and 48 h ATSR6 Mo = 0.61, p < 0.001), which were conducted with the use of different cultivation media. The change of the cultivation medium composition exerted the similar effect for A. terreus in the coculture. Morphology number for A. terreus fully evolved pellets in the coculture in 72 h of ATSR2 was 0.58, and in 72 h of ATSR6 was equal to 0.40 (p < 0.05). More importantly, the presented values showed that morphology number for A. terreus fully evolved pellets in the coculture was lower in comparison to the monoculture (e.g., ATSR2 at 72 h in the coculture Mo = 0.58; ATSR2 at 72 h in the monoculture Mo = 0.77; p < 0.05).
Considering morphology number of S. rimosus fully evolved pellets in the experiments ATSR2 and ATSR6 in the corresponding time points (72 h), it is seen that the mono- and coculture values from the first and the last experiment were almost identical (Figure 3a,e): (1) S. rimosus monoculture fully evolved pellets Mo = 0.55 at 72 h of ATSR2 and at 72 h of ATSR6 Mo = 0.52 (p > 0.05); (2) S. rimosus coculture fully evolved pellets Mo = 0.55 at 72 h of ATSR2 and Mo = 0.54 at 72 h of ATSR6 (p > 0.05). However, after 72 h of ATSR2 and 72 h of ATSR6, the trends of the temporal changes of morphology number varied. In the ATSR2 (Figure 3a) case, monoculture parameters remained stable and in the coculture they were slightly raised. In ATSR6 (Figure 3e), morphology number decreased until the end of the experiment in both mono- and co-culture. Moreover, in ATSR3 (Figure 3b) relatively high morphology number values were observed. For example, in 72 h of ATSR3, for S. rimosus fully evolved pellets in the monoculture this parameter was equal to 0.73, and its corresponding value in the coculture was 0.64. It was evident that the changes of cultivation medium composition caused an ambiguous effect on S. rimosus pellets morphology number. Furthermore, the presence of A. terreus in the cultivation did not influence this value (Figure 3). For S. rimosus fully evolved pellets, there was no difference between morphology number in the monoculture and in the coculture.
The morphology number of hyphal fragments and clumps from experiments ATSR2 to ATSR6 was depicted by hollow marks (Figure 3). Their values were within the range 0.1–0.35, which was in accordance with the morphology number theory. As for the elongated hyphae objects without circular shape, morphology number was closer to 0.
Elongation (E), the last calculated morphological parameter, determined the shape of the analysed objects. Its higher values corresponded to more elongated objects such as hyphae. Low values of elongation being close to 1–1.5 indicated the presence of circular morphological forms, e.g., pellets. Figure 4 shows the temporal changes of elongation in the experiments from ATSR2 to ATSR6. During the experiments, the most remarkable changes of this parameter occurred in the first 24 h, and therefore this time point was chosen for more detailed considerations. The most important insights concerned the differences between mono- and co-cultures. Despite the fluctuations of its value, the elongation of A. terreus fully evolved pellets was distinctly higher in the cocultures in comparison to the monocultures, which is well justified by the selected data shown in Table 3.
However, despite the general trend, the rare cases when the elongation values of A. terreus fully evolved pellets in the coculture were close to the values from the corresponding monoculture or even higher occurred in the experiments from ATSR2 to ATSR6. Nevertheless, they were not statistically significant, which shows the example of 120 h of ATSR5 (coculture E = 1.37; monoculture E = 1.54; p > 0.05). Furthermore, the values presented in Figure 4 and Table 3 proved the lack of influence of the change of cultivation medium on the elongation A. terreus fully evolved pellets from ATSR2 to ATSR6 experiments.
Unlike A. terreus, the values of elongation for S. rimosus fully evolved pellets did not significantly differ in the mono- and co-cultures (Figure 4). For instance, in 24 h of the ATSR2 run, elongation of S. rimosus fully evolved pellets was equal to 1.36 in coculture and 1.29 in monoculture (p > 0.05). The corresponding elongation values from 24 h of ATSR6 reached 1.37 in coculture and 1.36 in monoculture (p > 0.05). Moreover, these values showed that the change of the cultivation medium composition had no influence on the elongation of S. rimosus fully evolved pellets. Its value from 24 h of ATSR2 coculture and ATSR6 monoculture were identical (E = 1.36; E = 1.36; p > 0.05). The only different trend was observed in ATSR5 (Figure 4d). In this experiment, the values of elongation of S. rimosus fully evolved pellets in 24, 48 and 72 h were significantly higher in the coculture than in the corresponding monocultures. The value of this parameter calculated for 24 h was equal to 1.41 in the coculture and 1.21 in the monoculture (p < 0.05). Next, S. rimosus pellets were progressively irregular. In 96 h of ATSR5 coculture their elongation reached 1.84, and within the next 24 h the pellets completely vanished.
The elongation for the hyphal fragments’ and clumps’ in the experiments from ATSR2 to ATSR6 fluctuated from 1.75 to 3.25, and as in the case of the morphology number, its values were in accordance with the theory.

3.2. Delayed Introduction of S. rimosus to Bioreactor Coculture

The second stage of the study included two experiments, namely ATSR7 and ATSR8 (Figure 5). In this part, the coculture initiation method was based on the delayed introduction of S. rimosus to ultimately give chance of better A. terreus development. For this purpose, the 24 h A. terreus precultures were prepared and introduced to two bioreactors intended for the coculture and monoculture, respectively. After 24 h of undisturbed growth of A. terreus, the 24 h precultures of S. rimosus were introduced to the coculture bioreactor containing the fungus and to the sterile bioreactor purposed for the monoculture. ATSR7 and ATSR8 experiments differed with regard to the carbon source in the cultivation medium (lactose as the sole carbon source in ATSR7, lactose and glucose as carbon sources in ATSR8, as shown in Table 2).
Figure 5a,b present the changes of projected area of the mycelial objects in ATSR7 and ATSR8, respectively. In the moment of the introduction of S. rimosus preculture to the coculture bioreactor in 24 h of ATSR7, the size of A. terreus fully evolved pellets in the coculture bioreactor was equal to 6.3 × 106 µm2, while in the respective monoculture bioreactor the value of 1.4 × 107 µm2 was recorded. After next 24 h of the experiment, projected area of A. terreus pellets decreased to 5.6 × 106 µm2 in the coculture bioreactor and remained at the similar level of 1.2 × 107 µm2 in the respective monoculture bioreactor (p < 0.001). The presence of the actinomycete was the reason of this statistically significant difference.
In the ATSR8 run, the values of projected area of A. terreus fully evolved pellets in co- and mono-culture were even more similar than in ATSR7 in 24 h in the moment of S. rimosus introduction. Their exact projected area had following values: in the coculture A = 7.6 × 106 µm2 and in the monoculture A = 9.4 × 106 µm2 (p > 0.05), and their difference was not found to be statistically significant. Later on in ATSR8 coculture, 24 h after the introduction of S. rimosus preculture, projected area of A. terreus fully evolved pellets increased only to the value of 8.2 × 106 µm2, while in the monoculture it reached 1.4 × 107 µm2 (p < 0.01) and the difference was significant. This indicated the action of S. rimosus. The addition of the second carbon source (glucose and lactose used simultaneously) in ATSR8 prevented the final projected area decrease observed for A. terreus fully evolved pellets in ATSR7 coculture. A. terreus fully evolved pellets projected area at 192 h of ATSR7 coculture was equal to 1.4 × 106 µm2, while at 192 h of ATSR8 coculture it was equal to 3.7 × 106 µm2.
Despite the smaller size of A. terreus pellets in the coculture compared to the monoculture, the fungal morphological domination over S. rimosus in ATSR7 and ATSR8 was noticeable (Figure 5a,b, Figure S2). Although in the monocultures of S. rimosus the morphological changes with regard to the size of fully evolved pellets were the same as in ATSR6 (the experiment with simultaneous coculture initiation method, Figure 2e), actinomycete morphology in the cocultures was entirely dispersed. S. rimosus fully evolved pellets in ATSR7 and ATSR8 were only observed in 24 h, shortly after coculture initiation (solid blue triangle in Figure 5a,b). These were the ones formed in the preculture. In the next hours of ATSR7 and ATSR8, the cocultures contained only A. terreus pellets and hyphal fragments and clumps (hollow blue circles Figure 5a,b) from both microorganisms. For this reason, only the hyphal fragments and clumps morphological fraction was described in detail. Before ATSR7 S. rimosus pellets were destroyed, their projected area was equal to 3.0 × 104 µm2 in the moment of the introduction to the coculture bioreactor. Within the next 24 h, S. rimosus morphology in the coculture became dispersed and the projected area of hyphal objects, not pellets, decreased to 2.2 × 104 µm2. However, one should keep in mind that in the coculture, hyphal and clumps fraction contained both A. terreus and S. rimosus. Afterwards, in 72 h the size of hyphal and clumps fraction increased reaching maximum projected area equal to 9.4 × 104 µm2. This value was similar and almost as high as the corresponding projected area of S. rimosus fully evolved pellets in ATSR7 monoculture, which was equal to 1 × 105 µm2 (p > 0.05). Nevertheless, the other two morphological parameters, morphology number (Figure 5c) and elongation (Figure 5e) confirmed that the objects in 72 h of ATSR7 described as hyphae and clumps were classified correctly despite their relatively big sizes. Exact values of morphology number and elongation were 0.26 and 1.98 in the coculture and monoculture, respectively. Similar correlations between morphological parameters were observed for fraction of A. terreus hyphae and clumps in 72 and 96 h of ATSR7 monoculture. In terms of hyphae and clumps’ fraction distribution, the results of the ATSR8 run were the similar to the ATSR7 run (Figure 5b,d,f). In this case, only one difference was found to be significant. In 24 h of ATSR8 coculture, all three fractions (A. terreus pellets, S. rimosus pellets, hyphae and clumps) were present while in ATSR7 only the pellets of both organisms were observed.
In summary, comparing the experiments ATSR2-ATSR6 with ATSR7 and ATSR8, it can be concluded that the application of the alternative coculture initiation method caused remarkable changes in the evolution of S. rimosus and A. terreus morphology (Figures S1 and S2). The modification of cultivation medium composition also had an influence on the conducted experiments, however this effect was noticeably weaker.

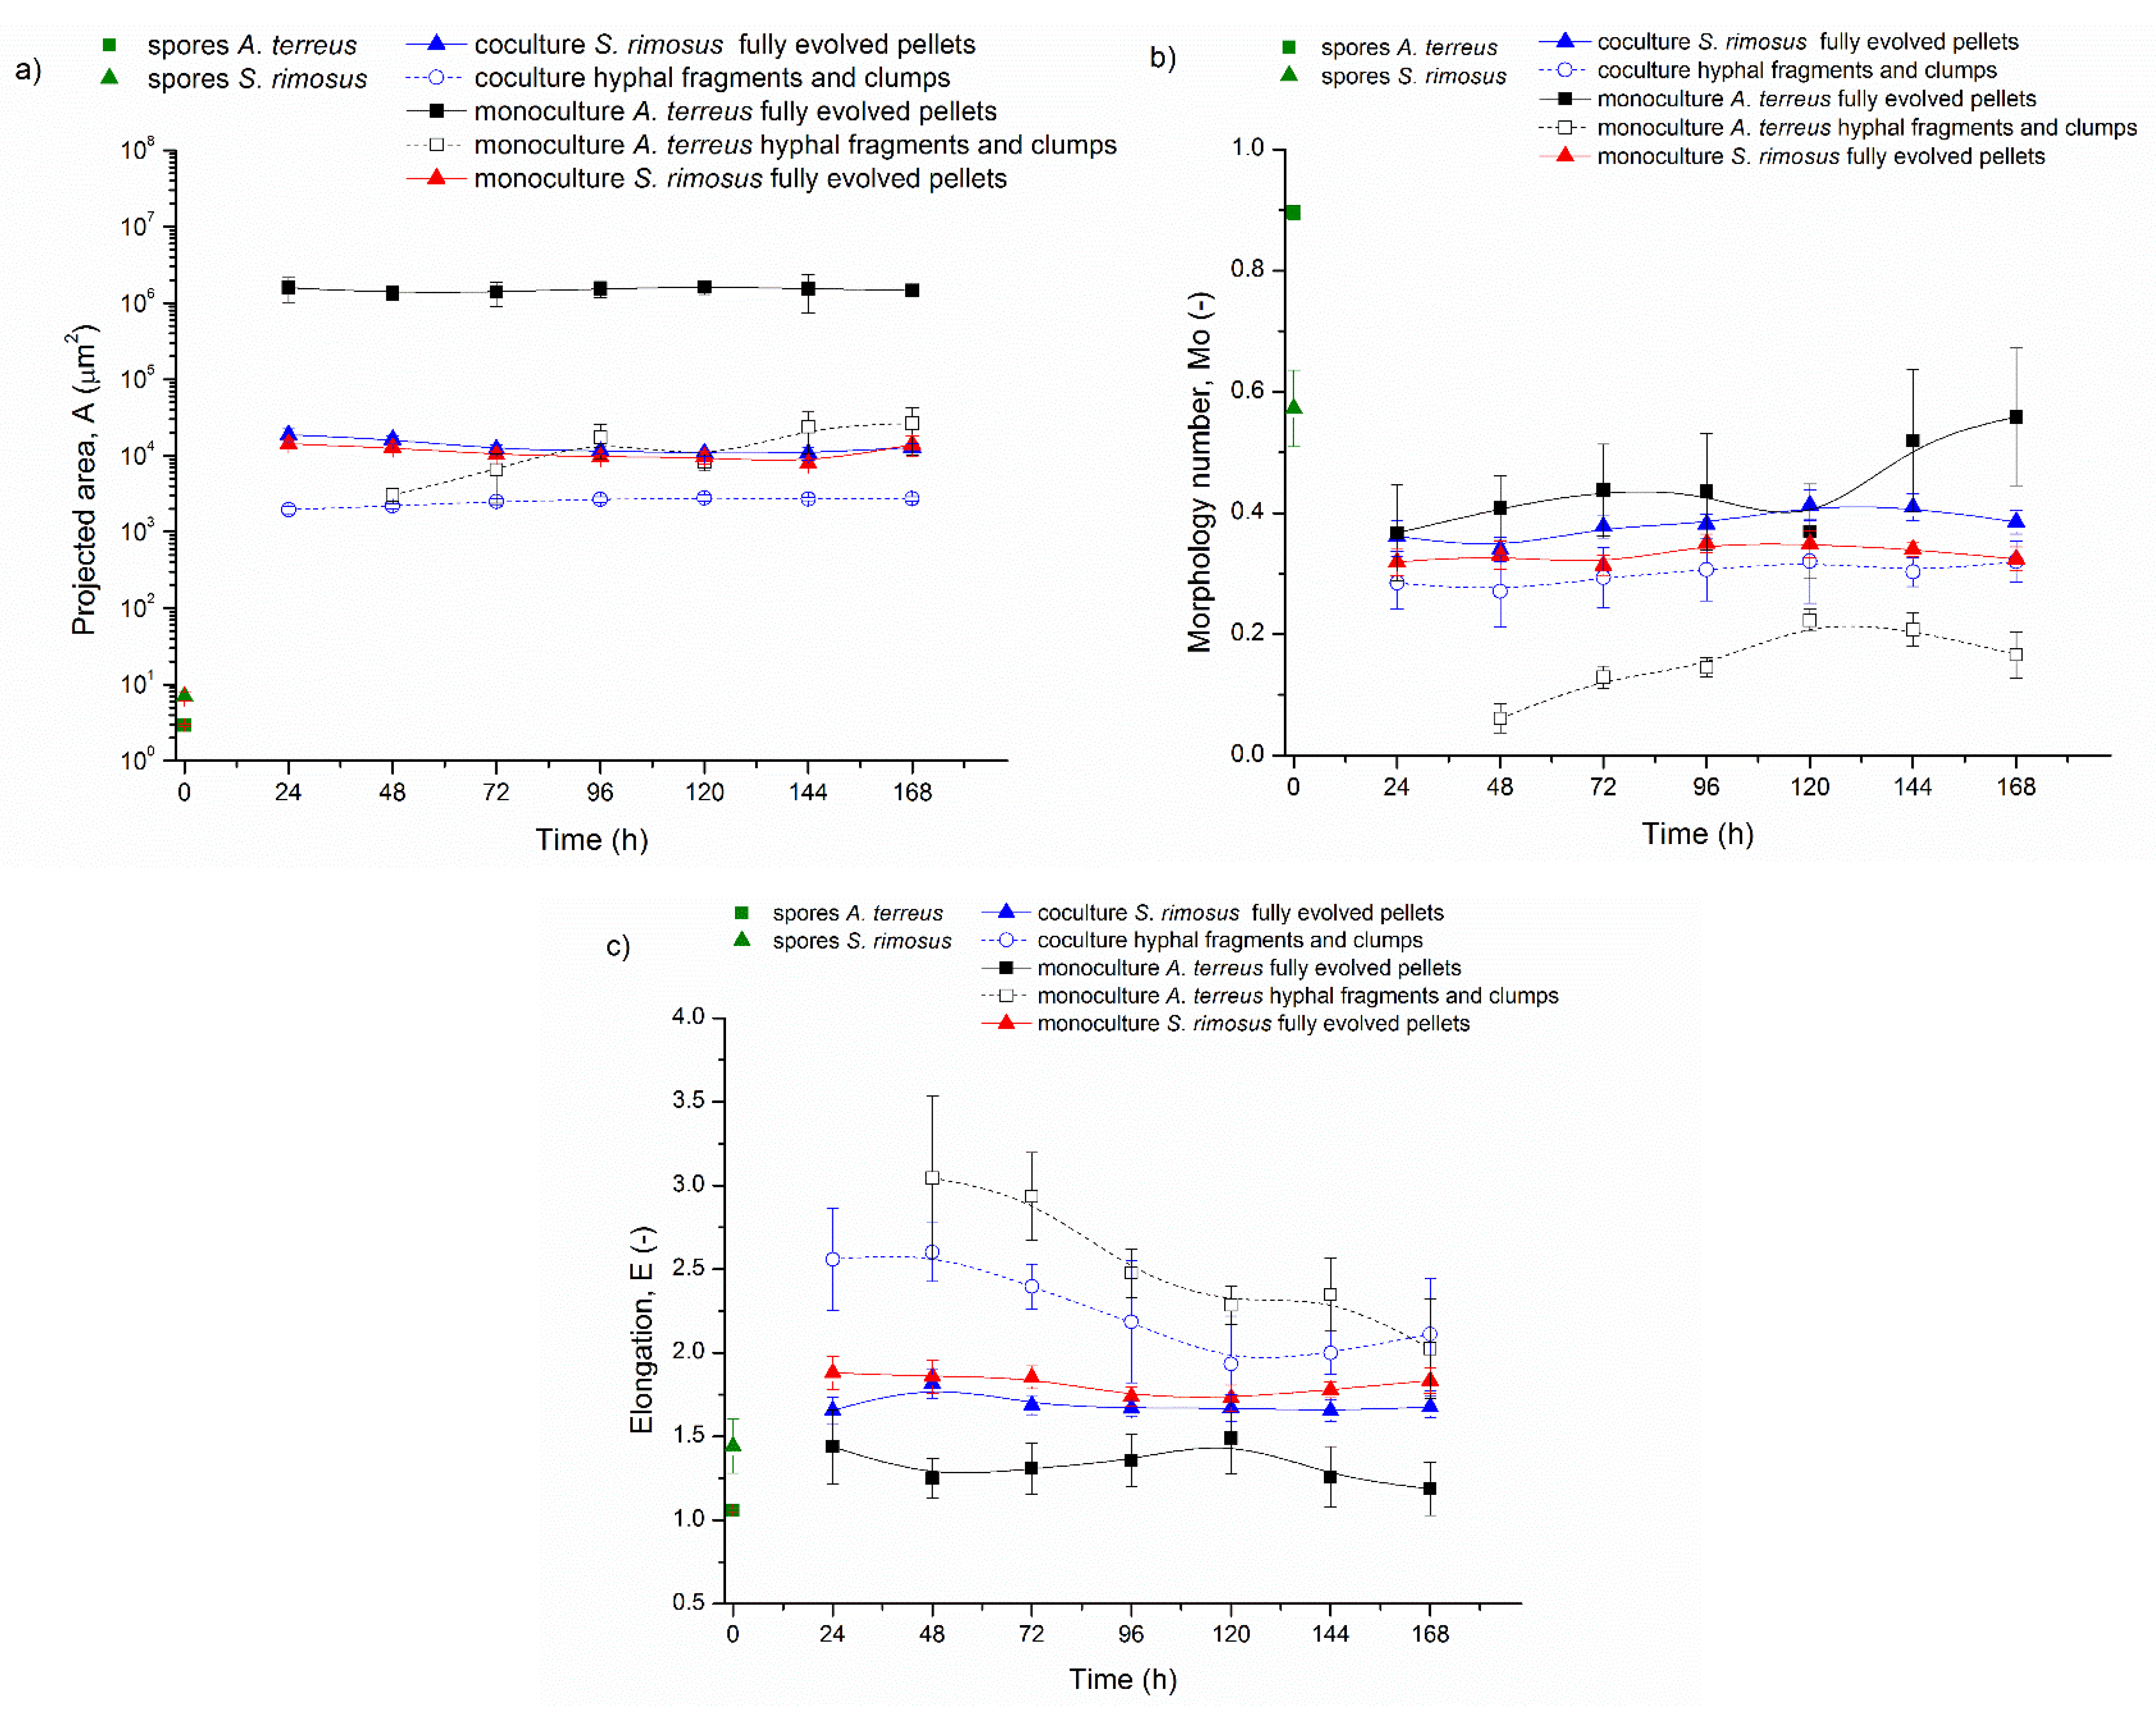
3.3. Bioreactor Cocultures Initiated by Simultaneous Introduction of A. terreus and S. rimosus Spores

The last tested coculture initiation method was implemented in the ATSR9 experiment (Figure 6 and Figure S3). In this experiment, A. terreus and S. rimosus spores were washed directly into the inoculation bottles and introduced simultaneously into the bioreactors intended for the coculture and monoculture controls. Moreover, this initiation method (spores versus spores) was tested in only one medium (Table 2) due to the minor morphological effect of the culture medium composition modifications observed in the previous experiments.
In the ATSR9 coculture, only hyphal fragments and clumps and S. rimosus fully evolved pellets were present. A. terreus fully evolved pellets were not observed at all (Figure 6a). This indicated the morphological domination of S. rimosus over A. terreus. Furthermore, after 72 h of the experiment, S. rimosus pellets from the coculture had almost identical sizes to its fully evolved pellets in monoculture, which was proved by following values: The projected area of S. rimosus fully evolved pellets in 24 h of ATSR9 was equal 1.9 × 104 µm2 in the coculture and 1.4 × 104 µm2 in monoculture (p < 0.01). Therefore, the values were similar, yet the difference between them was statistically significant. Afterwards, S. rimosus fully evolved pellets sizes were almost equal. In 72 h of ATSR9 the corresponding projected area reached 1.2 × 104 µm2 in the coculture and 1.0 × 104 µm2 in the monoculture (p > 0.05), whereas in the end of the ATSR9 (168 h) run, projected area values amounted to 1.3 × 104 µm2 in the coculture and 1.4 × 104 µm2 in monoculture (p > 0.05). Therefore, the results obtained from the ATSR9 experiment clearly indicated S. rimosus having morphological domination over A. terreus. What is more, in rare cases the fungus was assimilated by S. rimosus pellets (Figure 7). It can be supposed that the thicker hyphal elements presented by red arrows in Figure 7, which were entirely integrated with S. rimosus pellets, might have belonged to A. terreus. Moreover, morphology number at 24 h of ATSR9 (Figure 6b) for fully evolved pellets in the coculture and those in the S. rimosus monoculture were similar and equal to 0.36 and 0.37, respectively, with p > 0.05. Last but not least, the values of elongation presented in Figure 6c confirmed that these objects belonged either to the fraction of S. rimosus fully evolved pellets or hyphae and clumps fraction. In ATSR9, they ranged from 1.86 (S. rimosus monoculture at 48 h) to 1.19 (A. terreus monoculture at 168 h) for pellets and from 1.93 (coculture at 120 h) to 3.05 (A. terreus monoculture at 48 h) for hyphae and clumps’ fraction.
To conclude, three described coculture initiation methods induced characteristic morphological effects. The spores-versus-spores coculture initiation method caused the morphological domination of S. rimosus manifested by the inhibition of the development of A. terreus pellets (Figure S3c) Admittedly, the preculture-versus-preculture method of coculture initiation also supported S. rimosus, however, it did not cause A. terreus pellets to vanish (Figure S1c). Therefore, S. rimosus was not the dominant microorganism, yet it gained the advantage over A. terreus. In contrast, the method of delayed introduction of S. rimosus to the coculture supported A. terreus morphological development and its domination, due to the total destruction of S. rimosus pellets (Figure S2c).

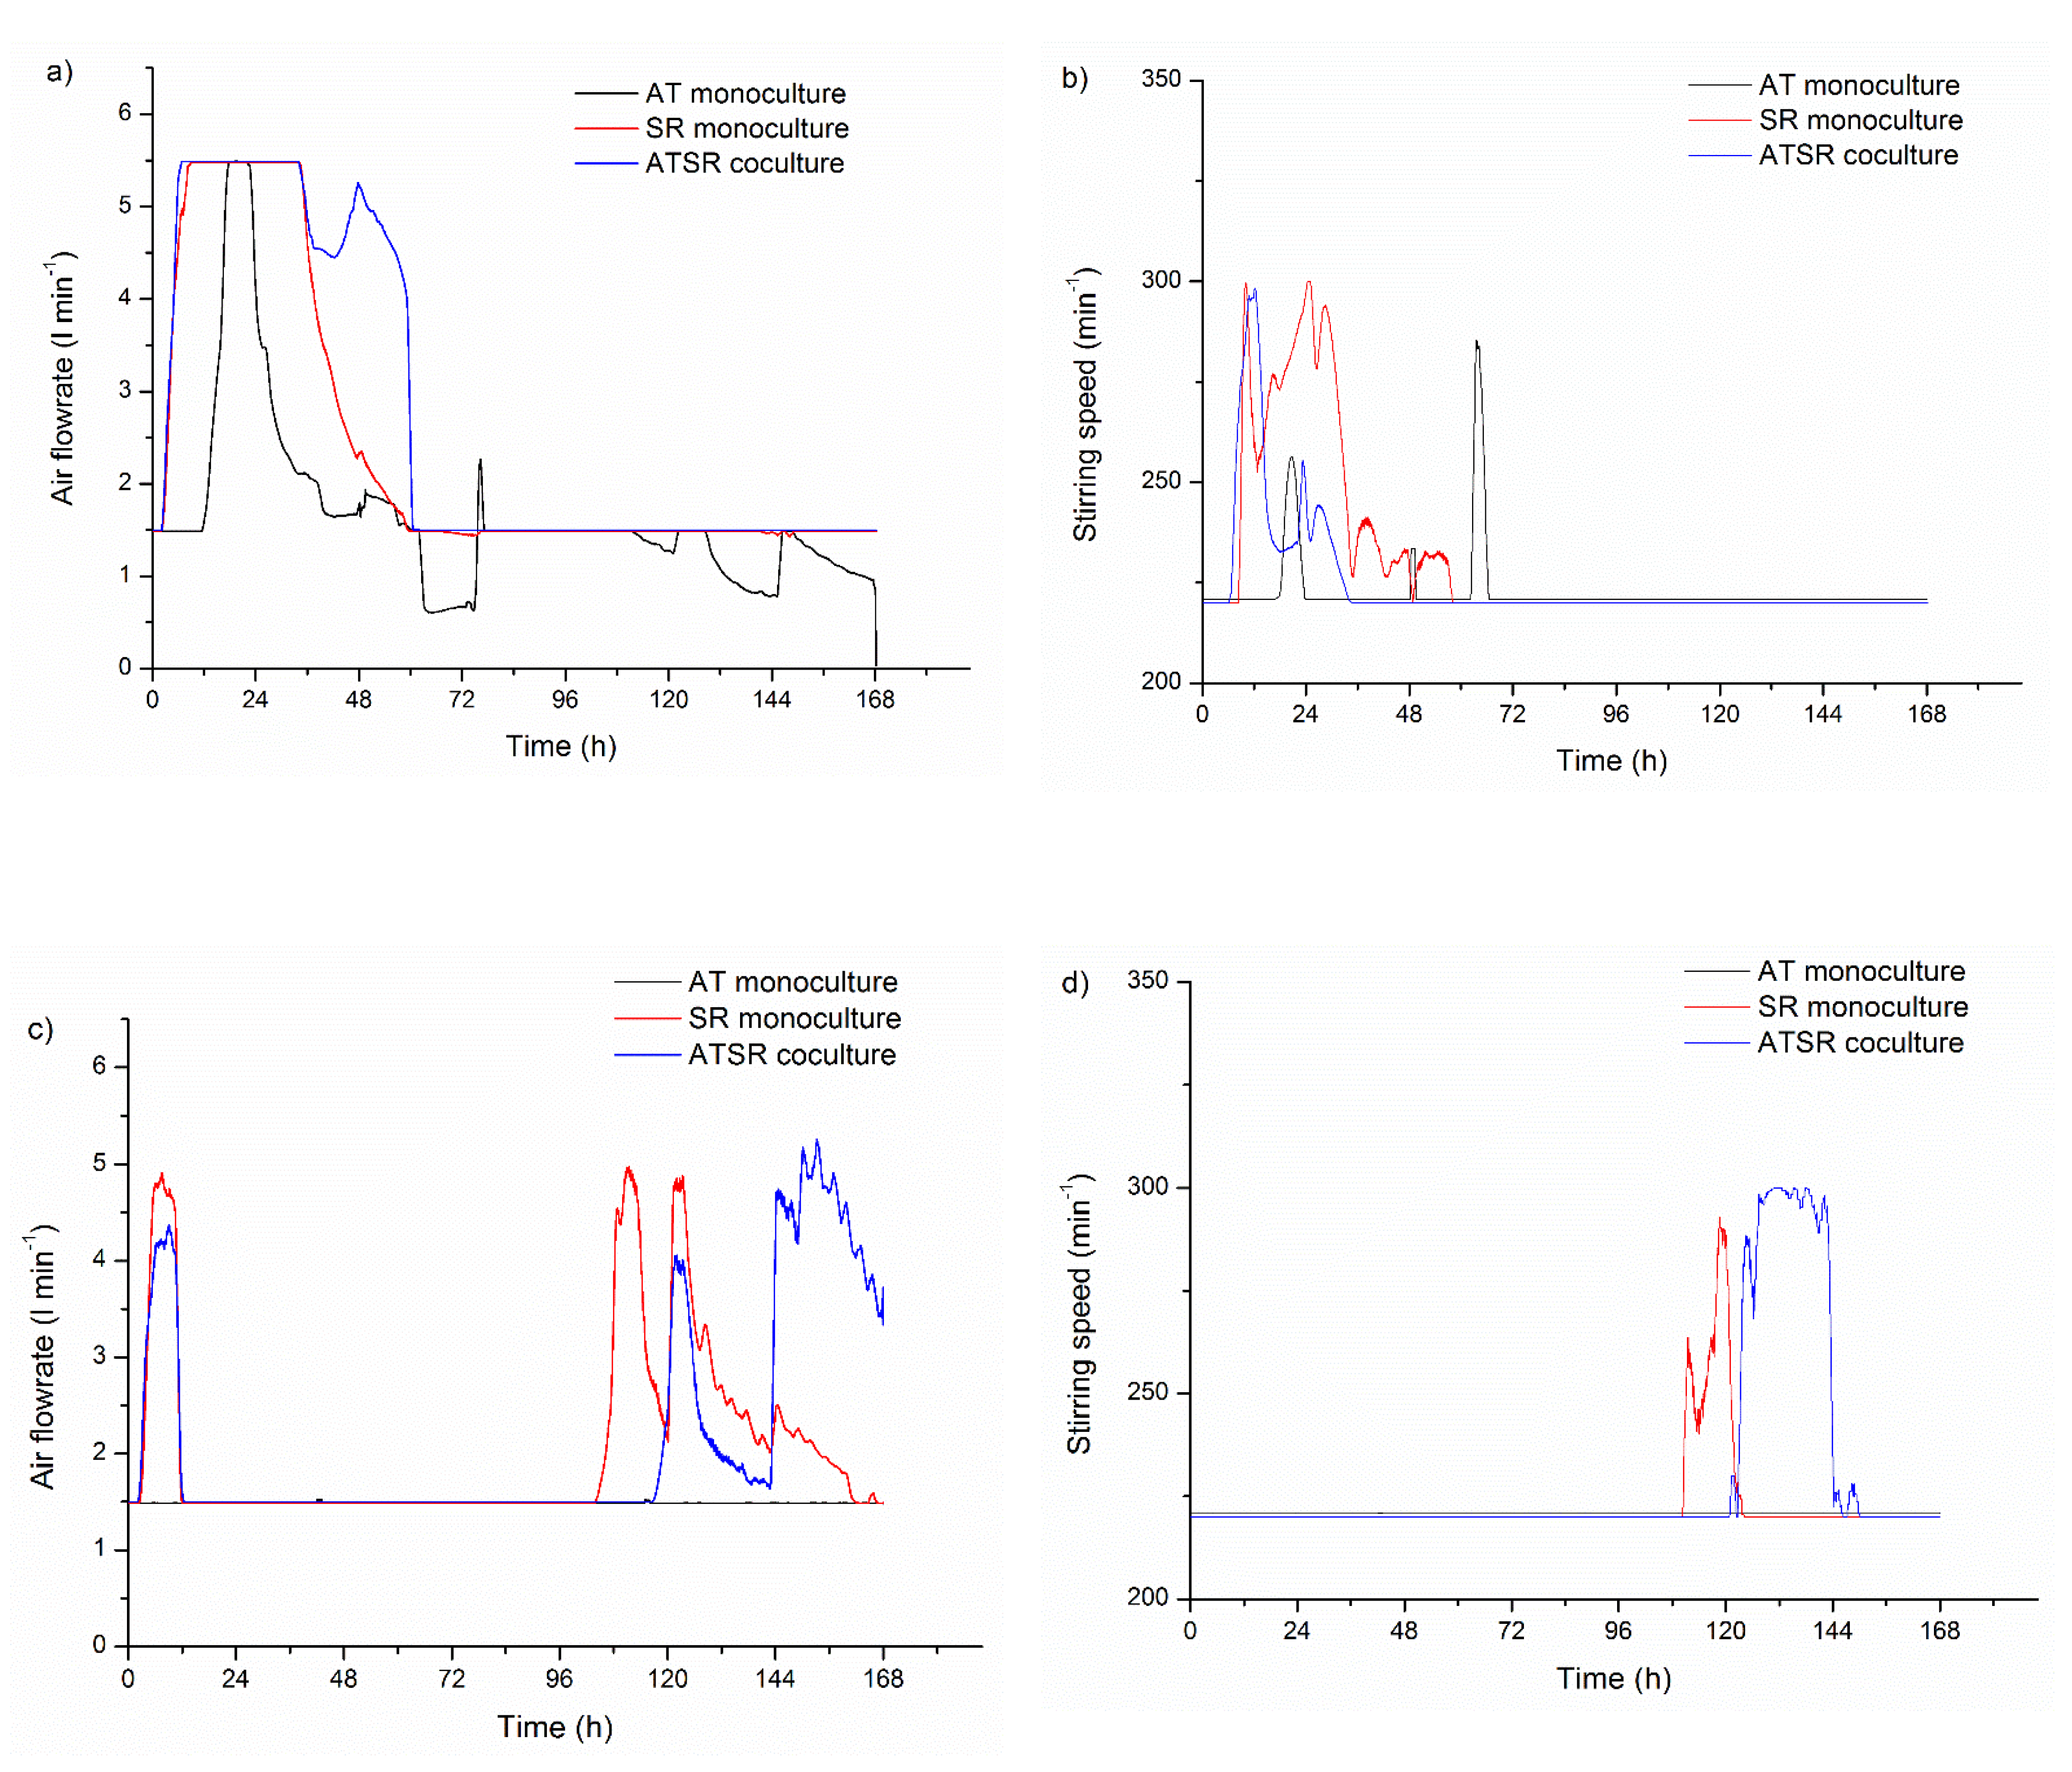
3.4. Air Flowrate and Stirring Speed Influence on Microbial Morphology in Cocultures

The application of the fully controlled bioreactors enabled measuring and tracking of the changes in air flowrate and stirring speed in each conducted experiment. Their changes were required to hold the desired level of dissolved oxygen in the cultivation broth. Both aeration and stirring were largely responsible for the mechanical forces acting on the cultivated microorganisms. This study provided interesting information regarding these issues, although it was not the main aim to investigate the effect of the mechanical forces on the development of the A. terreus and S. rimosus cocultures.
Figure 8 shows the temporal changes of air flowrate and stirring speed in ATSR2 (Figure 8a,b) and ATSR6 (Figure 8c,d). In ATSR2, the most intensive aeration and agitation occurred in the first period of the experiment. The maximum air flowrate 5.5 lair min−1 was achieved almost immediately after the inoculation of S. rimosus monoculture and coculture (Figure 8a), and was required to hold the desired level of dissolved oxygen at 20%. It also reflected the relatively fast growth of S. rimosus due to glucose consumption (Boruta et al., 2021). The decrease in the air flowrate began after 36 h of these cultivations. In ATSR2 A. terreus monoculture, the maximum air flowrate was observed in the shorter period, between 17 and 22 h of the process. Stirring speed (Figure 8b) increased to its maximum value of 300 min−1 within 10 h of S. rimosus monoculture and 11 h of coculture. In the ATSR2 A. terreus monoculture, the first significant increase in stirring speed appeared in 20 h (255 min−1) and its maximum value equal to 284 min−1 was obtained in 63 h. After 77 h of ATSR2, both air flowrate and stirring speed remained at the lowest permissible levels in A. terreus monoculture. Regarding the experiment ATSR6, the changes of air flowrate and stirring speed were different in comparison to ATSR2. Apart from the temporary air flowrate increase in the first day of ATSR6 coculture and S. rimosus monoculture, the most intensive aeration (Figure 8c) and agitation (Figure 8d) occurred after 96 h of ATSR6. This was connected with the delayed consumption of lactose, being the sole carbon source in this experiment, by S. rimosus (Boruta et al., 2021). In this experiment, the maximum air flowrate was observed at 111 h of S. rimosus monoculture (5.0 lair min−1) and at 153 h of the coculture (5.0 lair min−1). In A. terreus monoculture, air flowrate remained at 1.5 lair min−1 without any changes. Stirring-speed temporal changes in ATSR6 showed a similar course (Figure 8d). In A. terreus monoculture, its value was at the lowest set level equal to 220 min−1 throughout the experiment. The highest stirring speed appeared in 118 h of S. rimosus monoculture (292 min−1) and between 130 and 138 h of the coculture (300 min−1). Connecting the aforementioned aeration and agitation data (Figure 8) with the size of mycelial objects defined by the projected area (Figure 2a,e), it can be found that the increase in air flowrate and stirring speed in the conducted experiments led to the formation of the dispersed hyphae and clump forms. In ATSR2 S. rimosus monoculture and in the coculture, in which aeration (Figure 8a) and agitation (Figure 8b) were the most intensive at the beginning of the experiment, the hyphae and clumps’ fraction appeared relatively quickly, within 24 h of the experiment. On the other hand, in ATSR6 S. rimosus monoculture and the coculture, in which the initial increase in the air flowrate (Figure 8c) and stirring speed (Figure 8d) were not as intensive as in ATSR2, the hyphae and clumps’ fraction was noticed only in 96 h. In ATSR2 (Figure 2a) and ATSR6 (Figure 2e) runs of A. terreus monocultures, dispersed morphological objects appeared in 48 h. The same time point of the hyphae and clumps’ fraction appearance indicated that the mechanical forces caused by applied air flowrate and stirring speed (Figure 8) were too weak to introduce any drastic changes in A. terreus morphology. Moreover, the courses of air flowrate changes in S. rimosus monoculture and coculture were analogous in both ATSR2 and ATSR6. These similarities between the S. rimosus monoculture and the coculture confirmed the advantage of S. rimosus over A. terreus, which was proven previously within our quantitative morphological analysis.

4. Discussion

The experiments presented in this paper were described in terms of microbial morphology. Furthermore, the production of secondary metabolites and bioprocess kinetics was also tested in detail by Boruta et al. [30], which allows for a wider discussion of the relationship between morphology and metabolism of the cocultivated filamentous microorganisms. In the experiments from ATSR2 to ATSR6, where the cocultures were initiated by the parallel introduction of precultures to the bioreactors (preculture versus preculture, Figure 1, Figure 2, Figure 3 and Figure 4), S. rimosus gained the morphological advantage over A. terreus, however its domination was not as strong as in the ATSR9 experiment. This was demonstrated by a significant decrease in the A. terreus pellets’ projected area in cocultures (e.g., 24 h of ATSR2 A. terreus pellets’ projected area: coculture A = 1.3 × 106 µm2, monoculture A = 1.3 × 107 µm2, p < 0.001) while the sizes of the S. rimosus pellets remained the same in the mono- and co-cultures (e. g. 168 h of ATSR2 S. rimosus pellets’ projected area: coculture 1.5 × 105 µm2, monoculture A = 1.7 × 10⁵, p > 0.05). The total ion chromatograms presented by Boruta et al. [30] showed that metabolic profiles of the broth composition of the cocultures and corresponding S. rimosus monocultures in ATSR2-ATSR6 were very similar. Particular attention should be paid to two S. rimosus metabolites, oxytetracycline and rimocidin, which show antibacterial and antifungal activity, respectively. Their levels in mono- and co-cultures were comparable. Therefore, the actinomycete was the metabolically dominant microorganism, and despite the differences in the monoculture and coculture metabolic profiles, S. rimosus metabolism was not repressed by A. terreus presence in the bioreactor. Furthermore, several new chemical compounds, not detected in the corresponding monocultures, were identified (e.g., the modified forms of rimocidin, milbemycin A3 derivative with two additional oxygen atoms).
In the ATSR9 experiment, in which the coculture was initiated by the parallel introduction of A. terreus ans S. rimosus spores, the actinomycete was the dominant microorganism both morphologically (Figure 6) and metabolically [30]. In this experiment, S. rimosus morphological domination was complete since it caused vanishing of the A. terreus pellets. Moreover, S. rimosus metabolism was not repressed by A. terreus at all. As with the previously described experiments from ATSR2 to ATSR6, oxytetracycline and rimocidin levels in the mono- and co-cultures were similar [30].
Only the delay in S. rimosus introduction to ATSR7 and ATSR8 cocultures caused the change of the prevailing microorganism from the actinomycete to the fungus, which dominated morphologically and metabolically. A. terreus morphological domination was total due to the absence of S. rimosus pellets in the coculture. According to Boruta et al. [30] A. terreus develops more slowly and is “less aggressive” than S. rimosus. Therefore, the time provided for A. terreus by delayed S. rimosus introduction in the coculture allowed for the development of fungal biomass and strengthening of A. terreus defense against the rival actinomycete. As a result, in ATSR7 and ATSR8 cocultures, S. rimosus pellets introduced to the bioreactor were destroyed during the first day of the experiment (Figure 5). Even though A. terreus pellets in the cocultures were smaller than pellets observed in corresponding monocultures (e.g., ATSR8 24 h A. terreus pellets projected area: coculture A = 7.6 × 106 µm2, monoculture A = 9.4 × 106 µm2, p > 0.05) the fungus was the dominant microorganism in ATSR7 and ATSR8, which was also confirmed by the total ion chromatograms presented in the work of Boruta et al. [30]. Oxytetracycline, S. rimosus metabolite, was not detected in ATSR7 and ATSR8 cocultures, while it was present in corresponding S. rimosus monocultures. Therefore, in ATSR7 and ATSR8 cocultures, A. terreus was stimulated to produce new compounds, e.g., 1-(2’,6’-dimethylphenyl)-2-n-propyl-1,2-dihydropyridazine-3,6-dione; aspereusin D; 7-deoxy-7,14-didehydro-12-acetoxy-sydonic acid or nigerapyrone [30].
Other methods of selecting the “winner” microorganism were also developed. They are based on the comparing analysis of the process parameters connected with microorganisms’ oxygen consumption. In the present paper, air flowrate and stirring speed profiles were compared (Figure 8). The similarity of these data obtained from A. terreus and S. rimosus coculture with one of the two corresponding monocultures indicated on the dominant microorganism. Dissolved oxygen profiles were used in the same way by Boruta et al. [30].
Returning to other studies on microbial morphology in the cocultures, the literature review conducted in the Introduction section revealed a complete lack of research on this issue. Despite the usefulness of quantitative morphological analysis in experiments on filamentous microorganisms [39,40,41], there are no articles that implemented the calculation of morphological parameters for cocultures of filamentous microorganisms run in stirred tank bioreactors.
This research revealed that the development of cocultures can be, with certain approximation, considered as a new morphological engineering technique, separate to the ones (such as microparticle-enhanced cultivation or salt-enhanced cultivation) described previously in the literature [42]. This method satisfied the definition of morphological engineering techniques, as the cocultivated microorganism was the factor changing the morphology. Here, the only difference was that this change of morphology was not directed to maximize the formation of selected metabolite, unlike the aforementioned previously described techniques, but influenced the whole metabolic repertoire of one of the cocultured microorganims.
Summing up, the coculturing of the filamentous microorganisms altered the biosynthetic capabilities not only by means of chemical interactions but also through morphological changes.

5. Conclusions

Upon the results of this study, the following conclusions can be drawn. In the A. terreus and S. rimosus cocultures, the microbial morphology depends to the highest extent on the applied coculture initiation strategy. In contrast, the modifications of cultivation medium composition (with regard to carbon and nitrogen source) do not contribute to the significant morphological changes of the studied filamentous microorganisms.
Parallel initiation strategy of the coculture leads to the dominance of S. rimosus over A. terreus. A. terreus gains the morphological domination only when S. rimosus is introduced with delay to the developed culture of A. terreus. This dependence is due to the slower morphological development and “less aggressive” metabolism of A. terreus.
Morphology and secondary metabolism of cocultured A. terreus and S. rimosus are strictly related. The microorganism which gains the morphological advantage or domination in coculture also becomes metabolically dominant.

Supplementary Materials

The following are available online at https://www.mdpi.com/article/10.3390/biom11111740/s1, Figure S1: Microscopic image of the morphological objects snapped in 24 h of ATSR2. Figure S2: Microscopic image of the morphological objects snapped in 24 h of ATSR8. Figure S3: Microscopic image of the morphological objects snapped in 24 h of ATSR9.

Author Contributions

M.B., T.B. and A.Ś. conceptualized and designed the study; M.B., T.B. and A.Ś. performed the cultivation experiments; T.B. performed the quantitative analysis of secondary metabolites; A.Ś. performed the morphological analysis; A.Ś. prepared the manuscript. All authors have read and agreed to the published version of the manuscript.

Funding

This work was financially supported by the National Science Centre (Republic of Poland) within the project 2017/27/B/NZ9/00534.

Institutional Review Board Statement

Not applicable.

Informed Consent Statement

Not applicable.

Data Availability Statement

The data used to support the findings of this study are available from the corresponding author upon request.

Conflicts of Interest

The authors declare no conflict of interest.

References

  1. Arora, D.; Gupta, P.; Jaglan, S.; Roullier, C.; Grovel, O.; Bertrand, S. Expanding the chemical diversity through microorganisms co-culture: Current status and outlook. Biotechnol. Adv. 2020, 40, 107521. [Google Scholar] [CrossRef] [PubMed]
  2. Wurster, S.; Sass, G.; Albert, N.D.; Nazik, H.; Déziel, E.; Stevens, D.A.; Kontoyiannis, D.P. Live imaging and quantitative analysis of Aspergillus fumigatus growth and morphology during inter-microbial interaction with Pseudomonas aeruginosa. Virulence 2020, 11, 1329–1336. [Google Scholar] [CrossRef] [PubMed]
  3. Schroeckh, V.; Scherlach, K.; Nützmann, H.-W.; Shelest, E.; Schmidt-Heck, W.; Schuemann, J.; Martin, K.; Hertweck, C.; Brakhage, A.A. Intimate bacterial-fungal interaction triggers biosynthesis of archetypal polyketides in Aspergillus nidulans. Proc. Natl. Acad. Sci. USA 2009, 106, 14558–14563. [Google Scholar] [CrossRef] [PubMed] [Green Version]
  4. Shang, Z.; Salim, A.; Capon, R.J. Chaunopyran A: Co-Cultivation of Marine Mollusk-Derived Fungi Activates a Rare Class of 2-Alkenyl-Tetrahydropyran. J. Nat. Prod. 2017, 80, 1167–1172. [Google Scholar] [CrossRef] [PubMed]
  5. Harwani, D.; Begani, J.; Lakhani, J. Co-Cultivation Strategies to Induce De Novo Synthesis of Novel Chemical Scaffolds from Cryptic Secondary Metabolite Gene Clusters. In Fungi and Their Role in Sustainable Development: Current Perspectives; Gehlot, P., Singh, J., Eds.; Springer: Singapore, 2017; pp. 617–631. [Google Scholar] [CrossRef]
  6. Nai, C.; Meyer, V. From Axenic to Mixed Cultures: Technological Advances Accelerating a Paradigm Shift in Microbiology. Trends Microbiol. 2018, 26, 538–554. [Google Scholar] [CrossRef] [Green Version]
  7. Tshikantwa, T.S.; Ullah, M.W.; He, F.; Yang, G. Current Trends and Potential Applications of Microbial Interactions for Human Welfare. Front. Microbiol. 2018, 9, 1156. [Google Scholar] [CrossRef] [Green Version]
  8. Qian, X.; Chen, L.; Sui, Y.; Chen, C.; Zhang, W.; Zhou, J.; Dong, W.; Jiang, M.; Xin, F.; Ochsenreither, K. Biotechnological potential and applications of microbial consortia. Biotechnol. Adv. 2020, 40, 107500. [Google Scholar] [CrossRef]
  9. Tan, Z.Q.; Leow, H.Y.; Lee, D.C.W.; Karisnan, K.; Song, A.A.L.; Mai, C.W.; Yap, W.S.; Lim, E.; Lai, K.S. Co-Culture Systems for the Production of Secondary Metabolites: Current and Future Prospects. Open Biotechnol. J. 2019, 13, 18–26. [Google Scholar] [CrossRef]
  10. Zhu, F.; Chen, G.; Chen, X.; Huang, M.; Wan, X. Aspergicin, a new antibacterial alkaloid produced by mixed fermentation of two marine-derived mangrove epiphytic fungi. Chem. Nat. Compd. 2011, 47, 767–769. [Google Scholar] [CrossRef]
  11. Nicault, M.; Zaiter, A.; Dumarcay, S.; Chaimbault, P.; Gelhaye, E.; Leblond, P.; Bontemps, C. Elicitation of Antimicrobial Active Compounds by Streptomyces-Fungus Co-Cultures. Microorganisms 2021, 9, 178. [Google Scholar] [CrossRef] [PubMed]
  12. Zhuang, L.; Zhang, H. Utilizing cross-species co-cultures for discovery of novel natural products. Curr. Opin. Biotechnol. 2021, 69, 252–262. [Google Scholar] [CrossRef] [PubMed]
  13. Siemieniewicz, K.W.; Schrempf, H. Concerted responses between the chitin-binding protein secreting Streptomyces olivaceoviridis and Aspergillus proliferans. Microbiology 2007, 153, 593–600. [Google Scholar] [CrossRef] [PubMed] [Green Version]
  14. Caceres, I.; Snini, S.P.; Puel, O.; Mathieu, F. Streptomyces roseolus, A Promising Biocontrol Agent Against Aspergillus flavus, the Main Aflatoxin B1 Producer. Toxins 2018, 10, 442. [Google Scholar] [CrossRef] [PubMed] [Green Version]
  15. Yu, L.; Ding, W.; Ma, Z. Induced production of cytochalasans in co-culture of marine fungus Aspergillus flavipes and actinomycete Streptomyces sp. Nat. Prod. Res. 2016, 30, 1718–1723. [Google Scholar] [CrossRef] [PubMed]
  16. König, C.C.; Scherlach, K.; Schroeckh, V.; Horn, F.; Nietzsche, S.; Brakhage, A.A.; Hertweck, C. Bacterium Induces Cryptic Meroterpenoid Pathway in the Pathogenic Fungus Aspergillus Fumigatus. ChemBioChem 2013, 14, 938–942. [Google Scholar] [CrossRef]
  17. Wu, C.; Zacchetti, B.; Ram, A.F.; Van Wezel, G.P.; Claessen, D.; Choi, Y.H. Expanding the chemical space for natural products by Aspergillus-Streptomyces co-cultivation and biotransformation. Sci. Rep. 2015, 5, 10868. [Google Scholar] [CrossRef] [PubMed] [Green Version]
  18. Stroe, M.C.; Netzker, T.; Scherlach, K.; Krüger, T.; Hertweck, C.; Valiante, V.; A Brakhage, A. Targeted induction of a silent fungal gene cluster encoding the bacteria-specific germination inhibitor fumigermin. eLife 2020, 9, 52541. [Google Scholar] [CrossRef] [PubMed]
  19. Gonciarz, J.; Kowalska, A.; Bizukojc, M. Application of microparticle-enhanced cultivation to increase the access of oxygen to Aspergillus terreus ATCC 20542 mycelium and intensify lovastatin biosynthesis in batch and continuous fed-batch stirred tank bioreactors. Biochem. Eng. J. 2016, 109, 178–188. [Google Scholar] [CrossRef]
  20. Baptista, P.; de Pinho, P.G.; Moreira, N.; Malheiro, R.; Reis, F.; Padrão, J.; Tavares, R.; Lino-Neto, T. In vitro interactions between the ectomycorrhizal Pisolithus tinctorius and the saprotroph Hypholoma fasciculare fungi: Morphological aspects and volatile production. Mycology 2021, 1–14. [Google Scholar] [CrossRef] [PubMed]
  21. Wurster, S.; Kumaresan, P.R.; Albert, N.D.; Hauser, P.J.; Lewis, R.E.; Kontoyiannis, D.P. Live Monitoring and Analysis of Fungal Growth, Viability, and Mycelial Morphology Using the IncuCyte NeuroTrack Processing Module. mBio 2019, 10, e00673-19. [Google Scholar] [CrossRef] [PubMed] [Green Version]
  22. Boruta, T.; Milczarek, I.; Bizukojc, M. Evaluating the outcomes of submerged co-cultivation: Production of lovastatin and other secondary metabolites by Aspergillus terreus in fungal co-cultures. Appl. Microbiol. Biotechnol. 2019, 103, 5593–5605. [Google Scholar] [CrossRef] [Green Version]
  23. Lee, K.-H.; Park, S.J.; Ho, L.K.; Park, J.Y. Proteus vulgaris and Proteus mirabilis Decrease Candida albicans Biofilm Formation by Suppressing Morphological Transition to Its Hyphal Form. Yonsei Med. J. 2017, 58, 1135–1143. [Google Scholar] [CrossRef] [PubMed]
  24. Bor, B.; Cen, L.; Agnello, M.; Shi, W.; He, X. Morphological and physiological changes induced by contact-dependent interaction between Candida albicans and Fusobacterium nucleatum. Sci. Rep. 2016, 6, 27956. [Google Scholar] [CrossRef] [PubMed]
  25. TAspray, T.J.; Jones, E.E.; Davies, M.W.; Shipman, M.; Bending, G.D. Increased hyphal branching and growth of ectomycorrhizal fungus Lactarius rufus by the helper bacterium Paenibacillus sp. Mycorrhiza 2013, 23, 403–410. [Google Scholar] [CrossRef]
  26. Lőrincz, Z.; Preininger, É.; Kósa, A.; Pónyi, T.; Nyitrai, P.; Sarkadi, L.; Kovács, G.M.; Böddi, B.; Gyurján, I. Artificial tripartite symbiosis involving a green alga (Chlamydomonas), a bacterium (Azotobacter) and a fungus (Alternaria): Morphological and physiological characterization. Folia Microbiol. 2010, 55, 393–400. [Google Scholar] [CrossRef] [PubMed]
  27. Machado, A.; Anzai, M.; Fischman, O. Bacillus subtilis induces morphological changes in Fonsecaea pedrosoi in vitro resulting in more resistant fungal forms in vivo. J. Venom. Anim. Toxins Incl. Trop. Dis. 2010, 16, 592–598. [Google Scholar] [CrossRef] [Green Version]
  28. Hogan, D.A.; Åshild, V.; Kolter, R. A Pseudomonas aeruginosa quorum-sensing molecule influences Candida albicans morphology. Mol. Microbiol. 2004, 54, 1212–1223. [Google Scholar] [CrossRef]
  29. Treloar, N.J.; Fedorec, A.J.H.; Ingalls, B.; Barnes, C.P. Deep reinforcement learning for the control of microbial co-cultures in bioreactors. PLoS Comput. Biol. 2020, 16, e1007783. [Google Scholar] [CrossRef] [PubMed] [Green Version]
  30. Boruta, T.; Ścigaczewska, A.; Bizukojć, M. “Microbial Wars” in a Stirred Tank Bioreactor: Investigating the Co-Cultures of Streptomyces rimosus and Aspergillus terreus, Filamentous Microorganisms Equipped with a Rich Arsenal of Secondary Metabolites. Front. Bioeng. Biotechnol. 2021, 9, 713639. [Google Scholar] [CrossRef] [PubMed]
  31. Zuck, K.M.; Shipley, S.; Newman, D.J. Induced Production of N-Formyl Alkaloids from Aspergillus fumigatus by Co-culture with Streptomyces peucetius. J. Nat. Prod. 2011, 74, 1653–1657. [Google Scholar] [CrossRef]
  32. Rateb, M.E.; Hallyburton, I.; Houssen, W.E.; Bull, A.T.; Goodfellow, M.; Santhanam, R.; Jaspars, M.; Ebel, R. Induction of diverse secondary metabolites in Aspergillus fumigatus by microbial co-culture. RSC Adv. 2013, 3, 14444–14450. [Google Scholar] [CrossRef] [Green Version]
  33. Wu, C.; Ichinose, K.; Choi, Y.H.; Van Wezel, G.P. Aromatic Polyketide GTRI-02 is a Previously Unidentified Product of theactGene Cluster inStreptomyces coelicolor A3(2). ChemBioChem 2017, 18, 1428–1434. [Google Scholar] [CrossRef]
  34. Wakefield, J.; Hassan, H.M.; Jaspars, M.; Ebel, R.; Rateb, M.E. Dual Induction of New Microbial Secondary Metabolites by Fungal Bacterial Co-cultivation. Front. Microbiol. 2017, 8, 1284. [Google Scholar] [CrossRef] [Green Version]
  35. Abdel-Razek, A.S.; Hamed, A.; Frese, M.; Sewald, N.; Shaaban, M. Penicisteroid C: New polyoxygenated steroid produced by co-culturing of Streptomyces piomogenus with Aspergillus niger. Steroids 2018, 138, 21–25. [Google Scholar] [CrossRef] [PubMed]
  36. Khalil, Z.G.; Cruz-Morales, P.; Licona-Cassani, C.; Marcellin, E.; Capon, R.J. Inter-Kingdom beach warfare: Microbial chemical communication activates natural chemical defences. ISME J. 2018, 13, 147–158. [Google Scholar] [CrossRef] [PubMed]
  37. Wucherpfennig, T.; Hestler, T.; Krull, R. Morphology engineering—Osmolality and its effect on Aspergillus niger morphology and productivity. Microb. Cell Factories 2011, 10, 58. [Google Scholar] [CrossRef] [PubMed] [Green Version]
  38. Kowalska, A.; Boruta, T.; Bizukojc, M. Morphological evolution of various fungal species in the presence and absence of aluminum oxide microparticles: Comparative and quantitative insights into microparticle-enhanced cultivation (MPEC). Microbiol. 2018, 7, e00603. [Google Scholar] [CrossRef]
  39. Kowalska, A.; Boruta, T.; Bizukojć, M. Performance of fungal microparticle-enhanced cultivations in stirred tank bioreactors depends on species and number of process stages. Biochem. Eng. J. 2020, 161, 107696. [Google Scholar] [CrossRef]
  40. Cairns, T.C.; Feurstein, C.; Zheng, X.; Zheng, P.; Sun, J.; Meyer, V. A quantitative image analysis pipeline for the characterization of filamentous fungal morphologies as a tool to uncover targets for morphology engineering: A case study using aplD in Aspergillus niger. Biotechnol. Biofuels 2019, 12, 1–17. [Google Scholar] [CrossRef] [PubMed] [Green Version]
  41. Gao, D.; Zeng, J.; Yu, X.; Dong, T.; Chen, S. Improved lipid accumulation by morphology engineering of oleaginous fungus Mortierella isabellina. Biotechnol. Bioeng. 2014, 111, 1758–1766. [Google Scholar] [CrossRef]
  42. Krull, R.; Wucherpfennig, T.; Esfandabadi, M.E.; Walisko, R.; Melzer, G.; Hempel, D.C.; Kampen, I.; Kwade, A.; Wittmann, C. Characterization and control of fungal morphology for improved production performance in biotechnology. J. Biotechnol. 2013, 163, 112–123. [Google Scholar] [CrossRef] [PubMed]
Figure 1. Exemplary microscopic image of the morphological objects snapped in 24 h of ATSR2 coculture: A. terreus fully evolved pellets (yellow arrow), S. rimosus fully evolved pellets (green arrows), and hyphae or clumps (blue arrows).
Biomolecules 11 01740 g001
Figure 2. Temporal Changes of Projected Area (A) in: (a) ATSR2, (b) ATSR3, (c) ATSR4, (d) ATSR5, (e) ATSR6 Runs.
Biomolecules 11 01740 g002
Figure 3. Temporal Changes of Morphology Number (Mo) in: (a) ATSR2, (b) ATSR3, (c) ATSR4, (d) ATSR5, (e) ATSR6 runs.
Biomolecules 11 01740 g003
Figure 4. Temporal Changes of Elongation (E) in: (a) ATSR2, (b) ATSR3, (c) ATSR4, (d) ATSR5, (e) ATSR6 Runs.
Biomolecules 11 01740 g004
Figure 5. Morphological Parameters Temporal Changes in the Experiments ATSR7 and ATSR8: Projected area (A) (a) ATSR7 and (b) ATSR8, Morphology Number (Mo) (c) ATSR7 and (d) ATSR8, Elongation (E) (e) ATSR7 and (f) ATSR8.
Biomolecules 11 01740 g005
Figure 6. Morphological Parameters Temporal Changes in the Experiment ATSR9: (a) Projected Area (A), (b) Morphology Number (Mo), (c) Elongation (E).
Biomolecules 11 01740 g006
Figure 7. ATSR9 Coculture Mycelial Objects Snapped in 24 h of the Experiment. Red Arrows Indicate Probable A. terreus Hyphae Elements Integrated with S. rimosus Pellets.
Biomolecules 11 01740 g007
Figure 8. Temporal Changes of Air Flowrate (a) and Stirring Speed (b) in the Experiment ATSR2 and Temporal Changes of Air Flowrate (c) and Stirring Speed (d) in the Experiment ATSR6.
Biomolecules 11 01740 g008
Table 1. Reported Results of Aspergillus and Streptomyces Cocultures.
Reported Results of the CoculturesCocultured StrainsCultivation MethodReferences
1Mixture of A. proliferans and S. olivaceoviridis spores in the coculture provoked germination and growth of the cultivated microorganisms in medium without carbon sourceAspergillus proliferans
Streptomyces olivaceoviridis
Flasks without shakingSiemieniewicz and Schrempf [13]
2Lecanoric acid, F-9775A, F-9775BAspergillus nidulans
Streptomyces hygroscopicus
Shaking flasksSchroeckh et al. [3]
3Fumiformamide, N,N′-((1Z,3Z)-1,4-bis(4-methoxyphenyl)buta-1,3-diene-2,3-diyl)diformamideAspergillus fumigatus
Streptomyces peucetius
Shaking flasksZuck et al. [31]
4Fumicycline A (activation of a silent polyketide synthase gene cluster)Aspergillus fumigatus
Streptomyces rapamycinicus
Petri dishesKönig et al. [16]
5Ergosterol, brevianamide F, spirotryprostatin A, 6-methoxy spirotryprostatin B, fumitremorgin C and its 12,13-dihydroxy derivative, fumitremorgin B, verruculogen, 11-O-methylpseurotin A and its new isomer 11-O-methylpseurotin A2Aspergillus fumigatus MBC-F1-10 Streptomyces bulliiShaking flasksRateb et al. [32]
6Cyclic dipeptide cyclo(Phe-Phe), 2-hydroxyphenylacetic acid, (E)-2-(3-hydroxyprop-1-en-1-yl)-phenol, (2E,4E)-3-(2-carboxy-1-hydroxyethyl)-2,4-hexadienedioxic acidAspergillus niger
Streptomyces coelicolor
Shaking flasksWu et al. [17]
7Rosellichalasin, aspochalasin E, aspochalasin P, aspochalasin H, aspochalasin M, 19,20-dihydro-aspochalasin DAspergillus flavipes
Streptomyces sp.
Shaking flasksYu et al. [15]
8Poliketide GTRI-02Aspergillus niger N402
Streptomyces coelicolor A3(2)
Shaking flasksWu et al. [33]
9Luteoride D, luteoride derivative, pseurotin G, pseurotin derivative, terezine D, 11-O-methylpseurotin A, lasso peptide chaxapeptin, the titre of chaxapeptin was doubled, pentalenic acid, brevianamide X. Aspergillus fumigatus MR2012 Streptomyces leeuwenhoekii strain C34 and strain C58Shaking flasksWakefield et al. [34]
10Penicisteroid CAspergillus niger
Streptomyces piomogenus
Shaking flasksAbdel-Razek et al. [35]
11The aflatoxin B1 concentration reduction by S. roseolus, A. flavius morphological changes Aspergillus flavus
Streptomyces roseolus
Petri dishesCaceres et al. [14]
12Heronapyrrole BAspergillus sp. CMB-AsM0423
Streptomyces sp.CMB-M0423
Microbioreactor systemKhalil et al. [36]
13FumigerminAspergillus fumigatus: Af293, A1163, ATCC 46645, IBT 16806,ΔfgnA, tetOn-fgnA,
Aspergillus nidulas: RMS011, fgnA_ATCC, fgnA_Af293, fgnA_A1163_repaired, fgn_cluster,
Streptomyces iranensis HM35, Streptomyces lividans PM02, Streptomyces coelicolor A(3)2, Streptomyces rapamycinicus ATCC 29253
Shaking flasksStroe et al. [18]
Table 2. Cultivation Medium Compositions.
ATSR2ATSR3ATSR4ATSR5ATSR6ATSR7ATSR8ATSR9
g·L−1
lactose020202020202020
glucose2020202000200
yeast extract52444444
(NH4)2SO422000000
KH2PO41.511.511.511.511.511.511.511.51
pH7—value controlled during experiment7—value controlled during experiment7—value controlled during experimentinitial value 6.5; without pH controlinitial value 6.5; without pH controlinitial value 6.5; without pH controlinitial value 6.5; without pH controlinitial value 6.5; without pH control
Other components added to each cultureSalt components: 1.51 g·L−1 KH2PO4, 0.51 g·L−1 MgSO4·7H2O, 0.4 g·L−1 NaCl, 1 mg·L−1 ZnSO4·7 H2O, 2 mg·L−1 Fe(NO3)3·9H2O
0.04 mg·L−1 biotin
A 1 mL l−1 of the trace elements solution was added to each culture. It contained: 100 mg·L−1 H3BO3, 50 mg·L−1 MnSO4, 250 mg·L−1 CuSO4·5H2O, 50 mg·L−1 Na2MoO4·2H2O.
Table 3. Comparison of Elongation Values of A. terreus Fully Evolved Pellets in Cocultures and Monocultures.
24 hE of Fully Evolved A. terreus Pellets in CocultureE of Fully Evolved A. terreus Pellets in Monoculturep Value
ATSR21.561.08p< 0.001
ATSR31.611.19p< 0.01
ATSR41.681.16p = 0.05
ATSR51.501.14p< 0.05
ATSR61.401.16p< 0.001
Publisher’s Note: MDPI stays neutral with regard to jurisdictional claims in published maps and institutional affiliations.

