Article

Setup for the Ionic Lifetime Measurement of the 229mTh3+ Nuclear Clock Isomer

1
Faculty of Physics, Ludwig-Maximilians-Universität München, Am Coulombwall 1, 85748 Garching bei München, Germany
2
Department of Physics, Tsinghua University, Beijing 100084, China
*
Authors to whom correspondence should be addressed.
Atoms 2023, 11(7), 108; https://doi.org/10.3390/atoms11070108
Submission received: 6 June 2023 / Revised: 6 July 2023 / Accepted: 13 July 2023 / Published: 24 July 2023
(This article belongs to the Special Issue Over a Century of Nuclear Isomers: Challenges and Prospects)

Abstract

:
For the realization of an optical nuclear clock, the first isomeric excited state of thorium-229 (229mTh) is currently the only candidate due to its exceptionally low-lying excitation energy ( 8.338 ± 0.024 eV). Such a nuclear clock holds promise not only to be a very precise metrological device but also to extend the knowledge of fundamental physics studies, such as dark matter research or variations in fundamental constants. Considerable progress was achieved in recent years in characterizing 229mTh from its first direct identification in 2016 to the only recent observation of the long-sought-after radiative decay channel. So far, nuclear resonance as the crucial parameter of a nuclear frequency standard has not yet been determined with laser-spectroscopic precision. To determine another yet unknown basic property of the thorium isomer and to further specify the linewidth of its ground-state transition, a measurement of the ionic lifetime of the isomer is in preparation. Theory and experimental investigations predict the lifetime to be 103–104 s. To precisely target this property using hyperfine structure spectroscopy, an experimental setup is currently being commissioned at LMU Munich. It is based on a cryogenic Paul trap providing long-enough storage times for 229mTh ions, that will be sympathetically cooled with 88Sr+. This article presents a concept for an ionic lifetime measurement and discusses the laser-optical part of a setup specifically developed for this purpose.

1. Introduction

Beginning with its first discovery in 1921 by Otto Hahn [1], a large amount of investigations on nuclear isomerism has been carried out in the past 100 years and is still ongoing [2]. So far, according to the NUBASE2020 evaluation, there are 1938 different excited nuclear states reported with lifetimes ranging from 100 nanoseconds to years (indicated by superscript ‘m’ for ‘metastable’ behind the mass number) [3]. However, the first isomeric excited state of 229Th has a very particular role because of its exceptionally low excitation energy of 8.338 ± 0.024 eV [4,5,6,7]. Already before the direct experimental proof of existence of 229mTh in 2016 [8], it was considered to take advantage of this nuclear transition lying far below the typical few 100 keV to several MeV values of nuclear excited states: Peik and Tamm suggested to use the thorium isomer as the passive reference in a nuclear optical frequency standard promising better stability and accuracy than atomic clocks [9]. The systematic frequency uncertainty of such a nuclear clock was estimated to reach 1.5 × 10⁻¹⁹ [10,11] and would thus outperform the precision of current atomic clocks, which currently reach values entering the 10−19 range [12]. However, the motivation for the realization of a nuclear clock is not restricted to precise time keeping. The clock-driving two-level system experiences additional fundamental interactions due to its sensitivity to the strong force compared with an electronic transition in the atomic shell. A nuclear frequency standard can be used as a quantum sensor capable to push the limits of, e.g., dark matter research or the quest to study variations in fundamental constants (please see references [13,14,15,16] for further reading).
In recent years, knowledge on the thorium isomer, 229mTh, has been increasingly expanded. Apart from the excitation energy, the lifetime of the neutral isomer studied with the internal conversion (IC) decay channel [17] also the nuclear, magnetic, and electric quadrupole moments, as well as the isomer shift, for the determination of the isomeric hyperfine structure could be quantified [18]. However, the direct laser excitation of the thorium isomer is still awaited, together with the experimental determination of another important property for the creation of a nuclear frequency standard: the radiative lifetime of the charged thorium isomer. Theory estimates its range to be 103–104 s [19,20,21,22], and it is predicted to be strongly dependent on its chemical (i.e., electronic) environment [21]. Based on this theoretical model presented in [21] and experimental results from the radiative decay in a crystal environment, a recent study provides an estimate of the ionic isomeric half-life exceeding 2000 s [7].
This article follows previous descriptions of the setup currently being commissioned at LMU Munich [23] with a special focus on the technical realization of the laser-optical part of the experiment.

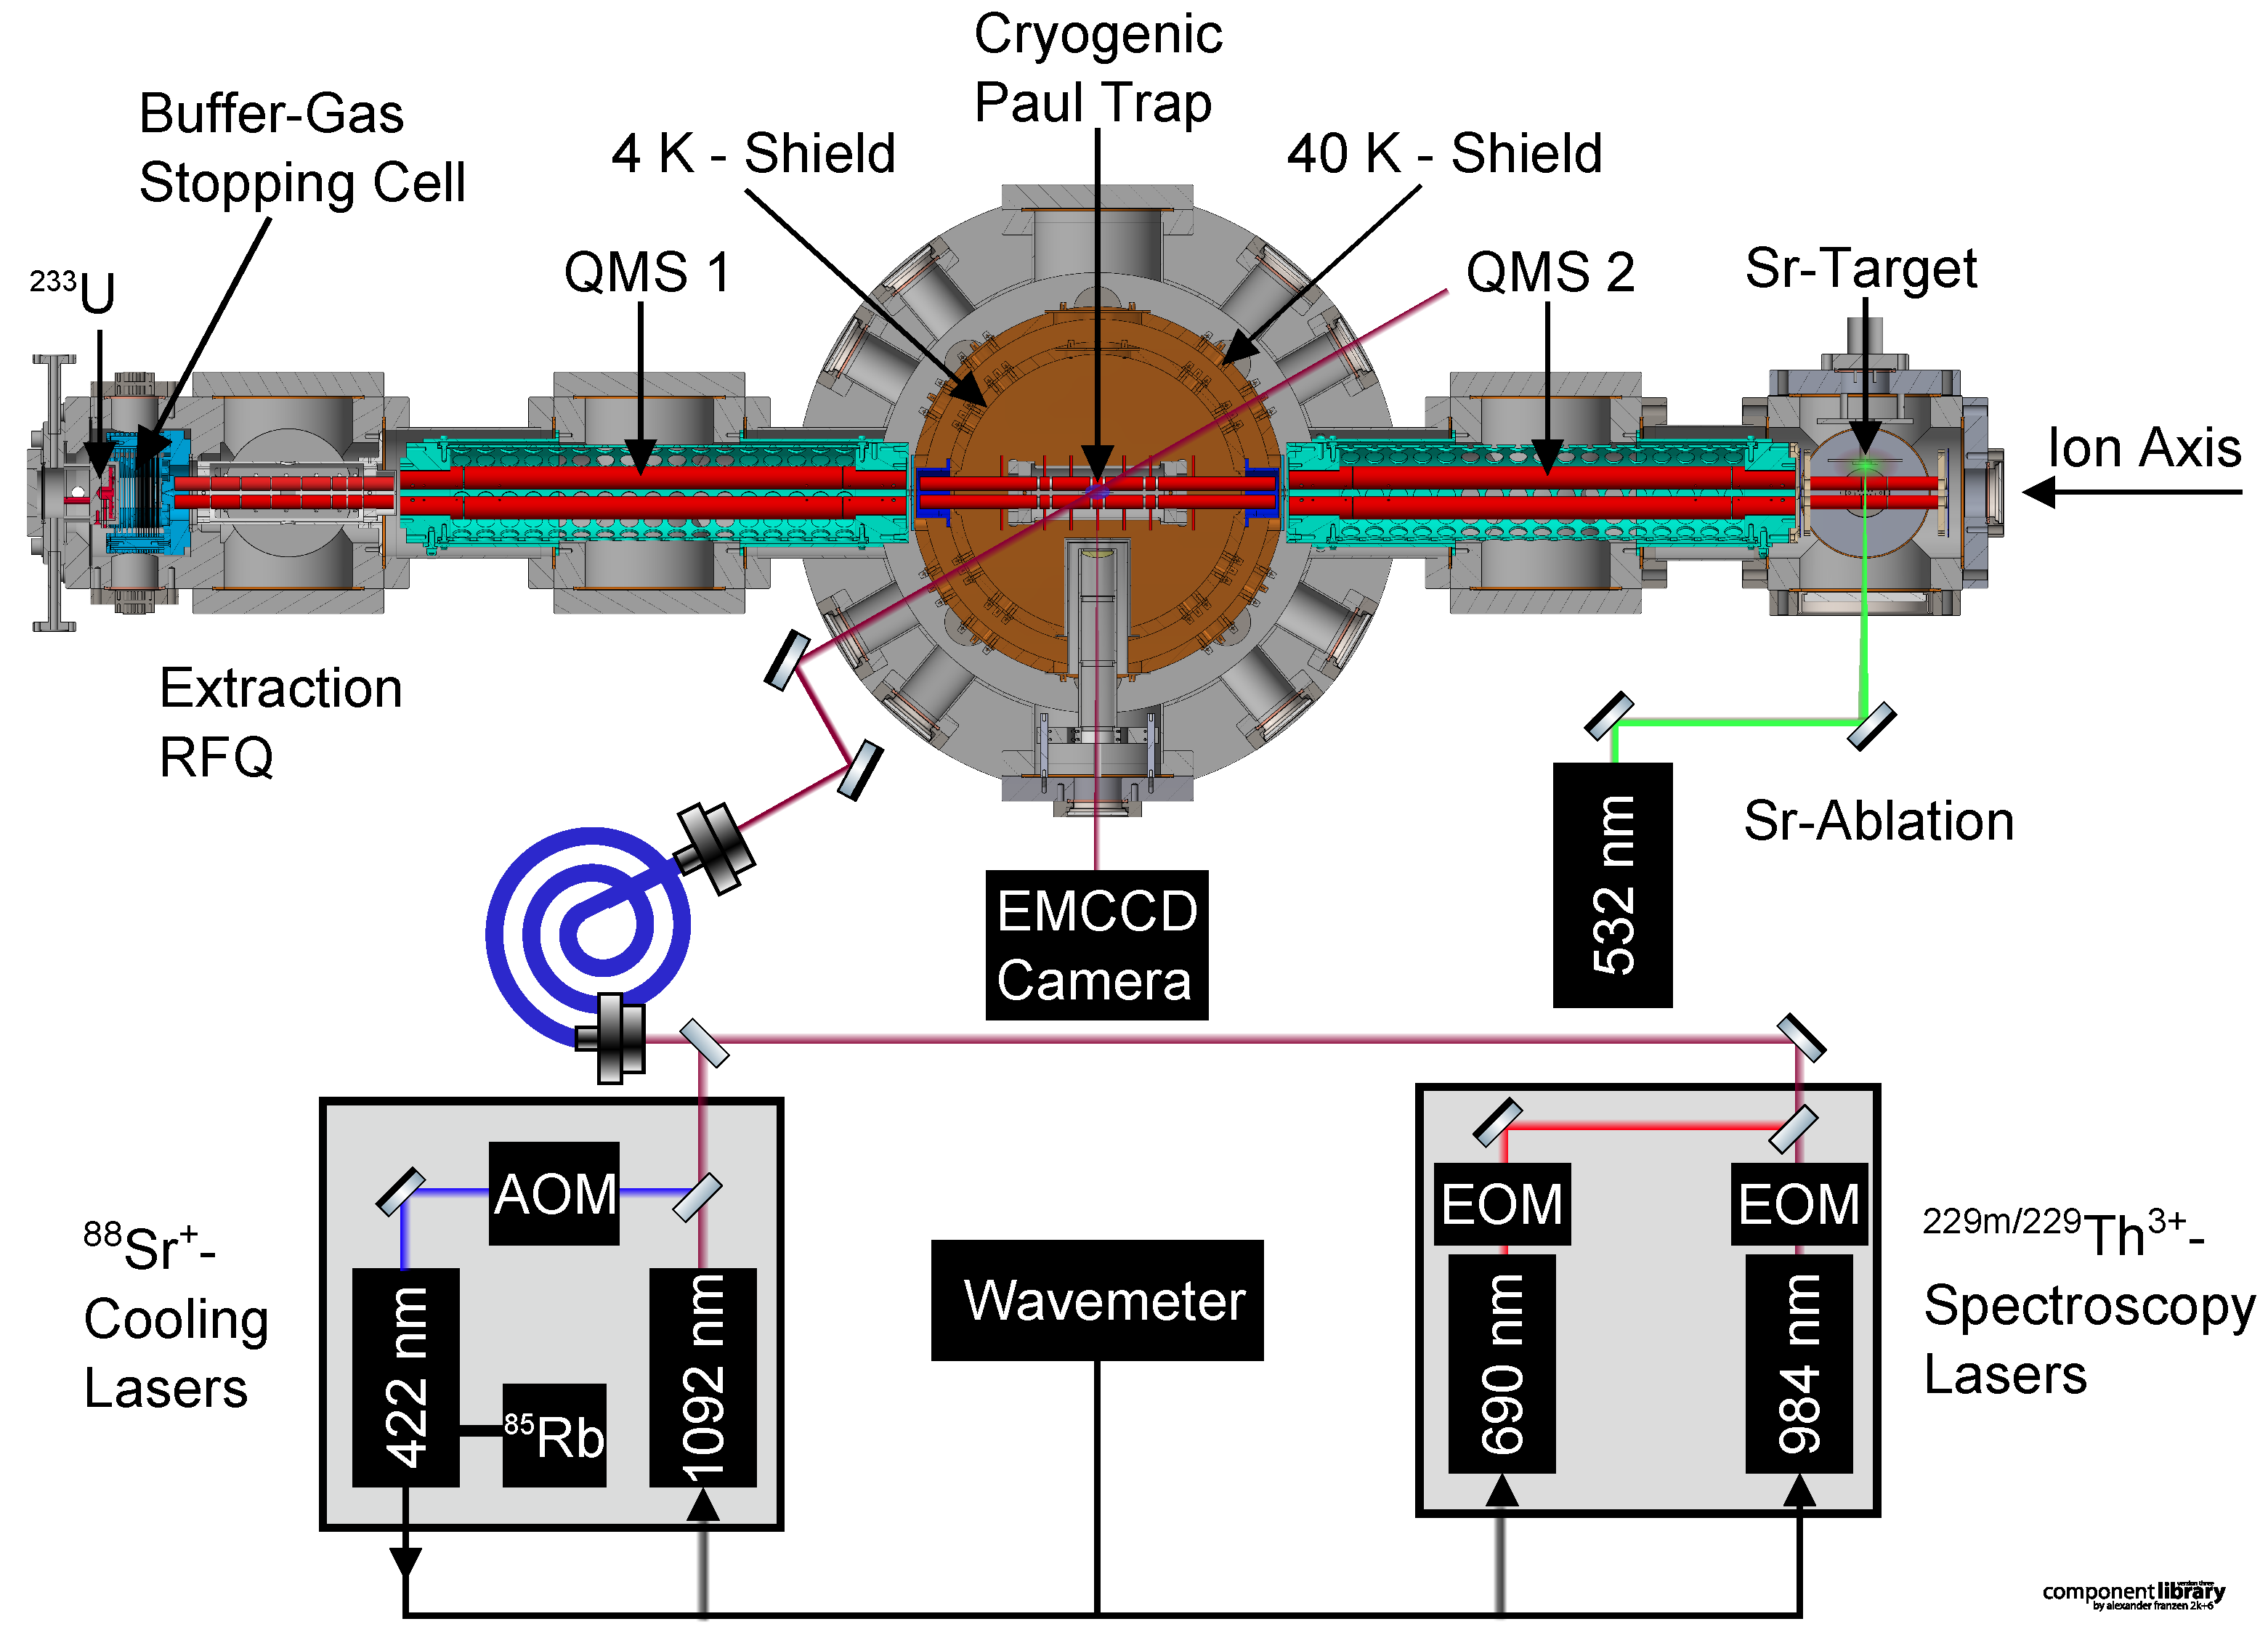
2. Description of the Experimental Setup Dedicated to the Radiative Lifetime Measurement

Two main prerequisites to measure the radiative decay time of 229Th ions in their first isomeric state are the suppression of non-radiative decay channels, like internal conversion, and, when using an ion-trap-based approach, ion confinement at least as long as the estimated lifetime. Both requirements can be fulfilled within a linear Paul trap operated in a cryogenic environment under excellent vacuum conditions and thus sufficiently long storage time. According to previous findings in cryogenic Paul traps, characteristic vacuum pressures in a trap chamber lie in the upper 10−10 mbar range, close to the measurement limits of standard active line gauges [24]. This means that vacuum pressures in the cryogenic environment can only be estimated using the ion storage time and have been reported to lie below 10−13 mbar [24,25,26].
Herein, we further only briefly explain the Paul trap device developed at LMU, introduced in [23] and described in more detail in an upcoming publication [27].
The radiative lifetime of the isomeric state is planned to be measured using hyperfine structure spectroscopy (HFS) at 690.32 nm and 984.19 nm to target the 2F5/2 → 6p 2D5/2 and 2F7/2→ 6p 2D5/2 transitions in 229/229mTh3+ [23] with natural linewidths of FWHM = 28 kHz and FWHM = 210 kHz, respectively [28]. Depending on their respective nuclear state, the hyperfine splittings of thorium ions differ from each other by several MHz according to calculations on the basis of experimental results in [18,28] and also visible in the level scheme of Figure 1. One condition, however, to resolve the hyperfine structure of thorium and to spectrally distinguish between the isomeric state and the nuclear ground state is the cooling of trapped ions below 1 K.
In consequence, the envisaged measurement, in parallel to the electromagnetic ion-trapping setup, requires an efficient cooling mechanism for 229Th3+. Here, sympathetic cooling with laser-cooled 88Sr+ will be used. The laser-optical setup comprises four continuous-wave diode laser systems and one pulsed Nd:YAG ablation laser. The latter will be used to generate free 88Sr+ ions, which will be co-trapped with thorium ions in the linear Paul trap and simultaneously Doppler-cooled at 422 nm, where Photons at 1092 nm wavelength will ensure efficient repumping from the metastable 4d 2D3/2 state (Figure 2). Thorium ions are then expected to form Coulomb crystals with the 88Sr+ ions.
In a second step, two other diode lasers at 690 nm and 984 nm will be used to perform the hyperfine spectroscopy of thorium. Analogous to the diode lasers at 1092 nm, the one at 984 nm is required as repumper to prevent the generation of dark states.
To save space on the optical table, lasers and their optical arrangements are stored in five 19″-rack drawers. Enhanced vibrational stability is provided using heavy steel-plate drawers (87404, 19″ Rack Drawer 4U; Adam Hall GmbH, Neu-Anspach, Germany) with a maximum load capacity of 25 kg and a ball-bearing slide-in rail for smooth opening and closing. Additionally, the breadboards carrying the laser setups inside the drawers are decoupled from the drawer walls and mounted on rubber feet (AV4/M; Thorlabs GmbH, Bergkirchen, Germany), damping vibrations above 100 Hz.
The transport of light from the respective drawer to the Paul trap vacuum chamber is achieved with the use of polarization-maintaining optical fibers. For the fibers as well as for the cables connecting the lasers to their controllers and power supplies, all drawers are provided with feedthroughs in the casing. However, in order to maintain optimal dust protection and laser safety, the holes can be covered with synthetic foam.

2.1. A Cryogenic Paul Trap for the Storage of 229mTh3+ Ions

The thorium ion extraction from the buffer-gas stopping cell follows the approach of previous works [5,8,17]. However, in this setup, the buffer-gas stopping cell is compactified and customized to the needs of the targeted few-ion storage in the cryogenic Paul trap. As depicted on the left side of Figure 3, a 233U source of 10 kBq activity is mounted inside the stopping cell providing thorium ions via α -decay with a 2% population branch to the first isomeric excited state. The source is made of a silicon substrate covered with a titanium–uranium coating of 100 nm in thickness and has a diameter of 25 mm. To keep free access to the ion axis, the source features a center hole of 5 mm in diameter.
Released ions from the source are stopped in 32 mbar ultra-pure He buffer gas, collimated in an RF-DC funnel, and eventually dragged by a supersonic gas jet through a de Laval nozzle into a segmented radio-frequency quadrupole (RFQ) in the following vacuum chamber. The RFQ, acting as ion guide, phase-space cooler, and ion buncher, forms a continuous ion beam, which is sent to the adjacent quadrupole mass separator (QMS 1). Here, the accompanying α-decay daughter products of the 233U decay chain and other thorium ion charge states are removed before pure 229(m)Th3+ ions enter the trapping region. The linear segmented Paul trap is surrounded by two temperature shields (at 40 K and at 4 K) separating the cryogenic region from the surrounding vacuum at room temperature. For more details on the design of the cryo-trap, the reader is referred to [24,27,29].
In addition, a second QMS (QMS 2) is located behind the Paul trap in a configuration symmetric to the first one for the filtering of a second ion species to be co-trapped with thorium ions and acting as sympathetic cooling mediator. For laser access, the vacuum chamber has several free-view axes through the trap center. One is along the ion axis itself, and five more are distributed at different angles relative to it (30 , 50 , 90 , 130 , 150 ). The viewports of each view axis are AR-coated at the wavelengths of the four diode lasers (Fused Silica Viewport, AR-coated on both sides at 420 nm, 690 nm, 980 and 1092 nm, and mounted on a CF40 Flange; MPF Products Inc., Gray Court, SC, USA).

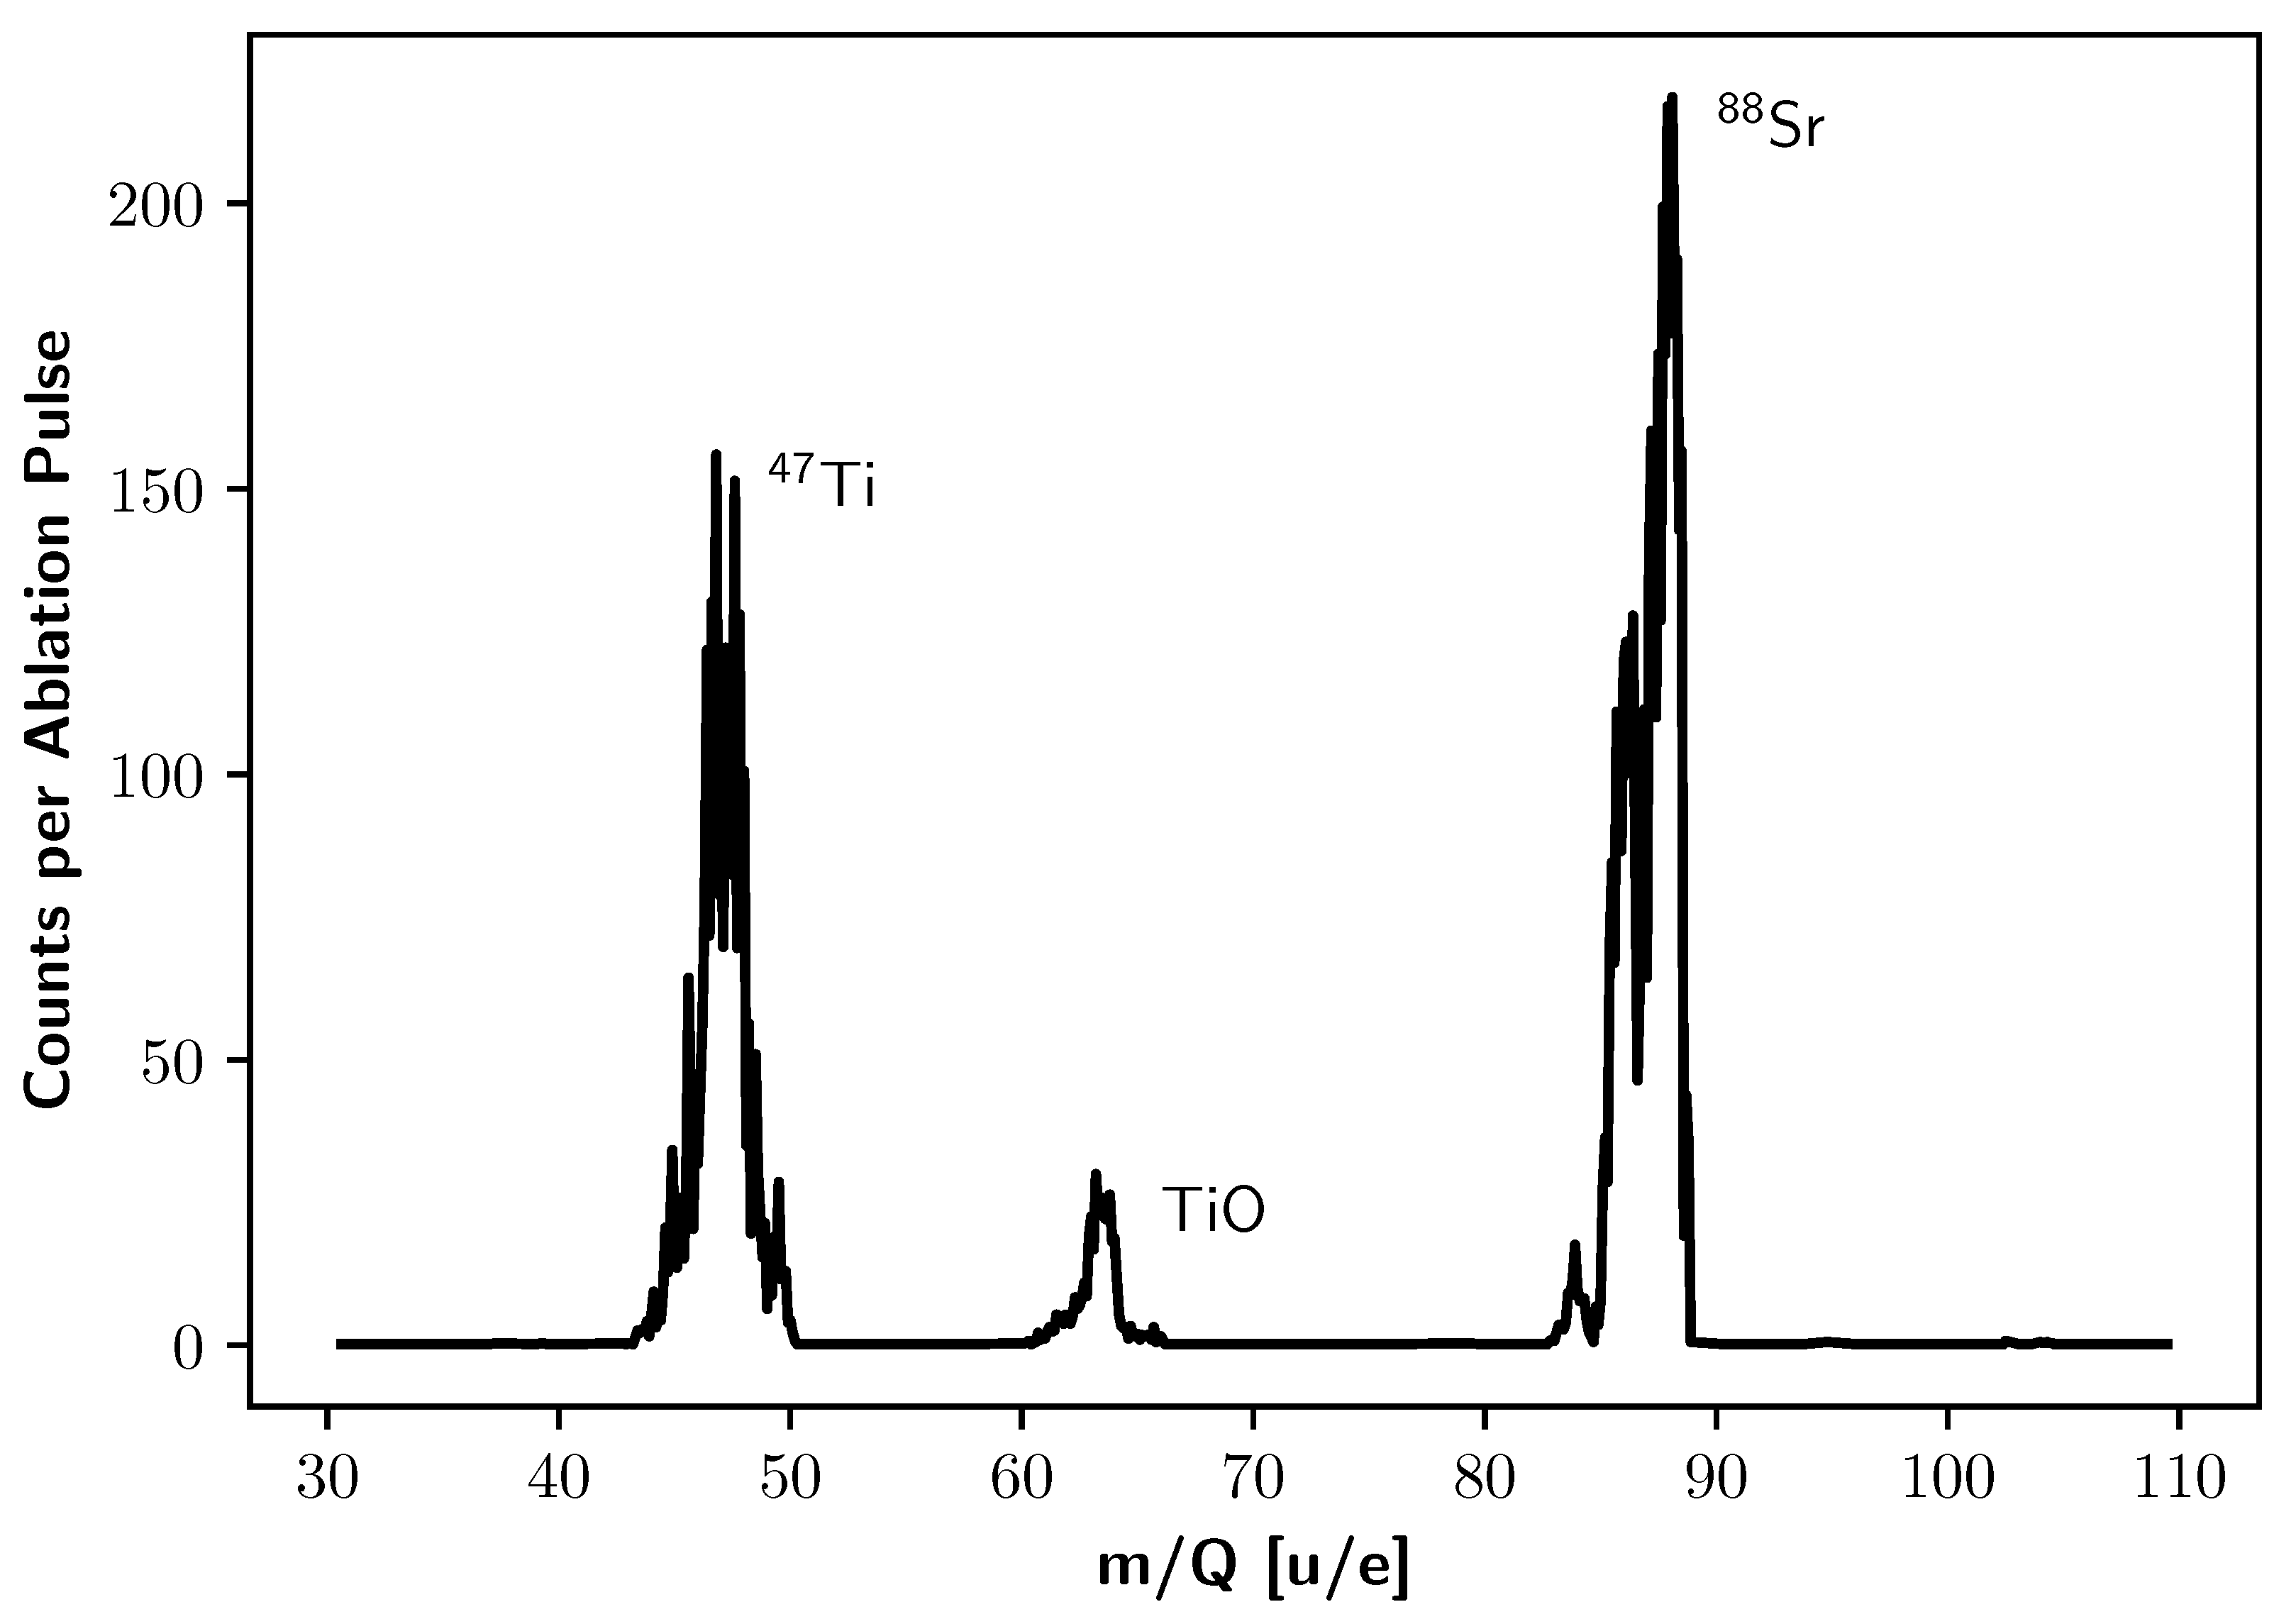
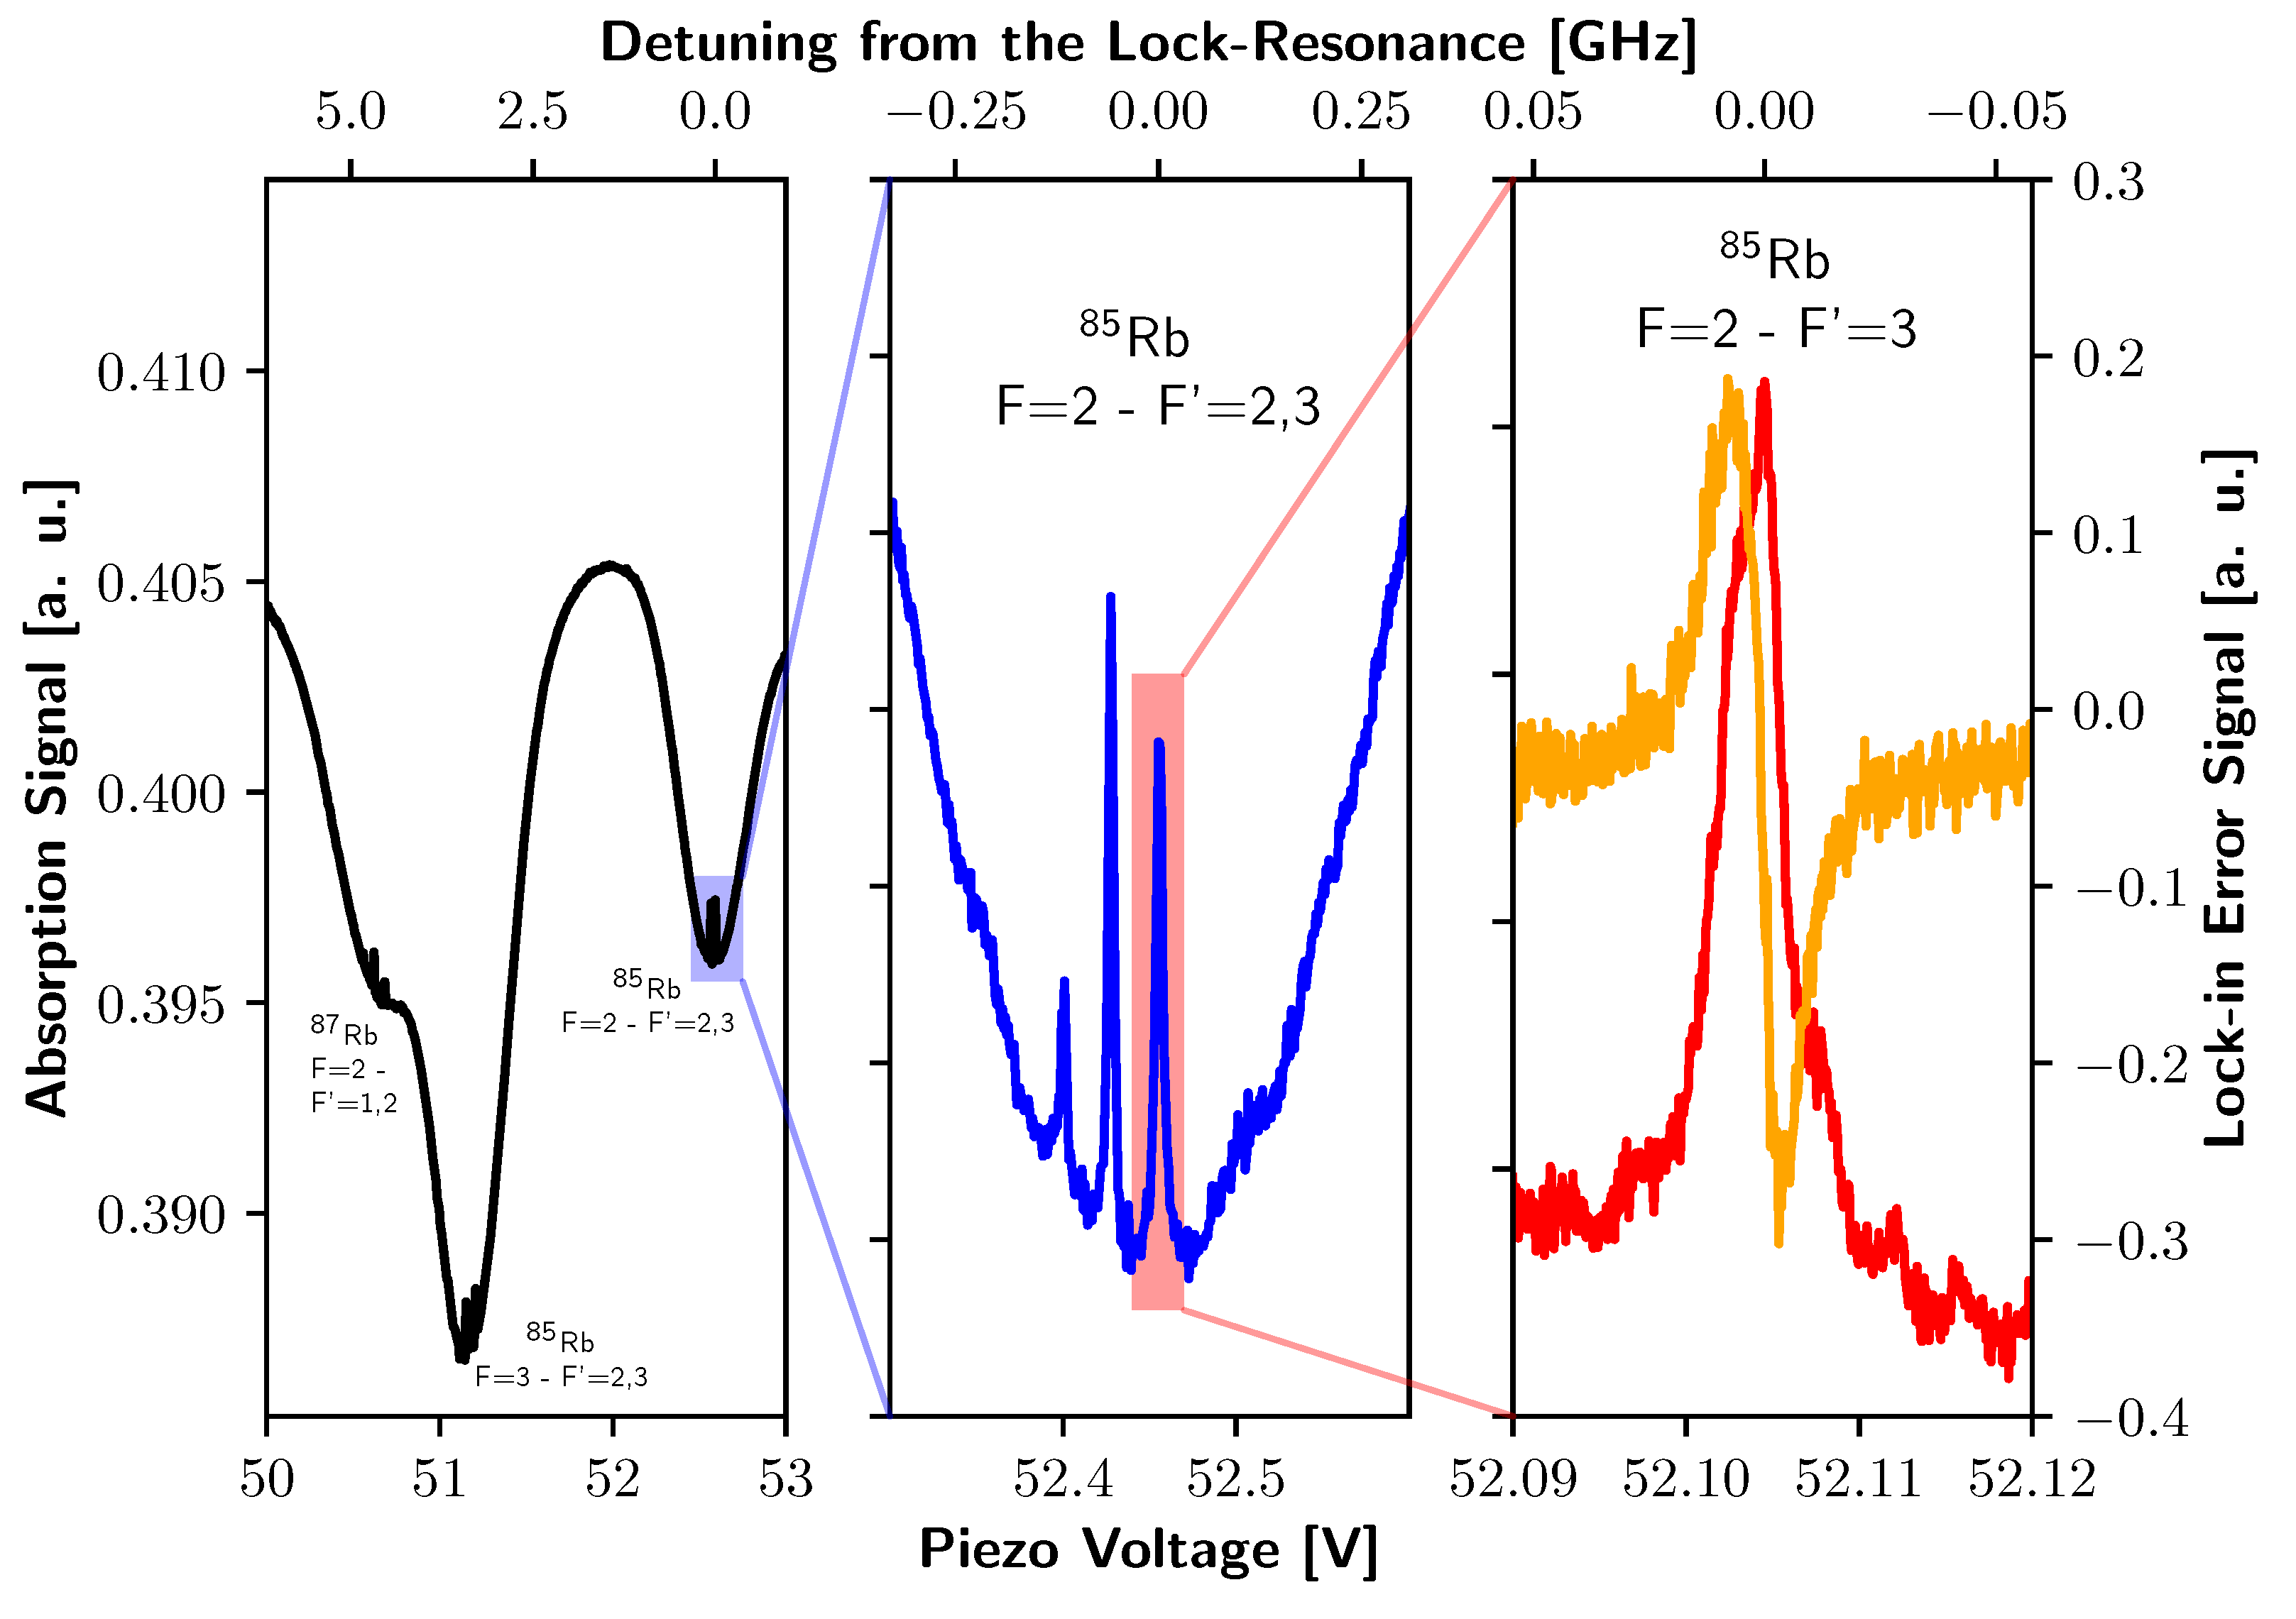
2.2. Preparations for Sympathetic Laser Cooling with 88Sr+ Ions

Regarding the cooling of thorium ions, the direct laser cooling of 229Th3+ [28,30], as well as the sympathetic laser cooling of 232Th+ with 40Ca+ ions [31,32], has been previously reported. We chose the sympathetic cooling approach with 88Sr+ ions, which are free of hyperfine structure, as mediator to remove motional energy from the trapped thorium ions. This choice was mainly due to the easily accessible cooling cycle of strontium with diode lasers available at the required cooling wavelengths of 422 nm and 1092 nm, respectively. Another reason for using strontium was the respective mass-to-charge ratio of m / Q = 88.0 , which is reasonably close to the one of thorium, m / Q = 76.3 , thus providing favorable cooling conditions via Coulomb interaction. Since the m/Q ratio also dictates the trap parameters, the trapping potentials can be chosen pretty similar for both ion species.
We expect to confine 50 to 100 229Th3+ ions in our Paul trap, thus statistically ending up with 1 or 2 of them in the isomeric state. For the efficient sympathetic cooling of such number of thorium ions, at least the same number of strontium ions is required. We can achieve this with the ablation of 88Sr+ from a solid-state target, similar to reports in the literature [33,34,35]. Our target material is a SrTiO3 crystal (Strontium Titanate Single Crystal Substrate <100>, 634689-1EA; Sigma Aldrich, Merck KGaA, Darmstadt, Germany) mounted at a distance of 610 mm from the Paul trap center behind QMS 2 (see Figure 3) in a room-temperature environment. Atom or ion ablation in close vicinity of a Paul trap under cryogenic conditions has been reported by several groups [29,34,36,37]. However, in these cases, surface ion traps with low numbers of loaded ions were mainly used. The aim for the efficient loading of potentially hundred and more strontium ions generated without additional photoionization lasers brought the decision to collimate and mass filter the ions before trapping. Furthermore, the direct ablation of ions from a solid target is a hardly quantitatively controllable process that generates a huge number of charged and neutral particles, which can coat the electrode surfaces. Therefore, ablation outside the cryogenic trapping region minimizes the risk of generating patch potentials on the trap electrodes, which in turn would have a negative influence on the motional heating rate or the position of the trapped ions [38,39,40,41].
For better collection of ablated strontium ions, an additional segmented RFQ (rod diameter of 11 mm, preceding QMS 2; ion-axis-to-rod distance of 5.1 mm) consisting of two outer segments of 40 mm and one central segment of 20 mm in length is foreseen. Two circular electrodes with 3 mm apertures on the ion axis act as endcaps and protect QMS 2 from ablation residuals. The SrTiO3 target is mounted at a distance of 25 mm from the ion axis, faces the central RFQ segment and can be aimed for through the free space of 4 mm in width between the rods. This extra RFQ in the vicinity of the strontium target is in the following referred to as Strontium Extraction RFQ.
The ablation of 88Sr+ can then be carried out with a frequency-doubled Nd:YAG laser (Q-switched Nd:YAG laser, SN: 03022502; Quantel USA Inc., Bozeman, MT, USA) running at 532 nm with pulse durations of around 5 ns and tunable repetition rates up to 50 Hz. The system can be operated with pulse energies of up to 125 mJ, but for our application 3–5 mJ is sufficient. The laser beam is focused on the target with a spot size of about 300 μm and impinges at an angle of 90 with respect to the ion axis after passing a vacuum viewport.
A mass scan of ions created in the ablation process, performed with QMS 2, and measured with an MCP detector at the position of Extraction RFQ (please see Figure 3) revealed the charged particle spectrum and can be seen in Figure 4. For this target specification, no RF voltages were applied to the electrodes of Strontium Extraction RFQ.
The cooling cycle of strontium ions requires laser radiation at 421.67 nm, driving the main cooling transition from 5s 2S1/2 to 5p 2P1/2, and at 1091.79 nm, depleting the dark state 4d 2D3/2. For the main cooling transition, we use a commercially available ECDL (DL pro HP 420_029338; TOPTICA Photonics AG, Gräfelfing, Germany) with an output power of 41 mW.
Dark-state depletion is performed with another diode laser (DL pro_021546; TOPTICA Photonics AG, Gräfelfing, Germany) with an output power of 72 mW. Characterizing the beam with a profiler camera (CinCam CMOS-1202; Cinogy Technologies GmbH, Duderstadt, Germany) after the laser head by applying a Gaussian fit, revealed an elliptical beam shape with a major beam diameter in the horizontal direction of dx = 3.28 mm and a minor beam diameter in the vertical direction of d y = 0.94   mm . For better fiber coupling efficiency, the beam shape can be corrected to lower ellipticity with a Galilean telescope of cylindrical lenses.
The calculated saturation intensity values of the respective laser cooling transitions lie at 352.54 W/m2 (for 422 nm) and 1.52 W/m2 (for 1092 nm) and the laser power can be adjusted depending on the focus in the trapping center to reach at least twice the saturation intensity.
Even though both lasers are temperature-stabilized and exhibit a very narrow linewidth on short time scales down to 150 kHz at 5 μs integration time according to the manufacturer, they undergo wavelength drifts over time in free-running mode. Since both transitions in the cooling cycle have linewidths in the megahertz range ( 20.21 ± 0.80 MHz at 422 nm and 1.51 ± 0.32 MHz at 1092 nm [42]), a special wavelength stabilization for both lasers is needed to prevent them from falling out of resonance during typical experimental periods of up to hours.
Concerning stabilization, the 422 nm laser plays a special role because it serves as master laser for the second Sr cooling laser and also for the thorium spectroscopy lasers. This requires initial stabilization of the 422 nm wavelength to an external absolute reference, thus creating a master laser, and, in a second step, the stabilization of all other lasers relative to the master.
Following previously reported Sr-ion cooling approaches [43,44,45,46,47,48,49], we stabilized our master laser on the 5s 2S1/2 (F = 2) → 6p 2P1/2 (F′ =3 ) atomic transition in 85Rb at ν = 710 962 401 328 ± 40   kHz [50]. This procedure was motivated by the fact that the Rb transition lies only 440 MHz to the red side of the main cooling transition in 88Sr+ [44,46] and a frequency shifter can be used.
In order to detect the Doppler-free absorption line in the hyperfine structure of 85Rb, saturated absorption spectroscopy was performed with a setup comparable to the one by Shiner et al. [50] and also visible in Figure 5: after passing a polarizing beamsplitter, the 422 nm laser with linear horizontal polarization enters a borosilicate vapor cell (GC25075-RB; Thorlabs GmbH, Bergkirchen, Germany) containing a natural isotope ratio of 72.17 % 85Rb and 27.83 % 87Rb [51].
With a suitable heater and a controller (GCH25R, TC200; Thorlabs GmbH, Bergkirchen, Germany), the cell temperature is stabilized to 90 C . The transmitted light then passes a quarter-wave plate and a neutral density filter (ND 0.5) before it is back-reflected through the setup up to the beamsplitter. In this way, the required probe beam for saturated absorption spectroscopy with turned polarization and lower intensity with respect to the initial pump beam is generated and reflected to a fixed-gain silicon photodetector (PDA8A2; Thorlabs GmbH, Bergkirchen, Germany). Feeding the detected signal directly to the digital laser controller (DLC pro; Toptica Photonics AG, Gräfelfing, Germany) enables the instant readout of the absorption signal in rubidium. Scanning the applied voltage of the piezo crystal, controlling the position of the grating with respect to the laser diode of the 422 nm laser, scanned the laser frequency and revealed the absorption spectrum of 85Rb/87Rb gas over the spectral range of interest, as shown in Figure 6.
Stabilizing the laser to the chosen atomic transition, visible in the saturated absorption spectroscopy result, is also achieved using the internal locking electronics of the DLC pro. The top-of-fringe locking scheme is applied, which is based on the lock-in technique, in combination with a PID controller (proportional–integral–derivative controller). In order to generate an error signal of the absorption signal, the laser frequency is additionally frequency-modulated on top of the frequency scan. This additional modulation is achieved by changing the laser diode current by ± 0.07 mA at a frequency of 20.4 kHz. Such modulation of the absorption signal can then be used in a next step to acquire its derivative. The derivative in turn acts as the error function for two PID controllers to regulate the diode current and the piezo voltage, keeping the laser frequency at the zero-crossing of the chosen absorption peak.
Once stabilized to the external reference, the 422 nm laser can act as master laser for the other three laser systems.
Stabilizing several lasers to a fixed reference wavelength can be performed using either a scanning transfer cavity or a wavelength meter. The latter is used here because it is deemed to be the technically easier-to-implement method with commercially available devices and with sufficient accuracy for ion-trapping experiments [52,53]. Consequently, the stabilized 422 nm laser together with the other three free-running diode lasers are sent to a wavelength meter (WS7-60; High Finesse GmbH, Tübingen, Germany) with absolute accuracy of 60 MHz via optical fibers and a suitable fiber switch (MC8 Multimode Switch; eight inputs, FC/PC, 12 ms switching time; High Finesse GmbH, Tübingen, Germany). The wavemeter can then be calibrated in fixed time intervals to the 422 nm laser as external reference and continuously measure all four wavelengths. The measured data are then read out by a LabView-based routine running on an FPGA-based data acquisition system (NI myRIO-1950; National Instruments Corp., Austin, TX, USA) and further fed to three different PID controllers to directly counteract any wavelength drifts by adjusting the respective piezo voltage for the laser grating position with control voltages in the range 0–5 V.
The wavelength stability of the stabilized laser system at 422 nm, that can be measured over one hour with the wavelength meter, lies at 2.9 MHz (standard deviation), which is comparable to previous measurements in a similar configuration [52]. Due to the wavemeter’s specified precision limit of 2 MHz and the additional accuracy limitations introduced by the multimode fiber switch, this can be considered the maximum transferable stability for the three slave lasers. With regard to strontium laser cooling, roughly 3 MHz frequency stability is sufficient because of the broader linewidth of the main cooling cycle and the expected power broadening for the repumper transition at 1092 nm.
Replacing the multimode fiber switch either with another commercial device or a custom solution similar to the one used in [54] is expected to further improve the readout stability of the wavemeter. If the wavemeter locking technique still turns out not to fulfil the requirements for thorium laser spectroscopy, the existing stabilization scheme has to be upgraded by an additional transfer cavity lock. In combination with an absolute reference, such a scanning transfer cavity can provide improved control over fast frequency drifts and thus overall improved long-term frequency stability [28].
Although it is stabilized, the 422 nm laser still needs to be shifted in wavelength before it can be used for Doppler cooling. The above-mentioned 440 MHz frequency upconversion with respect to the rubidium transition frequency is achieved with an AOM (acousto-optic modulator) double-pass configuration placed in an additional rack drawer, which can be seen in Figure 7.
As the laser light leaves the polarization-maintaining fiber, it passes a zero-order half-wave plate in order to orientate the polarization axis of the light perpendicularly to the AOM base plate for optimum efficiency in the +1st diffracted order after the first pass through the AOM crystal. The diffraction performance of the SiO2 crystal built into the AOM (MQ240-A0; 2-UV; AA Opto-Electronic, Orsay, France) turned out to be very sensitive to any light polarization deviating from the optimum direction (in contrast to TeO2, which is also found in AOM devices). Therefore, the incident beam and the outgoing beam after the second pass through the AOM have to be separated in space, which is less elegant than separation using a different light polarization for the incident and outgoing beams.
This can be achieved by aligning the incoming beam vertically off-center through a plano-convex lens (f = 150 mm) to focus on the active area (1.0 mm × 0.2 mm) of the crystal, as visualized in Figure 7c. After the first pass, the +1st diffracted order is separated from the 0th and 2nd orders with two razor blades and sent vertically off-center through another plano-convex lens (f = 150 mm) before it hits a cat’s eye reflector (180 prism reflector). When exiting the prism reflector, the beam is shifted upwards and passes again through the whole lens system with the AOM in the focus position, before it is finally coupled into a polarization-maintaining fiber with a D-shaped mirror. In this way, it is also possible to scan the laser frequency around the resonance in 88Sr without changing the frequency of the stabilized laser system itself. We can apply modulation frequencies between 190 MHz and 255 MHz at RF signal power of 2.1 W (or 33.2 dBm) and reach diffraction efficiency over the whole modulation frequency range from 32% to 65%.

2.3. 229mTh3+ Hyperfine Structure Spectroscopy

Our two external cavity diode lasers running at 690 nm and 984 nm were home-built on the basis of the Ricci–Hänsch or Littrow–Hänsch ECDL design [55,56]. We used commercially available laser diodes (HL6738MG and L980P030; Thorlabs GmbH, Bergkirchen, Germany) and holographic gratings (GH13-18V (1800/mm) and GH13-12V (1200/mm); Thorlabs GmbH, Bergkirchen, Germany), which were mounted in a brass construction fixed in rigid aluminum housing. The lasers are actively temperature-stabilized by Peltier elements (TECH11; Thorlabs GmbH, Bergkirchen, Germany), that also isolate the lasers from the housing. Control of the laser temperatures, diode currents, and piezo voltages for grating adjustment is performed with an additional pair of TOPTICA DLC pro laser controllers.
Before the two laser beams can be sent to the vacuum chamber for hyperfine structure spectroscopy, they need to be modified in their respective spectrum to address either 229Th3+ or 229mTh3+. For this purpose, the respective laser shall be guided through an electro-optic modulator (EOM) that is driven with selected RF voltages, which is a common procedure in atomic and laser physics experiments [30,57,58,59,60]. Exactly at these radiofrequencies, the EOMs (PM705 for 690 nm and PM980 for 984 nm; JENOPTIK Optical Systems GmbH, Jena, Germany) generate spectral sidebands around the chosen center frequencies, which in turn drive all necessary hyperfine transitions to prevent the generation of dark states during spectroscopy. A more detailed overview of the respective EOM drive frequencies and the envisaged transitions is presented below in Table 1.
The electronic system to generate and combine the RF frequencies before application to the respective EOM, follows the design by Uchiyama et al. [60]. However, we use direct digital synthesizer boards (AD9914; Analog Devices Inc., Wilmington, MA, USA) instead of stabilized VCOs.
According to the chosen set of EOM drive frequencies, for both lasers, two slightly different central laser frequencies are necessary to reach all required hyperfine transitions. Since both lasers also have to be stabilized to one fixed wavelength, it would be less advantageous to switch the wavelength during a spectroscopy experiment. Therefore, it is necessary to bridge the frequency differences between the two center frequencies of 690 nm and 984 nm, respectively, with AOMs in a way similar to that employed for the 422 nm laser. By simultaneously changing the AOM as well as the EOM drive frequencies, we plan to switch back and forth between the two excitation schemes in a convenient way without changing the stabilized laser source.
Prior to such an experiment, it is necessary to measure the linewidth of each 229/229mTh3+ hyperfine transition in the cryogenic environment of our trap. In this way, the applicability of the chosen sideband frequencies can be once more assessed, and uncertainties, minimized.
Another important device for testing and later monitoring the EOM sideband generation is the scanning transfer interferometer. Our confocal version at LMU consists of two plano-concave mirrors (# 168366; reflectivity of 99.8 % at 422 nm, 690 nm, 985 nm, 1092 nm; diameter of 12.7 mm; radius of curvature 200 mm; LAYERTEC GmbH, Mellingen, Germany) at a distance of L = 200   mm glued on an INVAR rod with a mounted piezo actuator (HPCh150/12-6/2; Piezomechanik GmbH, München, Germany), which results in a confocal free spectral range of ν F S R = c 0 / 4 L = 375   MHz . For better decoupling from the environment, the cavity is located in an evacuated housing with two opposing viewports (Fused Silica Viewport; AR coated on both sides at 420 nm, 690 nm, 980 and 1092 nm; mounted on a CF40 Flange; MPF Products Inc., Gray Court, SC, USA) on the cavity axis.

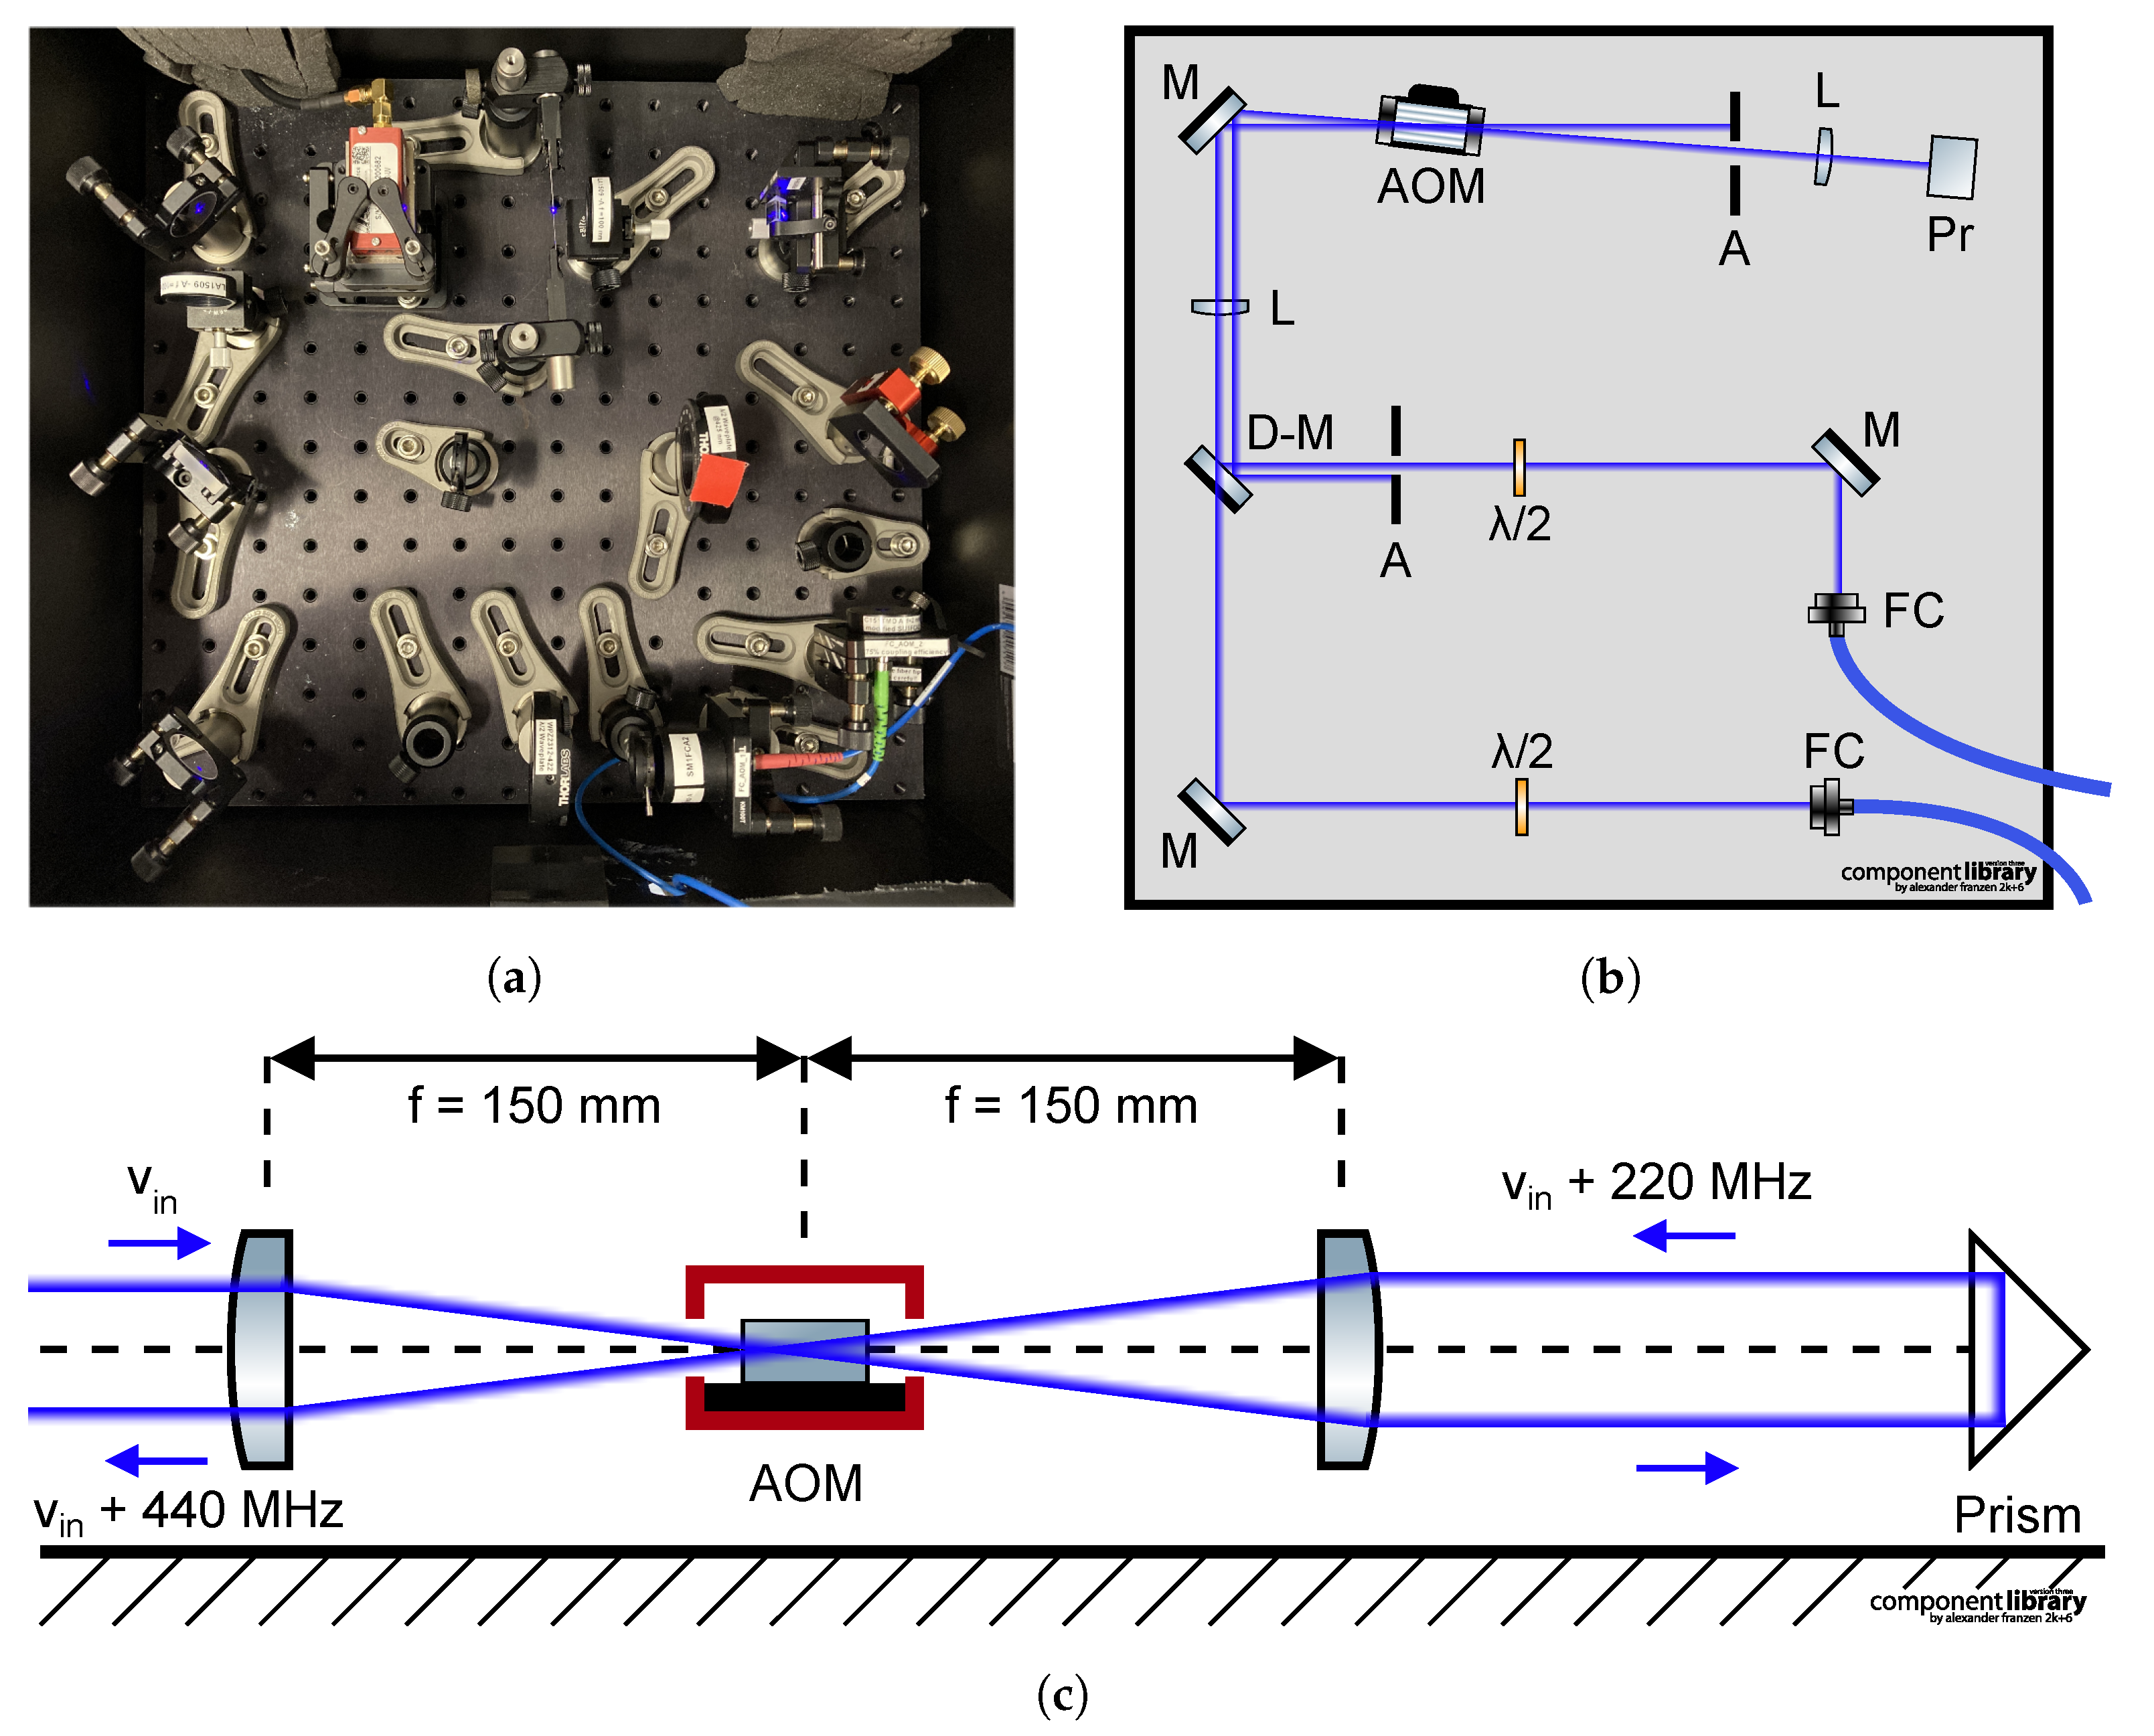
2.4. Four-Wave Incoupling into the Ion Trap

All four laser wavelengths can be sent collinearly into the ion trap via the view axis at 30 with respect to the ion axis by aligning them into a polarization-maintaining photonic crystal fiber (PCF) (PCF-P-5-3-18E-500; 370–1200 nm; Schäfter & Kirchhoff GmbH, Hamburg, Germany) in the first place. Before the fiber incoupler (60FC-LSA-4-M4-24; f = 4 mm; Schäfter & Kirchhoff GmbH, Hamburg, Germany), all wavelengths can be separately adjusted in power and polarization and are then overlapped with dichroic mirrors. Since the viewport is 237 mm away from the trap center, the achromatic fiber outcoupler (60FC-LSA-4-M4-13; f = 4 mm; Schäfter & Kirchhoff GmbH, Hamburg, Germany), which is optimized for small beam widths at a 400 mm distance, can be adjusted and delivers the collimated beam diameters for the different colors enlisted in Table 2.
The measured beam diameters lie reasonably close together, such that nearly uniform illumination of the trapped ions with all four wavelengths can be expected. The actual beam waists of the differently colored beams will never coincide due to the chromatic aberrations of the collimator lens. With Rayleigh ranges exceeding 200 mm for all beams, there is enough room for adjustments, however. In the current configuration with incoupling foreseen at 30 with respect to the ion axis, the actual overlap with the trap center is of elliptic shape with a major axis of roughly 1 mm. If the overlap with the ions turns out not to be sufficient, the beam width can easily be increased in a similar way for all four wavelengths.

2.5. Fluorescence Imaging Setup

For the imaging of the trapped and laser-cooled Sr ions at 422 nm and the readout of thorium ion spectroscopy at 690 nm, we use, in the first step, an aspheric lens (25 mm Dia 0.25 NA, UV-VIS Coated, UV Fused Silica Aspheric Lens, 33-958; Edmund Optics, Barrington, NJ, USA) with effective focal length (EFL) of 50 mm for fluorescence photon collection and collimation. This lens is mounted in a fixed position in a lens tube in vacuum outside the 40 K region but with a free-view axis perpendicular to the ion axis and exactly 46.5 mm (which corresponds to the asphere’s back focal length (BFL)) away from the Paul trap center. This was technically achieved with two pocket-shaped apertures mounted at the respective heat shield and giving access to the 4 K area at a distance of 40 mm from the trap center. In order to keep the penetration of the heat shield as small as possible, the apertures giving free sight on the trapped ions only have a diameter of 20 mm and thus reduce the solid angle for photon collection to 28 . After collimation, the light is sent outside the vacuum chamber through the AR-coated CF-40 viewport and guided with three dielectric mirrors before it passes another pair of the same 50 mm aspheres. Between them, an adjustable iris is mounted for the spatial filtering of the generated second image. Subsequently, the recollimated light is focused with an achromat (25 mm Dia. × 150 mm FL, VIS-NIR Coated, Achromatic Lens, 49-362; Edmund Optics, Barrington, NJ, USA) specified for a wavelength range of 400–1000 nm on the detector of the EM-CCD camera (C9100-23B; Hamamatsu K. K., Hamamatsu, Japan). The overall magnification of the imaging setup with the achromat’s focal length of 150 mm results to be M = 3. Depending on the fluorescence of interest and also for background light reduction, the light can be filtered as a final step in front of the camera.
All in-air lenses are mounted in lens tubes and can be adjusted in their relative distances. The EM-CCD camera itself is mounted on a three-dimensional stage for optimum positioning.
The first imaging tests of the setup revealed a resolution of better than 7 μm and a total field of view of around 1 mm, which would be sufficient for the observation of at least 100 trapped and cooled ions as an estimated distance of around 10 μm.
The estimations of the overall fluorescence photon collection and detection efficiency, taking into account the transmission or reflectance of the optics as well as the EM-CCD’s quantum efficiency, are around 0.94 % at 422 nm and 1.27 % at 690 nm, respectively. The main reason for better efficiency at the longer wavelength is the characteristic quantum efficiency of the EM-CCD camera.

2.6. Methodology for the Radiative Lifetime Measurement

The envisaged measurement scheme to target the radiative lifetime of 229mTh3+ implies the use of the HFS-related spectral differences between the nuclear ground state and the isomeric state [23]. The continuous-wave diode lasers at 690 nm and 984 nm overlap with the total number of trapped thorium ions and are either configured to address the electronic HFS of thorium ions in the ground state or to drive the HFS transitions of the isomeric state. By switching back and forth between the different settings, the detected fluorescence light either stems from nuclear-ground-state or isomeric ions.
In a first step of the measurement, Sr ions will be loaded into the cryogenic Paul trap and laser-cooled until crystallization, before the thorium ions are loaded from the opposite side. We expect 10 to 100 229Th3+ ions to be embedded in the strontium crystal and sympathetically cooled. Ideally, we achieve the co-trapping of 50 thorium ions and 50 strontium ions to end up with 1 isomeric thorium ion in a linear chain of around 1 mm length.
In a second step, the fluorescence intensity of the isomeric state thorium ion will be measured with the 690 nm and 984 nm lasers in the respective configuration. At that time, all thorium ions in the nuclear ground state will be dark. Directly after the recorded disappearance of the isomer, the 690 nm and 984 nm lasers will be switched to only address the hyperfine structure transitions of the ground state ions. Then, it will be possible to verify, if the thorium ions will still be confined in the trap and will not have been lost due to heating processes or molecule formation. With a validated record of the fluorescence lifetime, the whole measurement cycle will start from the beginning, and a series of successful measurements will be able to be acquired for statistical evaluation.
Alternatively, once the thorium and strontium ions will have formed a coulomb crystal, a fixed switching rate (i.e., 0.5 Hz) between the two different spectroscopy laser configurations and a continuous readout of the fluorescence light could be applied. In this way, the confinement conditions of thorium ions could be monitored more frequently, and the readout error per lifetime measurement would still be quite low compared with the expected lifetime.
The systematic uncertainties limiting the accuracy of the lifetime measurement can be divided into major and minor uncertainties. We assess the flight time of the thorium ions from the extraction cell into the trap as well as the switching times of trap electronics to be negligible factors. Such uncertainties lie in the order of µs and are small in relation to the expected radiative lifetime of at least 2000 s [7].
A more critical aspect is the choice of a suitable starting point of the measurement. The actual decay of the isomeric state is directly correlated with the alpha decay of the 233U source, which is a stochastic process. On the other hand, we can control the extraction of thorium ions by switching the RF voltage of the funnel structure in the gas cell on and off. So, the extraction has to be triggered as a function of the loading and cooling of strontium ions. Shortly before they are sufficiently Doppler-cooled in the trap center, the RF funnel is turned on, and only recently released thorium ions (via alpha decay of the233U source) are extracted from the stopping cell. Since only a low number of thorium ions is required, extraction, collection in the RFQ, and loading into the trap should occur on a time scale of hundreds of ms to s.
A conservative estimate of the overall uncertainty per measurement results to be in a range of tens of seconds to a minute, which would still be acceptable with respect to the long isomeric lifetime to be measured.

3. Conclusions and Outlook

The radiative lifetime of the first isomeric excited state of 229Th3+ so far remains the last major experimentally unknown characteristic property of this unique isomer. With its link to the linewidth of the nuclear transition, it also defines the requirements to construct a future optical oscillator for a nuclear frequency standard. We present an updated and more detailed view of the cryogenic Paul trap setup at LMU designed to measure the radiative lifetime with a focus on the laser-optical part of the experiment.
Apart from the general strategies for the trapping and sympathetic cooling of thorium ions with Doppler-cooled 88Sr+ in a cryogenic environment, it is also discussed how the 229Th3+ nuclear ground and first excited states can be addressed and distinguished with hyperfine structure spectroscopy.
The current experimental work at LMU focuses on strontium-ion-loading and Doppler-cooling tests to further characterize the apparatus and to deliver the first proof-of-principle results. As a next step before actual spectroscopic measurements, the extraction and confinement of thorium ions has to be demonstrated in a considerably more compact geometry than that of our previously used setup. This raises additional challenges for the efficient removal of buffer gas before entrance into the cryogenic Paul trap. Once the setup is fully operational and demonstrated to be a reliable device to confine thorium ions using spectroscopic nuclear-state readouts, it is further planned to directly excite the nuclear ground state. To this end, a resonant VUV frequency-comb-based laser system (presently under development at Fraunhofer ILT in Aachen, Germany) will be integrated into the cryogenic trap for identifying the nuclear resonance with narrow-band laser spectroscopic precision, thus reducing the nuclear transition frequency uncertainties from the THz level to the kHz level. In this way, the presented apparatus could serve as a prototype for a nuclear clock and could be used for additional characterization and parameter optimization, paving the way for the first application [9].

Author Contributions

The original draft was prepared by K.S. with input from K.S., S.D., G.H., M.I.H., S.K., L.L., D.M., T.R., B.S., F.Z. and P.G.T.; supervision, P.G.T. All authors have read and agreed to the published version of the manuscript.

Funding

This work is part of the ‘ThoriumNuclearClock’ project that received funding from the European Research Council (ERC) under the European Union’s Horizon 2020 Research and Innovation Programme (grant agreement No. 856415) and of the European Union’s Horizon 2020 Research and Innovation Programme ‘nuClock’ (grant agreement No. 664732).

Data Availability Statement

The data supporting the calculations in Table 2 as well as the source data for the plots in Figure 4 and Figure 6 are available from the corresponding author upon reasonable request.

Acknowledgments

We are grateful for encouraging discussions with and support by E. Peik, M. Okhapkin, J. Thielking, J. Tiedau, G. Zitzer, V. Wirthl, and L. v.d. Wense. In addition, special thanks go to R. Oehm and his team at the LMU’s mechanical workshop in Garching.

Conflicts of Interest

The authors declare no conflict of interest.

References

  1. Hahn, O. Über eine neue radioaktive Substanz im Uran. Berichte Der Dtsch. Chem. Ges. (A B Ser.) 1921, 54, 1131–1142. [Google Scholar] [CrossRef] [Green Version]
  2. Walker, P.; Podolyák, Z. 100 years of nuclear isomers—Then and now. Phys. Scr. 2020, 95, 044004. [Google Scholar] [CrossRef]
  3. Kondev, F.; Wang, M.; Huang, W.; Naimi, S.; Audi, G. The NUBASE2020 evaluation of nuclear physics properties. Chin. Phys. C 2021, 45, 030001. [Google Scholar] [CrossRef]
  4. Kroger, L.; Reich, C. Features of the low-energy level scheme of Th as observed in the α-decay of 233U. Nucl. Phys. A 1976, 259, 29–60. [Google Scholar] [CrossRef]
  5. Seiferle, B.; von der Wense, L.; Bilous, P.V.; Amersdorffer, I.; Lemell, C.; Libisch, F.; Stellmer, S.; Schumm, T.; Düllmann, C.E.; Pálffy, A.; et al. Energy of the 229Th nuclear clock transition. Nature 2019, 573, 243–246. [Google Scholar] [CrossRef] [PubMed] [Green Version]
  6. Sikorsky, T.; Geist, J.; Hengstler, D.; Kempf, S.; Gastaldo, L.; Enss, C.; Mokry, C.; Runke, J.; Düllmann, C.E.; Wobrauschek, P.; et al. Measurement of the 229Th Isomer Energy with a Magnetic Microcalorimeter. Phys. Rev. Lett. 2020, 125, 142503. [Google Scholar] [CrossRef]
  7. Kraemer, S.; Moens, J.; Athanasakis-Kaklamanakis, M.; Bara, S.; Beeks, K.; Chhetri, P.; Chrysalidis, K.; Claessens, A.; Cocolios, T.E.; Correia, J.G.M.; et al. Observation of the radiative decay of the 229Th nuclear clock isomer. Nature 2023, 617, 706–710. [Google Scholar] [CrossRef] [PubMed]
  8. von der Wense, L.; Seiferle, B.; Laatiaoui, M.; Neumayr, J.B.; Maier, H.; Wirth, H.; Mokry, C.; Runke, J.; Eberhardt, K.; Düllmann, C.E.; et al. Direct detection of the 229Th nuclear clock transition. Nature 2016, 533, 47–51. [Google Scholar] [CrossRef] [Green Version]
  9. Peik, E.; Tamm, C. Nuclear laser spectroscopy of the 3.5 eV transition in Th-229. Europhys. Lett. (EPL) 2003, 61, 181–186. [Google Scholar] [CrossRef] [Green Version]
  10. Campbell, C.J.; Radnaev, A.G.; Kuzmich, A.; Dzuba, V.A.; Flambaum, V.V.; Derevianko, A. Single-Ion Nuclear Clock for Metrology at the 19th Decimal Place. Phys. Rev. Lett. 2012, 108, 120802. [Google Scholar] [CrossRef] [Green Version]
  11. Beloy, K. Trap-Induced ac Zeeman Shift of the Thorium-229 Nuclear Clock Frequency. Phys. Rev. Lett. 2023, 130, 103201. [Google Scholar] [CrossRef] [PubMed]
  12. Brewer, S.M.; Chen, J.S.; Hankin, A.M.; Clements, E.R.; Chou, C.W.; Wineland, D.J.; Hume, D.B.; Leibrandt, D.R. 27Al+ Quantum-Logic Clock with a Systematic Uncertainty below 10−18. Phys. Rev. Lett. 2019, 123, 033201. [Google Scholar] [CrossRef] [PubMed] [Green Version]
  13. Thirolf, P.G.; Seiferle, B.; von der Wense, L. The 229-thorium isomer: Doorway to the road from the atomic clock to the nuclear clock. J. Phys. B At. Mol. Opt. Phys. 2019, 52, 203001. [Google Scholar] [CrossRef]
  14. Thirolf, P.G.; Seiferle, B.; von der Wense, L. Improving Our Knowledge on the 229mThorium Isomer: Toward a Test Bench for Time Variations of Fundamental Constants. Ann. Phys. 2019, 531, 1800381. [Google Scholar] [CrossRef] [Green Version]
  15. Peik, E.; Schumm, T.; Safronova, M.S.; Pálffy, A.; Weitenberg, J.; Thirolf, P.G. Nuclear clocks for testing fundamental physics. Quantum Sci. Technol. 2021, 6, 034002. [Google Scholar] [CrossRef]
  16. Beeks, K.; Sikorsky, T.; Schumm, T.; Thielking, J.; Okhapkin, M.V.; Peik, E. The thorium-229 low-energy isomer and the nuclear clock. Nat. Rev. Phys. 2021, 3, 238–248. [Google Scholar] [CrossRef]
  17. Seiferle, B.; von der Wense, L.; Thirolf, P.G. Lifetime Measurement of the 229Th Nuclear Isomer. Phys. Rev. Lett. 2017, 118, 042501. [Google Scholar] [CrossRef] [Green Version]
  18. Thielking, J.; Okhapkin, M.V.; Głowacki, P.; Meier, D.M.; von der Wense, L.; Seiferle, B.; Düllmann, C.E.; Thirolf, P.G.; Peik, E. Laser spectroscopic characterization of the nuclear-clock isomer 229mTh. Nature 2018, 556, 321–325. [Google Scholar] [CrossRef] [Green Version]
  19. Dykhne, A.M.; Tkalya, E.V. Matrix element of the anomalously low-energy (3.5 ± 0.5 eV) transition in 229Th and the isomer lifetime. J. Exp. Theor. Phys. Lett. 1998, 67, 251–256. [Google Scholar] [CrossRef]
  20. Ruchowska, E.; Płóciennik, W.A.; Żylicz, J.; Mach, H.; Kvasil, J.; Algora, A.; Amzal, N.; Bäck, T.; Borge, M.G.; Boutami, R.; et al. Nuclear structure of 229Th. Phys. Rev. C 2006, 73, 044326. [Google Scholar] [CrossRef] [Green Version]
  21. Tkalya, E.V.; Schneider, C.; Jeet, J.; Hudson, E.R. Radiative lifetime and energy of the low-energy isomeric level in 229Th. Phys. Rev. C 2015, 92, 054324. [Google Scholar] [CrossRef] [Green Version]
  22. Shigekawa, Y.; Yamaguchi, A.; Suzuki, K.; Haba, H.; Hiraki, T.; Kikunaga, H.; Masuda, T.; Nishimura, S.; Sasao, N.; Yoshimi, A.; et al. Estimation of radiative half-life of 229mTh by half-life measurement of other nuclear excited states in 229Th. Phys. Rev. C 2021, 104, 024306. [Google Scholar] [CrossRef]
  23. Seiferle, B.; Moritz, D.; Scharl, K.; Ding, S.; Zacherl, F.; Löbell, L.; Thirolf, P.G. Extending Our Knowledge about the 229Th Nuclear Isomer. Atoms 2022, 10, 24. [Google Scholar] [CrossRef]
  24. Schwarz, M.; Versolato, O.O.; Windberger, A.; Brunner, F.R.; Ballance, T.; Eberle, S.N.; Ullrich, J.; Schmidt, P.O.; Hansen, A.K.; Gingell, A.D.; et al. Cryogenic linear Paul trap for cold highly charged ion experiments. Rev. Sci. Instrum. 2012, 83, 083115. [Google Scholar] [CrossRef]
  25. Schmöger, L.; Versolato, O.O.; Schwarz, M.; Kohnen, M.; Windberger, A.; Piest, B.; Feuchtenbeiner, S.; Pedregosa-Gutierrez, J.; Leopold, T.; Micke, P.; et al. Coulomb crystallization of highly charged ions. Science 2015, 347, 1233–1236. [Google Scholar] [CrossRef]
  26. Micke, P.; Stark, J.; King, S.A.; Leopold, T.; Pfeifer, T.; Schmöger, L.; Schwarz, M.; Spieß, L.J.; Schmidt, P.O.; Crespo López-Urrutia, J.R. Closed-cycle, low-vibration 4 K cryostat for ion traps and other applications. Rev. Sci. Instrum. 2019, 90, 065104. [Google Scholar] [CrossRef] [PubMed] [Green Version]
  27. Moritz, D.; Scharl, K.; Seiferle, B.; von der Wense, L.; Zacherl, F.; Löbell, L.; Ding, S.; Thirolf, P.G. A cryogenic Paul trap setup for the determination of the ionic radiative lifetime of the 229Th3+. 2023; in preparation. [Google Scholar]
  28. Campbell, C.J. Trapping, Laser Cooling, and Spectroscopy of Thorium IV. Ph.D. Thesis, Georgia Institute of Technology, Shenzhen, China, 2011. [Google Scholar]
  29. Leopold, T.; King, S.A.; Micke, P.; Bautista-Salvador, A.; Heip, J.C.; Ospelkaus, C.; Crespo López-Urrutia, J.R.; Schmidt, P.O. A cryogenic radio-frequency ion trap for quantum logic spectroscopy of highly charged ions. Rev. Sci. Instrum. 2019, 90, 073201. [Google Scholar] [CrossRef] [Green Version]
  30. Campbell, C.J.; Radnaev, A.G.; Kuzmich, A. Wigner Crystals of 229Th for Optical Excitation of the Nuclear Isomer. Phys. Rev. Lett. 2011, 106, 223001. [Google Scholar] [CrossRef] [PubMed] [Green Version]
  31. Groot-Berning, K.; Stopp, F.; Jacob, G.; Budker, D.; Haas, R.; Renisch, D.; Runke, J.; Thörle-Pospiech, P.; Düllmann, C.E.; Schmidt-Kaler, F. Trapping and sympathetic cooling of single thorium ions for spectroscopy. Phys. Rev. A 2019, 99, 023420. [Google Scholar] [CrossRef] [Green Version]
  32. Stopp, F.; Groot-Berning, K.; Jacob, G.; Budker, D.; Haas, R.; Renisch, D.; Runke, J.; Thörle-Pospiech, P.; Düllmann, C.E.; Schmidt-Kaler, F. Catching, trapping and in-situ-identification of thorium ions inside Coulomb crystals of 40Ca+ ions. Hyperfine Interact. 2019, 240, 073201. [Google Scholar] [CrossRef] [Green Version]
  33. Leibrandt, D.R.; Clark, R.J.; Labaziewicz, J.; Antohi, P.; Bakr, W.; Brown, K.R.; Chuang, I.L. Laser ablation loading of a surface-electrode ion trap. Phys. Rev. A 2007, 76, 055403. [Google Scholar] [CrossRef] [Green Version]
  34. Antohi, P.B.; Schuster, D.; Akselrod, G.M.; Labaziewicz, J.; Ge, Y.; Lin, Z.; Bakr, W.S.; Chuang, I.L. Cryogenic ion trapping systems with surface-electrode traps. Rev. Sci. Instrum. 2009, 80, 013103. [Google Scholar] [CrossRef] [Green Version]
  35. Lao, G.; Zhu, G.Z.; Dickerson, C.E.; Augenbraun, B.L.; Alexandrova, A.N.; Caram, J.R.; Hudson, E.R.; Campbell, W.C. Laser Spectroscopy of Aromatic Molecules with Optical Cycling Centers: Strontium(I) Phenoxides. J. Phys. Chem. Lett. 2022, 13, 11029–11035. [Google Scholar] [CrossRef] [PubMed]
  36. Dubielzig, T.; Halama, S.; Hahn, H.; Zarantonello, G.; Niemann, M.; Bautista-Salvador, A.; Ospelkaus, C. Ultra-low-vibration closed-cycle cryogenic surface-electrode ion trap apparatus. Rev. Sci. Instrum. 2021, 92, 043201. [Google Scholar] [CrossRef] [PubMed]
  37. Spivey, R.; Inlek, I.; Jia, Z.; Crain, S.; Sun, K.; Kim, J.; Vrijsen, G.; Fang, C.; Fitzgerald, C.; Kross, S.; et al. High-Stability Cryogenic System for Quantum Computing With Compact Packaged Ion Traps. IEEE Trans. Quantum Eng. 2022, 3, 1–11. [Google Scholar] [CrossRef]
  38. Turchette, Q.A.; Kielpinski.; King, B.E.; Leibfried, D.; Meekhof, D.M.; Myatt, C.J.; Rowe, M.A.; Sackett, C.A.; Wood, C.S.; Itano, W.M.; et al. Heating of trapped ions from the quantum ground state. Phys. Rev. A 2000, 61, 063418. [Google Scholar] [CrossRef] [Green Version]
  39. DeVoe, R.G.; Kurtsiefer, C. Experimental study of anomalous heating and trap instabilities in a microscopic 137Ba ion trap. Phys. Rev. A 2002, 65, 063407. [Google Scholar] [CrossRef]
  40. Daniilidis, N.; Narayanan, S.; Möller, S.A.; Clark, R.; Lee, T.E.; Leek, P.J.; Wallraff, A.; Schulz, S.; Schmidt-Kaler, F.; Häffner, H. Fabrication and heating rate study of microscopic surface electrode ion traps. New J. Phys. 2011, 13, 013032. [Google Scholar] [CrossRef]
  41. Härter, A.; Krükow, A.; Brunner, A.; Hecker Denschlag, J. Long-term drifts of stray electric fields in a Paul trap. Appl. Phys. B 2014, 114, 275–281. [Google Scholar] [CrossRef] [Green Version]
  42. Gallagher, A. Oscillator Strengths of Ca II, Sr II, and Ba II. Phys. Rev. 1967, 157, 24–30. [Google Scholar] [CrossRef]
  43. Madej, A.A.; Marmet, L.; Bernard, J.E. Rb atomic absorption line reference for single Sr+ laser cooling systems. Appl. Phys. B 1998, 67, 229–234. [Google Scholar] [CrossRef]
  44. Sinclair, A.G.; Wilson, M.A.; Gill, P. Improved three-dimensional control of a single strontium ion in an endcap trap. Opt. Commun. 2001, 190, 193–203. [Google Scholar] [CrossRef]
  45. Berkeland, D.J. Linear Paul trap for strontium ions. Rev. Sci. Instrum. 2002, 73, 2856–2860. [Google Scholar] [CrossRef]
  46. Brownnutt, M. 88Sr+ ion trapping techniques and technologies for quantum information processing. Ph.D. Thesis, Imperial College London, London, UK, 2007. [Google Scholar]
  47. Removille, S.; Dubessy, R.; Dubost, B.; Glorieux, Q.; Coudreau, T.; Guibal, S.; Likforman, J.P.; Guidoni, L. Trapping and cooling of Sr+ions: Strings and large clouds. J. Phys. B At. Mol. Opt. Phys. 2009, 42, 154014. [Google Scholar] [CrossRef] [Green Version]
  48. Dubost, B.; Dubessy, R.; Szymanski, B.; Guibal, S.; Likforman, J.P.; Guidoni, L. Isotope shifts of natural Sr+ measured by laser fluorescence in a sympathetically cooled Coulomb crystal. Phys. Rev. A 2014, 89, 032504. [Google Scholar] [CrossRef] [Green Version]
  49. Jung, K.; Yamamoto, K.; Yamamoto, Y.; Miyabe, M.; Wakaida, I.; Hasegawa, S. All-diode-laser cooling of Sr+ isotope ions for analytical applications. Jpn. J. Appl. Phys. 2017, 56, 062401. [Google Scholar] [CrossRef]
  50. Shiner, A.D.; Madej, A.A.; Dubé, P.; Bernard, J.E. Absolute optical frequency measurement of saturated absorption lines in Rb near 422 nm. Appl. Phys. B 2007, 89, 595–601. [Google Scholar] [CrossRef]
  51. Zhang, Z.; Ma, J.; Zhang, L.; Liu, Y.; Wei, G. Rubidium Isotope Ratios of International Geological Reference Materials. Geostand. Geoanal. Res. 2023, 1–16. [Google Scholar] [CrossRef]
  52. Pyka, K.; Herschbach, N.; Keller, J.; Mehlstäubler, T.E. A high-precision segmented Paul trap with minimized micromotion for an optical multiple-ion clock. Appl. Phys. B 2014, 114, 231–241. [Google Scholar] [CrossRef] [Green Version]
  53. Saleh, K.; Millo, J.; Didier, A.; Kersalé, Y.; Lacroûte, C. Frequency stability of a wavelength meter and applications to laser frequency stabilization. Appl. Opt. 2015, 54, 9446–9449. [Google Scholar] [CrossRef] [PubMed] [Green Version]
  54. Ghadimi, M.; Bridge, E.M.; Scarabel, J.; Connell, S.; Shimizu, K.; Streed, E.; Lobino, M. Multichannel optomechanical switch and locking system for wavemeters. Appl. Opt. 2020, 59, 5136–5141. [Google Scholar] [CrossRef]
  55. Wieman, C.E.; Hollberg, L. Using diode lasers for atomic physics. Rev. Sci. Instrum. 1991, 62, 1–20. [Google Scholar] [CrossRef] [Green Version]
  56. Ricci, L.; Weidemüller, M.; Esslinger, T.; Hemmerich, A.; Zimmermann, C.; Vuletic, V.; König, W.; Hänsch, T. A compact grating-stabilized diode laser system for atomic physics. Opt. Commun. 1995, 117, 541–549. [Google Scholar] [CrossRef] [Green Version]
  57. Deb, A.B.; Rakonjac, A.; Kjærgaard, N. Versatile laser system for experiments with cold atomic gases. J. Opt. Soc. Am. B 2012, 29, 3109–3113. [Google Scholar] [CrossRef] [Green Version]
  58. Bonnin, A.; Zahzam, N.; Bidel, Y.; Bresson, A. Simultaneous dual-species matter-wave accelerometer. Phys. Rev. A 2013, 88, 043615. [Google Scholar] [CrossRef] [Green Version]
  59. Valenzuela, V.M.; Hamzeloui, S.; Gutiérrez, M.; Gomez, E. Multiple isotope magneto-optical trap from a single diode laser. J. Opt. Soc. Am. B 2013, 30, 1205–1210. [Google Scholar] [CrossRef] [Green Version]
  60. Uchiyama, A.; Harada, K.; Sakamoto, K.; Dammalapati, U.; Inoue, T.; Itoh, M.; Ito, S.; Kawamura, H.; Tanaka, K.S.; Yoshioka, R.; et al. Effective multiple sideband generation using an electro-optic modulator for a multiple isotope magneto-optical trap. Rev. Sci. Instrum. 2018, 89, 123111. [Google Scholar] [CrossRef] [Green Version]
Figure 1. Level schemes of 229Th3+ on the left and 229mTh3+ in the first isomeric excited state on the right. Clearly visible are the differences in the hyperfine structure transitions depending on the nuclear state.
Atoms 11 00108 g001
Figure 2. Level scheme of 88Sr+ used for Doppler cooling with one main cooling cycle at 422 nm and a repumping cycle at 1092 nm.
Atoms 11 00108 g002
Figure 3. Schematic overview of the cryogenic Paul trap setup dedicated to 229mTh3+ radiative lifetime measurement. Visible is a horizontal cross-sectional cut of the trap vacuum chamber along the ion axis with a not-to-scale but logical arrangement of the different laser setup sections.
Atoms 11 00108 g003
Figure 4. Mass scan obtained with QMS 2 of the ablated ion species from an SrTiO3 crystalline target. The ablation laser was run with a pulse energy of about 2.5 mJ at a 5 Hz repetition rate. Visible are mass peaks at A = 47 (47Ti), A = 88 (88Sr), and A = 63 (TiO).
Atoms 11 00108 g004
Figure 5. The 422 nm laser setup assembled in a rack drawer is depicted in a photograph (a) and for better visualization also as a schematic (b). The following abbreviations are used: M = mirror; OI = optical isolator; P = polarizer; λ/2 = half-wave plate; λ/4 = quarter-wave plate, ND = neutral density filter; PBS = polarizing beamsplitter; RbC = rubidium gas cell; FC = fiber coupler; PD = photodiode.
Atoms 11 00108 g005
Figure 6. Piezo scan of the 422 nm laser frequency over the hyperfine structure resonances in 85 + 87Rb with two zoom-in steps on the chosen reference transition in 85Rb (red). The generated error signal for the top-of-fringe locking technique is visible in orange. Note that different data were taken for the different plots, which results in a change in the piezo voltage axis.
Atoms 11 00108 g006
Figure 7. A detailed visualization of the AOM setup with a photograph of the respective rack drawer (a), a schematic top view (back-reflected second pass through the AOM partially not visible below the incident beam) (b), and a lateral view for a better understanding of the spatial separation of first and second passes (c). In the lateral schematic, the 0th and the +1st diffraction orders cannot be resolved. The following abbreviations were used: M = mirror; D-M = D-shaped mirror; L = lens; A = adjustable iris; FC = fiber coupler; Pr = prism; λ/2 = half-wave plate.
Atoms 11 00108 g007
Table 1. Calculated EOM drive frequencies to target either the nuclear ground state of 229Th3+ or its first isomeric excited state. These contemplations are based on simulated hyperfine structure spectra derived from the experimental findings and their uncertainties in [18,28]. Numbers in round brackets denote the required EOM sideband order to drive the respective transition. The reference frequencies (fref) are considered without any uncertainties. However, the considerable uncertainties of the modulation frequencies for isomeric HFS stem from the non-negligible error of the isomer shift based on experimental results.
fref434.5 THz (690 nm)304.4 THz (985 nm)
Adress...229Th3+229mTh3+229Th3+229mTh3+
fcenter =fref 14.2 ± 7.6 MHzfref + 4.2 ± 82.6 MHzfref 268.5 ± 8.0 MHzfref + 171.3 ± 81.7 MHz
Driven HFS transitions F = 3 → F′ = 2 (0)
fmod1 = 472.1 ± 4.4 MHz 193.0 ± 55.4 MHz 49.0 ± 0.9 MHz 558.3 ± 79.1 MHz
Driven HFS transitionsF = 0 → F′ = 1 (1)F = 2 → F′ = 2 (−1)F = 3 → F′ = 3 (−2)F = 5 → F′ = 4 (1)
F = 1 → F′ = 1 (2)F = 3 → F′ = 3 (1)F = 4 → F′ = 4 (3)
F = 5 → F′ = 5 (−1) F = 5 → F′ = 4 (−2)
F = 6 → F′ = 5 (−1)
fmod2 = 20.1 ± 2.8 MHz 245.7 ± 124.4 MHz 627.5 ± 4.1 MHz 17.8 ± 70.6 MHz
Driven HFS transitionsF = 3 → F′ = 4 (−3)F = 4 → F′ = 3 (−1)F = 1 → F′ = 0 (2)F = 2 → F′ = 1 (1)
F = 4 → F′ = 3 (−2) F = 2 → F′ = 1 (2)F = 4 → F′ = 3 (−1)
fmod3 = 418.6 ± 8.8 MHz 332.3 ± 151.0 MHz
Driven HFS transitionsF = 2 → F′ = 3 (−1)F = 1 → F′ = 1 (−1)
Table 2. Measured beam diameters at a distance of 400 mm from the fiber outcoupler.
Wavelength (nm)Beam Diameter (µm)
422484
1092561
690550
984527
Disclaimer/Publisher’s Note: The statements, opinions and data contained in all publications are solely those of the individual author(s) and contributor(s) and not of MDPI and/or the editor(s). MDPI and/or the editor(s) disclaim responsibility for any injury to people or property resulting from any ideas, methods, instructions or products referred to in the content.

