1. Introduction
The Io satellite plasma torus in Jupiter is a ring-shaped cloud of plasma in which Cl III ions were discovered by the Far Ultraviolet Spectroscopic Explorer (FUSE) [
1,
2] and also by the Galileo probe [
3]. In addition, the CORONAS-F spacecraft has detected high-charge states of chlorine in coronal solar flares [
4]. The apparently large abundance of chlorine in the interstellar medium is an unresolved question in astrophysics [
5] prompting the need for more investigations into the fundamental properties of this element. In general, measurements of photoionization spectra of ions of chlorine [
6] have helped in benchmarking theoretical efforts such as those of the OPACITY [
7,
8,
9], IRON [
10], and NORAD [
11] projects that have for several decades focused on understanding the interaction of photons with ions.
Photoionization and spectroscopic data on chlorine ions remain rare. Experimental efforts have provided lifetimes and oscillator strengths for specific transitions observed by FUSE [
12] for Cl II ions. A multi-configuration Hartree–Fock approach [
13] showed a strong correlation between Rydberg series and perturbed states for the case of singly-ionized chlorine. An experimental effort investigating the photoionization of Cl II from threshold to 28 eV offered Rydberg series resonance energies and cross sections [
6]. This investigation was followed by large-scale Dirac Coulomb R-matrix calculations [
7,
14], rendering an identification for the observed spectrum.
In the present study, we present a measurement of the relative ion yield resulting from the single-photon photoionization of Cl III. The data consists of the effective current of the Cl IV ions as a function of the photon beam energy. Photoionization can proceed via a direct process as in the following,
where
represents the photon (giving the background cross section), or through an intermediate autoionizing state at an energy belonging to a Rydberg series state,
which introduces a resonance in the cross section. The introduction of an intermediate state for resonances can be studied naturally by the close-coupling (CC) approximation and the R-matrix method. This report presents resonant features in the measured photoionization cross section of Cl III, studied theoretically using the relativistic Breit–Pauli R-matrix (BPRM) method; the experimental and theoretical results are each benchmarked against the other. Cl III is isoelectronic to phosphorous. For this reason, the photoionization study of atomic phosphorus by Berkowitz and collaborators [
15] is relevant to the present work. We point out that the spectroscopy of elements isoelectronic to phosphorus is also relevant in astrobiology. Because phosphorus is one of the basic elements of life, its spectroscopic features are used to label phosphorus-containing exoplanetary atmospheres as possible life sustaining regions (e.g., Ref. [
16]).
2. Theoretical Study with Breit–Pauli R-Matrix Method
The theoretical study was carried out using the relativistic Breit–Pauli R-matrix (BPRM) method with a large close-coupling (CC) wavefunction expansion that includes 45 levels of the core ion Cl IV. It is the core ion excitation that enables autoionizing resonances in photoionization cross sections. A brief outline of the method is given below.
In the CC approximation, the atomic system has (N+1) electrons and the core (or ‘target’) ion is an N-electron system interacting with the (N+1)th electron. The (N+1)th electron is bound or in the continuum depending on whether its energy E is negative or positive, respectively. The total wave function
, of
symmetry, is expressed by an expansion of the form (e.g., Ref. [
17])
where the core ion eigenfunction
represents the ground and various excited states. The sum is over the number of states considered. The core is coupled with the (N+1)
th electron function
. The (N+1)
th electron (of kinetic energy
) is in a channel labeled as
.
A is the anti-symmetrization operator. In the second sum, the
are bound-channel functions of the (N+1)-electron system that provides the orthogonality between the continuum and the bound electron orbitals, and accounts for short-range correlations.
Substitution of
in the Schrödinger equation
introduces a set of coupled equations that are solved using the R-matrix approach. This approach divides the space into an inner space of radius
that includes all short-range interactions, and an outer space up to infinity where the wavefunction is treated as Coulombic (e.g., Refs. [
8,
17,
18,
19,
20]). The relativistic effects are included through Breit–Pauli approximation (e.g., Ref. [
17]), in which the Hamiltonian is given by
in Rydberg units. The relativistic correction terms are corrected by a mass term,
, the Darwin term,
, and a spin-orbit interaction term,
. The R-matrix Breit–Pauli (BPRM) approximation also includes parts of several two-body interaction terms, such as those without the momentum operators [
17].
The solution of the BRPM approximation is a continuum wave function for an electron with positive energies (E > 0), or a bound state at a negative total energy (E ≤ 0). The complex resonant structures in the photoionization spectra are produced from channel couplings between continuum channels that are open ( 0), and ones that are closed ( 0), at electron energies corresponding to autoionizing states of the Rydberg series . is the effective quantum number of the series converging to excited core thresholds.
The photoionization cross section (
) is given by (e.g., Ref. [
17])
where
is the statistical weight of the bound state,
is the incident photon energy, and
is the generalized line strength
Here
and
are the initial and final state wave functions, respectively, and
is the dipole operator in the length form.
3. Computation of Photoionization Cross Sections
BPRM computations were carried out through the package of R-matrix codes [
20,
21,
22], which consists of several stages. The computation starts with the wave-function expansion of the core ion as the initial input. For this wave function, an atomic structure calculation was carried out using the code SUPERSTRUCTURE (SS) [
23,
24]. SS uses a Thomas–Fermi–Dirac–Amaldi potential and includes relativistic contributions in a Breit–Pauli approximation in which a full Breit interaction and parts of two-body correction terms are included. A set of 13 configurations of the core ion Cl IV was optimized to obtain the wave-function expansion for Cl III. The configurations, which include orbitals up to the
, are
,
,
,
,
,
,
,
,
,
,
,
, and
.
Table 1 presents 45 (the ground and 44 excited) fine-structure levels of Cl IV included in the wave-function expansion of Cl III. The calculated energies from SS are compared with observed values [
25] (listed in the NIST [
26] compilation). A comparison shows the agreement between SS and the observed values to within a few percent to a larger number, and some, e.g.,
, are over 10%. SS is not adjusted for any observed values. The optimization for energies and wavefunctions is carried out through the number of configurations and by varying the orbital wavefunctions with Thomas–Fermi scaling parameters. SS computes the radial wavefunction of all orbitals which remain the same while the energies change with the angular momenta of the states. The present set of energies is the resultant of efforts to reach an overall agreement between the calculated and measured values instead of focusing to improve any small set of energies, and the optimized set of configurations is selected for manageable computation by the R-matrix codes, which will retain all important physical characteristics of the atomic process. The accuracy of results provided by the R-matrix method is much improved over those of core ion energies since the method can handle a much larger set of configurations, e.g., 47 configurations of the core ion and interacting electron were used to compute the photoionization cross sections of Cl III. Hence, the effect of uncertainties in the core ion wavefunctions were reduced considerably by the R-matrix computations and resulted in a good agreement between the calculated and experimental
.
Photoionization cross sections were obtained with the inclusion of the radiation damping effects [
22]. For precise positions of the resonances, the calculated core ion excitation energies were replaced by the available observed energies and the cross sections were shifted to match the measured ionization energies of the levels. These cross sections were compared directly with the measured cross sections for identification of the resonances of various levels to which they may belong. The cross sections were also convolved with a Gaussian profile of width of 10 meV using the program GUSAVPX [
27] for comparison with the observed spectral features in the experiment. However, the width was varied in a few instances to avoid significant dissolution of resonances.
4. Experiment
A photon beam and a Cl III ion beam propagating in opposite directions were merged over a common collinear path. As a consequence of their interaction, ions from the Cl III ion beam are photoionized, yielding Cl IV. The resulting ions were separated from the parent ion beam and counted. Relevant parameters of both beams and their overlap were monitored.
The experiment was implemented in the now decommissioned ion-photon beam end-station at the Advanced Light Source (ALS) at Lawrence Berkeley National Laboratory. This technique was based on the merged-beams technique [
28] and was described in more detail in previous measurements of the photoionization of Ne
[
29] and Se
[
30]. A short description of the experimental technique with some details pertinent to the present study is presented.
The Cl III ion beam was generated with an ECR ion source. This ion source had an insertion oven in which a small sample of FeCl was evaporated and ionized in the chamber by collisions with the ECR electrons. Ions were then extracted from the ion source by a repulsive potential of 6 kV. These ions were mass-to-charge selected by a 90 bending electromagnet. The mass resolution of the electromagnet is sufficient to discern and therefore discard any possible contamination of the Cl III ( = 17.73) ion beam with O ( = 16).
Next, a set of electrostatic lenses focused the ion beam into the center of a voltage-biased cylindrical mesh located in a chamber of the experiment where the ions were merged with photons from the ALS (for the ions to reach this chamber, they were first deflected by a set of 90 spherical electrostatic bending plates). In this chamber, Cl III ions were ionized by the counter-propagating photons. In the following stage, a second electromagnet served to separate the Cl IV ions from the parent Cl III ions. Cl IV ions were counted using electrons emitted from an emission-biased metal plate located in front of a channel electron multiplier plate. A typical Cl III ion beam current was 50 nA.
The photon beam was generated by a 10-cm-period undulator installed in the trajectory of a constant current of 0.5 A in the 1.9 GeV synchrotron storage ring, producing a collimated photon beam of width less than 1 mm and with a divergence less than 0.05. This photon beam was then incident onto a grazing spherical-grating monochromator. The photon energy was scanned by rotating the grating and translating the exit slit of the monochromator while adjusting the undulator gap to maximize the photon beam intensity.
The photon flux was measured with a calibrated silicon photodiode [
30] with a 5% uncertainty. A precision current meter provided a normalization signal to the data acquisition system. The photon beam was mechanically pulsed using a controlled chopper-wheel to separate the Cl IV signal ions produced by photoionization from those produced by collisions with the residual gas in the apparatus.
In this experiment, absolute cross sections were not measured. The reported measured intensity is therefore arbitrary. However, the signal was normalized to the ion beam current and to the photon beam current. The photon beam current was corrected by the number of photons or via the known quantum efficiency of the photon silicon diode detector as a function of the photon energy. Due to the presence of higher-order components in the photon beam [
31], the error in the intensity can be large. However, this experiment is concerned primarily with the energy resonances, so the corrections to the photon beam intensity will not be discussed here.
The photon energy was nominally established by the rotating-grating control system. Further calibration with an ionization gas-cell increased the accuracy of the measured photon energy. This calibration was accomplished by using the ionization energies for He [
32] and Kr [
33] as references in the energy interval from 21.218 eV to 63.355 eV. We estimate that the photon energy error, from this technique, has a maximum value of ±10 meV. This same energy calibration technique was employed for the single-photon photoionization spectrum measurement of Cl
[
6], achieving an agreement with the NIST data base [
26] out to three decimal places (in eV).
5. Results
We present the photoionization spectrum of Cl III with resonant features (as defined in the introduction) studied both experimentally and theoretically, and benchmarked with each other. The measured spectrum is the combined spectra of the ground and low-lying excited levels of Cl III that can be present in the primary beam. The theoretical spectra are obtained for each individual low-lying level and are compared with the measured one for identification of features. The results are illustrated and discussed below.
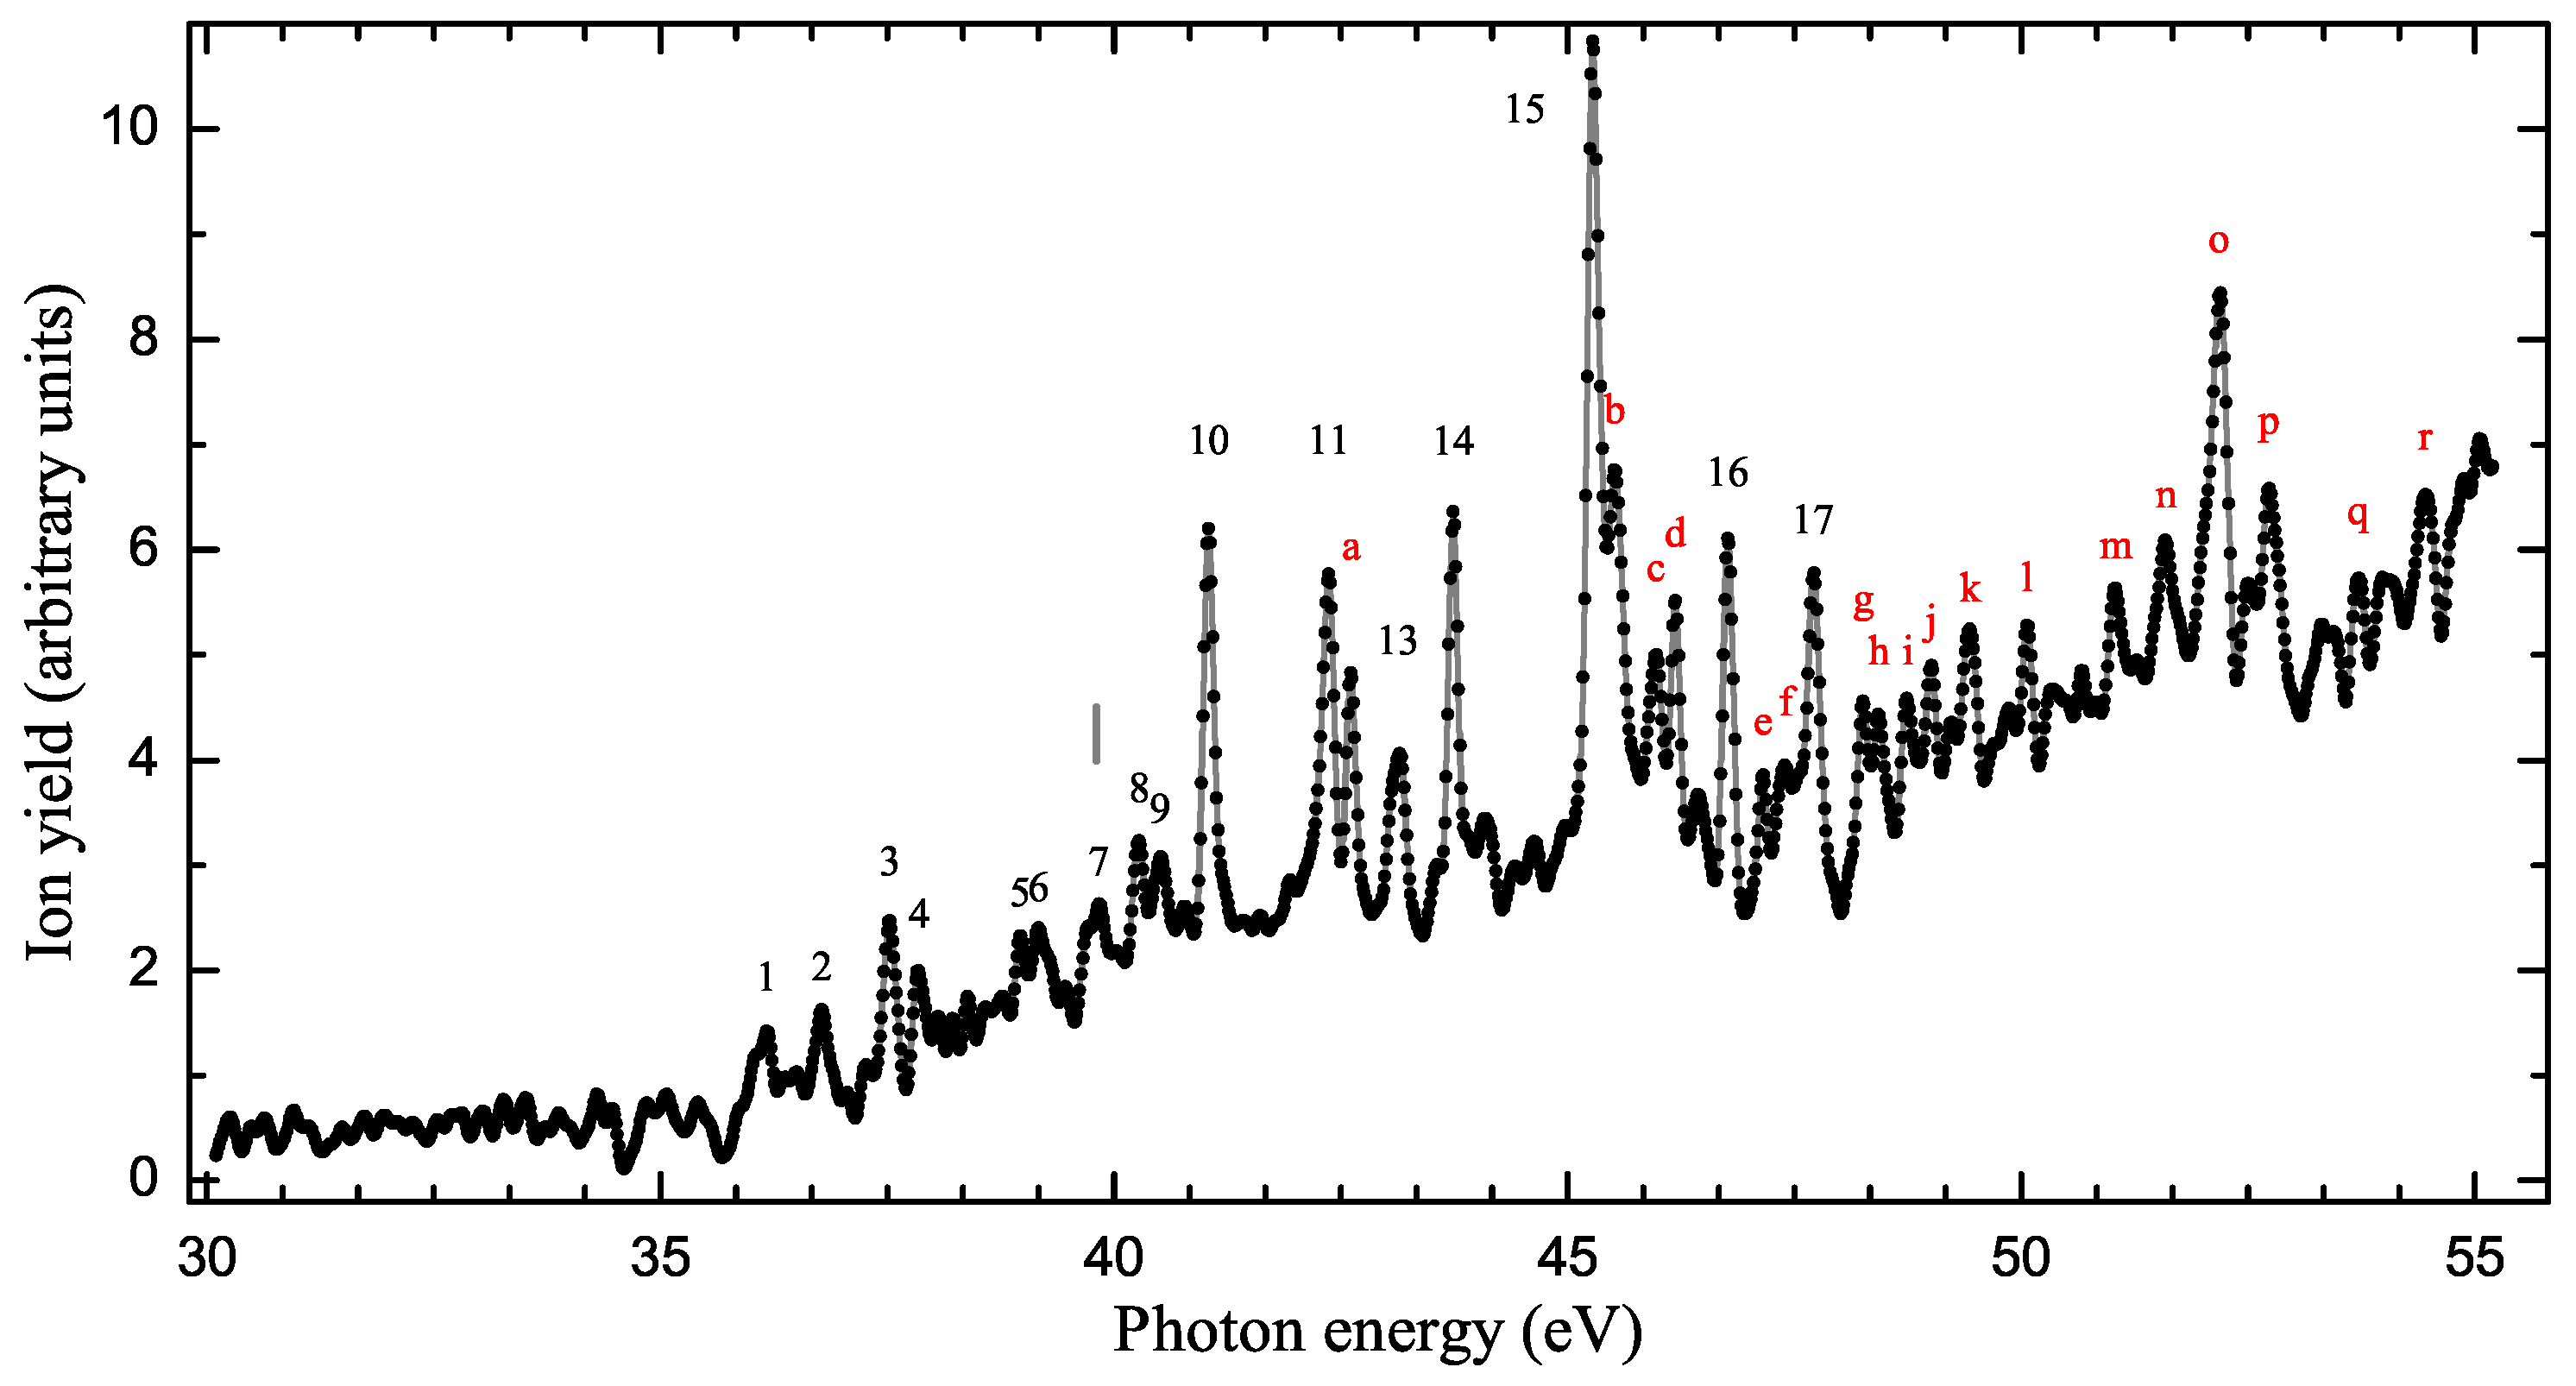
The observed spectrum, shown in
Figure 1, was measured in energy-intervals of 1 eV. Each individual spectrum was overlapped with its neighbors by 0.5 eV. All the individual scans were then merged into a single spectrum after normalization. This method was employed in the early stage of the experiment and was implemented to reduce the effects of possible mechanical backlash from the monochromator positioning mechanism. The process of integrating the pieces of the spectrum was conducted by grouping the individual bins of spectra when variations among them were very small, so that their normalization factors were close to one. Whenever needed, this process of "gluing" also included small energy shifts to overlap observed resonances rather than merely combining the spectra. The overall photon energy error caused by this procedure was estimated to be no greater than ±8 meV. Therefore, considering a ±10 meV additional uncertainty from the gas-cell energy calibration, the total photon energy uncertainty for this experiment is ±13 meV. The resulting measured ion-yield spectrum in
Figure 1 shows several resonant series structures and a slow monotonic rise in the background.
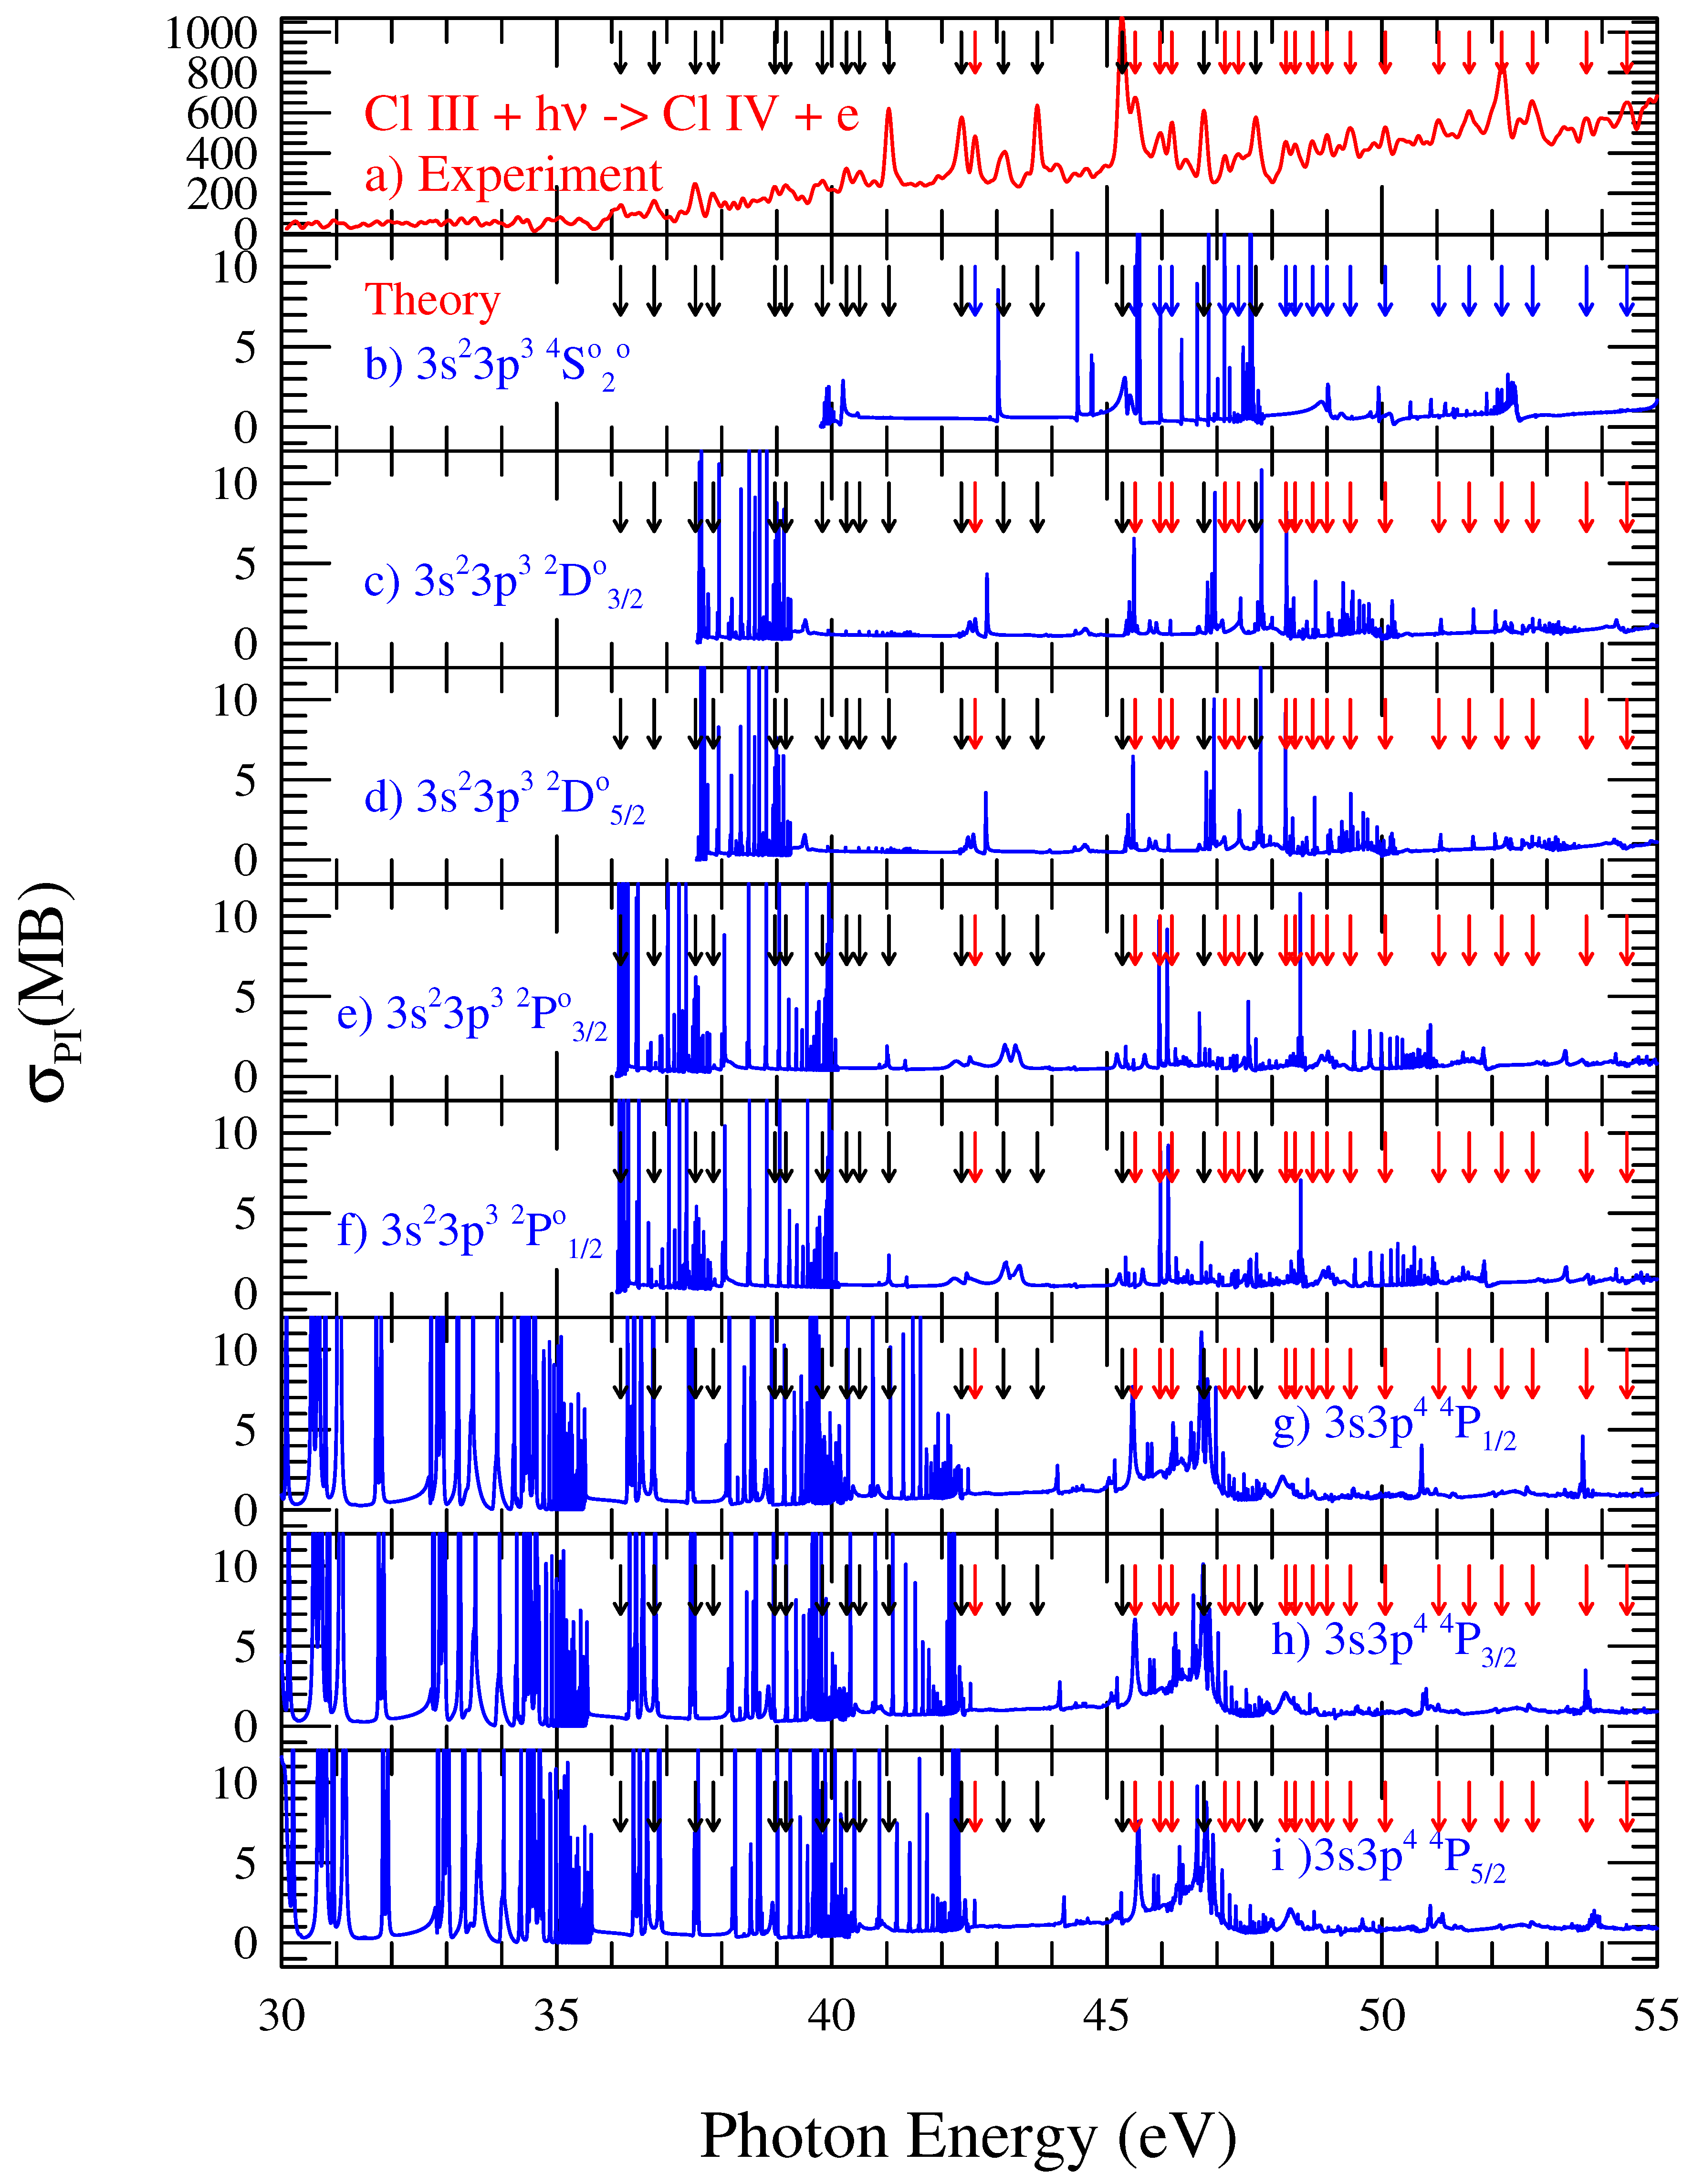
Figure 2 presents the theoretically-calculated
of the eight lowest levels of Cl III in various panels, ground (b)
and excited (c)
, (d)
, (e)
, (f)
, (g)
, (h)
, (i)
while (panel a) presents the measured spectrum. The eight levels were selected because they can generate resonances within the energy range of the experiment. Each panel shows complex resonances formed from the Rydberg series of autoionizing levels belonging to the core ion excitations. The complexity arises from overlapping of the series of resonances. However, in each panel, one can identify the origin of resonances and features of the levels that are seen in the observed spectrum. The arrows in the panels point to identifiable resonances in the observed spectrum, as listed in
Table 2 and
Table 3. It can be seen that there are resonances in the observed spectrum that appear in
of multiple levels. The low energy resonances of the 3 levels of
,
j = 1/2, 3/2, 5/2, are much stronger in the predicated
compared to the peaks in the observed
. This can be explained by the low abundances of these excited levels in the experimental beam in the low energy region.
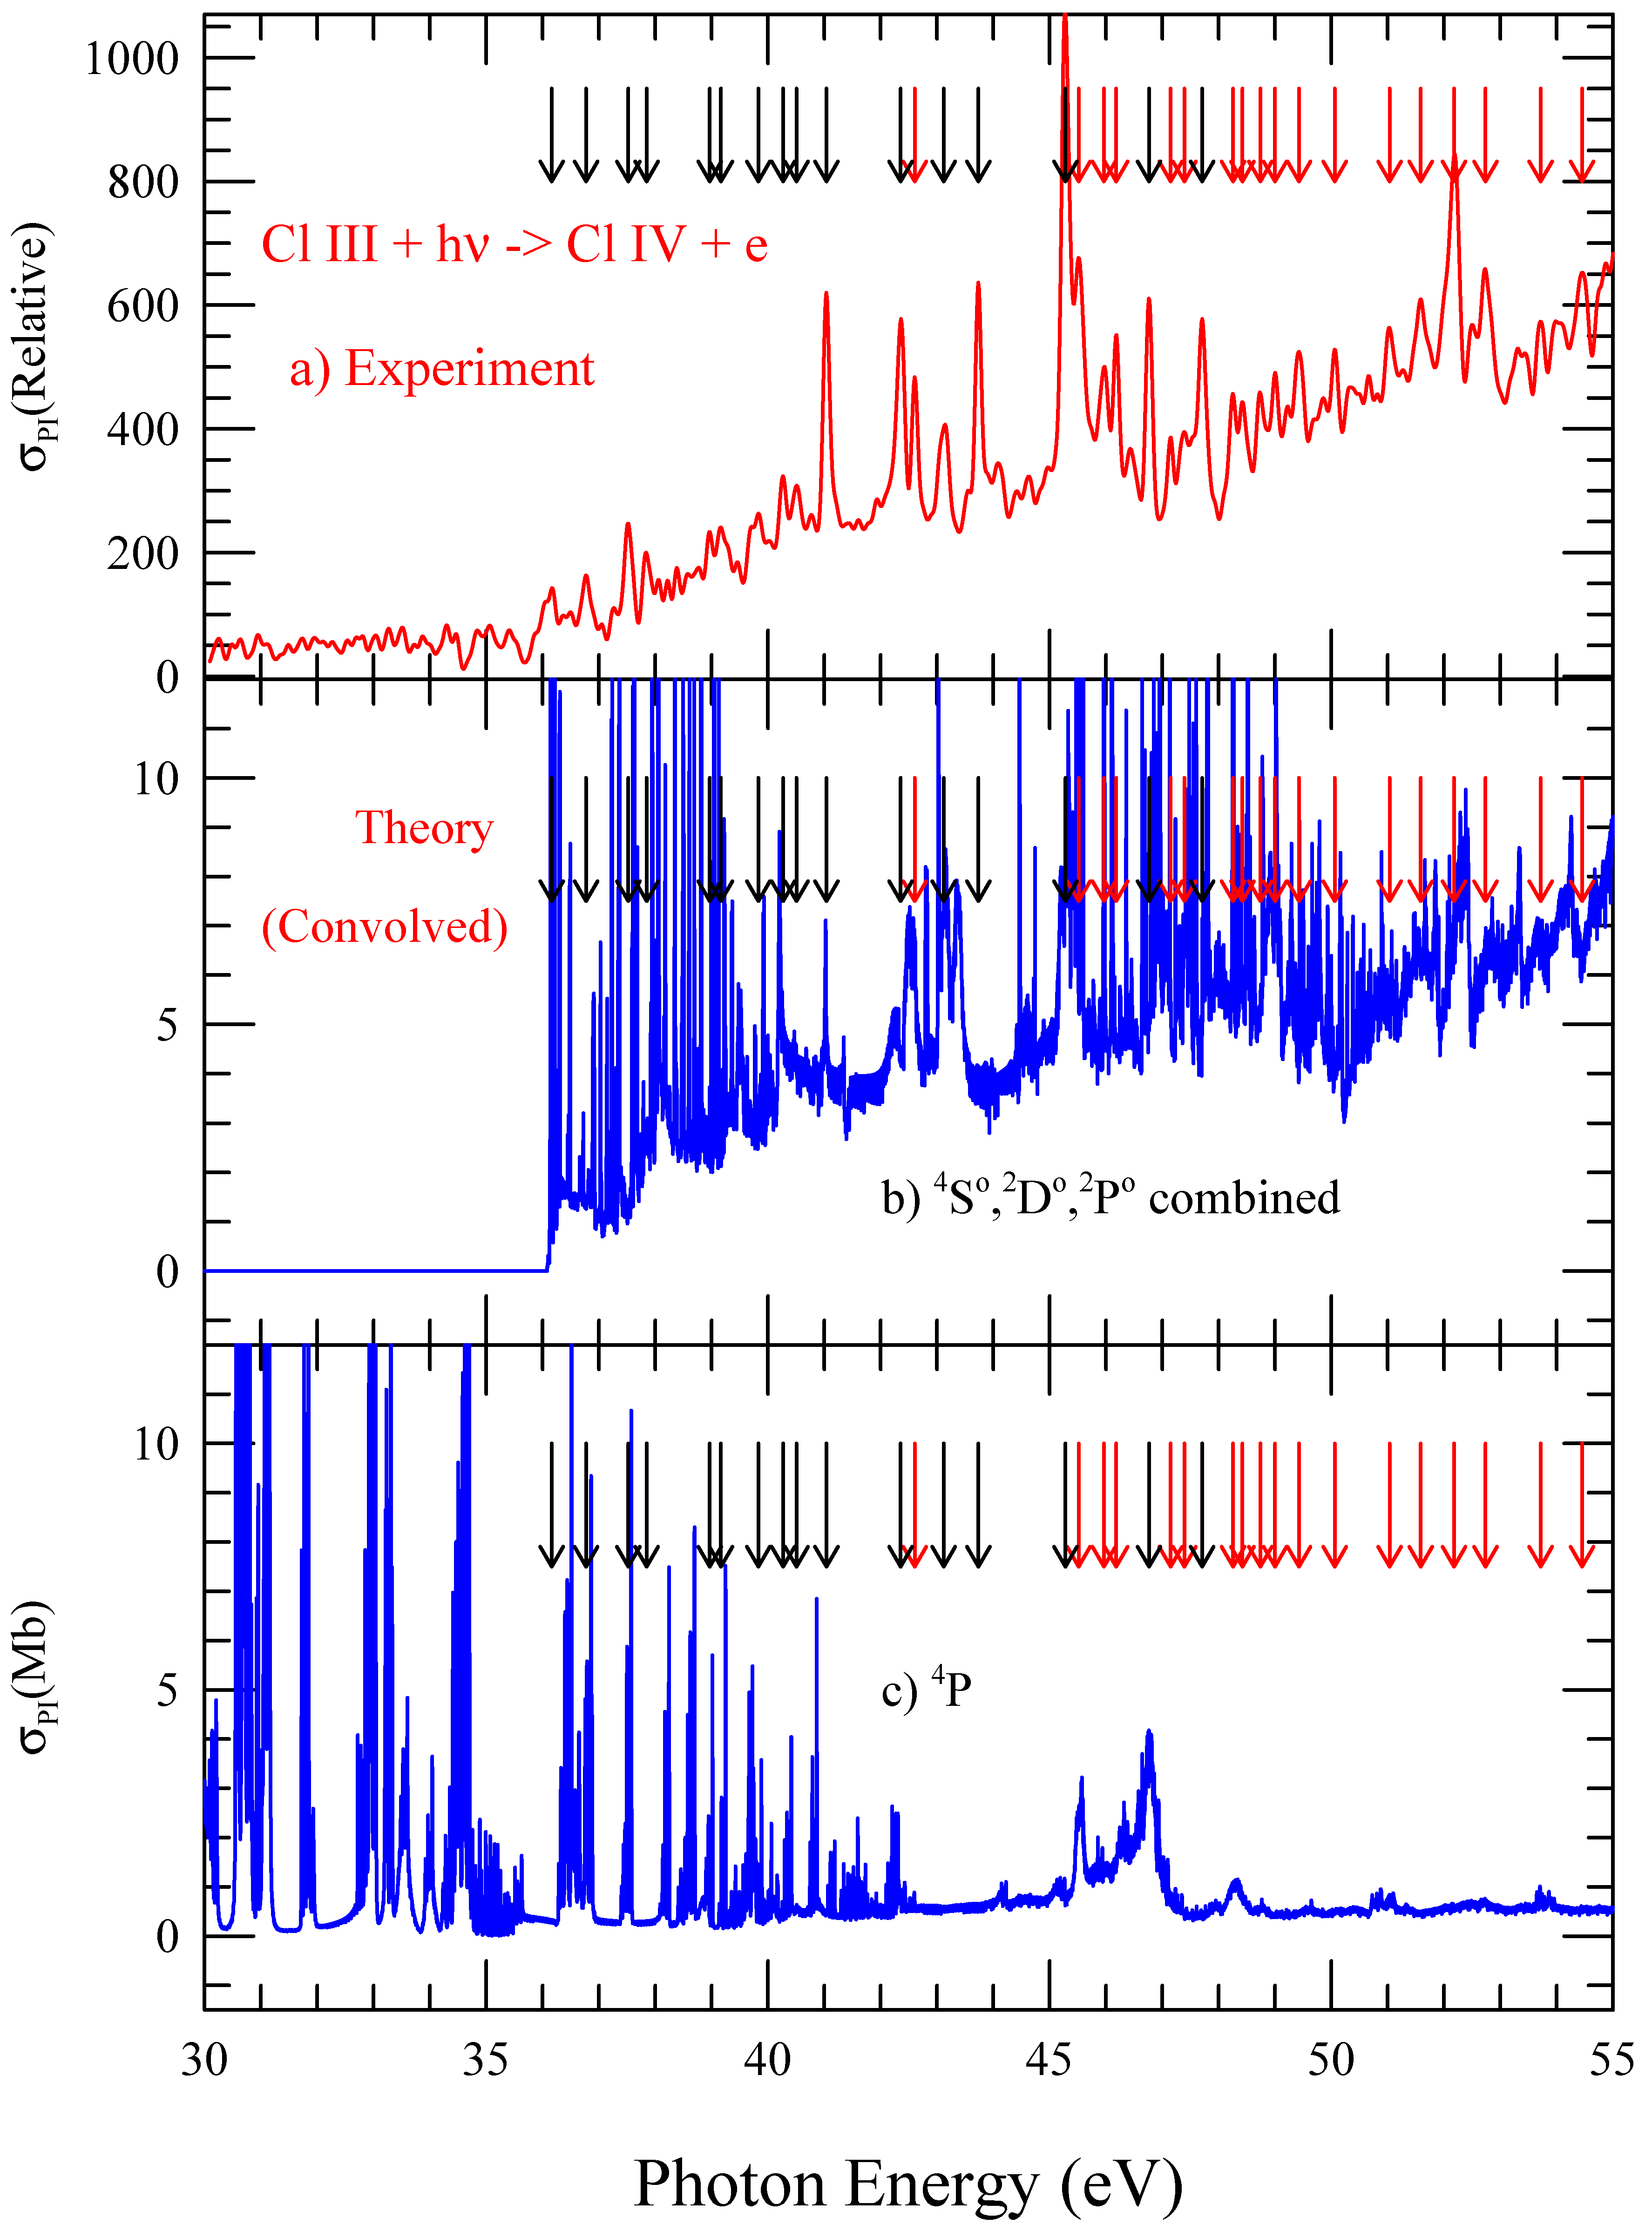
To reproduce the observed features, the calculated single-photon photoionization cross sections of each level were convolved with a Gaussian profile of (experimental beam) width of 10 meV. No percentage contributions were considered since the abundances are not known. For each LS state, the convolved
of its component fine structure levels were added with statistical weight factors and then all the cross sections were summed together. The resultant spectra are presented in
Figure 3. While (panel a) presents the measured cross sections, panel (b) presents the summed features from the convolved
of the five lowest initial levels of states
S
,
D
, and
P
, and (panel c) corresponds to the summed
of the three
P initial levels. The same set of arrows pointing identifiable resonances are also displayed here. The overall agreement for the existences of the resonances between the predicted and observed spectra, except for the heights of the resonances, is illustrated much better in this figure. Almost all observed resonances are accounted for in the predicted cross sections.
The measured cross sections show a monotonic rising background in
Figure 1, which appeared to be an artifact of the measurement technique or of the normalization procedure. This trend can be explained to be real. We used the same normalization procedure which is identical to that used for several other measurements in which this tendency was not observed. Of particular relevance is the case of the photoionization of Cl II [
6,
7] for which the data were measured under the same experimental conditions as of Cl III. The rising trend was not observed in that experiment. The origin in the present spectrum is not obvious from the calculated cross sections of individual levels in
Figure 2. However, the background of the summed cross sections convolved with the measured width in
Figure 3 predicts such a trend, thus confirming the validity of this feature.
The present experimental photoionization spectra is comprised of the superposition of a non-resonant background signal and resonant structures. Resonant peaks are normally assigned to a Rydberg series. A Rydberg series consists of a progression of resonances at energies = where is the effective quantum number (although often designated by the principal quantum number n); z is the charge of the ion, and is the excitation energy of the core ion to which the Rydberg series belongs. The intensities and shapes of resonances belonging to a series are also correlated. Our criteria in assigning a Rydberg series consists of relating at least four resonant peaks by energy and by intensity. In addition, the lower peak principal quantum number n should be (the ground state configuration of Cl III is 3s3p). In the present measurements, resonant structures are intermingled with strong superposition of various Rydberg series belonging to closely-lying core ion excitation levels. No particular Rydberg series of resonances were identified under the required criteria.
For the purpose of identification of features in the spectrum, we use the theoretical cross sections in
Figure 2 as a guide. As mentioned above, Cl III ions were generated (in this experiment) with an ECR ion source. This ion source produces undetermined populations of excited electronic states in the ion beam. Hence, the relative populations of excited states in the ion beam cannot be established, although their presence can be inferred. For instance, the lower panels of
Figure 2 show that the zero offset of the relative ion yield of
Figure 1 and the structure below 42 eV can be attributed to excited Cl III in the states (3s3p
)
P
; (3s
3p
)
P
and
D
. By matching the positions of the observed resonances and relevant shapes with the calculated ones in
Figure 2, we can identify the initial states originating most of the energy resonances in the spectrum, and thus, benchmark the experiment and theory with each other.
The peak at 41.038 eV (labeled as 10 in
Figure 1 and in
Table 3) is correlated to the Cl III
P
initial state. The most prominent resonance in the experimental spectrum at 45.280 eV (labeled as 15 in
Figure 1 and in
Table 3) can be correlated to the interference of resonant structures from initial Cl III ions in states
S
(panel b) and (3s3p
)
P (panels g to i). Although the intensity does not appear to correspond, it should be noted that the spectrum of
Figure 1 is relative. In addition, the indeterminacy of the relative contributions from all possible states could be an explanation for this disagreement. This is, for example, the case for the lower-energy interval of the spectrum where resonance intensities predicted by the theory do not match the experimental spectrum.
In the present theory, the experimental resolution was simulated by a convolution of the theoretical data with a Gaussian function. Gaussian is an approximate profile. The width of the convolution function was set to 10 meV, but was also reduced in some energy regions to avoid dissolution of some resonances and match the experimental spectrum. These could explain some differences in the resonances intensities. The observed resonance at about 43.8 eV is not found in the predicted spectra of any of the five levels. However, a weak structure can be seen close to the energy in the convolved sum of cross sections for
in
Figure 3 (the lowest panel). Apart from these considerations, the origin of this particular resonance is unknown.
Often, the predicted resonant lines are suppressed and smeared by the experiment beam width, which is not of a pure Gaussian shape. We note from the comparison of shapes in the observed (panel a) and predicted (panel b) of
Figure 3 that the main contributors to the observed spectra came from the five lower-lying levels,
,
,
,
, and a relatively small contribution from the three levels of
. Good agreement between the observed and the predicted combined spectra in (panel b) of
Figure 3 is obtained.


 ,
, 


