Article

Chemical Diversity and Classification of Secondary Metabolites in Nine Bryophyte Species

1
Leibniz Institute of Plant Biochemistry, Bioinformatics and Scientific Data, Weinberg 3, 06120 Halle (Saale), Germany
2
Division of Analytical Biosciences, Leiden Academic Centre for Drug Research (LACDR), Leiden University, 2333 CC Leiden, The Netherlands
3
Division of Systems Biomedicine and Pharmacology, Leiden Academic Centre for Drug Research (LACDR), Leiden University, 2333 CC Leiden, The Netherlands
4
German Centre for Integrative Biodiversity Research (iDiv) Halle-Jena- Leipzig, Deutscher Platz 5e, 04103 Leipzig, Germany
*
Author to whom correspondence should be addressed.
Metabolites 2019, 9(10), 222; https://doi.org/10.3390/metabo9100222
Submission received: 23 August 2019 / Revised: 1 October 2019 / Accepted: 8 October 2019 / Published: 11 October 2019
(This article belongs to the Special Issue Ecometabolomics)

Abstract

:
The central aim in ecometabolomics and chemical ecology is to pinpoint chemical features that explain molecular functioning. The greatest challenge is the identification of compounds due to the lack of constitutive reference spectra, the large number of completely unknown compounds, and bioinformatic methods to analyze the big data. In this study we present an interdisciplinary methodological framework that extends ultra-performance liquid chromatography coupled to electrospray ionization quadrupole time-of-flight mass spectrometry (UPLC/ESI-QTOF-MS) with data-dependent acquisition (DDA-MS) and the automated in silico classification of fragment peaks into compound classes. We synthesize findings from a prior study that explored the influence of seasonal variations on the chemodiversity of secondary metabolites in nine bryophyte species. Here we reuse and extend the representative dataset with DDA-MS data. Hierarchical clustering, heatmaps, dbRDA, and ANOVA with post-hoc Tukey HSD were used to determine relationships of the study factors species, seasons, and ecological characteristics. The tested bryophytes showed species-specific metabolic responses to seasonal variations (50% vs. 5% of explained variation). Marchantia polymorpha, Plagiomnium undulatum, and Polytrichum strictum were biochemically most diverse and unique. Flavonoids and sesquiterpenoids were upregulated in all bryophytes in the growing seasons. We identified ecological functioning of compound classes indicating light protection (flavonoids), biotic and pathogen interactions (sesquiterpenoids, flavonoids), low temperature and desiccation tolerance (glycosides, sesquiterpenoids, anthocyanins, lactones), and moss growth supporting anatomic structures (few methoxyphenols and cinnamic acids as part of proto-lignin constituents). The reusable bioinformatic framework of this study can differentiate species based on automated compound classification. Our study allows detailed insights into the ecological roles of biochemical constituents of bryophytes with regard to seasonal variations. We demonstrate that compound classification can be improved with adding constitutive reference spectra to existing spectral libraries. We also show that generalization on compound classes improves our understanding of molecular ecological functioning and can be used to generate new research hypotheses.

1. Introduction

Bryophytes or ‘mosses’ are considered to be the oldest group of terrestrial plants [1]. They are classified into the three major groups liverworts (‘hepatics’, Marchantiophyta), mosses s. str. (‘musci’, Bryophyta) and hornworts (Anthocerophyta) [2,3,4]. As of today, there are approx. 24,000 bryophyte species known [5]. Unlike vascular plants, bryophytes lack well developed cell structures that protect them from herbivores, pathogens, and environmental exposures. As a result, they have evolved a unique diversity of bioactive compounds as part of their survival strategy [6]. Some bioactive compounds may have also evolved in early stages of land plant evolution and are thus present in both bryophytes and vascular plants.
Bryophytes are small and morphologically inconspicuous plants. Yet, their biochemistry is relatively unstudied despite the fact that some species have been widely used in traditional medicine of indigenous people around the world, especially in China [7]. While terpenoids constitute the largest group of bioactive compounds, bryophytes also produce a variety of glycosides, flavonoids, and other aromatic compounds [8,9]. Restricted to liverworts are cellular oil bodies that contain many unique compounds such as cyclic neolignans ((bis)-bibenzyls), diverse sesquiterpene lactone derivatives, other terpenoids, and fatty acids (see Table 1 for an overview on most common compound classes in bryophytes). Hence the name “oil bodies” as they appear under the microscope as little droplets of oil [10]. Many of these compounds are considered to be bioactive [5,6].
Bryophytes produce a variety of metabolic compounds as defense against mechanical damage, environmental changes, and pathogens [9,11,12]. Metabolites play also a role in interactions of bryophytes with other organisms. Here the research field of ecometabolomics has the unique potential to relate specific compounds to ecological functioning [13]. For example, it has been shown that the species Dicranum scoparium produces acetylic oxylipins as a defense against herbivorous slugs [14,15] and that some bryophytes can inhibit the germination of vascular plant seeds [16,17]. Ecometabolomics is also a useful tool to elucidate the importance of bryophytes in carbon and nitrogen cycling [18,19] and the biochemical role of bryophytes within biological soil crusts [20,21]. Some desiccation-tolerant bryophytes have been described as “resurrection plants” [22]. While it is known that many bryophytes have developed structures such as hyaline hairs or convoluting leaves to reduce evaporation and exposure to radiation, ecometabolomics could help to unravel the chemical constituents in the cells of bryophytes that are associated with water stress [23]. Ecometabolomics can further be used to explore the ecological or environmental circumstances under which bryophytes produce certain natural products, e.g., those that have medicinal value [5,24]. Thus, in ecometabolomics the goal is to find molecular mechanisms that allow the ecological interpretation at more coarse spatiotemporal scales [13]. In a top-down approach, sets of biomarkers are sought that explain ecological functioning or organismal interactions [25]. These biomarkers can be constituted by any kind of natural products—substances, secondary metabolites, or even compound classes [26].
Biochemical fingerprints can be generated from the presence or absence of compounds and their relative intensity can be used to describe chemotaxonomic properties that discriminate different species, ecotypes, or phylogenetic relationships [27,28]. High-throughput techniques like GC/MS or LC/MS offer unique possibilities but were rarely applied to bryophytes with regard to chemosystematics [29]. Liquid chromatography coupled to mass-spectrometry and data-dependent acquisition (DDA-MS) is a relatively fast and inexpensive analytical method that subjects the most abundant MS1 peaks to a second stage of MS2 fragmentation in a defined series of scans before the cycle starts again [30]. The method potentially allows the elucidation of the most abundant natural products in biological species and is a useful analytical tool to assess the chemodiversity between samples of different biological species [31]. A full scan automatically selects the precursor ions for isolation according to intensity thresholds and priority settings. Precursors are then subjected to collision induced dissociation CID) with variable collision energies. With DDA-MS, usually several hundred high quality MS2 fragment spectra can be acquired per analytical run.
In this study, we explore the diversity of compound classes of secondary metabolites of nine different bryophytes species with regard to seasonal variations. Our preceding study and many other ecometabolomics studies have performed metabolite fingerprinting and LC/MS at MS1 level to find biochemical patterns that explain ecological relationships [32,33]. We here extend the methodology towards a more mechanistic characterization by the automatic in silico identification of compound classes using additional DDA-MS. As bryophytes and other non-model species are biochemically not well characterized they likely contain novel compounds that have never been measured before (also called “unknown unknowns” and often referred to as compounds as part of the “dark matter”) [34,35]. It is a very complex and time-consuming process to annotate and characterize the chemical structures for these unknown compounds [26] because there are no analytical standards available and very sparse spectral annotations are available in reference libraries. The only options currently available require either manual analytical characterization which often involves a complete de novo structure elucidation with additional methods such as NMR [34], or in silico approaches that predict chemical structures based on molecular fingerprints or fragmentation patterns via computational methods [36,37,38].
To overcome these limitations, we explore an additional in silico method that performs automatic classification of compounds into compound classes based on recognized ontologies [38,39,40]. To this end, we annotated unknown MS2 fragment spectra with terms from the ChemOnt ontology using ClassyFire [40]. ChemOnt is a purely molecular structure-based chemical taxonomy that comprises structures and structural features to assign known compounds to a taxonomy using more than 4800 categories defined by computable structural rules and a consensus-based nomenclature [39,40]. We use these ontological categories to train a classifier with reference fragment spectra of known compounds based on the MassBank library [41,42]. We use the resulting classifier to assign unknown fragment spectra to compound classes which were acquired for the different bryophyte species in our analytical pipeline.
Our methodology improves subsequent ecometabolomics analyses as it allows a better understanding of chemodiversity and deeper insight into biochemical processes than metabolite fingerprinting alone. By organizing chemical entities into classes [43], they can be used to observe ecological or diversity relationships at molecular levels and to assign ecological functioning to compound classes.
The goals of the study are (1) to present a novel processing pipeline that combines DDA-MS with the automated classification of fragment peaks of the most abundant chemical entities into compound classes, and (2) to present an integrative bioinformatic framework based on a representative dataset to provide a reusable bioinformatic toolset to improve subsequent ecometabolomics studies and to generate new research hypotheses.

2. Materials and Methods

For experimental design and sampling we refer to our previous study [33]. Briefly, the nine moss species Brachythecium rutabulum (Hedw.) Schimp., Calliergonella cuspidata (Hedw.) Loeske, Hypnum cupressiforme Hedw., and Rhytidiadelphus squarrosus (Hedw.) Warnst. (group pleurocarpous mosses), Fissidens taxifolius Hedw., Grimmia pulvinata (Hedw.) Sm., Plagiomnium undulatum (Hedw.) T.J. Kop., Polytrichum strictum Menzies ex Brid. (group acrocarpous mosses), and Marchantia polymorpha L. (group liverworts) were sampled in a natural environment in the Botanical Gardens of the Martin Luther University Halle-Wittenberg, Germany in the seasons summer (2016/08/08), autumn (2016/11/09), winter (2017/01/27) and spring (2017/05/11).
Based on aliquots of methanolic extracts produced in [32], ultra-performance liquid chromatography coupled to electrospray ionization quadrupole time-of-flight mass spectrometry (UPLC/ESI-QTOF-MS) was performed acquiring collision induced dissociation mass spectra (CID) using a MicroTOF–Q hybrid quadrupole time-of-flight mass spectrometer equipped with an Apollo II electrospray ion source (Bruker Daltonics, Billerica, MA, USA).
Chromatographic separations were performed at 40 °C on an Acquity UPLC system (Waters, Milford, MA, USA) equipped with an HSS T3 column (100 × 1 mm, particle size 1.8 µm; Waters, Milford, MA, USA). A binary gradient was applied at a flow rate of 150 µL/min-1 at 0 to 1 min, isocratic 95% A (water: formic acid: 99.9:0.1 (v/v)), 5% B (acetonitrile: formic acid: 99.9:0.1 (v/v)); 1 to 18 min, linear from 5% to 95% B; 18 to 20 min, isocratic 95% B. The injection volume was 3.1 µL (full loop injection).
Metabolite profiles were acquired with the following MS instrument settings: ionization mode: positive, scan range: 50–1000 m/z, nebulizer and dry gas nitrogen at 1.6 bar and 6 L/min, source temperature: 190 °C, capillary voltage: 5000 V, end plate offset: −500 V, ion optics: funnel 1 RF 200 Vpp, funnel 2 RF 200 Vpp, in-source CID energy: 0 eV, hexapole RF 100 Vpp, quadrupole ion energy 3 eV, collision gas: argon, isolation mass: 100 m/z, collision energy: 3 eV, collision cell RF 200 Vpp, transfer time: 70 µs, pre pulse storage time: 5 µs, spectra rate: 3 Hz.
MS2 fragment spectra of most abundant peaks were acquired in data-dependent acquisition mode (DDA-MS or sometimes also referred to as ‘Auto-MS-MS’) with the following instrument settings: CID mode, number of precursors: 3, intensity threshold: 600, precursor background subtraction enabled, active exclusion enabled after 3 spectra, release after 18 s, priority list for isolation at 300 m/z: 1z, 2z, 3z, at 500 m/z: 1z, 2z, 3z, at 1000 m/z: 1z, 2z, 3z, isolation width: 3–10 m/z (isolation width at 300 Da: 3 m/z, at 500 Da: 8 m/z, at 1000 Da: 10 m/z), collision energy: 15–70 eV (collision energy at 300 m/z for charge states 1z, 2z, 3z: 15, 20, 25 eV, at 500 m/z for charge states 1z, 2z, 3z: 30, 35, 45 eV, at 1000 m/z for charge states 1z, 2z, 3z: 40, 50, 70 eV).
Detection of chromatographic peaks was performed in R 3.5.3 with the package XCMS 1.52.0 and CAMERA 1.33.3 [44,45] using the parameters described in [33]. The additional packages parallel, foreach, doMC, RColorBrewer, multtest, MSnbase, mixOmics, vegan, multcomp, and Hmisc were used for statistical analyses.
Quality control was employed with the mzQuality workflow for MS data (Further information is available at http://www.mzQuality.nl) Here, the relative standard deviation (RSD) was calculated for the eight internal standards injected into 18 quality control (QC) samples. Furthermore, a plot depicting the batch design and the intensity measured in 22 metabolites in all measured samples was produced (Supplemental Figure S7).
Metabolite richness and diversity indices were calculated by determining the unique chemical entities (those features that are only present in one of the study factors (“species” or “seasons”) but not the others), by calculating the Shannon diversity index H’, and by determining the peak intensities of chromatographic peaks [33]. To measure the homogeneity of the distribution of metabolite features, the evenness (or equitability) was determined calculating the Pielou’s J index [46,47]. To compare the above diversity indices, boxplots were generated for the two study factors “species” and “seasons”. To test individual factor levels for differences, the Tukey HSD was performed post-hoc. Letters representing the groups were placed in the upper part of the boxplots. In the following, we use the term ‘significant’ when p-values are below a threshold of 0.05.
MS2 spectra were extracted from the mzML and converted to NIST MSP format (https://www.nist.gov/sites/default/files/documents/srd/NIST1a11Ver2-0Man.pdf). Fragment spectra similar in precursor mass (mz difference ≤ 0.01 Da) and retention time (Δrt error ≤ 5 s) were merged in each sample. Only compounds with a mass between 50 and 1000 Da and a retention time between 10 and 1020 s were evaluated. Compound classes of all the grouped MS2 fragment spectra were determined using classifiers which were created on a training set of ~57,000 MS2 fragment spectra with known structures from MassBank (René Meier, personal communication) [41,48]. Prior to this study, MassBank have not contained spectra of the group of neolignans (bis-bibenzyls) and sesquiterpenoids have been underrepresented. We thus complemented the library with manually curated spectra of 23 lignans and 27 sesquiterpenoids from identified compounds of Marchantia polymorpha. We further annotated these spectra with terms from the ChemOnt ontology using ClassyFire [39,40].
Classes from the ChemOnt ontology (as listed in Table 1) were used to train a classifier for each compound class determined in the bryophyte samples [49]. Spectra were grouped into a foreground data set containing spectra from compounds which are member of the compound class and a background data set containing the remaining spectra. Only those fragment peaks above an abundance threshold of 100 were used. A simple classifier was trained with the foreground and background data set. In the prediction step, the membership of each unknown spectrum was predicted for each compound class. A p-value based on the score distribution of the background data set was calculated from the training step. Only predictions with a p-value ≤ 0.05 were kept.
As the foreground and background data sets had an imbalanced class ratio (positives are substantially less abundant than negatives), we assessed the correctness of the classifier by calculating the area under the precision–recall curve (AUC-PR) and the true positive rate for a fixed false negative rate of 5% (TPR-FNR) [50]. We calculated the AUC-PR as a single number to evaluate the performance of our binary classifier [51]. Precision–recall curves (PR) are increasingly used in machine learning and a useful alternative to the closely related receiver operating characteristic (ROC) curves [52]. PR are considered a more accurate measure with imbalanced datasets as some performance metrics are better represented than with ROC curves [53].
To estimate the probability that our classifier scores are randomly drawn positive entity higher than a randomly drawn negative entity, we use cross-classification by calculating the true positive rate (TPR = sensitivity) on a false negative rate (FNR = specificity) which is a better estimator of performance than a purely TPR with imbalanced data [54]. Similar to a ROC curve, a two-dimensional curve is created with the TPR being the unit in direction of the x-axis and FNR the unit in direction of the y-axis. This curve is parametrized with a threshold of 5%, where formula (1) and formula (2). The resulting TPR-FNR represents the partial area under the two combined curves.
TPR = true positives/positives,
FPR = false negatives/negatives,
To show an overview on the distribution of compound classes, a sunburst plot was created which indicates the membership of all chemical entities and assigns them to all parent compound classes. Heatmaps (using the gplots R package) were generated for the total counts of chemical entities belonging to the respective compound classes and for the study factors species and seasons using Bray–Curtis dissimilarity. Boxplots were generated for compound classes separately which show the quartiles per species and seasons. To assess the relationship to the phylogenetic tree, dendrograms were generated using the R packages ape, pvclust, dendextend, cba, and phangorn. The chemotaxonomic and the phylogenetic tree were compared by calculating the cophenetic correlation value, the Mantel statistic and the Robinson–Foulds metric as described in [33].
To assess the influence of the study factors species and seasons, variation partitioning using distance-based redundancy analysis (dbRDA) was performed (using the vegan R package) [55]. Categorical factors were transformed to presence–absence matrices prior to the ordination. Using the function envfit in the R package vegan, the influences of ecological characteristics (described in [33]) were determined by fitting the ecological characteristics to the ordination of the compound classes matrix. The projections of the ecological characteristics onto vectors have maximum correlation with the corresponding compound entities of the compound classes matrix. The significance of the fitted vectors was assessed using permutation of the ecological characteristics. The goodness of fit statistic is the squared correlation coefficient (r2) and empirical p-values were calculated for each ecological characteristic (using statistical procedures built into the envfit function).

3. Results

Raw metabolite profiles (see also Figure S8 for raw total ion chromatograms) including the MS2 fragment spectra acquired in DDA-MS mode, corresponding data tables, classifiers and meta-data are available as identifier MTBLS709 in the repository MetaboLights [56].

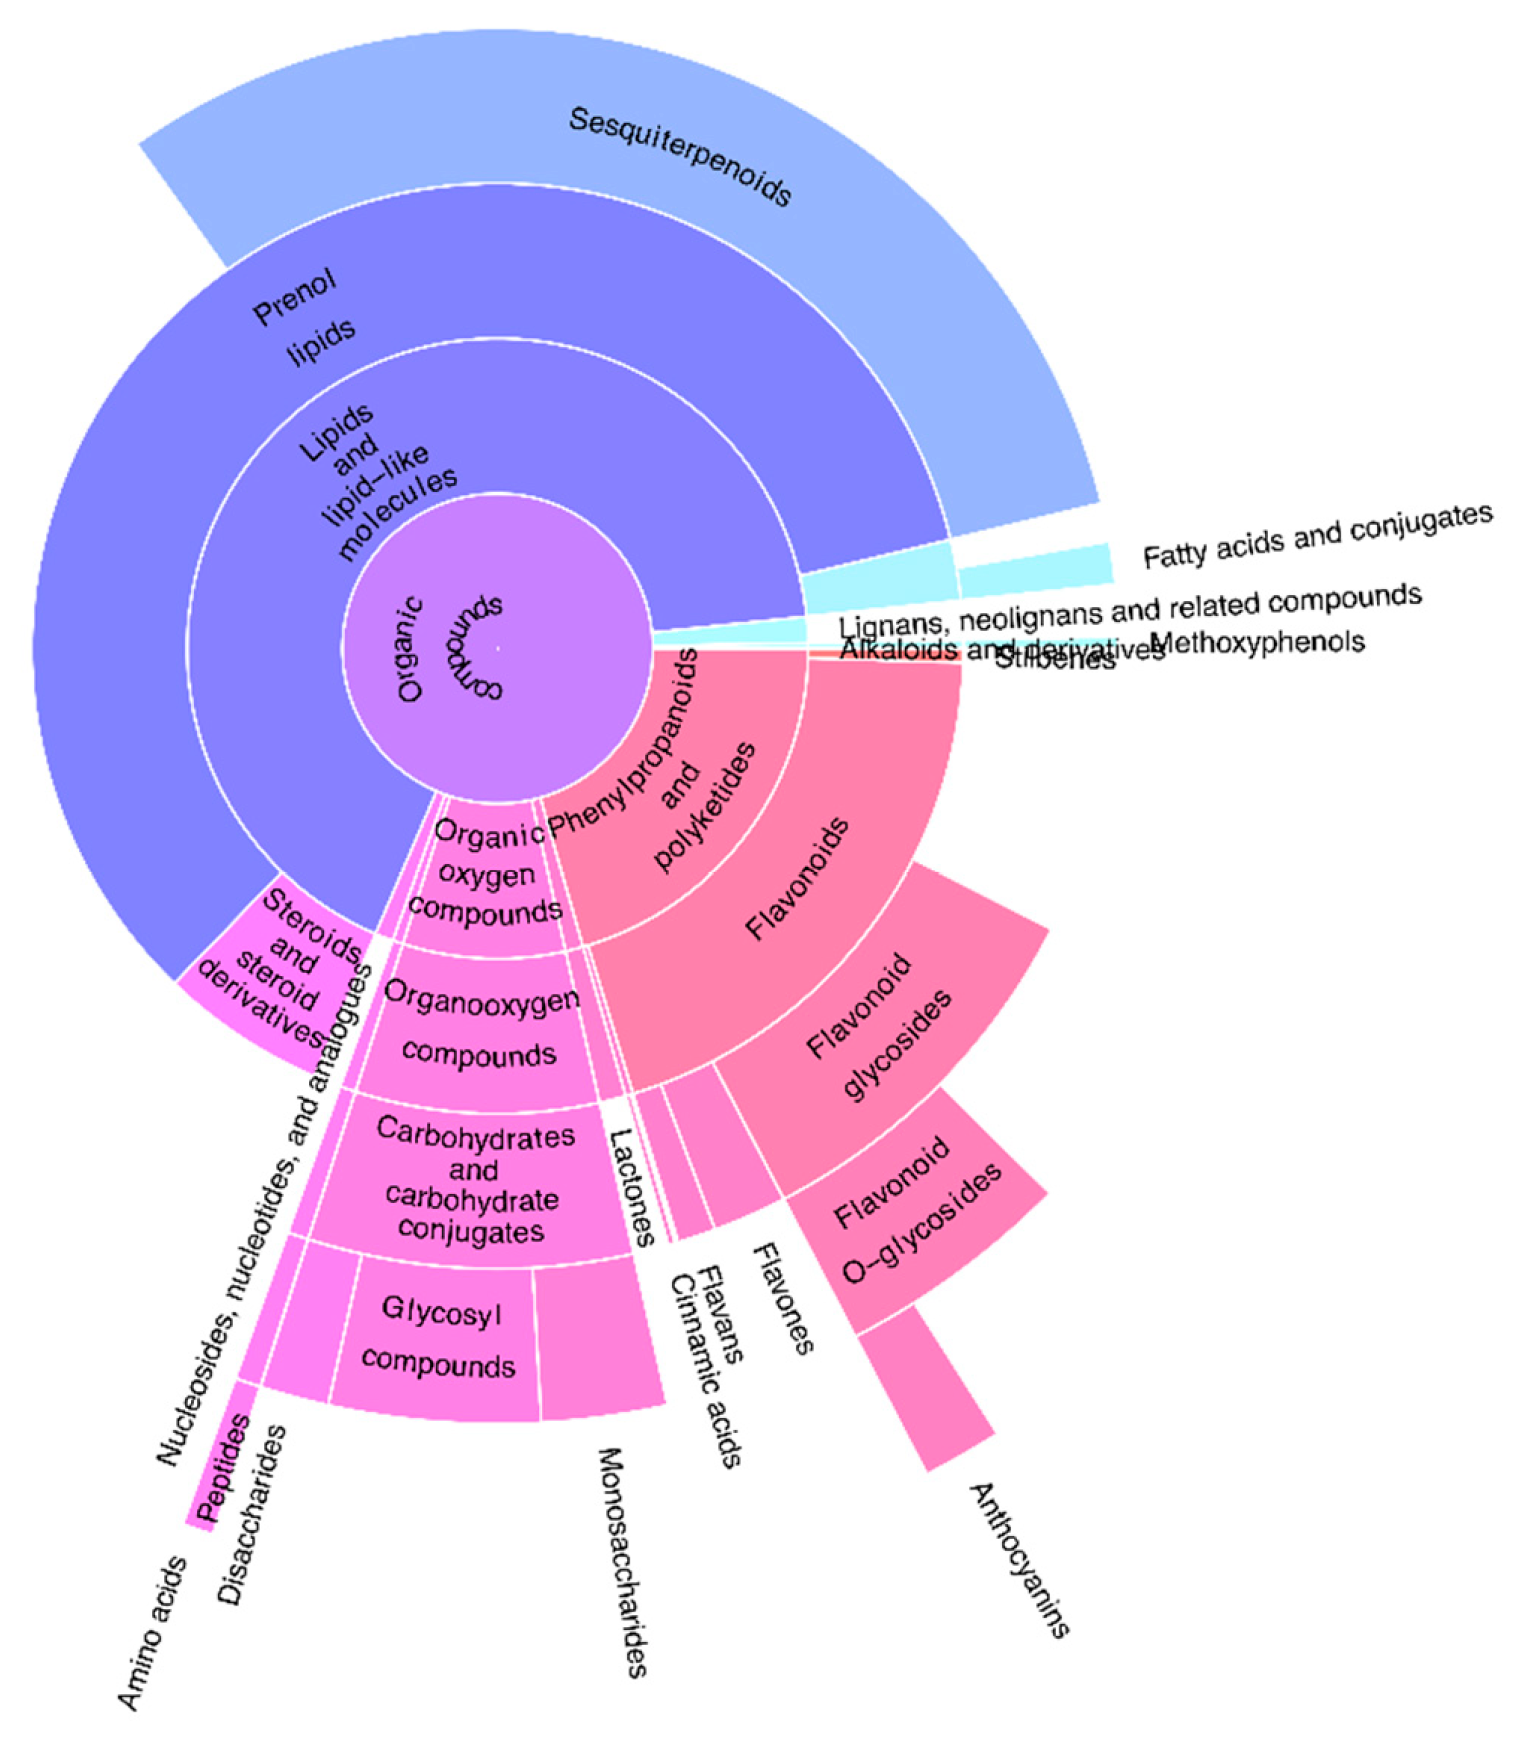
3.1. Classification of Compound Classes

Our classifier assigned chemical entities to 24 compound classes out of 35 predefined classes (listed in Table 1). As shown in Figure 1, the most prevalent compound classes were lipid-like molecules such as prenol lips (including sesquiterpenoids and steroids). Flavonoids and carbohydrates were frequently detected by our setup. We annotated the other bioactive compound classes of methoxyphenols, neolignans, cinnamic acids, lactones, and anthocyanins. Primary metabolites such as saccharides, nucleotides, and amino acids were also determined.

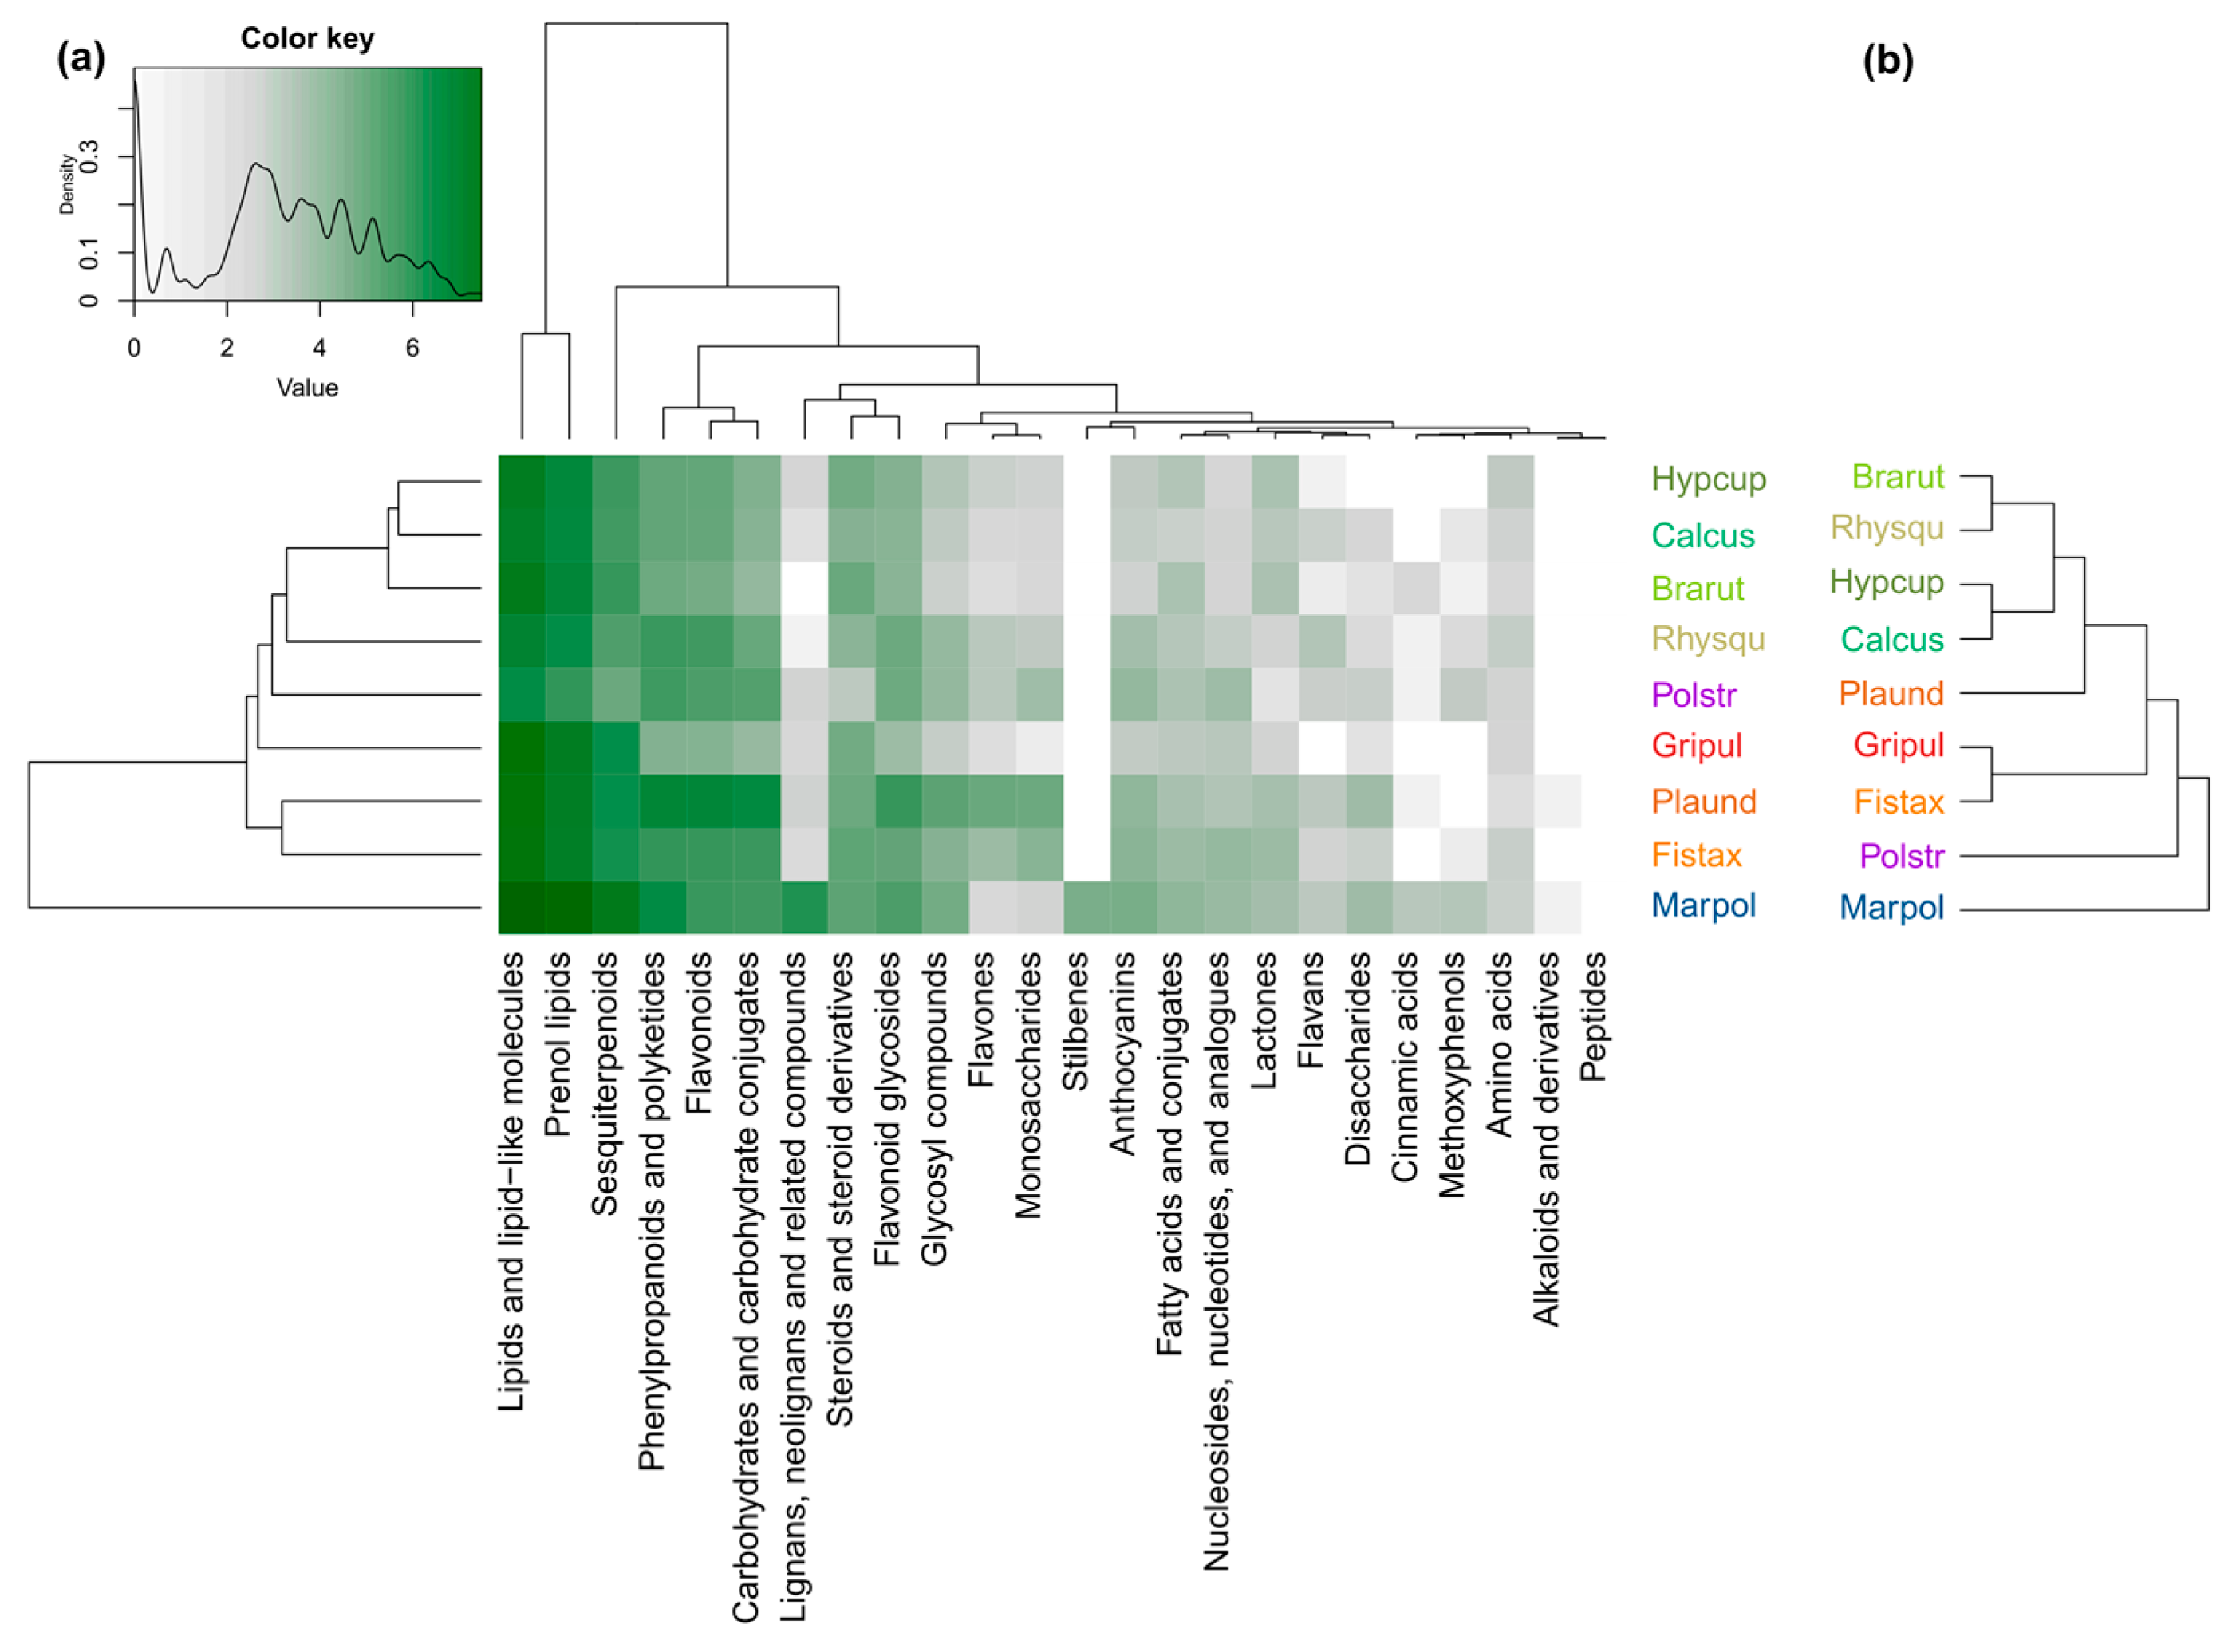
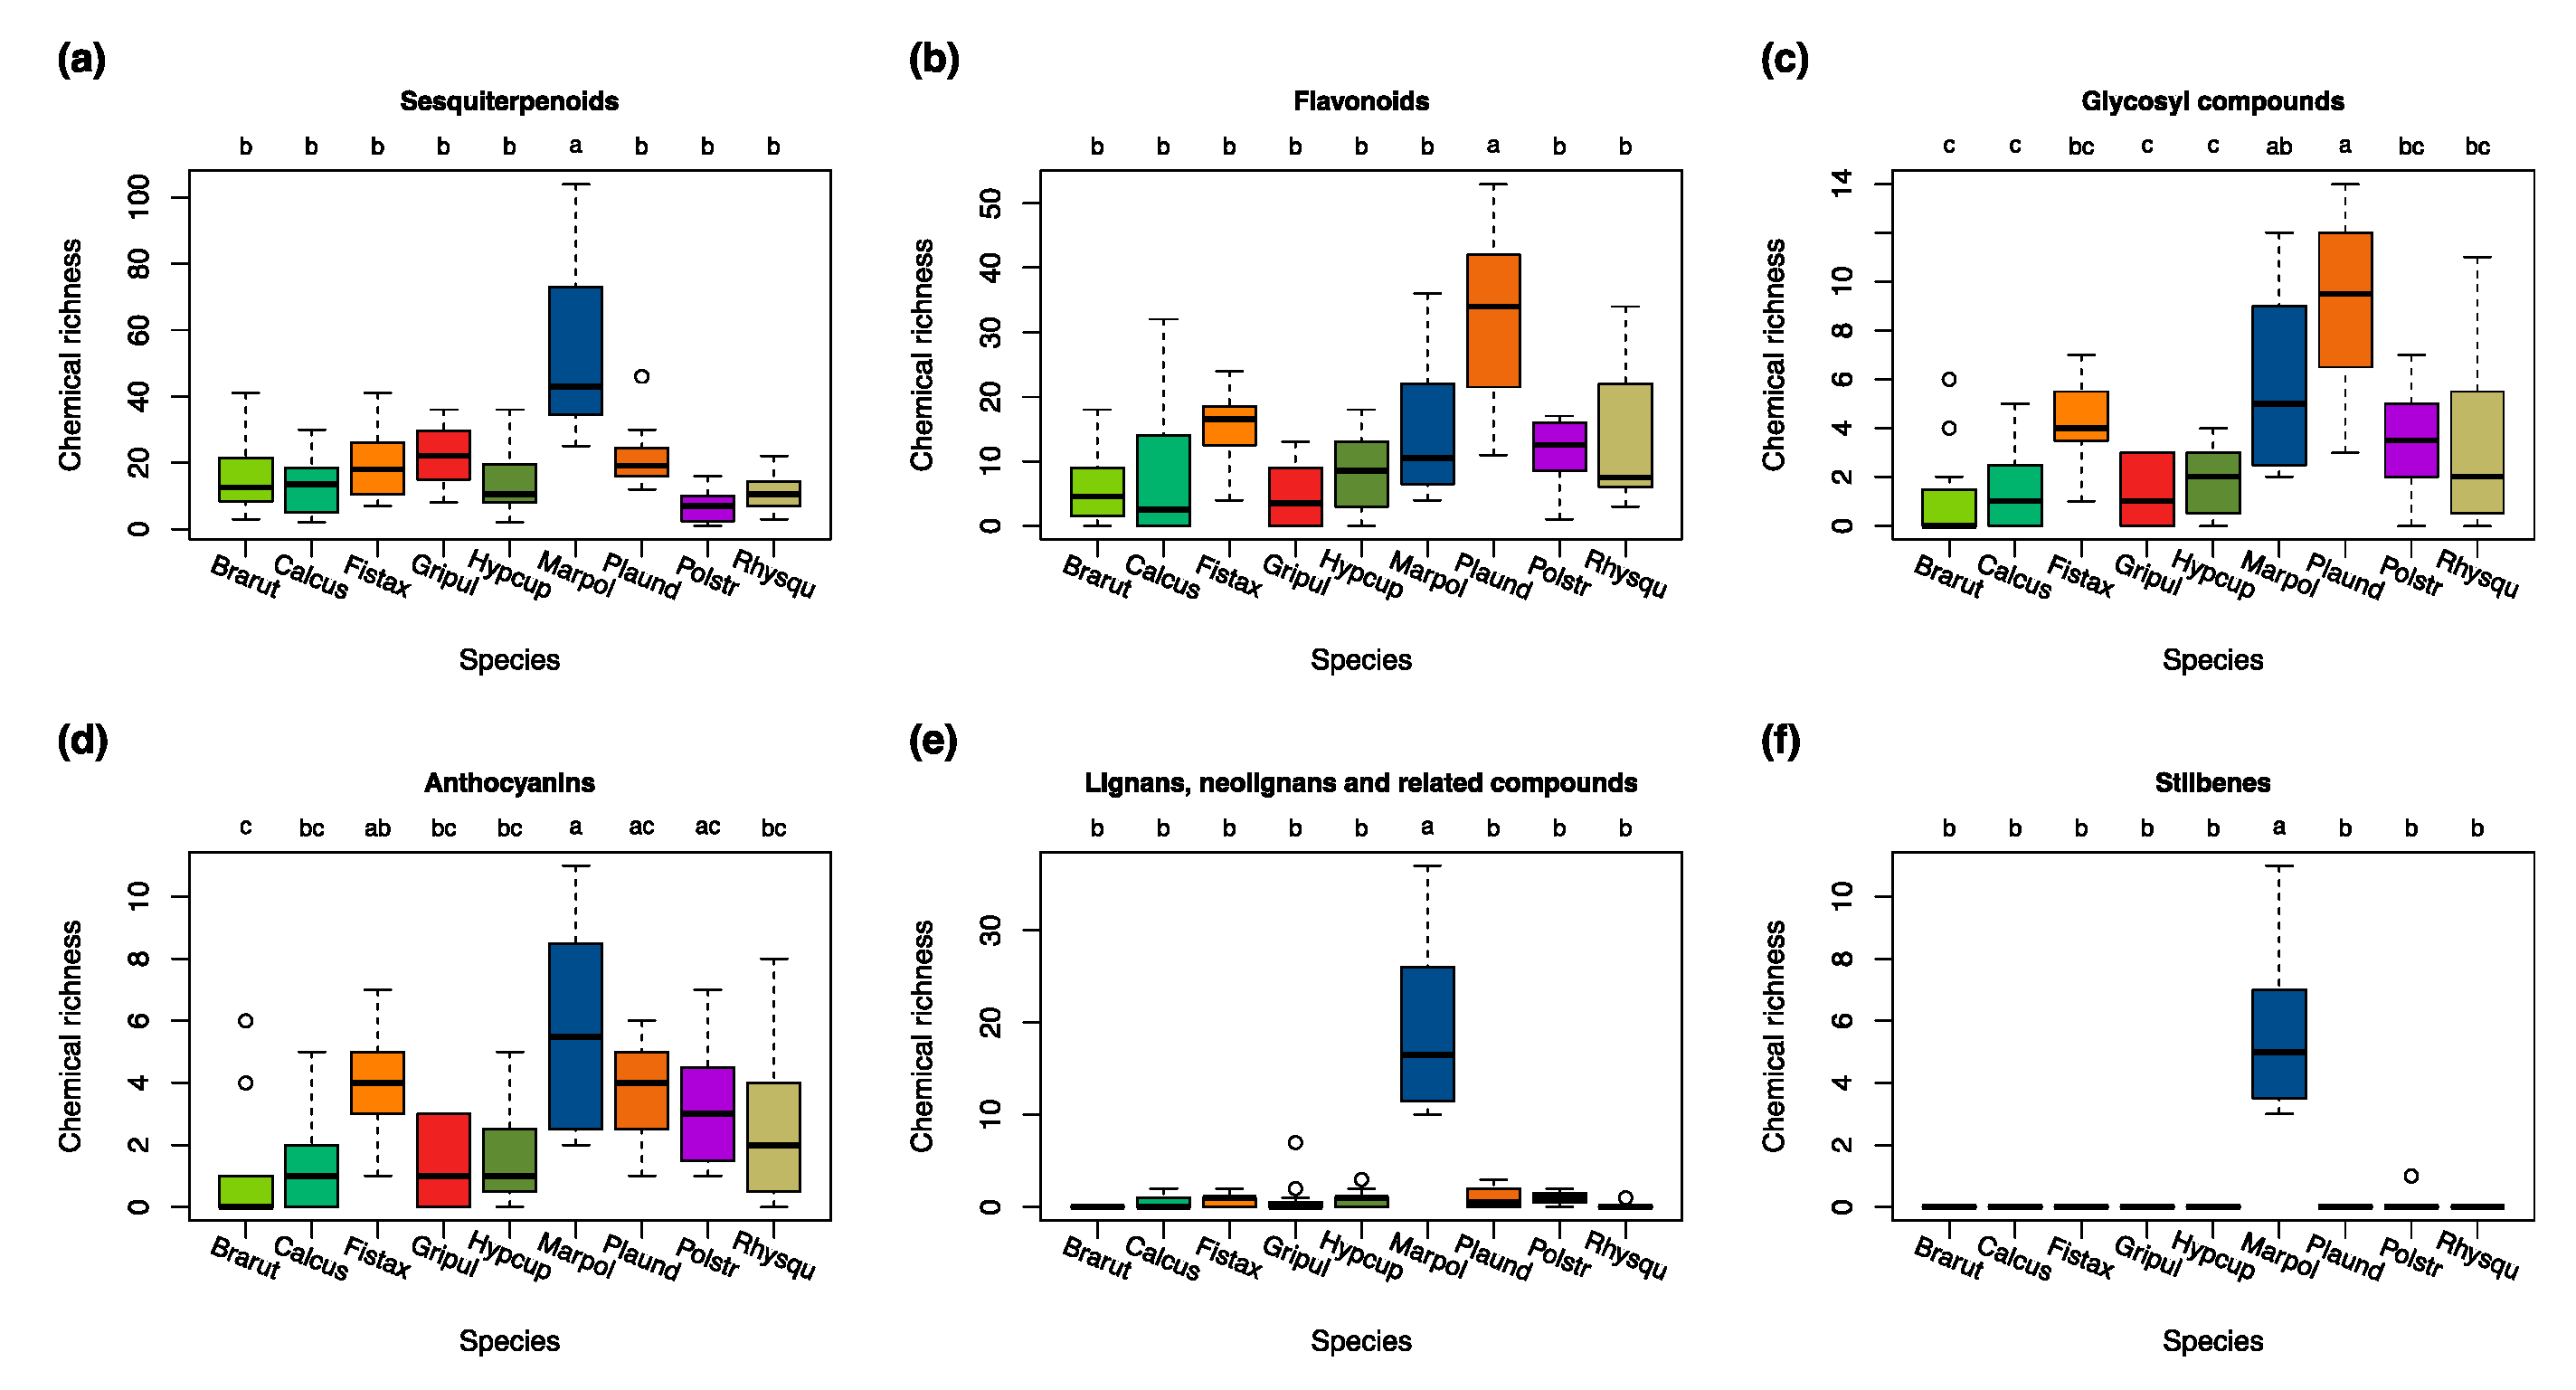
3.2. Species-Specific Variations in the Compound Classes

The high chemical diversity of Marchantia polymorpha (as shown in Figure S1a–d and Figure S2a) is mainly the result of the presence of many lipid-like compounds such as sesquiterpenoids (Figure 2a), phenylpropanoids, polyketides (Figure S4h), and flavonoid glycosides (Figure S4o). We detected significantly (p < 0.05) more lignans, neolignans, and related compounds than in any other species (Figure 2a, Figure 3e). Stilbenes were present only in M. polymorpha (Figure 3f). The relatively high chemodiversity of Plagiomnium undulatum was due to large numbers of flavonoids, flavones, and monosaccharides and glycosyl compounds in comparison to the other species (including phenylpropanoids and polyketides and carbohydrates and carbohydrate conjugates as parent classes) (Figure 2a, Figure 3b,c, Figure S4). Generally, a low diversity was observed in profiles of Polytrichum strictum (Figure S1b, Figure S2a). This was significant (p < 0.05) for steroids and steroid derivatives (Figure S4c), sesquiterpenoids (Figure 3a), and pronounced for lactones (Figure S4g). However, we detected many unique chemical entities regardless of class that were not present in any of the other species (Figure S1a). Fissidens taxifolius had a larger richness in the classes of phenylpropanoids and polyketides, flavonoids, flavones, flavonoid glycosides, anthocyanins, carbohydrates and conjugates, glycosyl compounds, and monosaccharides when compared to other acrocarpous and pleurocarpous mosses (Figure S3b–d, Figure S4h,l,m,o–r). The slightly larger diversity of acrocarpous mosses over the group pleurocarpous mosses (Figure S1b, Figure S2a, Figure S4) was mostly due to lower chemical richness in the classes of prenol lipids and carbohydrates (including glycosylic compounds) in pleurocarpous mosses (Figure 2a).
The liverwort M. polymorpha was the most basal species in both the chemotaxonomic and the phylogenetic tree (Figure 2a,b). When compared to the phylogenetic tree, P. strictum had a different position which was mainly the result of an overall low chemical richness and the presence of many unique chemical entities, especially methoxyphenols (Figure 2a,b, Figure S4k). The different position of P. undulatum and F. taxifolius within the group of acrocarpous mosses was mainly due to the presence of many characteristic phenylpropanoids and polyketides (including flavonoids and flavones), lactones, anthocyanins, and carbohydrates (including monosaccharides and glycosyl compounds) (Figure 2a,b, Figure 3b–d, Figure S4). The pleurocarpous mosses H. cupressiforme, C. cuspidata, and B. rutabulum had a rather homogeneous richness in the compound classes, except for carbohydrates and its conjugates and anthocyanins (Figure 2a,b, Figure 3d, Figure S4q–t).

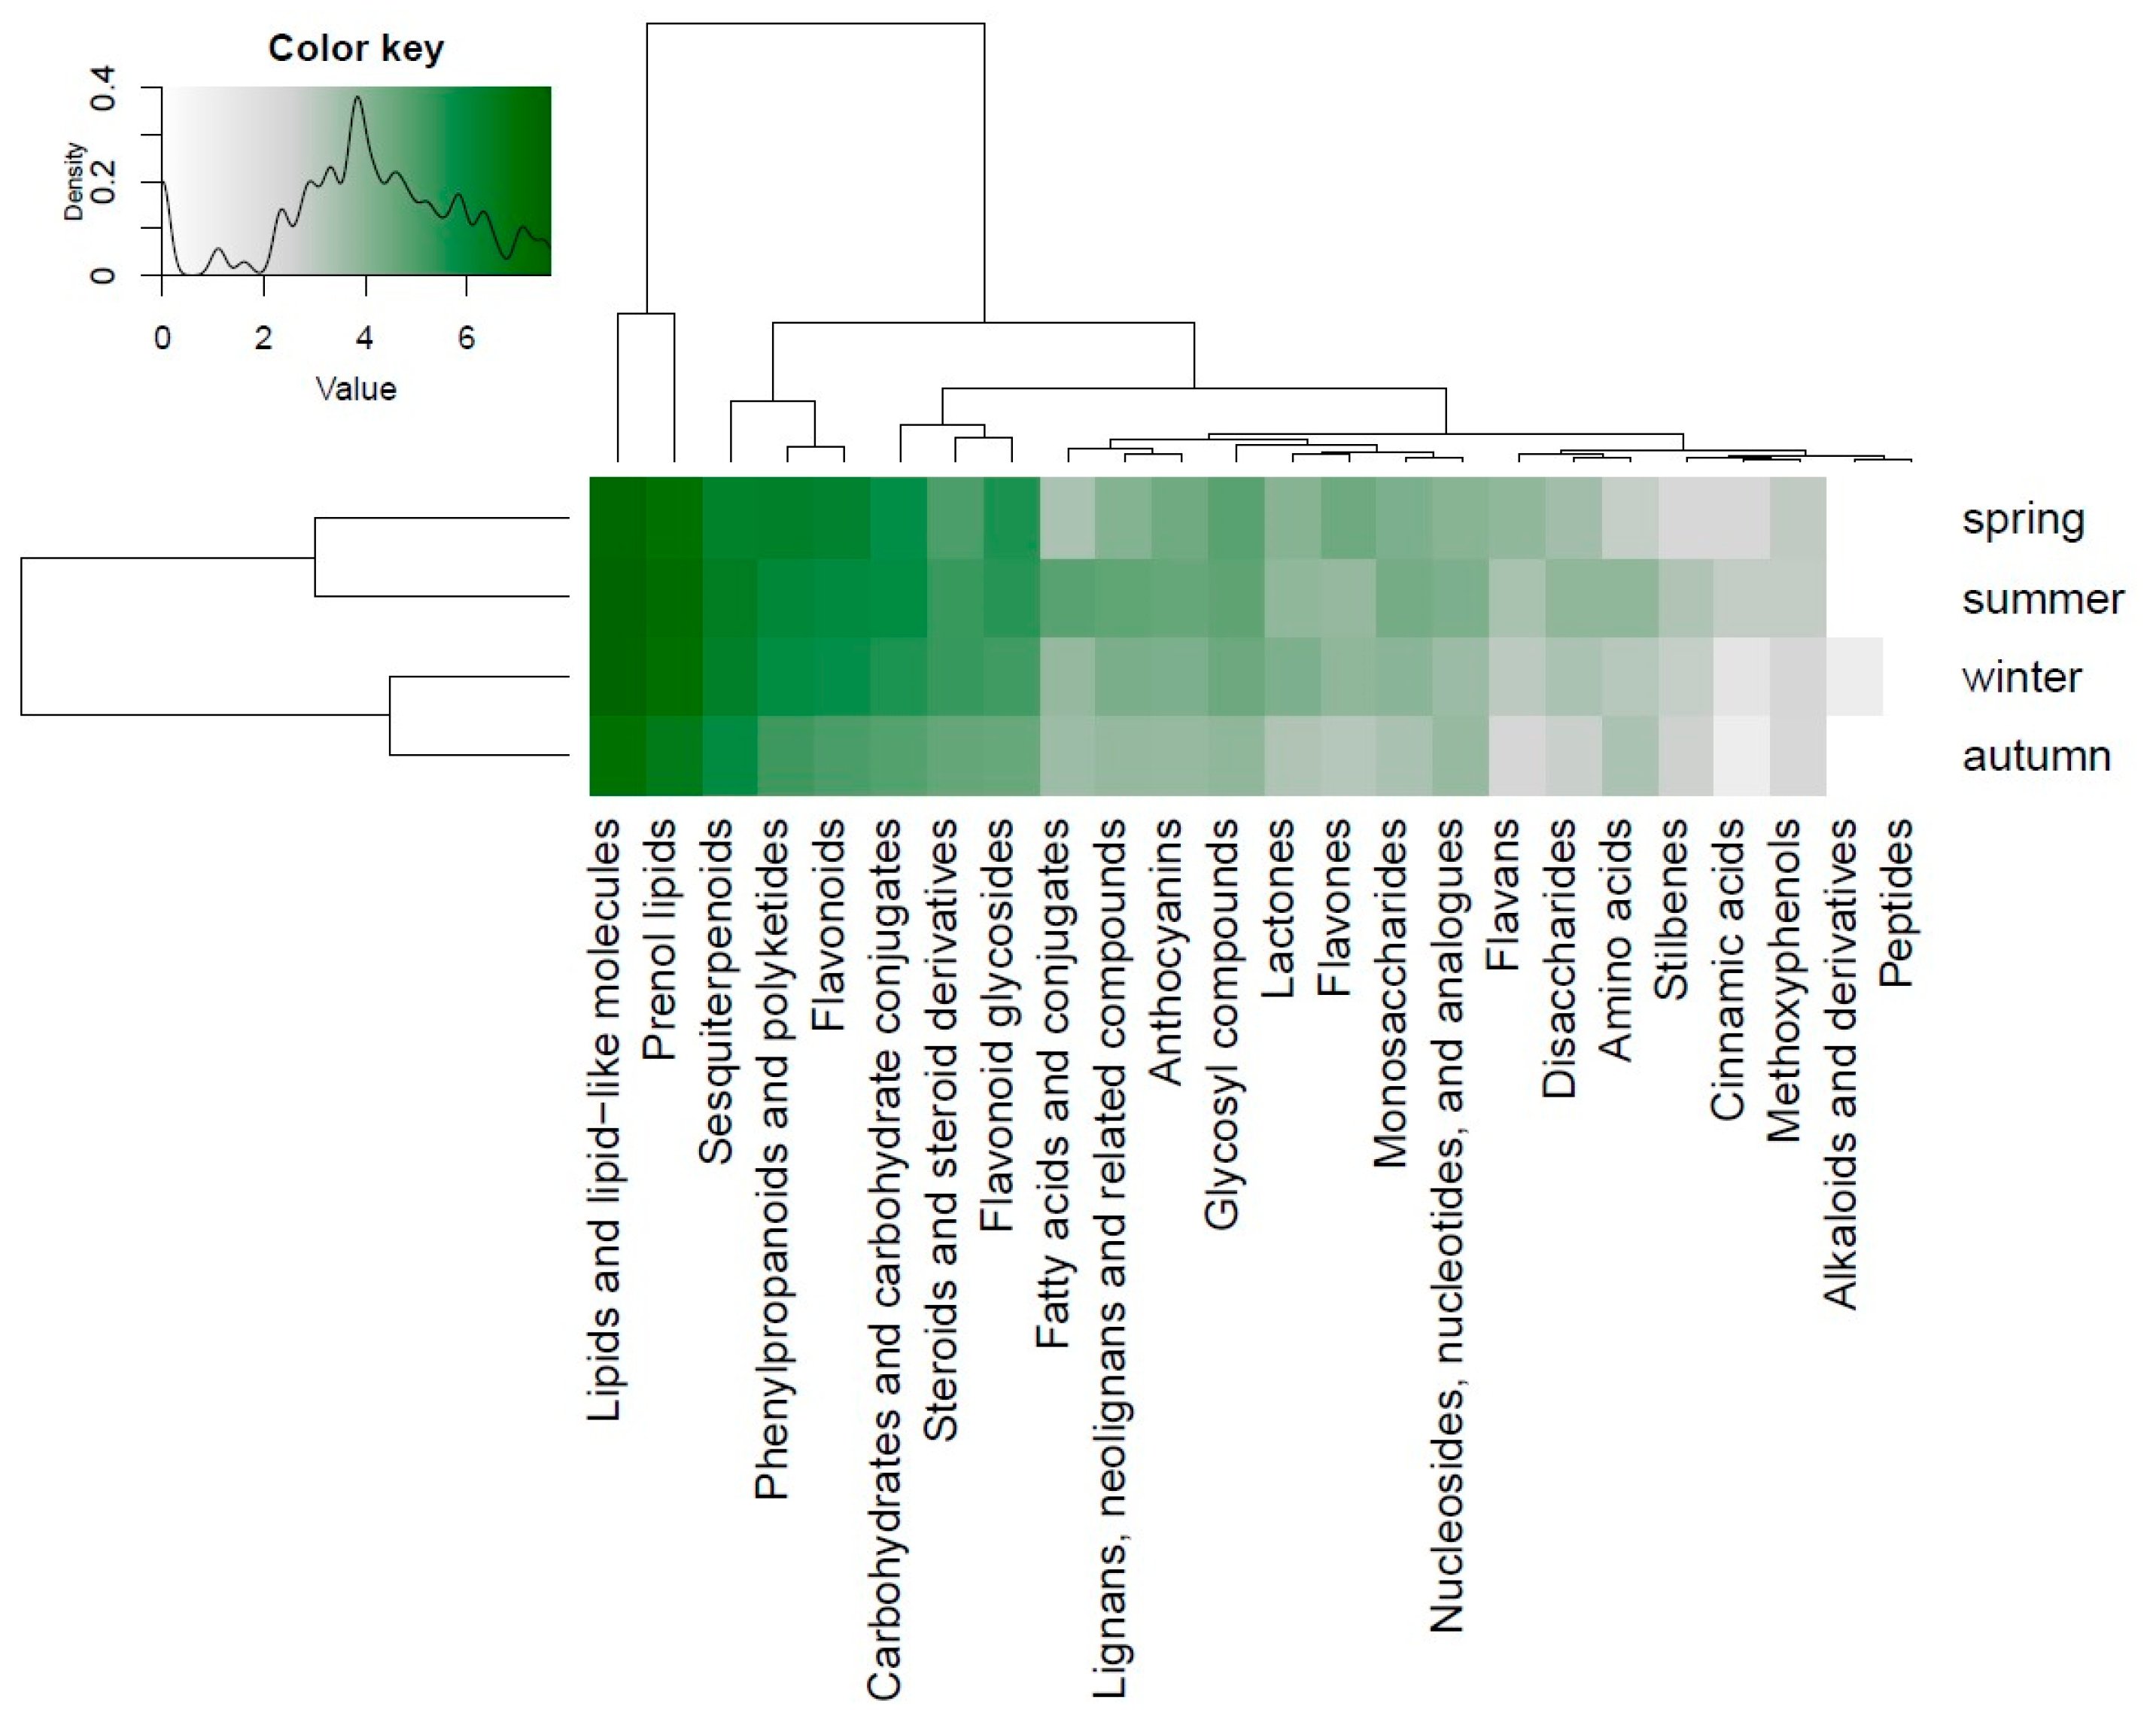
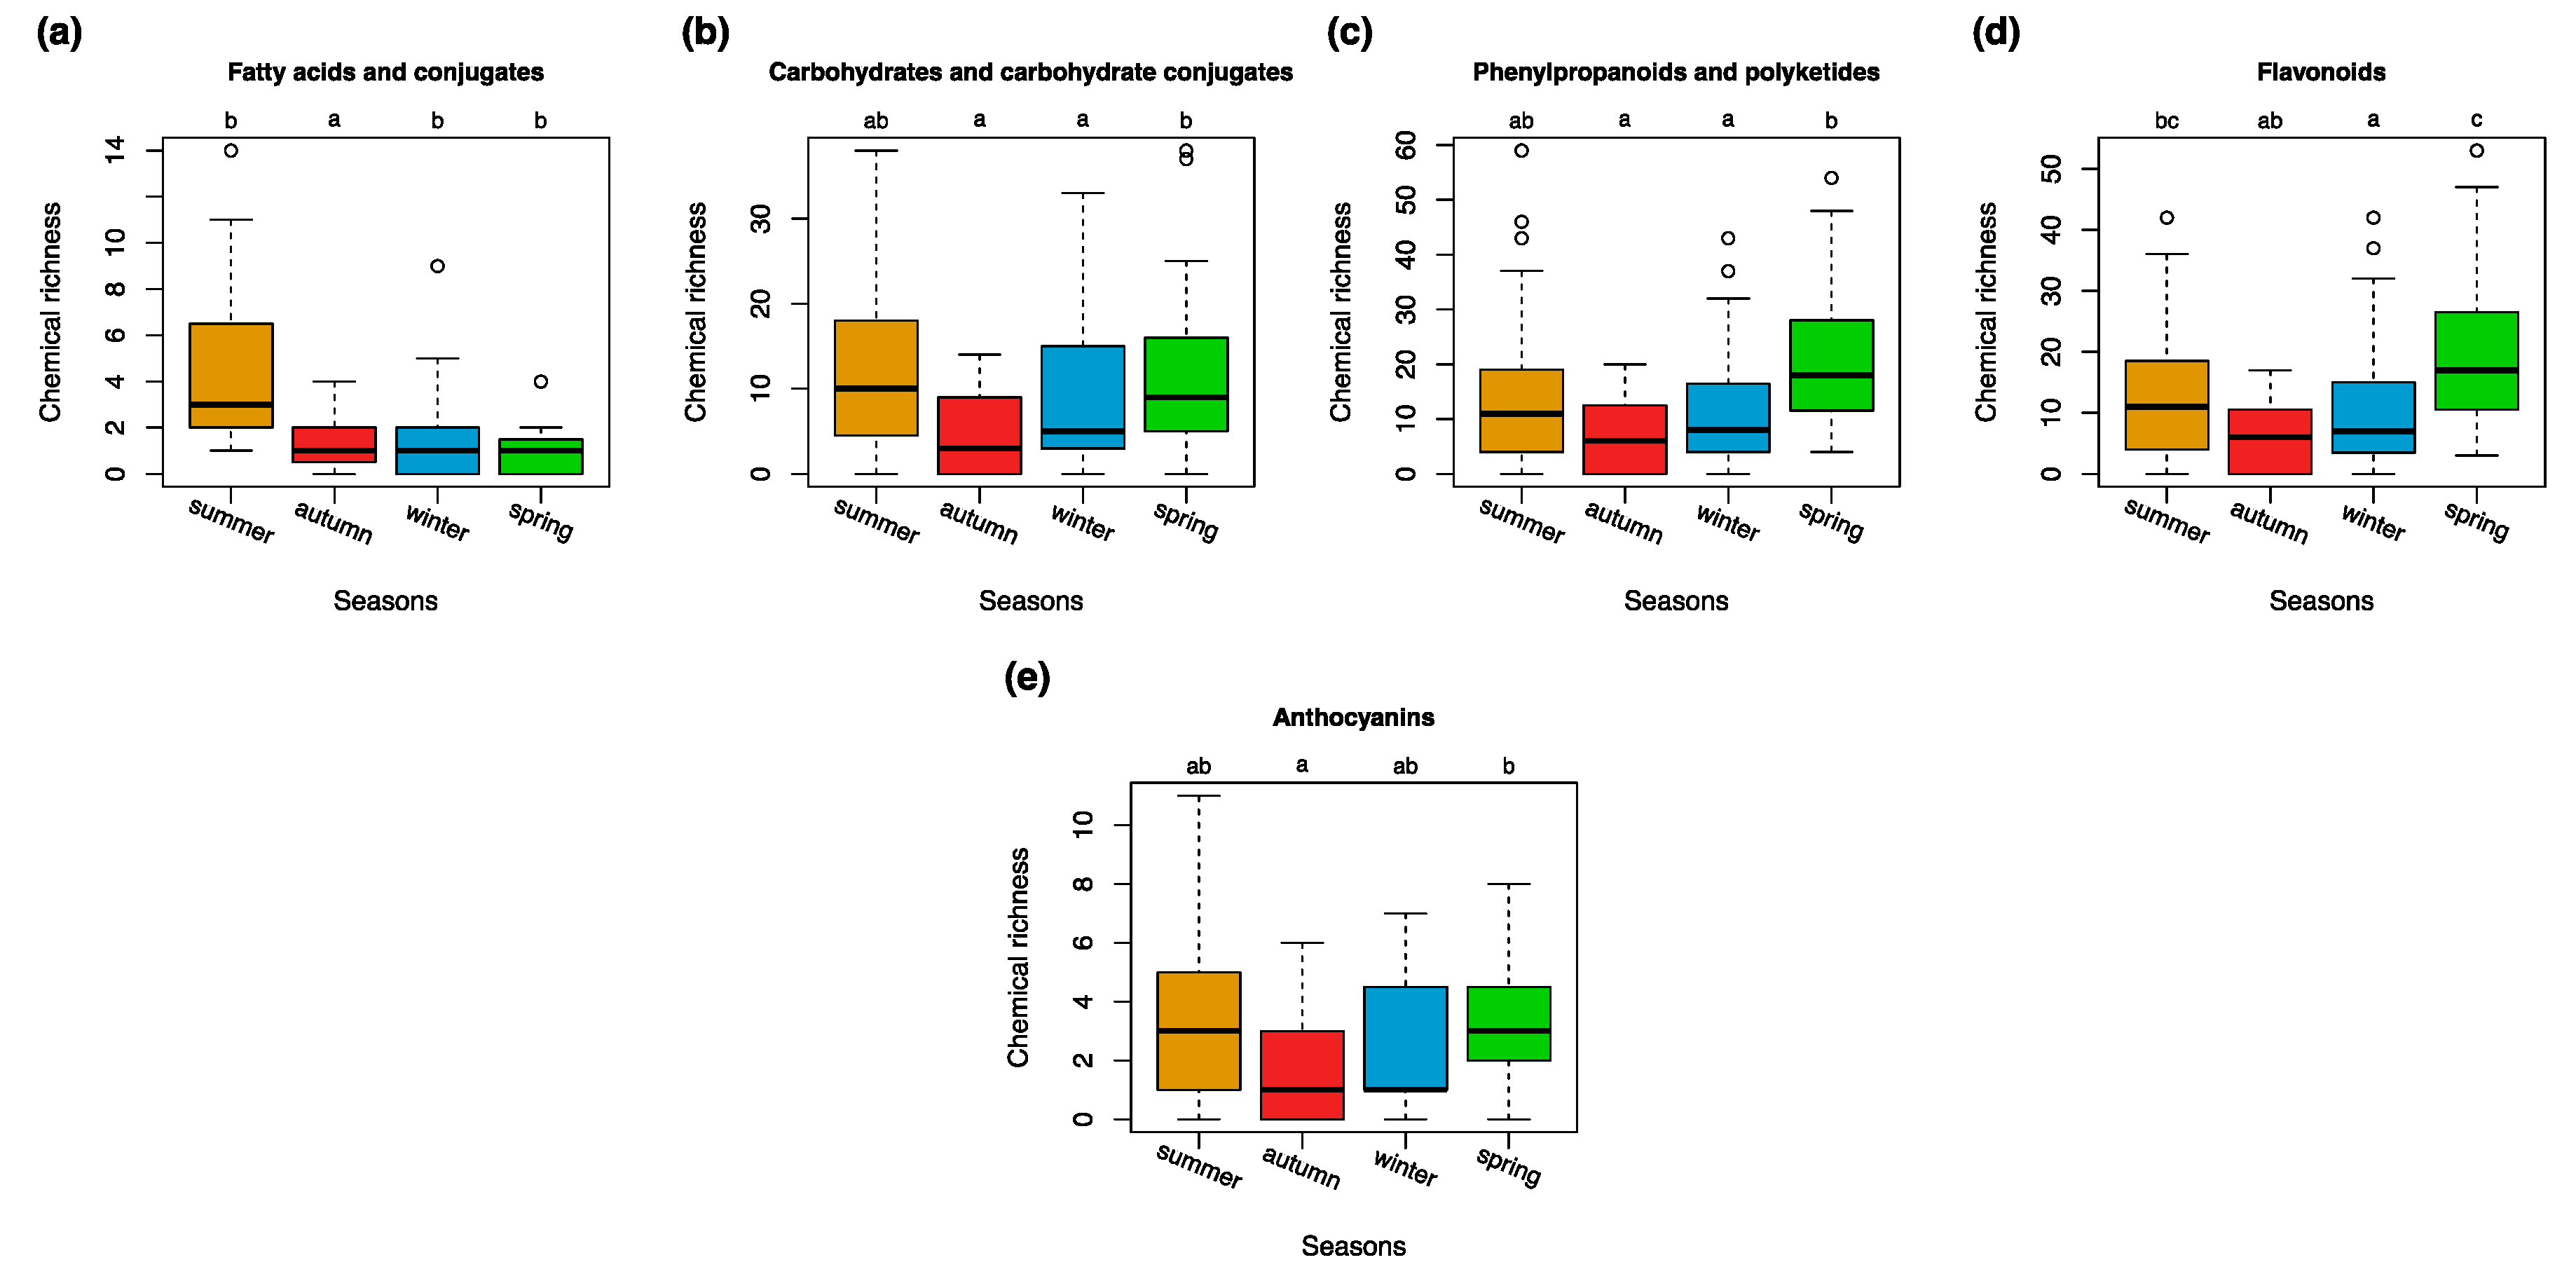
3.3. Seasonal Variations in the Compound Classes

All tested bryophytes produced more compounds in spring and summer than in autumn. This effect was significant (p < 0.05) for fatty acids and conjugates, carbohydrates, and glycosyls, phenylpropanoids and polyketides, flavonoids and anthocyanins (Figure 4, Figure 5, Figure S5). The classes of steroids and steroid derivatives, lactones and sesquiterpenoids were enriched in the winter season (Figure S5c,g,e).

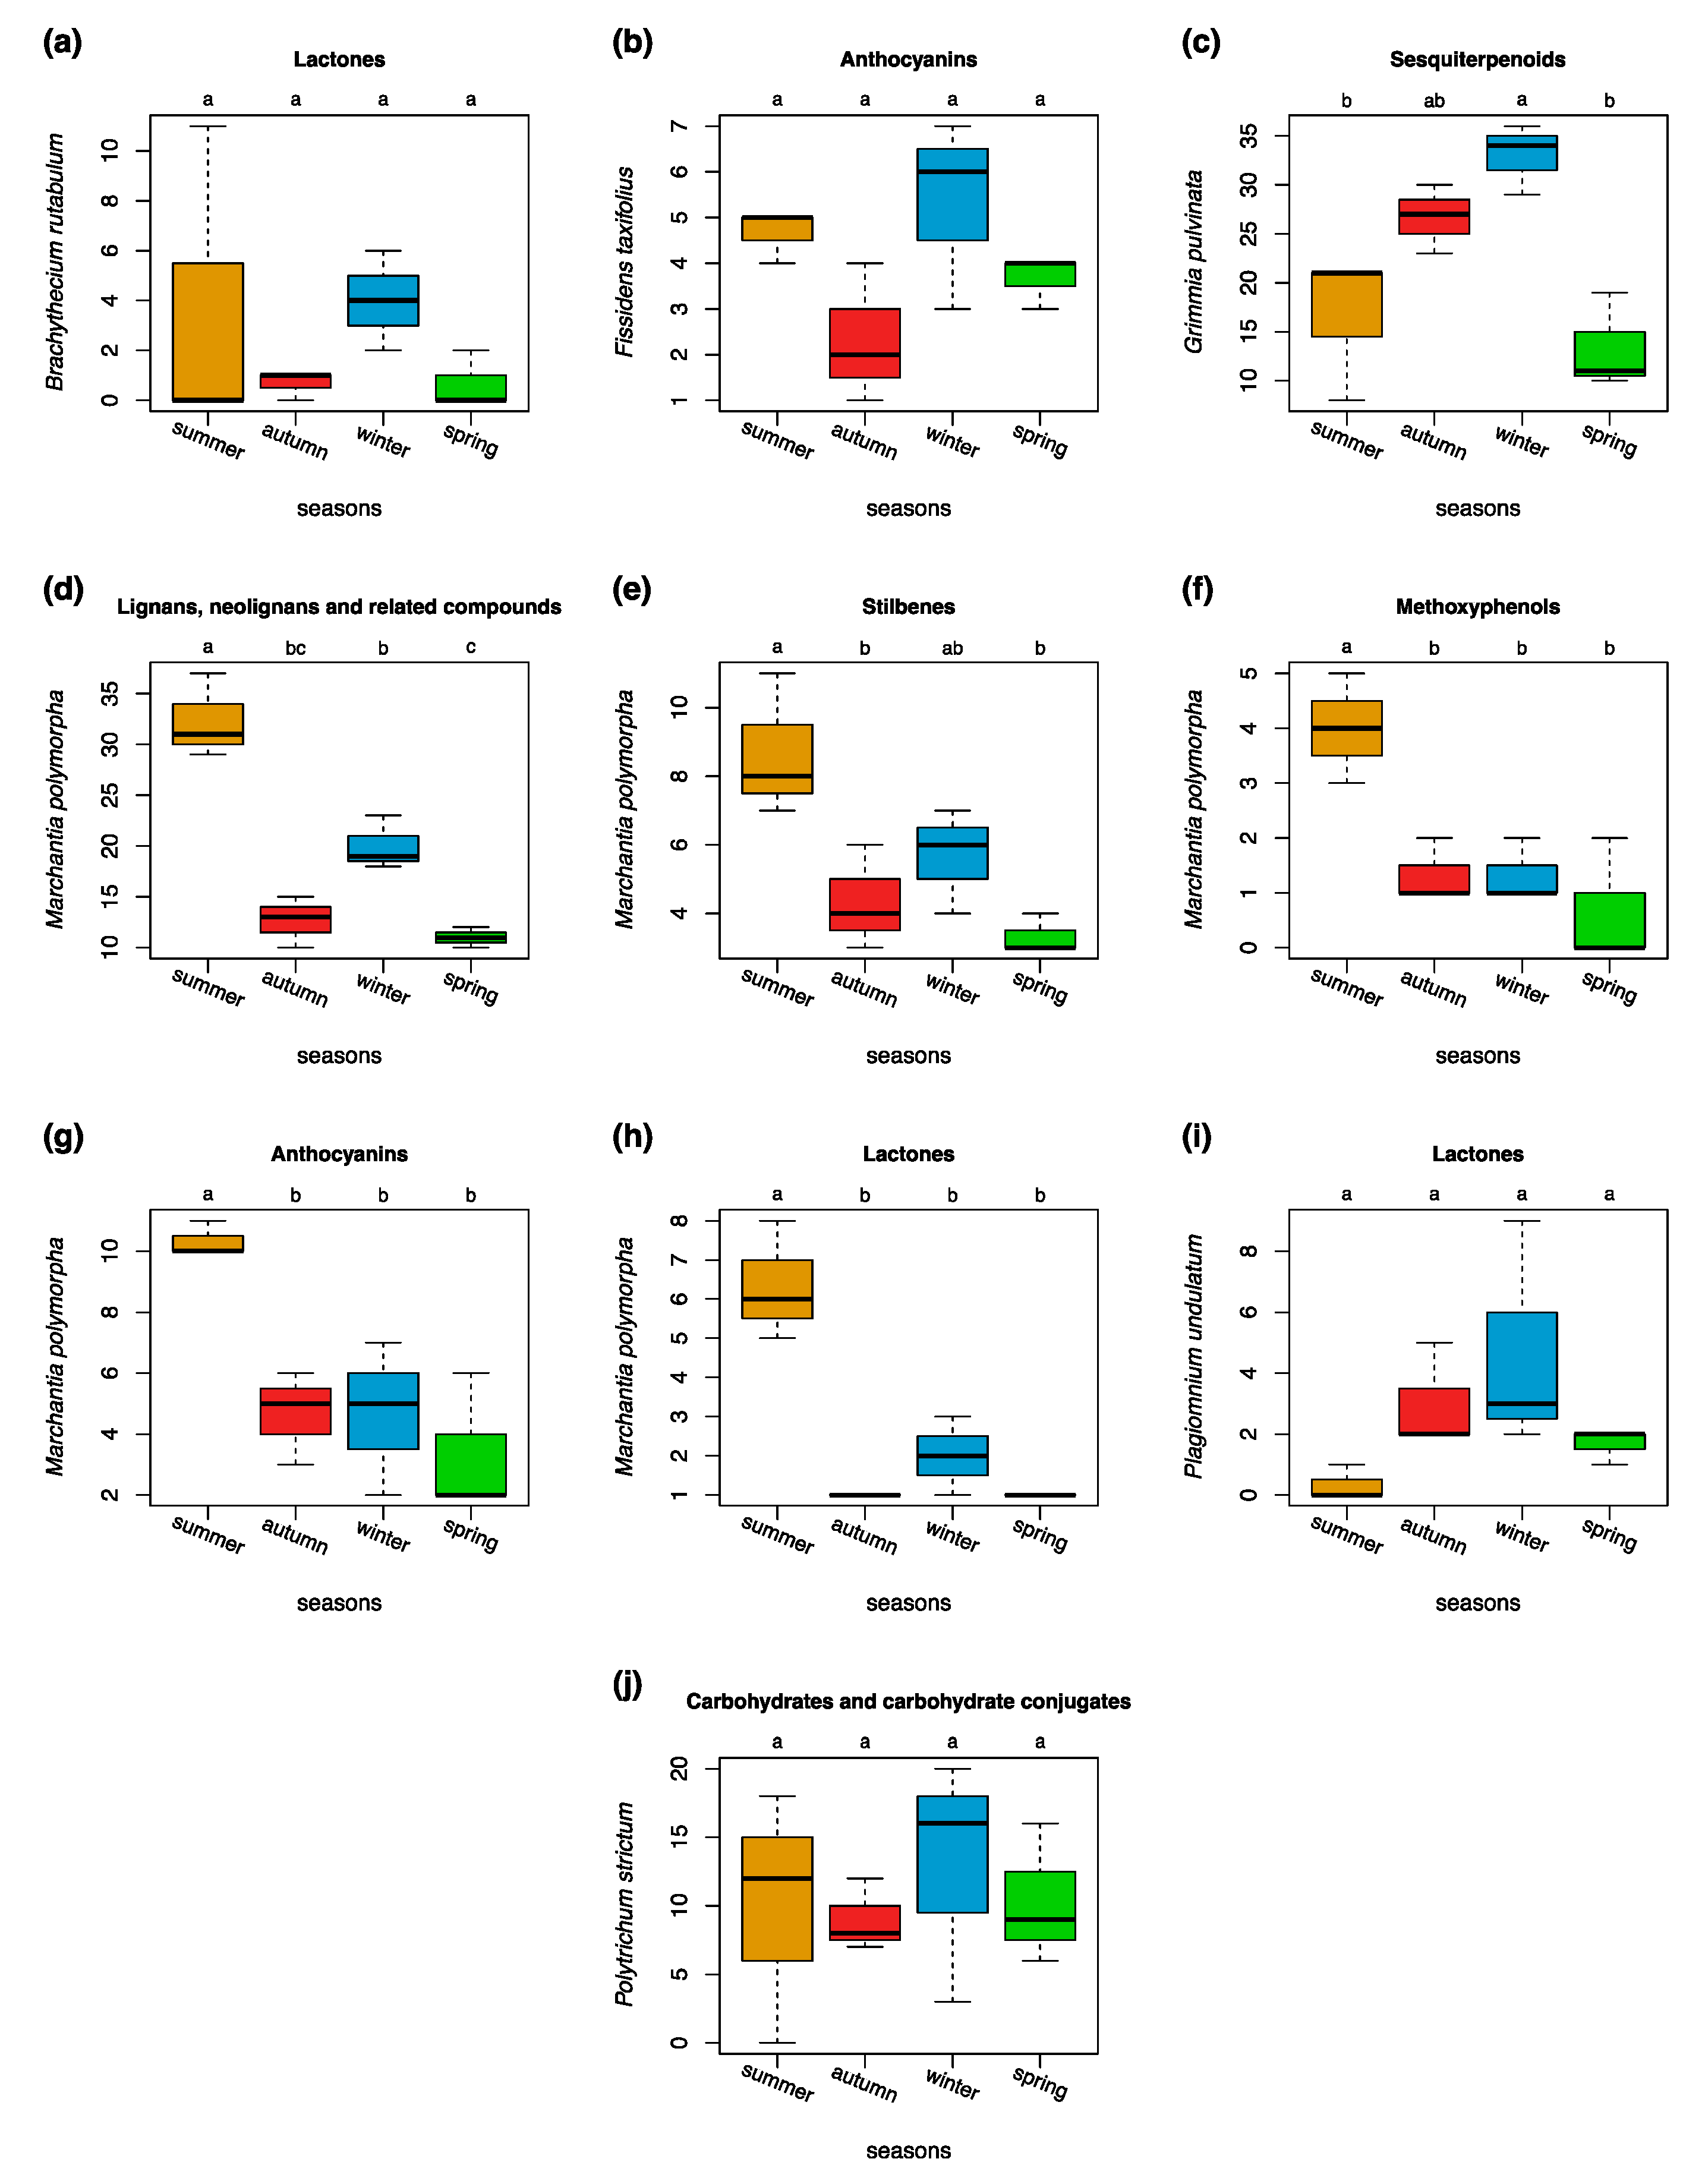
3.4. Seasonal Variations in Compound Classes in Different Bryophyte Species

Variation partitioning showed that the study factor species explained 50% and the factor seasons accounted for 5% of the variations in the compound classes matrix (Figure S3b). Thus, species responded very specific to seasonal variations. The species M. polymorpha, P. undulatum, and P. strictum showed the largest seasonal variations in compound classes (Table S1). Acrocarpous species were more variable when compared to pleurocarpous species. Full material is available in the supplement in Figure S6.
The chemical richness of many compound classes was increased in spring and summer and reduced in the autumn season for most of the species (see Figure S6 for full details). Some compound classes were enriched in winter for acrocarpous species and the pleurocarpous B. rutabulum (Figure S6).

4. Discussion

Formerly, the determination of compound classes required the use of elaborate analytical methods which often take biochemists months of work by the combination of chromatographic separation techniques and different extraction methods to characterize the different sets of compound classes [12,26,29,57,58,59]. Our proposed automatic framework combines a data dependent acquisition mass spectrometry (DDA-MS) analysis of methanolic extracts with in silico compound classification. The analytical MS2 pipeline is able to capture most semi-polar secondary metabolites. Our compound classification method offers to acquire the data more quickly by avoiding the complex biochemical preparation procedures. In the following, we discuss how such a framework will augment the generalization and identification of molecular patterns in ecological contexts.
Vascular plants show strong differences in metabolic responses to above- and below-ground pathogens and environmental factors [60]. To our knowledge, it has never been tested whether bryophytes differ in their above- and below-ground metabolic responses to pathogens and environmental fluctuations; and whether different sets of compounds and compound classes can be associated [61]. In our experiment, we sampled the gametophytes of bryophytes without rhizoids and without reproductive parts. As bryophytes are closely associated with the substrate due to their stature, it is likely that even in metabolite profiles of above-ground parts many secondary metabolites are present that indicate ecological interactions that occur below-ground [62,63,64]. Future studies should also measure soil-related properties such as nutrient levels (C,N) and may even record soil microbiota by a metagenomics approach [65,66]. This wealth of information is perfectly suited to not just characterize several organismal interactions (such as the responses of bryophytes to pathogens, herbivores and microbials) but also to explore the metabolic differences and life strategies of bryophytes of type pioneers vs. stayers [67] and to identify metabolites that are associated with C-, S-, or R-selection strategies [68].
The results of our study agree with other studies that liverworts produce more compounds than mosses; and that this is not due to the fact that liverworts are biochemically better studied than mosses [5,8]. However, our study additionally showed great variation in chemodiversity. The most abundant metabolites are related to species-specific effects that are produced to sustain the homeostasis of the metabolism [69]. We found an estimate of 1/3 of compound numbers that are directly related to environmental changes such as seasonal variations but they only make approx. 1/10 of the overall peak intensity. This suggests that many metabolic compounds are highly specific and are only produced when needed, e.g., upon environmental fluctuation. This explains why many metabolites were only present in small intensities in the metabolite profiles [26]. Due to the nature of the DDA-MS method which preferentially captures the most abundant chemical features, this can explain the low correlation of ecological characteristics with compound classes in our study [26]. Future studies can improve this limitation by utilizing instruments with higher sensitivity which allow to further decrease the fragmentation intensity threshold. This will result in longer measurements and more complex MS2 profiles, but improves the likelihood that more specific secondary metabolites are detected [26].
Bryophytes realize different adaptation strategies to seasonal variations. The responses of bryophytes are likely the result of both their evolutionary history and of adaptations to the local environment. The response of pleurocarpous species was more homogeneous than for acrocarpous species which may be related to their closer phylogenetic relatedness [4,70].
The large chemical richness and contrasting chemodiversity of Marchantia polymorpha explained its most basal phylogenetic position and the largest distance of the species in both the chemotaxonomic and the phylogenetic tree [2]. Our results further support that M. polymorpha produced many characteristic neolignans (bis-bibenzyls), stilbenes, methoxyphenols, and anthocyanins; and which have only been found in liverworts [8]. Sesquiterpenoids, flavonoids, glycosides, steroids, and lactones were among the most characteristic compound classes in M. polymorpha, which explain the strong phylogenetic signal.
Our results show that the different order of the acrocarpous Polytrichum strictum in the chemotaxonomic tree is likely due to the many unique chemical features with relatively low peak intensities in the metabolite profiles that caused the DDA-MS to pick fewer features for MS2 fragmentation (especially fewer lipids and lipid-like molecules). Nevertheless, the chemotaxonomic distance of P. strictum could also be attributed to a different distribution of compounds in the classes of sesquiterpenoids and phenylpropanoids and the presence of some unique methoxyphenols, anthocyanins, and carbohydrates (including monosaccharides and glycosyl compounds) which were enriched in the winter season. This may be an adaptation of the species to wet habitat conditions.
The results of this study showed that seasonal variations in compound classes were strongly species-specific. The species M. polymorpha, P. undulatum, and P. strictum showed the largest seasonal variations which was likely due to increased bioactivity in the growing seasons and their overall contrasting chemodiversity. Among the best studied compound classes in bryophytes and plants in general are terpenoids, aromatic compounds such as lignans, phenylpropanoids such as flavonoids and anthocyanins, and glycosylic compounds (including flavonoid glycosides) [8,9,71]. Many of the compounds belonging to these classes have been attributed to organismal interactions such as defense against pathogens and herbivores [5,71]. As not all biological antagonists are affected by individual metabolites in the same way, this has led to the chemical richness in secondary metabolites that exist today within plant species [26]. It is thus reasonable to explore whether ecological patterns can be generalized to individual compound classes.
In almost all tested bryophyte species, the number of flavonoids was enriched in spring (except for M. polymorpha which produced most in summer). It is widely known that flavonoids constitute pigments which are functioning as light-protection agents in plants [72,73]. As sunlight increases in spring, bryophytes likely produce flavonoids that protect them from excessive light and reactive oxygen species (ROS) which are captured by several types of flavonoids and also anthocyanins. This explains the larger numbers measured in the growing seasons in our study. Flavonoids also regulate enzyme activity and are involved in signal transductions in plant cells [72,74]. In bryophytes, several flavonoids have also been described to play a role in pathogen defense, hence their broad antimicrobial and antifungal bioactivity [8].
The DDA-MS method only detected few methoxyphenols and lactones that were among the most abundant compounds which have otherwise been described to be more common in bryophytes [8]. Methoxyphenols and lactones show bioactivity against pathogens and herbivores [5]. The tested bryophytes produced more compounds of these groups during the growing seasons. Thus, these compounds may be used as biomarkers for organismal interactions of bryophytes. Further investigation is needed.
Similarly, few phenylpropanoid derived cinnamic acids were detected. However, only few cinnamic acids occur naturally. In vascular plants, cinnamic acids are well-known antioxidants [75]. Due to their high redox potential they are also involved in responses against biological antagonists such as pathogens [76]. In bryophytes, however, cinnamic acids may primarily be involved in growth as hydroxylated constituents are part of lignin-like structures (‘proto-lignin’) that have similar functions as in vascular plants and are similarly located in the conducting cell wall tissue of some bryophytes [77,78]. Hydroxylated cinnamic acids as part of proto-lignin are considered to be the building blocks of functional equivalents to phloem in bryophytes called hydroids or leptoids [1,79]. This may also explain the higher peak intensity in the growing seasons in our study. Here, metabolomics can assist to find corresponding genes in bryophytes [78].
Bryophytes experience cold stress during winter when temperatures are near or below the freezing point. In our study, winder sampling was performed when bryophytes were covered with snow which may have protected them from lowest temperatures [33]. It has been reported that bryophytes are very similar to vascular plants in their response to cold stress. They modify their metabolome (“metabolic reprogramming”) to prevent mechanical damage to the cells [80,81]. Normally, vascular plants upregulate their carbohydrate metabolism in low temperature which results in the production of a variety of different sugars and glycosyl compounds. However, during winter, we detected significantly (p < 0.05) more carbohydrates and glycosyl compounds only in the species P. strictum and F. taxifolius (Figure 6j, Figure S6). Bryophytes may have realized additional adaptation strategies over the production of sugars and other carbohydrates to cold stress and freezing [80]. For F. taxifolius and P. strictum we detected that they produced more anthocyanins in winter (Figure 6b, Figure S6). Anthocyanins were frequently described to play a protective role against low temperatures in vascular plants [82,83]. The species B. rutabulum and P. undulatum produced the most lactones in winter (Figure 6a,i). Sesquiterpene lactones can form covalent bonds with proteins and can protect the DNA under physiologically unfavorable conditions [84]. Significantly (p < 0.05) more sesquiterpenoids were measured in winter for R. squarrosum, P. undulatum, and G. pulvinata (Figure 6c, Figure S6). Sesquiterpenoids in M. polymorpha were also increased in winter when compared to autumn and spring. Thus, bryophytes may survive extended periods of cold stress by the enhanced production of some terpenoids. Only few studies have reported terpenes to play a role during cold stress [85,86,87]. In this regard, bryophytes may be different to vascular plants. Our results could be confounded by other entities belonging to the same compound classes to be produced as part of desiccation tolerance [22,23,88,89]. Nevertheless, this finding warrants further investigation in bryophytes.
For compound annotation and classification, spectral libraries such as the WEIZMASS spectral library [90], GNPS [91], or MassBank [41] are necessary that contain a magnitude of MS2 fragment spectra (for an overview and comparison of spectral libraries, see the review [92]). However, many of these libraries are biased towards humans or model-species such as Arabidopsis thaliana. On one hand, some compound classes where there is a lot of research can be overrepresented in libraries. On the other hand, even specialized libraries often do not contain information on non-model species typically used in ecometabolomics [13,93]. Furthermore, not all spectral libraries are also openly available. These challenges often impede both the classification and the identification in ecometabolomics due to the lack of constitutive reference compound spectra. This is likely an explanation why our classifier could not assign chemical entities into the relatively common classes of diterpenoids, benzene and substituted derivatives. To build classifiers, we used fragment spectra from the openly available database MassBank [41]. However, as MassBank did not contain spectra of (neo)lignans, bis-bibenzyls, and only few sesquiterpenoids, we complemented the library with manually curated spectra from known compounds of M. polymorpha (To this end, a pull request has been created in the MassBank GitHub repository: https://github.com/MassBank/MassBank-data/pull/78) [41,93]. To promote ecometabolomics, we want to raise the awareness of spectral data in open libraries and want to encourage fellow researchers to contribute MS2 spectra of bryophytes or other non-model organisms.
To assess the chemical diversity and its ecological relevance it is necessary to delve into the “dark matter” to explore the magnitude of completely novel and unknown natural products and to relate them to ecological functioning [26,34]. Our study presents a novel methodology to automatically analyze the most abundant secondary metabolites based on in silico compound classification. We present a methodological framework to automate compound classification which facilitates complex biochemical analyses and enables interpretation based on ecological parameters and classification to be used in hypotheses generation. In order to be reused by future ecometabolomics studies we made the representative dataset available as MTBLS709 in the MetaboLights repository [56] and also the computational code which can be used in other studies. We inspire future ecometabolomics studies to adopt and improve our framework to allow more detailed insights into the ecological roles of biochemical constituents of bryophytes.

Data Accessibility

Raw Metabolite profiles, metabolite feature matrices, MS2 fragment spectra, classifiers and meta-data: MetaboLights MTBLS709 (https://www.ebi.ac.uk/metabolights/MTBLS709). Computational code to reproduce the results of this study. Version 1.1. Zenodo doi:10.5281/zenodo.3478217.

Supplementary Materials

The following are available online at https://www.mdpi.com/2218-1989/9/10/222/s1, Figure S1: Comparison of three diversity indices of the bryophyte species, Figure S2: Comparison of three indices that explain the biochemical diversity of the bryophytes with regard to the four seasons, Figure S3: Variation partitioning of the study factors species and seasons of the (a) MS1 feature matrix, (b) richness of chemical entities in the classified compound classes, Figure S4: Richness of chemical entities for the different bryophyte species within the chemical classes of (a) Lipids and lipid-like molecules, (b) Fatty acids and conjugates, (c) Steroids and steroid derivatives, (d) Prenol lipids, (e) Sesquiterpenoids, (f) Lignans, neolignans and related compounds, (g) Lactones, (h) Phenylpropanoids and polyketides, (i) Cinnamic acids, (j) Stilbenes, (k) Methoxyphenols, (l) Flavonoids, (m) Flavones, (n) Flavans, (o) Flavonoid glycosides, (p) Anthocyanins, (q) Carbohydrates and carbohydrate conjugates, (r) Monosaccharides, (s) Disaccharides, (t) Glycosyl compounds, (u) Alkaloids and derivatives, (v) Amino acids, (w) Peptides, and (x) Nucleosides, nucleotides, and analogues, Figure S5: Seasonal variations in the chemical richness of the tested bryophyte species within the chemical classes of (a) Lipids and lipid-like molecules, (b) Fatty acids and conjugates, (c) Steroids and steroid derivatives, (d) Prenol lipids, (e) Sesquiterpenoids, (f) Lignans, neolignans and related compounds, (g) Lactones, (h) Phenylpropanoids and polyketides, (i) Cinnamic acids, (j) Stilbenes, (k) Methoxyphenols, (l) Flavonoids, (m) Flavones, (n) Flavans, (o) Flavonoid glycosides, (p) Anthocyanins, (q) Carbohydrates and carbohydrate conjugates, (r) Monosaccharides, (s) Disaccharides, (t) Glycosyl compounds, (u) Alkaloids and derivatives, (v) Amino acids, (w) Peptides, and (x) Nucleosides, nucleotides, and analogues, Figure S6: Seasonal variations in compound classes of the tested bryophyte species, Figure S7: Quality control as employed by the mzQuality workflow, Figure S8: Total ion chromatograms for the nine tested species grouped by seasons, Table S1: Explained seasonal variation in the compound classes by the different bryophyte species, Table S2: Influence of ecological characteristics on the matrix of compound classes.

Author Contributions

K.P.: Design of the experiment, data analysis, writing the first draft manuscript. H.T.: Classification of compound classes, sunburst plot function. S.D.: Analytical DDA-MS data acquisition, reference libraries. A.S.D.K., T.H.: Quality control based on mzQuality. S.N.: Supervision and overseeing the quality of the manuscript. All authors contributed to the final version of the manuscript.

Funding

K.P. and H.T. are funded by the German Network for Bioinformatics Infrastructure (de.NBI) and acknowledge BMBF funding under grant number 322031L0107. We further acknowledge support from the Leibniz Association’s Open Access Publishing Fund.

Acknowledgments

We like to thank the Leibniz Foundation for supporting this study and Katrin Franke for correction and advice on natural product chemistry.

Conflicts of Interest

The authors declare no conflict of interest.

References

  1. Goffinet, B.; Shaw, A.J. Bryophyte Biology; Cambridge University Press: Cambridge; NY, USA, 2009; ISBN 978-0-511-45773-9. [Google Scholar]
  2. Bowman, J.L.; Kohchi, T.; Yamato, K.T.; Jenkins, J.; Shu, S.; Ishizaki, K.; Yamaoka, S.; Nishihama, R.; Nakamura, Y.; Berger, F.; et al. Insights into land plant evolution garnered from the Marchantia polymorpha genome. Cell 2017, 171, 287–304. [Google Scholar] [CrossRef] [PubMed]
  3. Qiu, Y.-L.; Li, L.; Wang, B.; Chen, Z.; Knoop, V.; Groth-Malonek, M.; Dombrovska, O.; Lee, J.; Kent, L.; Rest, J.; et al. The deepest divergences in land plants inferred from phylogenomic evidence. Proc. Natl. Acad. Sci. USA 2006, 103, 15511–15516. [Google Scholar] [CrossRef] [PubMed] [Green Version]
  4. Shaw, A.J.; Szovenyi, P.; Shaw, B. Bryophyte diversity and evolution: Windows into the early evolution of land plants. Am. J. Bot. 2011, 98, 352–369. [Google Scholar] [CrossRef] [PubMed]
  5. Asakawa, Y.; Ludwiczuk, A.; Nagashima, F. Phytochemical and biological studies of bryophytes. Phytochemistry 2013, 91, 52–80. [Google Scholar] [CrossRef] [PubMed]
  6. Xie, C.-F.; Lou, H.-X. Secondary metabolites in bryophytes: An ecological aspect. Chem. Biodivers. 2009, 6, 303–312. [Google Scholar] [CrossRef]
  7. Chandra, S.; Chandra, D.; Barh, A.; Pandey, R.K.; Sharma, I.P. Bryophytes: Hoard of remedies, an ethno-medicinal review. J. Tradit. Complement. Med. 2017, 7, 94–98. [Google Scholar] [CrossRef]
  8. Asakawa, Y.; Ludwiczuk, A.; Nagashima, F. (Eds.) Chemical constituents of bryophytes: Bio-and chemical diversity, biological activity, and chemosystematics. In Fortschritte der Chemie Organischer Naturstoffe = Progress in the Chemistry of Organic Natural Products; Springer: Wien, Austria; New York, NY, USA, 2013; ISBN 978-3-7091-1083-6. [Google Scholar]
  9. Ludwiczuk, A.; Asakawa, Y. Bryophytes as a source of bioactive volatile terpenoids—A review. Food Chem. Toxicol. 2019, 132, 110649. [Google Scholar] [CrossRef]
  10. He, X.; Sun, Y.; Zhu, R.-L. The oil bodies of liverworts: Unique and important organelles in land plants. Crit. Rev. Plant Sci. 2013, 32, 293–302. [Google Scholar] [CrossRef]
  11. Cornelissen, J.H.C.; Lang, S.I.; Soudzilovskaia, N.A.; During, H.J. Comparative cryptogam ecology: A review of bryophyte and lichen traits that drive biogeochemistry. Ann. Bot. 2007, 99, 987–1001. [Google Scholar] [CrossRef]
  12. Klavina, L.; Springe, G.; Nikolajeva, V.; Martsinkevich, I.; Nakurte, I.; Dzabijeva, D.; Steinberga, I. Chemical composition analysis, antimicrobial activity and cytotoxicity screening of moss extracts (moss phytochemistry). Molecules 2015, 20, 17221–17243. [Google Scholar] [CrossRef]
  13. Peters, K.; Worrich, A.; Weinhold, A.; Alka, O.; Balcke, G.; Birkemeyer, C.; Bruelheide, H.; Calf, O.; Dietz, S.; Dührkop, K.; et al. Current challenges in plant eco-metabolomics. Int. J. Mol. Sci. 2018, 19, 1385. [Google Scholar] [CrossRef] [PubMed]
  14. Boch, S.; Prati, D.; Fischer, M. Gastropods slow down succession and maintain diversity in cryptogam communities. Ecology 2016, 97, 2184–2191. [Google Scholar] [CrossRef] [PubMed] [Green Version]
  15. Rempt, M.; Pohnert, G. Novel acetylenic oxylipins from the moss Dicranum scoparium with antifeeding activity against herbivorous slugs. Angew. Chem. Int. Ed. 2010, 49, 4755–4758. [Google Scholar] [CrossRef] [PubMed]
  16. Donath, T.W.; Eckstein, R.L. Effects of bryophytes and grass litter on seedling emergence vary by vertical seed position and seed size. Plant Ecol. 2010, 207, 257–268. [Google Scholar] [CrossRef]
  17. Michel, P.; Burritt, D.J.; Lee, W.G. Bryophytes display allelopathic interactions with tree species in native forest ecosystems. Oikos 2011, 120, 1272–1280. [Google Scholar] [CrossRef]
  18. Turetsky, M.R. The role of bryophytes in carbon and nitrogen cycling. Bryologist 2003, 106, 395–409. [Google Scholar] [CrossRef]
  19. Rousk, K.; Pedersen, P.A.; Dyrnum, K.; Michelsen, A. The interactive effects of temperature and moisture on nitrogen fixation in two temperate-arctic mosses. Theor. Exp. Plant Physiol. 2017, 29, 25–36. [Google Scholar] [CrossRef]
  20. Seppelt, R.D.; Downing, A.J.; Deane-Coe, K.K.; Zhang, Y.; Zhang, J. Bryophytes within biological soil crusts. In Biological Soil Crusts: An Organizing Principle in Drylands; Weber, B., Büdel, B., Belnap, J., Eds.; Springer International Publishing: Cham, Switzerland, 2016; Volume 226, pp. 101–120. ISBN 978-3-319-30212-6. [Google Scholar]
  21. Mogul, R.; Vaishampayan, P.; Bashir, M.; McKay, C.P.; Schubert, K.; Bornaccorsi, R.; Gomez, E.; Tharayil, S.; Payton, G.; Capra, J.; et al. Microbial community and biochemical dynamics of biological soil crusts across a gradient of surface coverage in the Central Mojave Desert. Front. Microbiol. 2017, 8, 1974. [Google Scholar] [CrossRef]
  22. Proctor, M.C.F.; Oliver, M.J.; Wood, A.J.; Alpert, P.; Stark, L.R.; Cleavitt, N.L.; Mishler, B.D. Desiccation-tolerance in bryophytes: A review. Bryologist 2007, 110, 595–621. [Google Scholar] [CrossRef]
  23. Charron, A.J.; Quatrano, R.S. Between a rock and a dry place: The water-stressed moss. Mol. Plant 2009, 2, 478–486. [Google Scholar] [CrossRef]
  24. Sabovljević, M.S.; Sabovljević, A.D.; Ikram, N.K.K.; Peramuna, A.; Bae, H.; Simonsen, H.T. Bryophytes—An emerging source for herbal remedies and chemical production. Plant Genet. Resour. 2016, 14, 314–327. [Google Scholar] [CrossRef]
  25. Sardans, J.; Peñuelas, J.; Rivas-Ubach, A. Ecological metabolomics: Overview of current developments and future challenges. Chemoecology 2011, 21, 191–225. [Google Scholar] [CrossRef]
  26. van Dam, N.M.; van der Meijden, E. A role for metabolomics in plant ecology. In Annual Plant Reviews Volume 43; Hall, R.D., Ed.; Wiley-Blackwell: Oxford, UK, 2011; pp. 87–107. ISBN 978-1-4443-3995-6. [Google Scholar]
  27. Heinrichs, J.; Anton, H.; Gradstein, S.R.; Mues, R. Systematics of Plagiochila sect. Glaucescentes Carl (Hepaticae) from tropical America: A morphological and chemotaxonomical approach. Plant Syst. Evol. 2000, 220, 115–138. [Google Scholar] [CrossRef]
  28. Wu, C.-L. Chemosystematic correlations of Taiwanese Hepaticae. J. Chin. Chem. Soc. 1992, 39, 655–667. [Google Scholar] [CrossRef]
  29. Maksimova, V.; Klavina, L.; Bikovens, O.; Zicmanis, A.; Purmalis, O. Structural characterization and chemical classification of some bryophytes found in Latvia. Chem. Biodivers. 2013, 10, 1284–1294. [Google Scholar] [CrossRef] [PubMed]
  30. Döll, S.; Arens, N.; Mock, H.-P. Liquid chromatography and liquid chromatograpy-mass spectrometry of plants: Techniques and applications. Encycl. Anal. Chem. Appl. Theory Instrum. 2019. [Google Scholar] [CrossRef]
  31. Allard, P.-M.; Genta-Jouve, G.; Wolfender, J.-L. Deep metabolome annotation in natural products research: Towards a virtuous cycle in metabolite identification. Curr. Opin. Chem. Biol. 2017, 36, 40–49. [Google Scholar] [CrossRef]
  32. Peters, K.; Gorzolka, K.; Bruelheide, H.; Neumann, S. Seasonal variation of secondary metabolites in nine different bryophytes. Ecol. Evol. 2018, 8, 9105–9117. [Google Scholar] [CrossRef]
  33. Peters, K.; Gorzolka, K.; Bruelheide, H.; Neumann, S. Computational workflow to study the seasonal variation of secondary metabolites in nine different bryophytes. Sci. Data 2018, 5, 180179. [Google Scholar] [CrossRef]
  34. da Silva, R.R.; Dorrestein, P.C.; Quinn, R.A. Illuminating the dark matter in metabolomics. Proc. Natl. Acad. Sci. USA 2015, 112, 12549–12550. [Google Scholar] [CrossRef] [Green Version]
  35. Wishart, D.S. Computational strategies for metabolite identification in metabolomics. Bioanalysis 2009, 1, 1579–1596. [Google Scholar] [CrossRef] [PubMed]
  36. Ruttkies, C.; Schymanski, E.L.; Wolf, S.; Hollender, J.; Neumann, S. MetFrag relaunched: Incorporating strategies beyond in silico fragmentation. J. Cheminform. 2016, 8, 3. [Google Scholar] [CrossRef] [PubMed]
  37. Dührkop, K.; Shen, H.; Meusel, M.; Rousu, J.; Böcker, S. Searching molecular structure databases with tandem mass spectra using CSI:FingerID. Proc. Natl. Acad. Sci. USA 2015, 112, 12580–12585. [Google Scholar] [CrossRef] [PubMed] [Green Version]
  38. Dührkop, K.; Fleischauer, M.; Ludwig, M.; Aksenov, A.A.; Melnik, A.V.; Meusel, M.; Dorrestein, P.C.; Rousu, J.; Böcker, S. SIRIUS 4: A rapid tool for turning tandem mass spectra into metabolite structure information. Nat. Methods 2019, 16, 299–302. [Google Scholar] [CrossRef] [PubMed]
  39. Hastings, J.; Chepelev, L.; Willighagen, E.; Adams, N.; Steinbeck, C.; Dumontier, M. The chemical information ontology: Provenance and disambiguation for chemical data on the biological semantic web. PLoS ONE 2011, 6, e25513. [Google Scholar] [CrossRef] [PubMed]
  40. Feunang, Y.D.; Eisner, R.; Knox, C.; Chepelev, L.; Hastings, J.; Owen, G.; Fahy, E.; Steinbeck, C.; Subramanian, S.; Bolton, E.; et al. ClassyFire: Automated chemical classification with a comprehensive, computable taxonomy. J. Cheminform. 2016, 8, 61. [Google Scholar] [CrossRef] [PubMed]
  41. Horai, H.; Arita, M.; Kanaya, S.; Nihei, Y.; Ikeda, T.; Suwa, K.; Ojima, Y.; Tanaka, K.; Tanaka, S.; Aoshima, K.; et al. MassBank: A public repository for sharing mass spectral data for life sciences. J. Mass Spectrom. 2010, 45, 703–714. [Google Scholar] [CrossRef]
  42. Meier, R.; Ruttkies, C.; Treutler, H.; Neumann, S. Bioinformatics can boost metabolomics research. J. Biotechnol. 2017, 261, 137–141. [Google Scholar] [CrossRef]
  43. Hastings, J.; Owen, G.; Dekker, A.; Ennis, M.; Kale, N.; Muthukrishnan, V.; Turner, S.; Swainston, N.; Mendes, P.; Steinbeck, C. ChEBI in 2016: Improved services and an expanding collection of metabolites. Nucleic Acids Res. 2016, 44, D1214–D1219. [Google Scholar] [CrossRef]
  44. Tautenhahn, R.; Bottcher, C.; Neumann, S. Highly sensitive feature detection for high resolution LC/MS. BMC Bioinform. 2008, 9, 504. [Google Scholar] [CrossRef]
  45. Kuhl, C.; Tautenhahn, R.; Böttcher, C.; Larson, T.R.; Neumann, S. CAMERA: An integrated strategy for compound spectra extraction and annotation of liquid chromatography/mass spectrometry data sets. Anal. Chem. 2012, 84, 283–289. [Google Scholar] [CrossRef] [PubMed]
  46. Hill, M.O. Diversity and evenness: A unifying notation and its consequences. Ecology 1973, 54, 427–432. [Google Scholar] [CrossRef]
  47. Washington, H.G. Diversity, biotic and similarity indices. Water Res. 1984, 18, 653–694. [Google Scholar] [CrossRef]
  48. Kind, T.; Tsugawa, H.; Cajka, T.; Ma, Y.; Lai, Z.; Mehta, S.S.; Wohlgemuth, G.; Barupal, D.K.; Showalter, M.R.; Arita, M.; et al. Identification of small molecules using accurate mass MS/MS search. Mass Spectrom. Rev. 2018, 37, 513–532. [Google Scholar] [CrossRef]
  49. Treutler, H.; Tsugawa, H.; Porzel, A.; Gorzolka, K.; Tissier, A.; Neumann, S.; Balcke, G.U. Discovering regulated metabolite families in untargeted metabolomics studies. Anal. Chem. 2016, 88, 8082–8090. [Google Scholar] [CrossRef]
  50. Keilwagen, J.; Grosse, I.; Grau, J. Area under precision–recall curves for weighted and unweighted data. PLoS ONE 2014, 9, e92209. [Google Scholar] [CrossRef]
  51. Grau, J.; Grosse, I.; Keilwagen, J. PRROC: Computing and visualizing precision–recall and receiver operating characteristic curves in R. Bioinformatics 2015, 31, 2595–2597. [Google Scholar] [CrossRef]
  52. Boyd, K.; Eng, K.H.; Page, C.D. Area under the precision–recall curve: Point estimates and confidence intervals. In Advanced Information Systems Engineering; Salinesi, C., Norrie, M.C., Pastor, Ó., Eds.; Springer: Berlin/Heidelberg, Germany, 2013; Volume 7908, pp. 451–466. ISBN 978-3-642-38708-1. [Google Scholar]
  53. Saito, T.; Rehmsmeier, M. The precision–recall plot is more informative than the ROC plot when evaluating binary classifiers on imbalanced datasets. PLoS ONE 2015, 10, e0118432. [Google Scholar] [CrossRef]
  54. Hartley, S.; Harris, R.; Lester, P.J. Quantifying uncertainty in the potential distribution of an invasive species: Climate and the Argentine ant: Quantifying uncertainty in range map models. Ecol. Lett. 2006, 9, 1068–1079. [Google Scholar] [CrossRef]
  55. Legendre, P.; Legendre, L. Numerical ecology. In Developments in Environmental Modelling, 3rd ed.; Elsevier: Amsterdam, The Netherlands, 2012; ISBN 978-0-444-53868-0. [Google Scholar]
  56. Haug, K.; Salek, R.M.; Conesa, P.; Hastings, J.; de Matos, P.; Rijnbeek, M.; Mahendraker, T.; Williams, M.; Neumann, S.; Rocca-Serra, P.; et al. MetaboLights—An open-access general-purpose repository for metabolomics studies and associated meta-data. Nucleic Acids Res. 2013, 41, D781–D786. [Google Scholar] [CrossRef]
  57. Fiehn, O. Metabolomics—The link between genotypes and phenotypes. In Functional Genomics; Town, C., Ed.; Springer: Dordrecht, The Netherlands, 2002; pp. 155–171. ISBN 978-94-010-3903-1. [Google Scholar]
  58. van der Hooft, J.J.J.; Wandy, J.; Barrett, M.P.; Burgess, K.E.V.; Rogers, S. Topic modeling for untargeted substructure exploration in metabolomics. Proc. Natl. Acad. Sci. USA 2016, 113, 13738–13743. [Google Scholar] [CrossRef] [PubMed] [Green Version]
  59. Klavina, L. A study on bryophyte chemical composition–search for new applications. Agron. Res. 2015, 13, 969–978. [Google Scholar]
  60. Zuppinger-Dingley, D.; Flynn, D.F.B.; Brandl, H.; Schmid, B. Selection in monoculture vs. mixture alters plant metabolic fingerprints. J. Plant Ecol. 2015, 8, 549–557. [Google Scholar] [CrossRef]
  61. Zvereva, E.L.; Kozlov, M.V. Sources of variation in plant responses to belowground insect herbivory: A meta-analysis. Oecologia 2012, 169, 441–452. [Google Scholar] [CrossRef]
  62. Ghani, N.A.; Ludwiczuk, A.; Ismail, N.H.; Asakawa, Y. Volatile components of the stressed liverwort Conocephalum conicum. Nat. Prod. Commun. 2016, 11, 103–104. [Google Scholar] [CrossRef]
  63. Ludwiczuk, A.; Odrzykoski, I.J.; Asakawa, Y. Identification of cryptic species within liverwort Conocephalum conicum based on the volatile components. Phytochemistry 2013, 95, 234–241. [Google Scholar] [CrossRef]
  64. Thakur, S.; Kapila, S. Seasonal changes in antioxidant enzymes, polyphenol oxidase enzyme, flavonoids and phenolic content in three leafy liverworts. Lindbergia 2017, 5, 39–44. [Google Scholar] [CrossRef] [Green Version]
  65. Roux, S.; Enault, F.; Bronner, G.; Debroas, D. Comparison of 16S rRNA and protein-coding genes as molecular markers for assessing microbial diversity (Bacteria and Archaea) in ecosystems. FEMS Microbiol. Ecol. 2011, 78, 617–628. [Google Scholar] [CrossRef]
  66. Quince, C.; Walker, A.W.; Simpson, J.T.; Loman, N.J.; Segata, N. Shotgun metagenomics, from sampling to analysis. Nat. Biotechnol. 2017, 35, 833–844. [Google Scholar] [CrossRef] [Green Version]
  67. Frisvoll, A.A. Bryophytes of spruce forest stands in Central Norway. Lindbergia 1997, 22, 83–97. [Google Scholar]
  68. Grime, J.P.; Rincon, E.R.; Wickerson, B.E. Bryophytes and plant strategy theory. Bot. J. Linn. Soc. 1990, 104, 175–186. [Google Scholar] [CrossRef]
  69. Nagler, M.; Nägele, T.; Gilli, C.; Fragner, L.; Korte, A.; Platzer, A.; Farlow, A.; Nordborg, M.; Weckwerth, W. Eco-metabolomics and metabolic modeling: Making the leap from model systems in the lab to native populations in the field. Front. Plant Sci. 2018, 9, 1556. [Google Scholar] [CrossRef] [PubMed]
  70. Cole, T.C.H.; Hilger, H.H.; Goffinet, B. Bryophyte Phylogeny Poster (BPP). PeerJ Prepr. 2019. [Google Scholar] [CrossRef]
  71. Mithöfer, A.; Boland, W. Plant defense against herbivores: Chemical aspects. Annu. Rev. Plant Biol. 2012, 63, 431–450. [Google Scholar] [CrossRef]
  72. Petrussa, E.; Braidot, E.; Zancani, M.; Peresson, C.; Bertolini, A.; Patui, S.; Vianello, A. Plant flavonoids—Biosynthesis, transport and involvement in stress responses. Int. J. Mol. Sci. 2013, 14, 14950–14973. [Google Scholar] [CrossRef]
  73. Hernández, I.; van Breusegem, F. Opinion on the possible role of flavonoids as energy escape valves: Novel tools for nature’s Swiss army knife? Plant Sci. 2010, 179, 297–301. [Google Scholar] [CrossRef]
  74. Peer, W.A.; Murphy, A.S. Flavonoids as signal molecules: Targets of flavonoid action. In The Science of Flavonoids; Grotewold, E., Ed.; Springer: New York, NY, USA, 2006; pp. 239–268. ISBN 978-0-387-28821-5. [Google Scholar]
  75. Dixon, R.A. Stress-induced phenylpropanoid metabolism. Plant Cell 1995, 7, 1085–1097. [Google Scholar] [CrossRef]
  76. Sova, M. Antioxidant and antimicrobial activities of cinnamic acid derivatives. Mini Rev. Med. Chem. 2012, 12, 749–767. [Google Scholar] [CrossRef]
  77. Xu, B.; Ohtani, M.; Yamaguchi, M.; Toyooka, K.; Wakazaki, M.; Sato, M.; Kubo, M.; Nakano, Y.; Sano, R.; Hiwatashi, Y.; et al. Contribution of NAC transcription factors to plant adaptation to land. Science 2014, 343, 1505–1508. [Google Scholar] [CrossRef]
  78. Niklas, K.J.; Cobb, E.D.; Matas, A.J. The evolution of hydrophobic cell wall biopolymers: From algae to angiosperms. J. Exp. Bot. 2017, 68, 5261–5269. [Google Scholar] [CrossRef]
  79. Mishler, B.D.; Churchill, S.P. A cladistic approach to the phylogeny of the “bryophytes”. Brittonia 1984, 36, 406–424. [Google Scholar] [CrossRef]
  80. Guy, C.; Kaplan, F.; Kopka, J.; Selbig, J.; Hincha, D.K. Metabolomics of temperature stress. Physiol. Plant. 2008, 132, 220–235. [Google Scholar] [CrossRef] [PubMed]
  81. Kaplan, F.; Kopka, J.; Sung, D.Y.; Zhao, W.; Popp, M.; Porat, R.; Guy, C.L. Transcript and metabolite profiling during cold acclimation of Arabidopsis reveals an intricate relationship of cold-regulated gene expression with modifications in metabolite content: Gene-metabolite linkages at low temperature. Plant J. 2007, 50, 967–981. [Google Scholar] [CrossRef] [PubMed]
  82. Qiu, Z.; Wang, X.; Gao, J.; Guo, Y.; Huang, Z.; Du, Y. The tomato Hoffman’s anthocyaninless gene encodes a bHLH transcription factor involved in anthocyanin biosynthesis that is developmentally regulated and induced by low temperatures. PLoS ONE 2016, 11, e0151067. [Google Scholar] [CrossRef]
  83. Manns, D.; Siricururatana, P.; Padilla-Zakour, O.; Sacks, G. Decreasing pH results in a reduction of anthocyanin coprecipitation during cold stabilization of purple grape juice. Molecules 2015, 20, 556–572. [Google Scholar] [CrossRef]
  84. Wink, M. Evolution of secondary metabolites from an ecological and molecular phylogenetic perspective. Phytochemistry 2003, 64, 3–19. [Google Scholar] [CrossRef]
  85. Copolovici, L.; Kännaste, A.; Pazouki, L.; Niinemets, Ü. Emissions of green leaf volatiles and terpenoids from Solanum lycopersicum are quantitatively related to the severity of cold and heat shock treatments. J. Plant Physiol. 2012, 169, 664–672. [Google Scholar] [CrossRef]
  86. Staudt, M.; Bertin, N.; Frenzel, B.; Seufert, G. Seasonal variation in amount and composition of monoterpenes emitted by young Pinus pinea trees—Implications for emission modeling. J. Atmos. Chem. 2000, 35, 77–99. [Google Scholar] [CrossRef]
  87. Zhang, X.; da Silva, J.A.T.; Niu, M.; Li, M.; He, C.; Zhao, J.; Zeng, S.; Duan, J.; Ma, G. Physiological and transcriptomic analyses reveal a response mechanism to cold stress in Santalum album L. leaves. Sci. Rep. 2017, 7, 42165. [Google Scholar] [CrossRef] [Green Version]
  88. Erxleben, A.; Gessler, A.; Vervliet-Scheebaum, M.; Reski, R. Metabolite profiling of the moss Physcomitrella patens reveals evolutionary conservation of osmoprotective substances. Plant Cell Rep. 2012, 31, 427–436. [Google Scholar] [CrossRef]
  89. Pollastri, S.; Tattini, M. Flavonols: Old compounds for old roles. Ann. Bot. 2011, 108, 1225–1233. [Google Scholar] [CrossRef] [PubMed]
  90. Shahaf, N.; Rogachev, I.; Heinig, U.; Meir, S.; Malitsky, S.; Battat, M.; Wyner, H.; Zheng, S.; Wehrens, R.; Aharoni, A. The WEIZMASS spectral library for high-confidence metabolite identification. Nat. Commun. 2016, 7, 12423. [Google Scholar] [CrossRef] [PubMed]
  91. Wang, M.; Carver, J.J.; Phelan, V.V.; Sanchez, L.M.; Garg, N.; Peng, Y.; Nguyen, D.D.; Watrous, J.; Kapono, C.A.; Luzzatto-Knaan, T.; et al. Sharing and community curation of mass spectrometry data with Global Natural Products Social Molecular Networking. Nat. Biotechnol. 2016, 34, 828–837. [Google Scholar] [CrossRef] [PubMed] [Green Version]
  92. Vinaixa, M.; Schymanski, E.L.; Neumann, S.; Navarro, M.; Salek, R.M.; Yanes, O. Mass spectral databases for LC/MS-and GC/MS-based metabolomics: State of the field and future prospects. TrAC Trends Anal. Chem. 2016, 78, 23–35. [Google Scholar] [CrossRef]
  93. Nakamura, Y.; Afendi, F.M.; Parvin, A.K.; Ono, N.; Tanaka, K.; Morita, A.H.; Sato, T.; Sugiura, T.; Altaf-Ul-Amin, M.; Kanaya, S. KNApSAcK metabolite activity database for retrieving the relationships between metabolites and biological activities. Plant Cell Physiol. 2014, 55, e7. [Google Scholar] [CrossRef] [PubMed]
Figure 1. The sunburst plot shows an overview on the classified compound classes in all of the tested bryophyte species. The membership of chemical entities is aggregated and displayed together with all parent compound classes. The width of a compound class in the plot corresponds to the number of chemical entities assigned to this particular class. Our classifier assigned chemical entities to 24 classes out of 35 predefined classes (Table 1). From a total of 10,436 spectra 201 spectra were not matched into any of the classes. Our classifier did not assign fragment spectra to the classes of monoterpenoids, diterpenoids, triterpenoids, benzene and substituted derivatives, benzoic acids, phthalic acid and derivatives, coumarins and derivatives, biflavonoids and polyflavonoids, oligosaccharides, polysaccharides, organic acids and derivatives.
Metabolites 09 00222 g001
Figure 2. Richness of chemical entities in the different compound classes of the bryophyte species, and chemotaxonomic vs. phylogenetic tree. (a) The heatmap shows the richness of compound classes in the bryophyte species. The intensity of the green color corresponds to the number of chemical entities. The color key represents the legend of the heatmap plot and shows the density distribution of counts throughout the range of values which is represented by white (zero counts) and green (counts per species) colors at a logarithmic scale. (b) Phylogenetic tree showing the phylogenetic relationships of the bryophyte species. Comparison metrics of the chemotaxonomic tree and the phylogenetic tree: Cophenetic correlation = 0.165; Mantel statistic = 0.16; Robinson–Foulds metric = 0.875.
Metabolites 09 00222 g002
Figure 3. Richness of chemical entities of the different bryophyte species within the chosen chemical classes of (a) sesquiterpenoids; (b) flavonoids; (c) glycosyl compounds; (d) anthocyanins; (e) lignans; neolignans, and related compounds; and (f) stilbenes. Differences among groups (letters on the top of the plot) are based on the Tukey HSD post hoc test on a one-way ANOVA. Different letters show significant differences (p < 0.05). n = 12 for each species. Red colors represent acrocarpous mosses. Green colors represent pleurocarpous mosses. A blue color represents liverworts.
Metabolites 09 00222 g003
Figure 4. The heatmap shows the richness in the compound classes and the relationship to the study factor seasons. The intensity of the green color corresponds to the number of chemical entities. The color key represents the legend of the heatmap plot and shows the density distribution of counts throughout the range of values which is represented by white (no counts) and green (many counts) colors at a logarithmic scale.
Metabolites 09 00222 g004
Figure 5. Seasonal variation in the richness of chemical entities (features) within the chosen chemical classes of (a) fatty acids and conjugates, (b) carbohydrates and carbohydrate conjugates, (c) phenylpropanoids and polyketides, (d) flavonoids, and (e) anthocyanins. Differences among groups (letters on the top of the plot) are based on the Tukey HSD post hoc test on a one-way ANOVA. Different letters show significant differences (p < 0.05). n = 27 for each season.
Metabolites 09 00222 g005
Figure 6. Seasonal variations in selected compound classes of selected species. (a) Lactones in B. rutabulum, (b) anthocyanins in F. taxifolius, (c) sesquiterpenoids in G. pulvinata, (d) lignans, neolignans, and related conjugates in M. polymorpha, (e) stilbenes in M. polymorpha, (f) methoxyphenols in M. polymorpha, (g) anthocyanins in M. polymorpha, (h) lactones in M. polymorpha, (i) lactones in P. undulatum, and (j) carbohydrate and carbohydrate conjugates in P. strictum. Differences among groups (letters on the top of the plot) are based on the Tukey HSD post hoc test on a one-way ANOVA. Different letters show significant differences (p < 0.05). n = 27 for each season.
Metabolites 09 00222 g006
Table 1. List of classified compound classes and the corresponding area under precision–recall curve (AUC-PR) and the true positive rate for a fixed false negative rate of 5% (TPR-FNR) determined by our classifier in all of the bryophyte samples. The higher the AUC-PR value the better was the performance of the classifier. Generally, values above 0.5 are considered to be a good performance metric with imbalanced data [53]. The higher the TPR-FNR the larger was for the probability that the classifier assigned chemical entities correctly to a compound class. A value of 0 means for both metrics that the classifier could not assign enough spectra to a particular compound class.
Compound ClassChemOnt IDAUC-PRTPR-FNR
Lipids and lipid-like molecules00000120.3470.257
    Fatty acids and conjugates00002620.1700.357
    Steroids and steroid derivatives00002580.5110.639
    Prenol lipids00002590.1390.375
         Monoterpenoids000154900
         Sesquiterpenoids00015500.1780.667
         Diterpenoids000155100
         Triterpenoids000155300
Benzene and substituted derivatives000017800
    Benzoic acids000256500
    Phthalic acid derivates000110500
Lignans, neolignans, and related compounds00013920.7220.750
Lactones00000500.1330.224
Phenylpropanoids and polyketides00002610.4500.277
    Cinnamic acids00025040.0240.333
    Coumarins and derivatives000014500
    Stilbenes00002530.0280.250
    Methoxyphenols00001900.0850.321
    Flavonoids00003340.5870.656
         Biflavonoids and polyflavonoids000158600
         Flavones00016150.4650.636
         Flavans00003370.0940.429
         Flavonoid glycosides00011110.8160.897
            Anthocyanins00013610.2971.000
Carbohydrates and carbohydrate conjugates00015420.5940.567
    Monosaccharides00015400.3980.490
    Disaccharides00015420.4650.643
    Oligosaccharides000019800
    Polysaccharides000153900
    Glycosyl compounds00021050.6190.598
Alkaloids and derivatives00002790.1920.286
Organic acids and derivatives000026400
    Amino acids00041760.2760.288
    Peptides00003480.0920.200
Nucleotides00002890.3110.583

