Metabolic Effects of Dietary Glycerol Supplementation in Muscle and Liver of European Seabass and Rainbow Trout by 1H NMR Metabolomics

 , , ,
, , ,  ,
, 
Abstract
:
1. Introduction
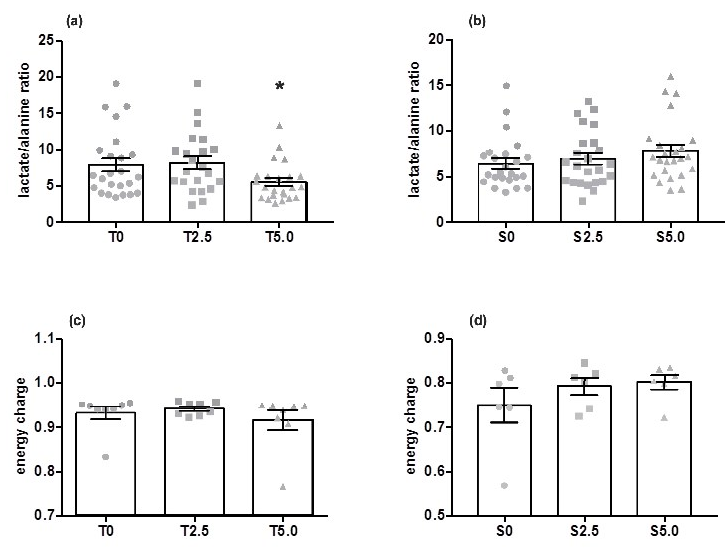
2. Results
2.1. Rainbow Trout
2.2. European Seabass
3. Discussion
3.1. Rainbow Trout
3.2. European Seabass
3.3. Rainbow Trout versus European Seabass
3.4. Relevance in the Aquaculture Context
4. Materials and Methods
4.1. Diet Formulation
4.2. Fish Handling and Sampling: Rainbow Trout
4.3. Fish Handling and Sampling: European Seabass
4.4. Tissue Metabolite Extraction
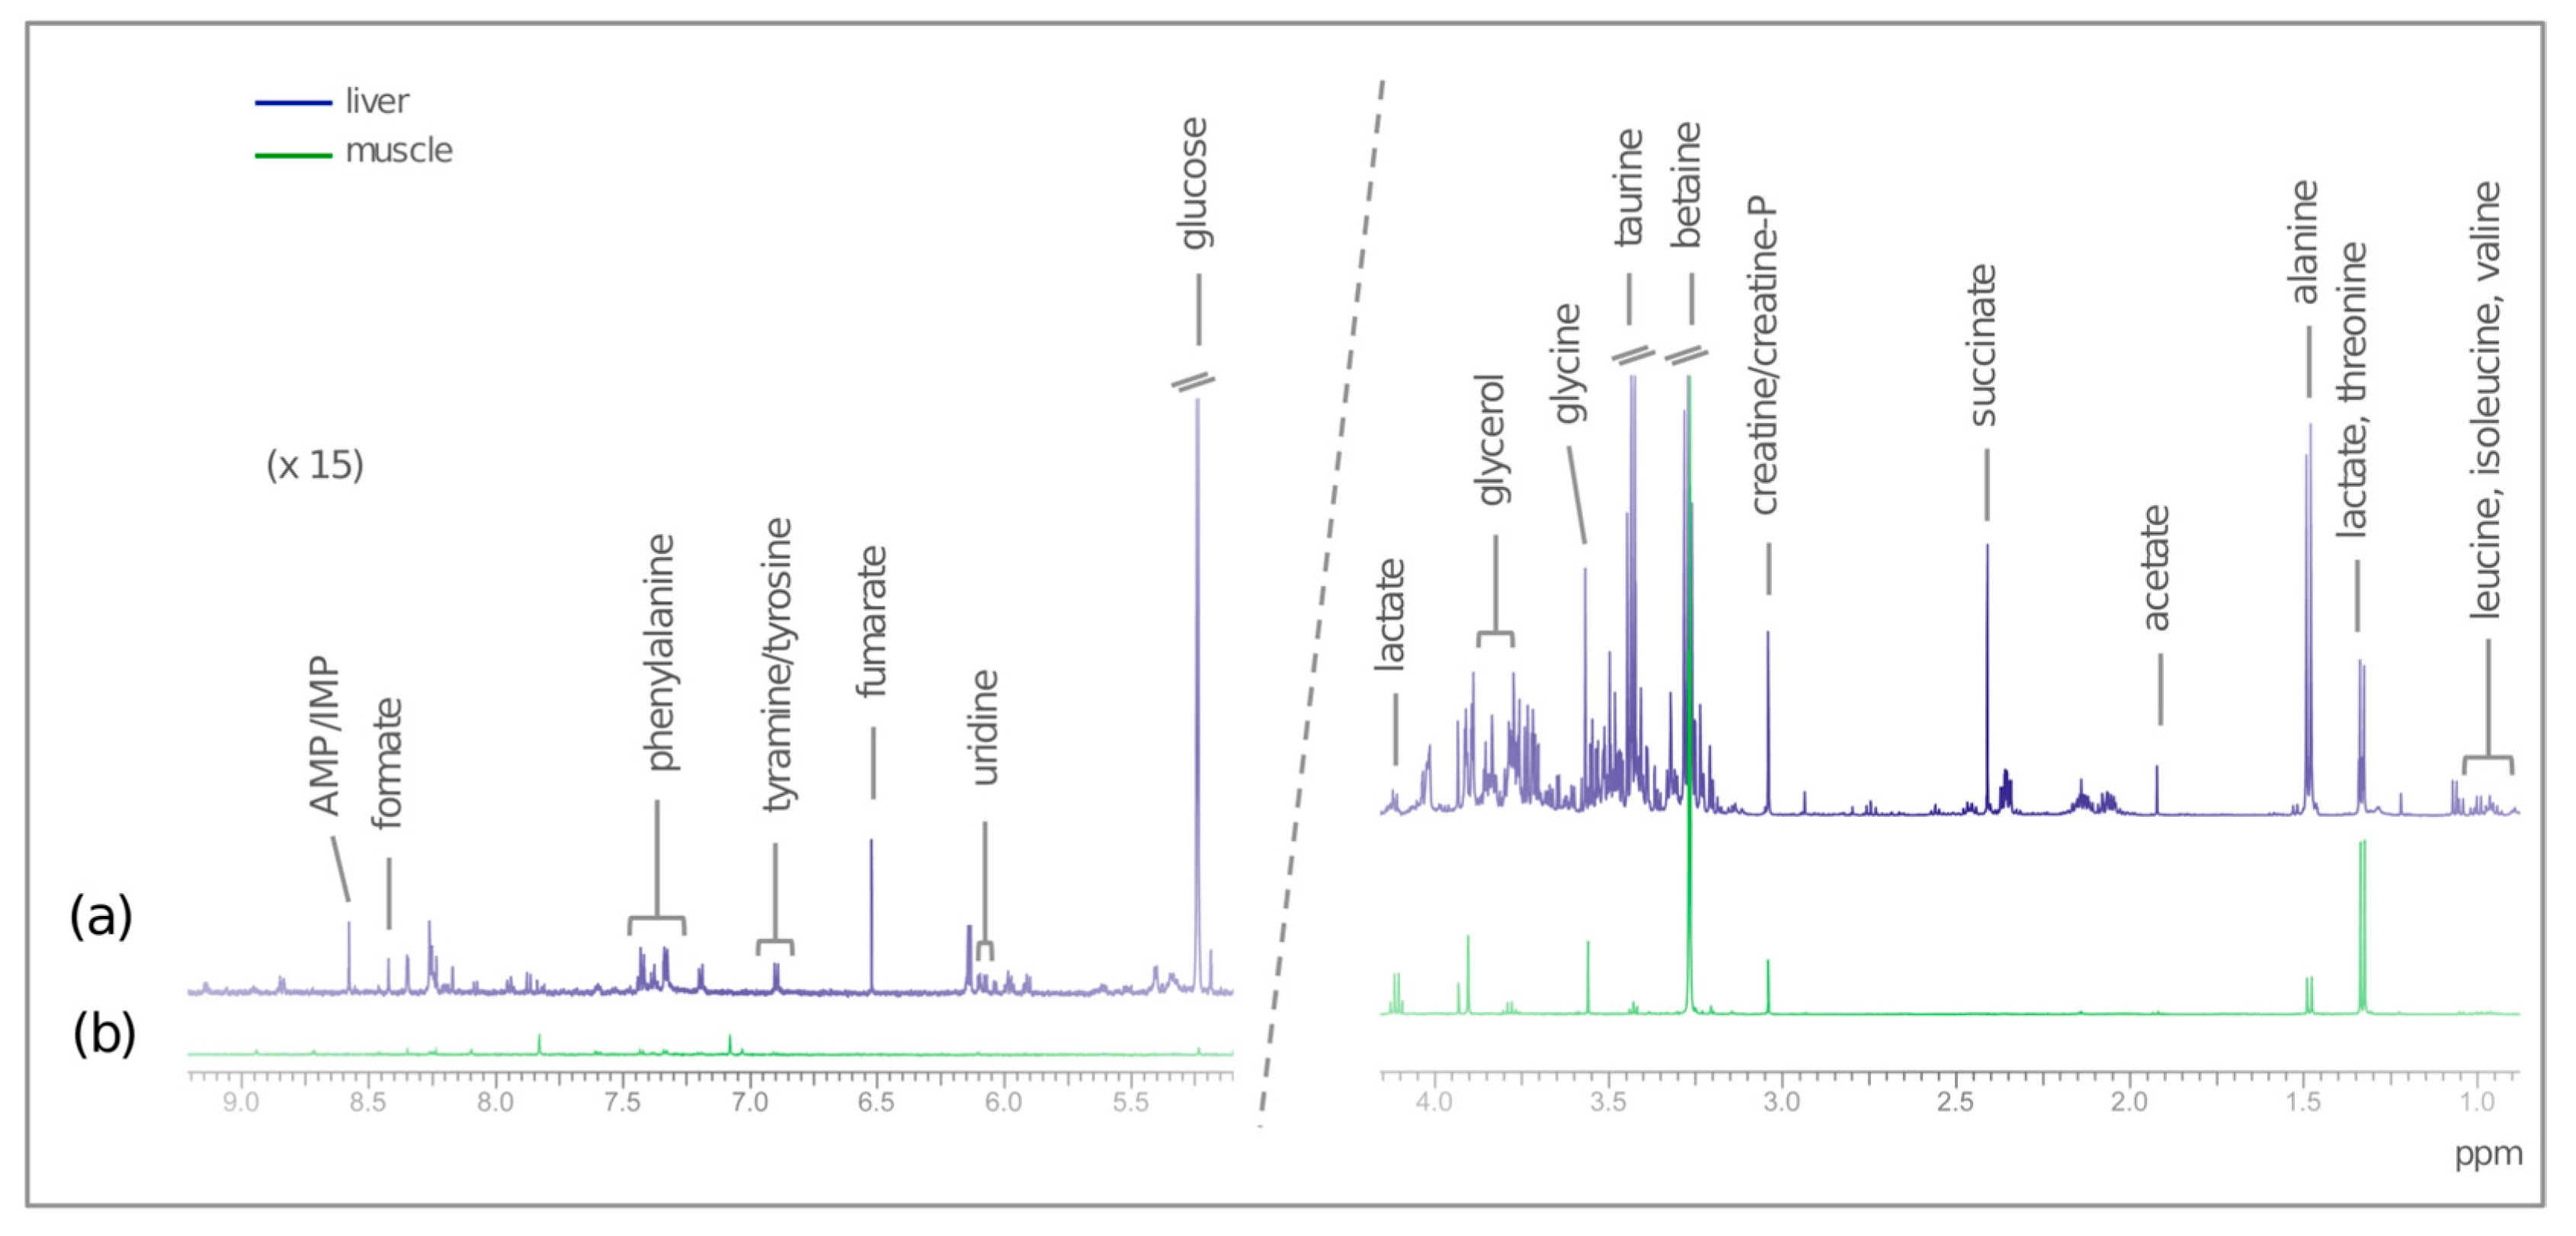
4.5. NMR Acquisition
4.6. Spectra Analysis
4.6.1. Untargeted Analysis
4.6.2. Targeted Analysis
4.7. Measurement of Adenine Nucleotides
4.8. Animal Welfare Disclaimer
Supplementary Materials
Author Contributions
Funding
Acknowledgments
Conflicts of Interest
References
- FAO. The State of World Aquaculture 2018-Meeting the Sustainable Goals; FAO: Rome, Italy, 2018. [Google Scholar]
- Oliva-Teles, A.; Enes, P.; Peres, H. Replacing fishmeal and fish oil in industrial aquafeeds for carnivorous fish. In Feed and Feeding Practices in Aquaculture; Woodhead Publishing: Kidlington, UK, 2015; ISBN 9780081005064. [Google Scholar]
- Lall, S.P.; Dumas, A. Nutritional requirements of cultured fish: Formulating nutritionally adequate feeds. In Feed and Feeding Practices in Aquaculture; Woodhead Publishing: Kidlington, UK, 2015; ISBN 9780081005064. [Google Scholar]
- Rito, J.; Viegas, I.; Pardal, M.; Metón, I.; Baanante, I.V.; Jones, J.G. Utilization of glycerol for endogenous glucose and glycogen synthesis in seabass (Dicentrarchus labrax): A potential mechanism for sparing amino acid catabolism in carnivorous fish. Aquaculture 2019, 498, 488–495. [Google Scholar] [CrossRef]
- Lammers, P.J.; Kerr, B.J.; Weber, T.E.; Dozier, W.A.; Kidd, M.T.; Bregendahl, K.; Honeyman, M.S. Digestible and metabolizable energy of crude glycerol for growing pigs. J. Anim. Sci. 2008, 86, 602–608. [Google Scholar] [CrossRef] [PubMed]
- Li, M.H.; Minchew, C.D.; Oberle, D.F.; Robinson, E.H. Evaluation of glycerol from biodiesel production as a feed ingredient for channel catfish, Ictalurus punctatus. J. World Aquac. Soc. 2010, 41, 130–136. [Google Scholar] [CrossRef]
- Lee, S.Y.; Lee, S.M.; Cho, Y.B.; Kam, D.K.; Lee, S.C.; Kim, C.H.; Seo, S. Glycerol as a feed supplement for ruminants: In vitro fermentation characteristics and methane production. Anim. Feed Sci. Technol. 2011, 166–167, 269–274. [Google Scholar] [CrossRef]
- Carvalho, E.R.; Schmelz-Roberts, N.S.; White, H.M.; Wilcox, C.S.; Eicher, S.D.; Donkin, S.S. Feeding behaviors of transition dairy cows fed glycerol as a replacement for corn. J. Dairy Sci. 2012, 95, 7214–7224. [Google Scholar] [CrossRef] [Green Version]
- Moesch, A.; Meurer, F.; Zadinelo, I.V.; Carneiro, W.F.; da Silva, L.C.R.; dos Santos, L.D. Growth, body composition and hepatopancreas morphology of Nile tilapia fingerlings fed crude glycerol as a replacement for maize in diets. Anim. Feed Sci. Technol. 2016, 219, 122–131. [Google Scholar] [CrossRef]
- Arif, M.; Abd El-Hack, M.E.; Hayat, Z.; Sohail, S.H.; Saeed, M.; Alagawany, M. The beneficial uses of glycerin as an alternative energy source in poultry diets. World’s Poult. Sci. J. 2016, 73, 136–144. [Google Scholar] [CrossRef]
- Jiang, W.; Tian, X.; Fang, Z.; Li, L.; Dong, S.; Li, H.; Zhao, K. Metabolic responses in the gills of tongue sole (Cynoglossus semilaevis) exposed to salinity stress using NMR-based metabolomics. Sci. Total Environ. 2019, 653, 465–474. [Google Scholar] [CrossRef]
- Melis, R.; Braca, A.; Sanna, R.; Spada, S.; Mulas, G.; Fadda, M.L.; Sassu, M.M.; Serra, G.; Anedda, R. Metabolic response of yellow mealworm larvae to two alternative rearing substrates. Metabolomics 2019, 15, 113. [Google Scholar] [CrossRef]
- Wagner, L.; Trattner, S.; Pickova, J.; Gómez-Requeni, P.; Moazzami, A.A. 1H NMR-based metabolomics studies on the effect of sesamin in Atlantic salmon (Salmo salar). Food Chem. 2014, 147, 98–105. [Google Scholar] [CrossRef]
- Jarak, I.; Tavares, L.; Palma, M.; Rito, J.; Carvalho, R.A.; Viegas, I. Response to dietary carbohydrates in European seabass (Dicentrarchus labrax) muscle tissue as revealed by NMR-based metabolomics. Metabolomics 2018, 14, 95. [Google Scholar] [CrossRef]
- Roques, S.; Deborde, C.; Richard, N.; Skiba-Cassy, S.; Moing, A.; Fauconneau, B. Metabolomics and fish nutrition: A review in the context of sustainable feed development. Rev. Aquac. 2018. [Google Scholar] [CrossRef]
- Peres, H.; Oliva-Teles, A. Influence of temperature on protein utilization in juvenile European seabass (Dicentrarchus labrax). Aquaculture 1999, 170, 337–348. [Google Scholar] [CrossRef]
- Panserat, S.; Capilla, E.; Gutierrez, J.; Frappart, P.O.; Vachot, C.; Plagnes-Juan, E.; Aguirre, P.; Brèque, J.; Kaushik, S. Glucokinase is highly induced and glucose-6-phosphatase poorly repressed in liver of rainbow trout (Oncorhynchus mykiss) by a single meal with glucose. Comp. Biochem. Physiol. B Biochem. Mol. Biol. 2001, 128, 275–283. [Google Scholar] [CrossRef]
- Halver, J.E. The Vitamins. In Fish Nutrition-Third Edition; Academic Press: Cambridge, MA, USA, 2002; ISBN 9780123196521. [Google Scholar]
- Da Costa, D.V.; Paulino, R.R.; Okamura, D.; de Oliveira, M.M.; Rosa, P.V.E. Growth and energy metabolism of Nile tilapia juveniles fed glycerol. Pesqui. Agropecu. Bras. 2015, 50, 347–354. [Google Scholar] [CrossRef] [Green Version]
- Prathomya, P.; Prisingkorn, W.; Jakovlić, I.; Deng, F.Y.; Zhao, Y.H.; Wang, W.M. 1H NMR-based metabolomics approach reveals metabolic alterations in response to dietary imbalances in Megalobrama amblycephala. Metabolomics 2017, 13, 17. [Google Scholar] [CrossRef]
- O’Donnell, J.M.; Kudej, R.K.; LaNoue, K.F.; Vatner, S.F.; Lewandowski, E.D. Limited transfer of cytosolic NADH into mitochondria at high cardiac workload. Am. J. Physiol. Heart Circ. Physiol. 2004, 286, H2237–H2242. [Google Scholar] [CrossRef] [Green Version]
- De La Fuente, I.M.; Cortés, J.M.; Valero, E.; Desroches, M.; Rodrigues, S.; Malaina, I.; Martínez, L. On the dynamics of the adenylate energy system: Homeorhesis vs homeostasis. PLoS ONE 2014, 9, e108676. [Google Scholar] [CrossRef]
- Allen, R.H.; Stabler, S.P.; Lindenbaum, J. Serum betaine, N,N-dimethylglycine and N-methylglycine levels in patients with cobalamin and folate deficiency and related inborn errors of metabolism. Metabolism 1993, 42, 1448–1460. [Google Scholar] [CrossRef]
- Wishart, D.S.; Tzur, D.; Knox, C.; Eisner, R.; Guo, A.C.; Young, N.; Cheng, D.; Jewell, K.; Arndt, D.; Sawhney, S.; et al. HMDB: The human metabolome database. Nucleic Acids Res. 2007, 35, D521–D526. [Google Scholar] [CrossRef]
- Wilson, R.P. Amino Acids and Proteins. In Fish Nutrition; Academic Press: London, UK, 2003; ISBN 0-8412-0045-9. [Google Scholar]
- Magnoni, L.; Vaillancourt, E.; Weber, J.-M. High resting triacylglycerol turnover of rainbow trout exceeds the energy requirements of endurance swimming. AJP Regul. Integr. Comp. Physiol. 2008, 295, R309–R315. [Google Scholar] [CrossRef] [Green Version]
- Da Costa, D.V.; Dias, J.; Colen, R.; Rosa, P.V.; Engrola, S. Partition and metabolic fate of dietary glycerol in muscles and liver of juvenile tilapia. Arch. Anim. Nutr. 2017, 71, 165–174. [Google Scholar] [CrossRef]
- Li, P.; Mai, K.; Trushenski, J.; Wu, G. New developments in fish amino acid nutrition: Towards functional and environmentally oriented aquafeeds. Amino Acids 2009, 37, 43–53. [Google Scholar] [CrossRef]
- Riley, W.W.; Higgs, D.A.; Dosanjh, B.S.; Eales, J.G. Influence of dietary arginine and glycine content on thyroid function and growth of juvenile rainbow trout, Oncorhynchus mykiss (Walbaum). Aquac. Nutr. 1996, 2, 235–242. [Google Scholar] [CrossRef]
- Viegas, I.; Jarak, I.; Rito, J.; Carvalho, R.A.; Metón, I.; Pardal, M.A.; Baanante, I.V.; Jones, J.G. Effects of dietary carbohydrate on hepatic de novo lipogenesis in European seabass (Dicentrarchus labrax L.). J. Lipid Res. 2016, 57, 1264–1272. [Google Scholar] [CrossRef]
- Rimoldi, S.; Benedito-Palos, L.; Terova, G.; Pérez-Sánchez, J. Wide-targeted gene expression infers tissue-specific molecular signatures of lipid metabolism in fed and fasted fish. Rev. Fish Biol. Fish. 2016, 26, 93–108. [Google Scholar] [CrossRef]
- Schock, T.B.; Newton, S.; Brenkert, K.; Leffler, J.; Bearden, D.W. An NMR-based metabolomic assessment of cultured cobia health in response to dietary manipulation. Food Chem. 2012, 133, 90–101. [Google Scholar] [CrossRef]
- Salze, G.P.; Davis, D.A. Taurine: A critical nutrient for future fish feeds. Aquaculture 2015, 437, 215–229. [Google Scholar] [CrossRef]
- FAO. Aquaculture Feed and Fertilizer Resources Information System (AFFRIS). Available online: http://www.fao.org/fishery/affris/affris-home/en/ (accessed on 20 November 2018).
- Silva, T.S.; Matos, E.; Cordeiro, O.D.; Colen, R.; Wulff, T.; Sampaio, E.; Sousa, V.; Valente, L.M.P.; Gonçalves, A.; Silva, J.M.G.; et al. Dietary tools to modulate glycogen storage in gilthead seabream muscle: Glycerol supplementation. J. Agric. Food Chem. 2012, 60, 10613–10624. [Google Scholar] [CrossRef]
- Matyash, V.; Liebisch, G.; Kurzchalia, T.V.; Shevchenko, A.; Schwudke, D. Lipid extraction by methyl- tert -butyl ether for high-throughput lipidomics. J. Lipid Res. 2008, 49, 1137–1146. [Google Scholar] [CrossRef]
- Chong, J.; Soufan, O.; Li, C.; Caraus, I.; Li, S.; Bourque, G.; Wishart, D.S.; Xia, J. MetaboAnalyst 4.0: Towards more transparent and integrative metabolomics analysis. Nucleic Acids Res. 2018, 46, W486–W494. [Google Scholar] [CrossRef]
- Xia, J.; Wishart, D.S. Using metaboanalyst 3.0 for comprehensive metabolomics data analysis. Curr. Protoc. Bioinform. 2016, 55, 14.10.1–14.10.91. [Google Scholar] [CrossRef]
- Fan, T.W.M. Metabolite profiling by one- and two-dimensional NMR analysis of complex mixtures. Prog. Nucl. Magn. Reson. Spectrosc. 1996, 28, 161–219. [Google Scholar] [CrossRef]
- Sumner, L.W.; Amberg, A.; Barrett, D.; Beale, M.H.; Beger, R.; Daykin, C.A.; Fan, T.W.M.; Fiehn, O.; Goodacre, R.; Griffin, J.L.; et al. Proposed minimum reporting standards for chemical analysis: Chemical Analysis Working Group (CAWG) Metabolomics Standards Initiative (MSI). Metabolomics 2007, 3, 211–221. [Google Scholar] [CrossRef]
- Stocchi, V.; Cucchiarini, L.; Magnani, M.; Chiarantini, L.; Palma, P.; Crescentini, G. Simultaneous extraction and reverse-phase high-performance liquid chromatographic determination of adenine and pyridine nucleotides in human red blood cells. Anal. Biochem. 1985, 146, 118–124. [Google Scholar] [CrossRef]
- Cardoso, C.M.P.; Moreno, A.J.M.; Almeida, L.M.; Custódio, J.B.A. Comparison of the changes in adenine nucleotides of rat liver mitochondria induced by tamoxifen and 4-hydroxytamoxifen. Toxicol. In Vitro 2003, 17, 663–670. [Google Scholar] [CrossRef] [Green Version]
- Atkinson, D.E.; Walton, G.M. Adenosine triphosphate conservation in metabolic regulation. Rat liver citrate cleavage enzyme. J. Biol. Chem. 1967, 242, 3239–3241. [Google Scholar]


| Muscle | D2.5/D0 | D5.0/D0 | Liver | D2.5/D0 | D5.0/D0 | |
|---|---|---|---|---|---|---|
| European Seabass | L-leucine | 0.78 * | 0.78 * | Taurine | - | 4.11 * |
| Isoleucine | 0.72 *** | 0.73 *** | Glycine | - | 3.18 * | |
| Valine | 0.75 *** | 0.75 *** | Glycerol | - | 5.57 ** | |
| Glycerol | - | 11.79 ** | - | - | - | |
| Rainbow Trout | Choline | - | 0.62 *** | Sarcosine | 0.16 * | - |
| Betaine | - | 0.68 *** | - | - | - | |
| Lactate | - | - | - | - | - | |
| Niacinamide/Nicotinurate | 1.56 * | - | - | - | - |
| Ingredients | D0 (%) | D2.5 (%) | D5.0 (%) |
|---|---|---|---|
| Fishmeal Super Prime | 10.00 | 10.00 | 10.00 |
| Fish Protein Concentrate | 5.00 | 5.00 | 5.00 |
| Squid Meal | 5.00 | 5.00 | 5.00 |
| Soy Protein Concentrate | 10.00 | 10.00 | 10.00 |
| Pea Protein Concentrate | 5.00 | 5.00 | 5.00 |
| Wheat Gluten | 7.50 | 7.50 | 7.50 |
| Corn Gluten | 7.50 | 7.50 | 7.50 |
| Soybean Meal 48 | 8.50 | 8.50 | 8.50 |
| Rapeseed Meal | 5.00 | 5.00 | 5.00 |
| Gelatinized Starch | 9.00 | 9.00 | 9.00 |
| Cellulose | 5.00 | 2.50 | 0.00 |
| Fish Oil | 14.00 | 14.00 | 14.00 |
| Vit & Min Premix PV01 | 1.00 | 1.00 | 1.00 |
| Lutavit C35 | 0.10 | 0.10 | 0.10 |
| Lutavit E50 | 0.10 | 0.10 | 0.10 |
| Soy Lecithin | 2.00 | 2.00 | 2.00 |
| Antioxidant | 0.20 | 0.20 | 0.20 |
| Sodium Propionate | 0.10 | 0.10 | 0.10 |
| Monocalcium Phosphate | 1.30 | 1.30 | 1.30 |
| Binder | 2.50 | 2.50 | 2.50 |
| L-Histidine | 0.05 | 0.05 | 0.05 |
| L-Threonine | 0.15 | 0.15 | 0.15 |
| Chromic Oxide | 1.00 | 1.00 | 1.00 |
| Glycerol | 0.00 | 2.50 | 5.00 |
| Total | 100.00 | 100.00 | 100.00 |
| - | - | - | - |
| As Fed Basis | D0 (%) | D2.5 (%) | D5.0 (%) |
| Crude Protein | 44.24 | 44.24 | 44.24 |
| Crude Fat | 17.29 | 17.29 | 17.29 |
| Fiber | 1.46 | 1.30 | 1.19 |
| Starch | 11.03 | 11.03 | 11.03 |
| Ash | 6.11 | 6.11 | 6.11 |
| Gross Energy (MJ/kg feed) | 21.21 | 21.21 | 21.21 |
© 2019 by the authors. Licensee MDPI, Basel, Switzerland. This article is an open access article distributed under the terms and conditions of the Creative Commons Attribution (CC BY) license (http://creativecommons.org/licenses/by/4.0/).
Share and Cite
Palma, M.; Tavares, L.C.; Rito, J.; Henriques, L.F.; Silva, J.G.; Ozório, R.; Pardal, M.A.; Magnoni, L.J.; Viegas, I. Metabolic Effects of Dietary Glycerol Supplementation in Muscle and Liver of European Seabass and Rainbow Trout by 1H NMR Metabolomics. Metabolites 2019, 9, 202. https://doi.org/10.3390/metabo9100202
Palma M, Tavares LC, Rito J, Henriques LF, Silva JG, Ozório R, Pardal MA, Magnoni LJ, Viegas I. Metabolic Effects of Dietary Glycerol Supplementation in Muscle and Liver of European Seabass and Rainbow Trout by 1H NMR Metabolomics. Metabolites. 2019; 9(10):202. https://doi.org/10.3390/metabo9100202
Chicago/Turabian StylePalma, Mariana, Ludgero C. Tavares, João Rito, Luís F. Henriques, João G. Silva, Rodrigo Ozório, Miguel A. Pardal, Leonardo J. Magnoni, and Ivan Viegas. 2019. "Metabolic Effects of Dietary Glycerol Supplementation in Muscle and Liver of European Seabass and Rainbow Trout by 1H NMR Metabolomics" Metabolites 9, no. 10: 202. https://doi.org/10.3390/metabo9100202