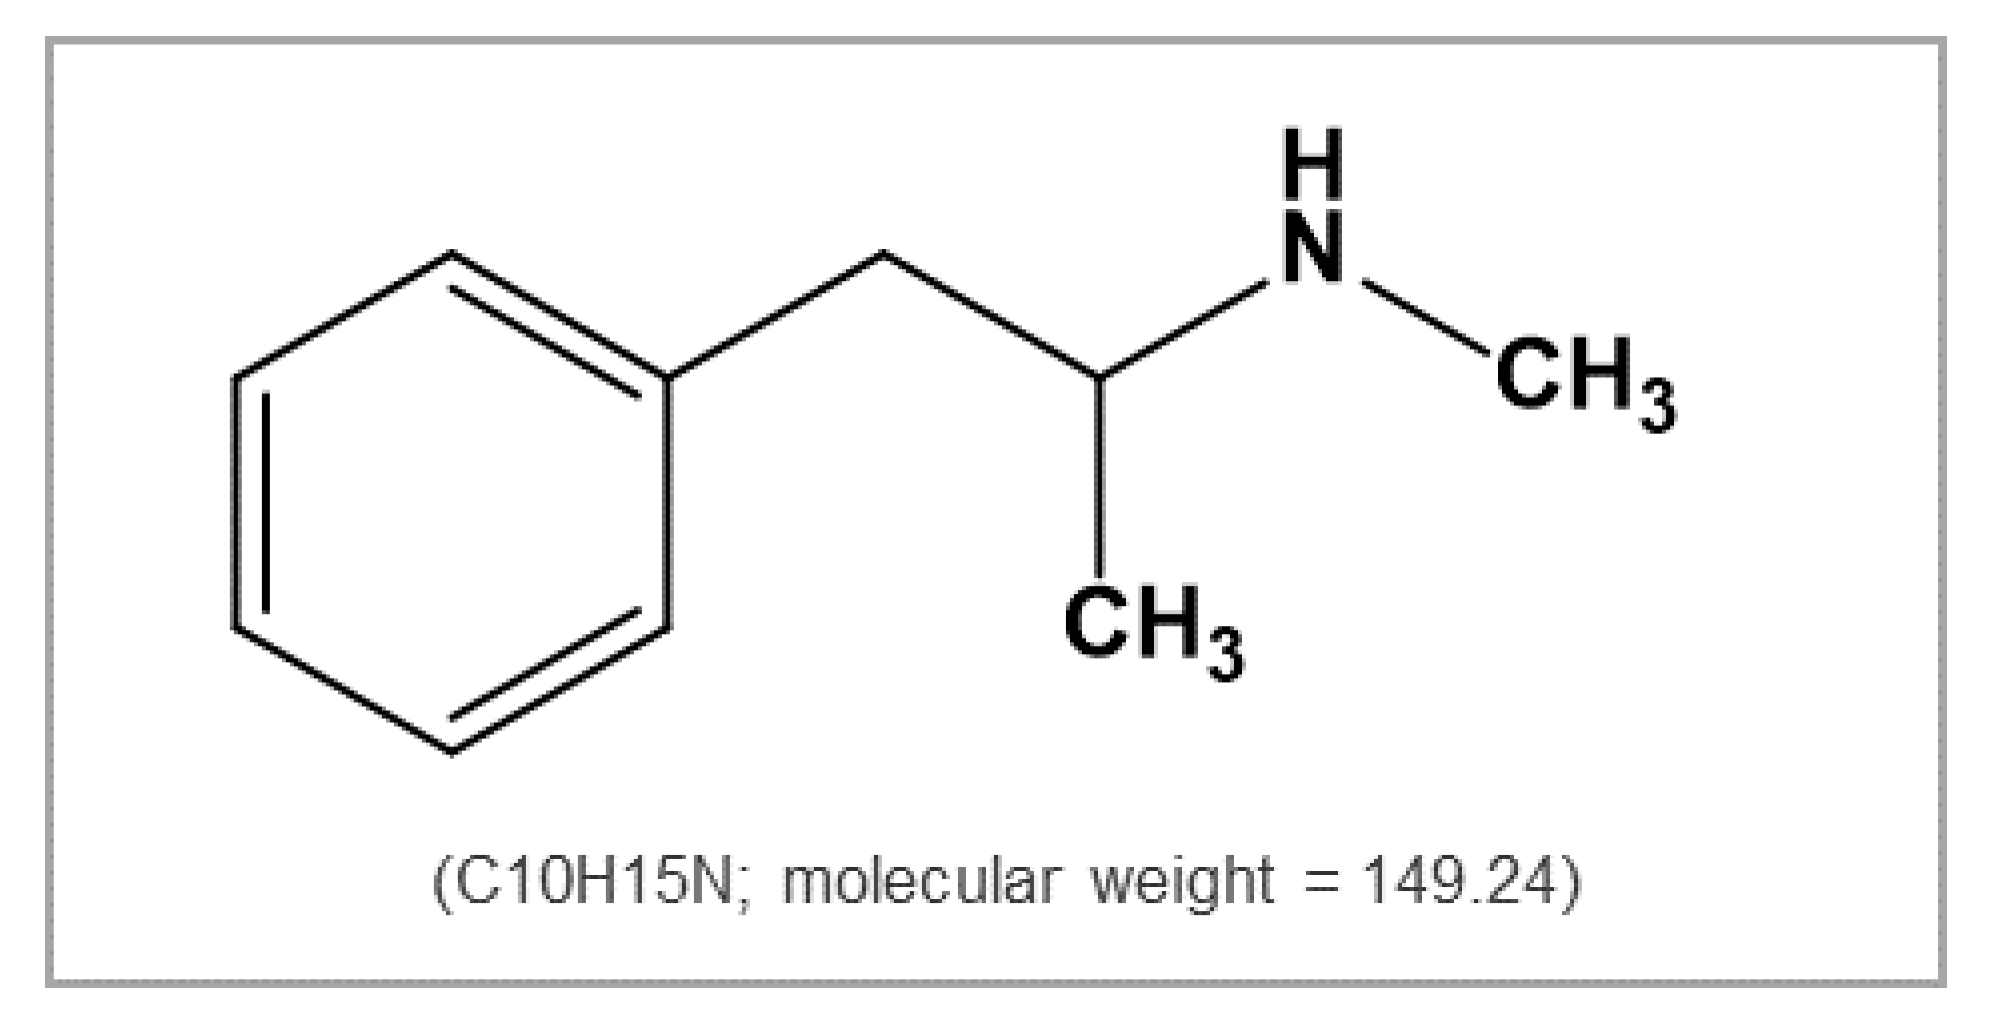
Current Understanding of Methamphetamine-Associated Metabolic Changes Revealed by the Metabolomics Approach


Abstract
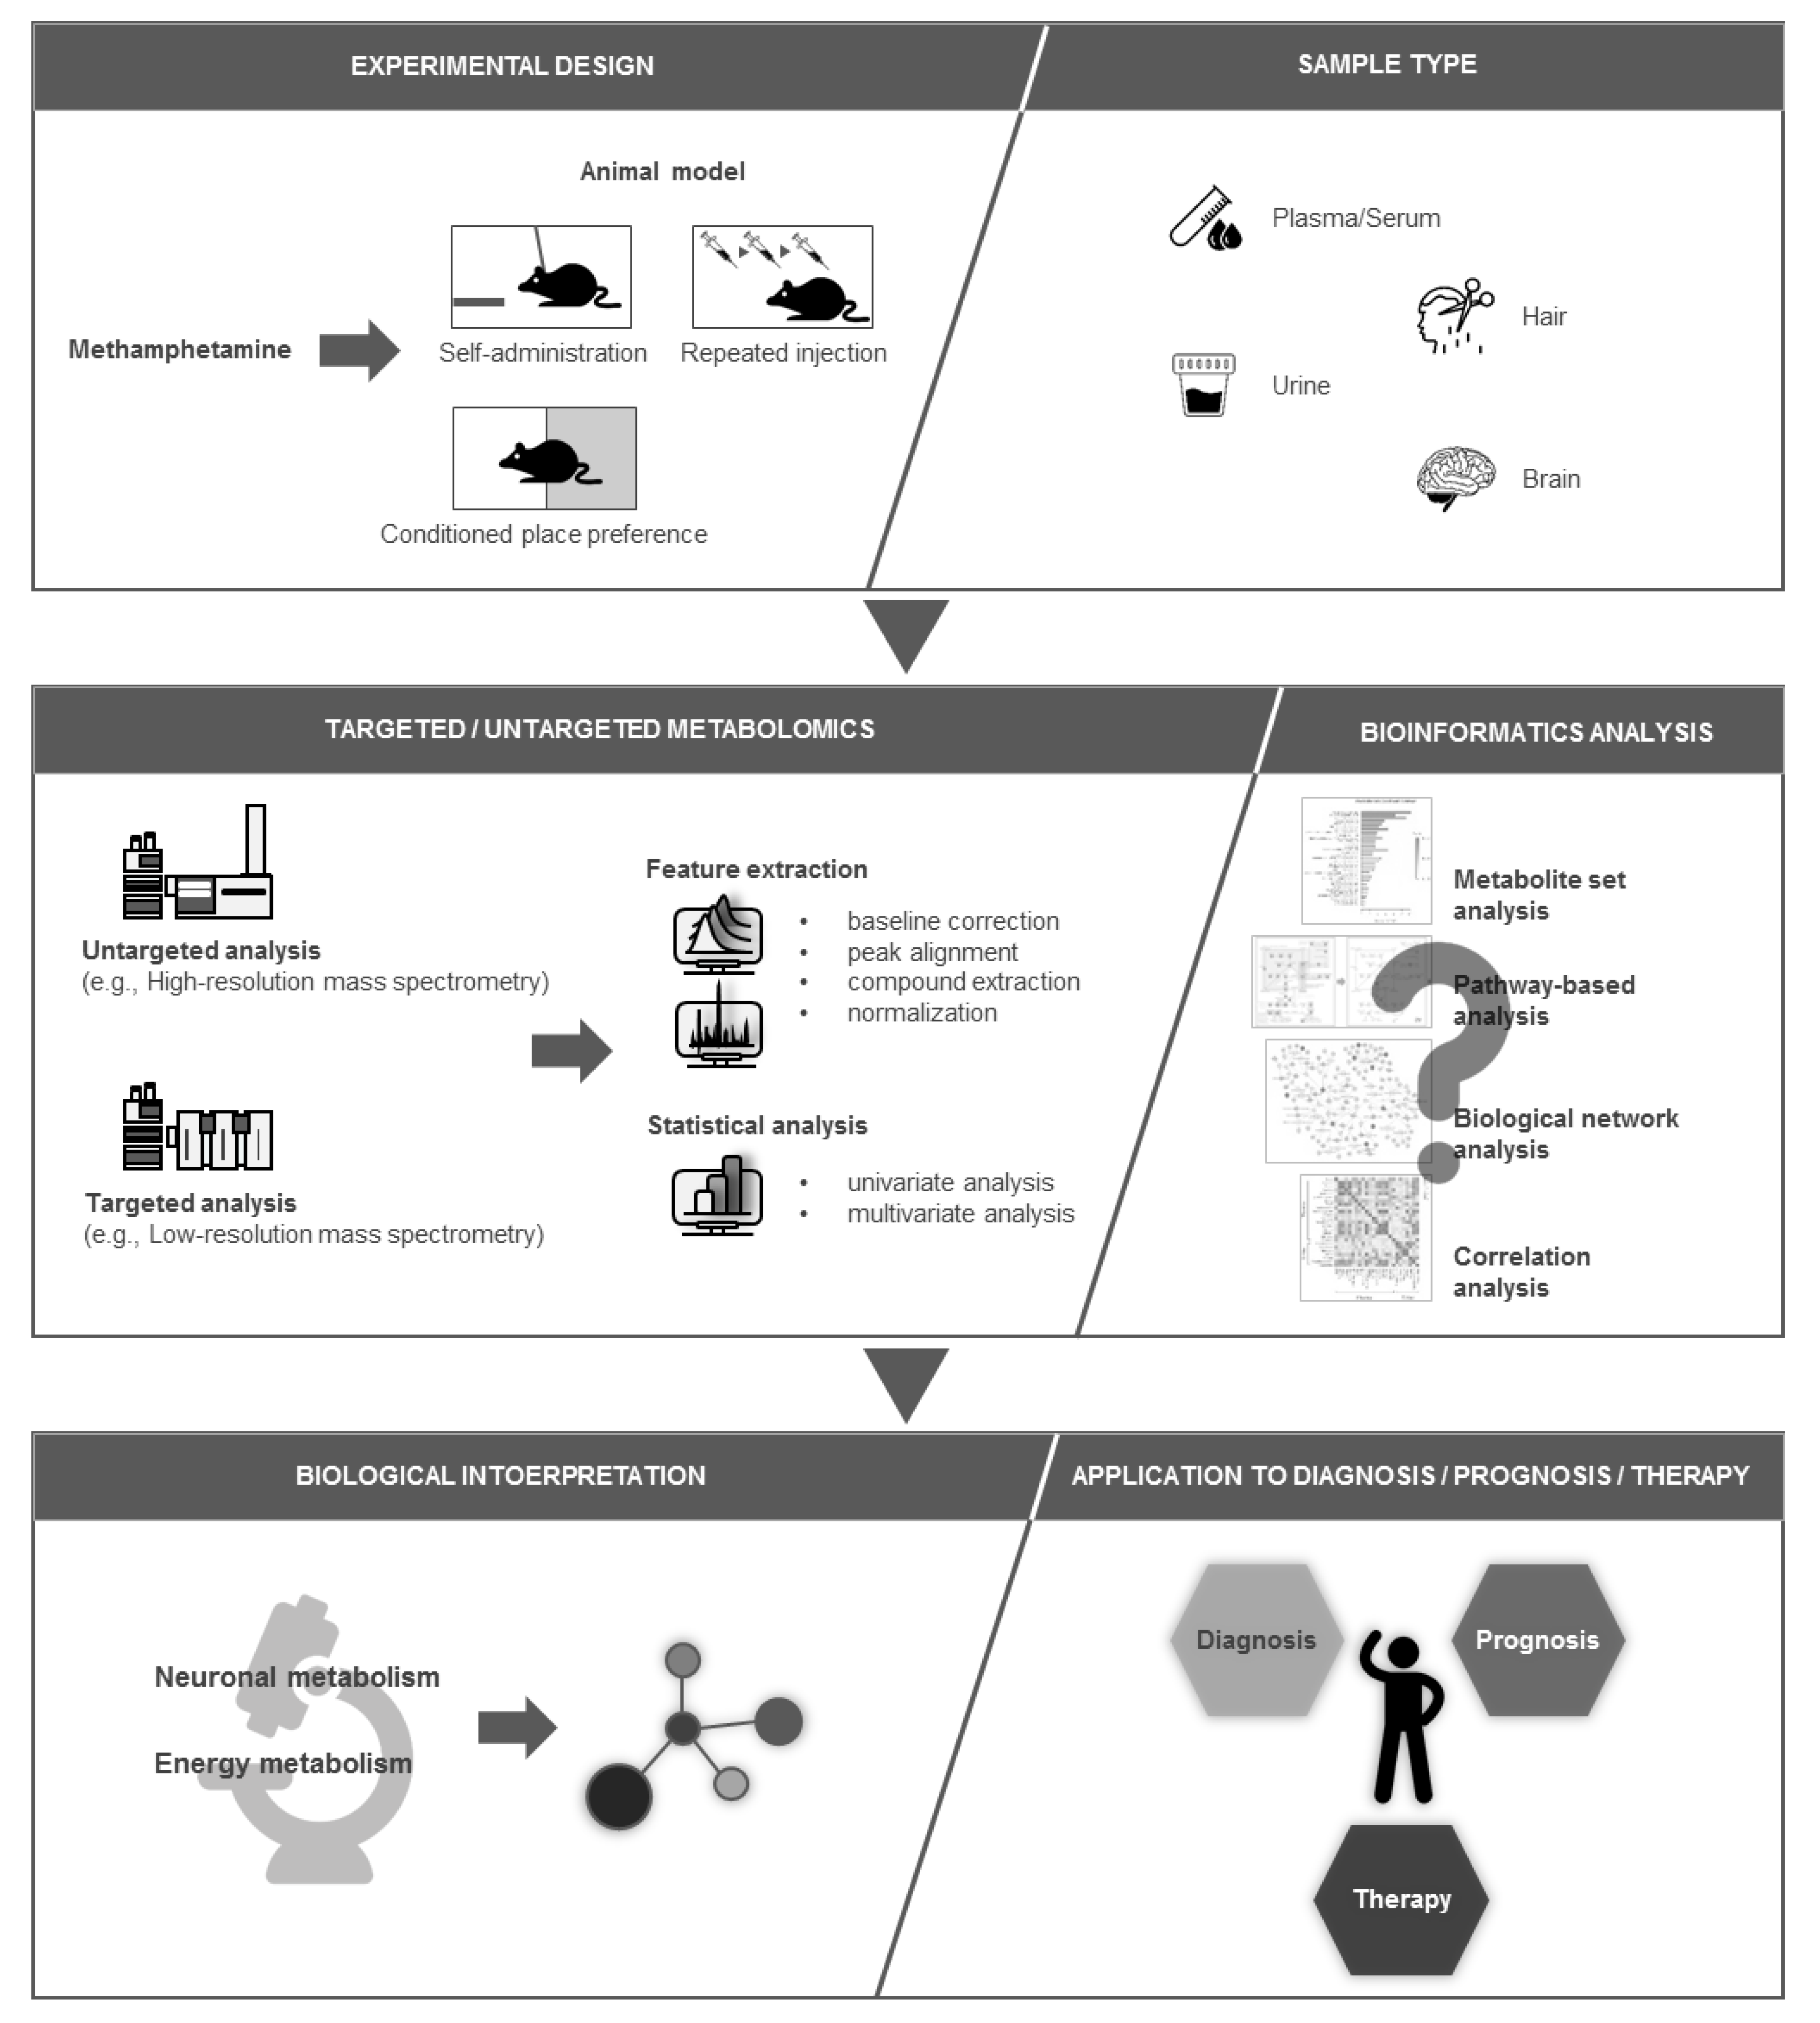
:1. Introduction
2. Application of Metabolomics in Drug Abuse and Addiction Studies
3. Biological Samples Used in Metabolomics
4. Metabolic Alterations in Brain Following Methamphetamine Exposure in Animal Studies
5. Metabolic Alterations in Other Biological Samples (Hair, Plasma, Serum, and Urine) Following Methamphetamine Exposure in Animal Studies
6. Perturbed Metabolic Pathways Associated with Methamphetamine Exposure
7. Future Directions
8. Conclusions
Author Contributions
Funding
Conflicts of Interest
References
- Tuyiringire, N.; Tusubira, D.; Munyampundu, J.-P.; Tolo, C.U.; Muvunyi, C.M.; Ogwang, P.E. Application of metabolomics to drug discovery and understanding the mechanisms of action of medicinal plants with anti-tuberculosis activity. Clin. Transl. Med. 2018, 7, 29. [Google Scholar] [CrossRef] [PubMed]
- Sethi, S.; Brietzke, E.J. Omics-based biomarkers: Application of metabolomics in neuropsychiatric disorders. Int. J. Neuropsychopharmacol. 2016, 19. [Google Scholar] [CrossRef] [PubMed]
- Boudonck, K.J.; Mitchell, M.W.; Német, L.; Keresztes, L.; Nyska, A.; Shinar, D.; Rosenstock, M. Discovery of metabolomics biomarkers for early detection of nephrotoxicity. Toxicol. Pathol. 2009, 37, 280–292. [Google Scholar] [CrossRef] [PubMed]
- Bando, K.; Kunimatsu, T.; Sakai, J.; Kimura, J.; Funabashi, H.; Seki, T.; Bamba, T.; Fukusaki, E. GC-MS-based metabolomics reveals mechanism of action for hydrazine induced hepatotoxicity in rats. J. Appl. Toxicol. 2011, 31, 524–535. [Google Scholar] [CrossRef] [PubMed]
- Kumar, B.S.; Lee, Y.-J.; Yi, H.J.; Chung, B.C.; Jung, B.H. Discovery of safety biomarkers for atorvastatin in rat urine using mass spectrometry based metabolomics combined with global and targeted approach. Anal. Chim. Acta 2010, 661, 47–59. [Google Scholar] [CrossRef] [PubMed]
- Shiomi, Y.; Nishiumi, S.; Ooi, M.; Hatano, N.; Shinohara, M.; Yoshie, T.; Kondo, Y.; Furumatsu, K.; Shiomi, H.; Kutsumi, H. GCMS-based metabolomic study in mice with colitis induced by dextran sulfate sodium. Inflamm. Bowel Dis. 2011, 17, 2261–2274. [Google Scholar] [CrossRef] [PubMed]
- Sugimoto, M.; Wong, D.T.; Hirayama, A.; Soga, T.; Tomita, M. Capillary electrophoresis mass spectrometry-based saliva metabolomics identified oral, breast and pancreatic cancer-specific profiles. Metabolomics 2010, 6, 78–95. [Google Scholar] [CrossRef] [PubMed]
- Hirayama, A.; Kami, K.; Sugimoto, M.; Sugawara, M.; Toki, N.; Onozuka, H.; Kinoshita, T.; Saito, N.; Ochiai, A.; Tomita, M. Quantitative metabolome profiling of colon and stomach cancer microenvironment by capillary electrophoresis time-of-flight mass spectrometry. Cancer Res. 2009, 69, 4918–4925. [Google Scholar] [CrossRef]
- Shima, N.; Miyawaki, I.; Bando, K.; Horie, H.; Zaitsu, K.; Katagi, M.; Bamba, T.; Tsuchihashi, H.; Fukusaki, E. Influences of methamphetamine-induced acute intoxication on urinary and plasma metabolic profiles in the rat. Toxicology 2011, 287, 29–37. [Google Scholar] [CrossRef]
- Vasilopoulou, C.G.; Margarity, M.; Klapa, M.I. Metabolomic Analysis in Brain Research: Opportunities and Challenges. Front. Physiol. 2016, 7, 183. [Google Scholar] [CrossRef] [Green Version]
- Choi, B.; Kim, S.P.; Hwang, S.; Hwang, J.; Yang, C.H.; Lee, S. Metabolic characterization in urine and hair from a rat model of methamphetamine self-administration using LC-QTOF-MS-based metabolomics. Metabolomics 2017, 13, 119. [Google Scholar] [CrossRef]
- Alonso, A.; Marsal, S.; Julia, A. Analytical methods in untargeted metabolomics: State of the art in 2015. Front. Bioeng. Biotechnol. 2015, 3, 23. [Google Scholar] [CrossRef] [PubMed]
- Bagheri, M.; Mokri, A.; Khosravi, A.; Kabir, K. Effect of Abstinence on Depression, Anxiety, and Quality of Life in Chronic Methamphetamine Users in a Therapeutic Community. Int. J. High Risk Behav. Addict. 2015, 4, e23903. [Google Scholar] [CrossRef] [PubMed] [Green Version]
- Galbraith, N. The methamphetamine problem: Commentary on … Psychiatric morbidity and socio-occupational dysfunction in residents of a drug rehabilitation centre. BJPsych Bull. 2015, 39, 218–220. [Google Scholar] [CrossRef] [PubMed]
- Primary Drug among Persons Treated for Drug Problems in Asia. Available online: https://dataunodc.un.org/drugs/treatment/asia-2017 (accessed on 25 July 2019).
- Global Synthetic Drugs Assessment. Available online: https://www.unodc.org/documents/scientific/Global_Drugs_Assessment_2017.pdf (accessed on 11 September 2019).
- Synthetic Drugs in East and South-East Asia. Available online: https://www.unodc.org/documents/southeastasiaandpacific/Publications/2019/2019_The_Challenge_of_Synthetic_Drugs_in_East_and_SEA.pdf (accessed on 25 July 2019).
- Nordahl, T.E.; Salo, R.; Leamon, M. Neuropsychological effects of chronic methamphetamine use on neurotransmitters and cognition: A review. J. Neuropsychiatry Clin. Neurosci. 2003, 15, 317–325. [Google Scholar] [CrossRef] [PubMed]
- Panenka, W.J.; Procyshyn, R.M.; Lecomte, T.; MacEwan, G.W.; Flynn, S.W.; Honer, W.G.; Barr, A.M. Methamphetamine use: A comprehensive review of molecular, preclinical and clinical findings. Drug Alcohol. Depend. 2013, 129, 167–179. [Google Scholar] [CrossRef] [PubMed]
- Wilson, J.M.; Kalasinsky, K.S.; Levey, A.I.; Bergeron, C.; Reiber, G.; Anthony, R.M.; Schmunk, G.A.; Shannak, K.; Haycock, J.W.; Kish, S.J. Striatal dopamine nerve terminal markers in human, chronic methamphetamine users. Nat. Med. 1996, 2, 699–703. [Google Scholar] [CrossRef]
- Brackins, T.; Brahm, N.C.; Kissack, J.C. Treatments for methamphetamine abuse: A literature review for the clinician. J. Pharm. Pract. 2011, 24, 541–550. [Google Scholar] [CrossRef]
- Jones, J.D.; Comer, S.D. A review of pharmacogenetic studies of substance-related disorders. Drug Alcohol. Depend. 2015, 152, 1–14. [Google Scholar] [CrossRef] [Green Version]
- Ghanbari, R.; Sumner, S. Using metabolomics to investigate biomarkers of drug addiction. Trends Mol. Med. 2018, 24, 197–205. [Google Scholar] [CrossRef]
- Kelley, A.E. Memory and addiction: Shared neural circuitry and molecular mechanisms. Neuron 2004, 44, 161–179. [Google Scholar] [CrossRef] [PubMed]
- Kalivas, P.W.; O’Brien, C. Drug addiction as a pathology of staged neuroplasticity. Neuropsychopharmacology 2008, 33, 166. [Google Scholar] [CrossRef] [PubMed]
- Tomkins, D.M.; Sellers, E.M. Addiction and the brain: The role of neurotransmitters in the cause and treatment of drug dependence. CMAJ Can. Med. Assoc. J. 2001, 164, 817–821. [Google Scholar]
- Chen, W.; Nong, Z.; Li, Y.; Huang, J.; Chen, C.; Huang, L. Role of Dopamine Signaling in Drug Addiction. Curr. Top. Med. Chem. 2017, 17, 2440–2455. [Google Scholar] [CrossRef] [PubMed]
- Cooper, S.; Robison, A.J.; Mazei-Robison, M.S. Reward Circuitry in Addiction. Neurotherapeutics 2017, 14, 687–697. [Google Scholar] [CrossRef] [Green Version]
- Dole, V.P. Narcotic addiction, physical dependence and relapse. N. Engl. J. Med. 1972, 286, 988–992. [Google Scholar] [CrossRef] [PubMed]
- Oliveira, R.J. Metabolomics of drugs of abuse: A more realistic view of the toxicological complexity. Bioanalysis 2014, 6, 3155–3159. [Google Scholar] [CrossRef]
- Zaitsu, K.; Miyawaki, I.; Bando, K.; Horie, H.; Shima, N.; Katagi, M.; Tatsuno, M.; Bamba, T.; Sato, T.; Ishii, A.; et al. Metabolic profiling of urine and blood plasma in rat models of drug addiction on the basis of morphine, methamphetamine, and cocaine-induced conditioned place preference. Anal. Bioanal. Chem. 2014, 406, 1339–1354. [Google Scholar] [CrossRef]
- Kaplan, K.A.; Chiu, V.M.; Lukus, P.A.; Zhang, X.; Siems, W.F.; Schenk, J.O.; Hill, H.H. Neuronal metabolomics by ion mobility mass spectrometry: Cocaine effects on glucose and selected biogenic amine metabolites in the frontal cortex, striatum, and thalamus of the rat. Anal. Bioanal. Chem. 2013, 405, 1959–1968. [Google Scholar] [CrossRef]
- Meinhardt, M.W.; Sévin, D.C.; Klee, M.L.; Dieter, S.; Sauer, U.; Sommer, W.H. The neurometabolic fingerprint of excessive alcohol drinking. Neuropsychopharmacology 2015, 40, 1259. [Google Scholar] [CrossRef]
- Jang, W.J.; Choi, J.Y.; Park, B.; Seo, J.H.; Seo, Y.H.; Lee, S.; Jeong, C.H.; Lee, S. Hair Metabolomics in Animal Studies and Clinical Settings. Molecules 2019, 24, 2195. [Google Scholar] [CrossRef] [PubMed]
- Hansen, S.H.; Pedersen-Bjergaard, S. Bioanalysis of Pharmaceuticals: Sample Preparation, Separation Techniques and Mass Spectrometry; John Wiley & Sons: Hoboken, NJ, USA, 2015. [Google Scholar]
- Yu, H.; Hong, S.; Jeong, C.H.; Bae, J.W.; Lee, S. Development of a linear dual column HPLC-MS/MS method and clinical genetic evaluation for tramadol and its phase I and II metabolites in oral fluid. Arch. Pharm. Res. 2018, 41, 288–298. [Google Scholar] [CrossRef] [PubMed]
- Naveed, M.; Mubeen, S.; Khan, A.; Ibrahim, S.; Meer, B. Plasma Biomarkers: Potent Screeners of Alzheimer’s Disease. Am. J. Alzheimers Dis. Other Demen. 2019. [Google Scholar] [CrossRef] [PubMed]
- Zhang, A.; Sun, H.; Wu, X.; Wang, X. Urine metabolomics. Clin. Chim. Acta 2012, 414, 65–69. [Google Scholar] [CrossRef] [PubMed]
- Khamis, M.M.; Adamko, D.J.; El-Aneed, A. Mass spectrometric based approaches in urine metabolomics and biomarker discovery. Mass Spectrom. Rev. 2017, 36, 115–134. [Google Scholar] [CrossRef] [PubMed]
- Lafolie, P.; Beck, O.; Blennow, G.; Boreus, L.; Borg, S.; Elwin, C.E.; Karlsson, L.; Odelius, G.; Hjemdahl, P. Importance of creatinine analyses of urine when screening for abused drugs. Clin. Chem. 1991, 37, 1927–1931. [Google Scholar]
- Kang, S.; Oh, S.M.; Chung, K.H.; Lee, S. A surrogate analyte-based LC-MS/MS method for the determination of gamma-hydroxybutyrate (GHB) in human urine and variation of endogenous urinary concentrations of GHB. J. Pharm. Biomed. Anal. 2014, 98, 193–200. [Google Scholar] [CrossRef] [PubMed]
- Pragst, F.; Balikova, M.A. State of the art in hair analysis for detection of drug and alcohol abuse. Clin. Chim. Acta 2006, 370, 17–49. [Google Scholar] [CrossRef]
- Kempson, I.M.; Lombi, E. Hair analysis as a biomonitor for toxicology, disease and health status. Chem. Soc. Rev. 2011, 40, 3915–3940. [Google Scholar] [CrossRef]
- Barbosa, J.; Faria, J.; Carvalho, F.; Pedro, M.; Queiros, O.; Moreira, R.; Dinis-Oliveira, R.J. Hair as an alternative matrix in bioanalysis. Bioanalysis 2013, 5, 895–914. [Google Scholar] [CrossRef]
- Yu, H.; Choi, M.; Jang, J.H.; Park, B.; Seo, Y.H.; Jeong, C.H.; Bae, J.W.; Lee, S. Development of a column-switching LC-MS/MS method of tramadol and its metabolites in hair and application to a pharmacogenetic study. Arch. Pharm. Res. 2018, 41, 554–563. [Google Scholar] [CrossRef]
- Xie, P.; Wang, T.J.; Yin, G.; Yan, Y.; Xiao, L.H.; Li, Q.; Bi, K.S. Metabonomic Study of Biochemical Changes in Human Hair of Heroin Abusers by Liquid Chromatography Coupled with Ion Trap-Time of Flight Mass Spectrometry. J. Mol. Neurosci. 2016, 58, 93–101. [Google Scholar] [CrossRef]
- Budczies, J.; Denkert, C. Tissue-Based Metabolomics to Analyze the Breast Cancer Metabolome. Recent Results Cancer Res. 2016, 207, 157–175. [Google Scholar] [CrossRef]
- Wang, P.; Sachar, M.; Guo, G.L.; Shehu, A.I.; Lu, J.; Zhong, X.B.; Ma, X. Liver metabolomics in a mouse model of erythropoietic protoporphyria. Biochem. Pharmacol. 2018, 154, 474–481. [Google Scholar] [CrossRef]
- Abuja, P.M.; Ehrhart, F.; Schoen, U.; Schmidt, T.; Stracke, F.; Dallmann, G.; Friedrich, T.; Zimmermann, H.; Zatloukal, K. Alterations in Human Liver Metabolome during Prolonged Cryostorage. J. Proteome Res. 2015, 14, 2758–2768. [Google Scholar] [CrossRef]
- Gonzalez-Riano, C.; Garcia, A.; Barbas, C. Metabolomics studies in brain tissue: A review. J. Pharm. Biomed. Anal. 2016, 130, 141–168. [Google Scholar] [CrossRef]
- Gonzalez-Riano, C.; Tapia-Gonzalez, S.; Garcia, A.; Munoz, A.; DeFelipe, J.; Barbas, C. Metabolomics and neuroanatomical evaluation of post-mortem changes in the hippocampus. Brain Struct. Funct. 2017, 222, 2831–2853. [Google Scholar] [CrossRef] [Green Version]
- Kim, M.; Lee, J.G.; Yang, C.H.; Lee, S. Silica stationary phase-based on-line sample enrichment coupled with LC-MS/MS for the quantification of dopamine, serotonin and their metabolites in rat brain microdialysates. Anal. Chim. Acta 2016, 923, 55–65. [Google Scholar] [CrossRef]
- Adkins, D.E.; McClay, J.L.; Vunck, S.A.; Batman, A.M.; Vann, R.E.; Clark, S.L.; Souza, R.P.; Crowley, J.J.; Sullivan, P.F.; van den Oord, E.J.C.G.; et al. Behavioral metabolomics analysis identifies novel neurochemical signatures in methamphetamine sensitization. Genes Brain Behav. 2013, 12, 780–791. [Google Scholar] [CrossRef]
- Bu, Q.; Lv, L.; Yan, G.; Deng, P.; Wang, Y.; Zhou, J.; Yang, Y.; Li, Y.; Cen, X. NMR-based metabonomic in hippocampus, nucleus accumbens and prefrontal cortex of methamphetamine-sensitized rats. Neurotoxicology 2013, 36, 17–23. [Google Scholar] [CrossRef]
- McClay, J.L.; Adkins, D.E.; Vunck, S.A.; Batman, A.M.; Vann, R.E.; Clark, S.L.; Beardsley, P.M.; van den Oord, E.J. Large-scale neurochemical metabolomics analysis identifies multiple compounds associated with methamphetamine exposure. Metabolomics 2013, 9, 392–402. [Google Scholar] [CrossRef]
- Bustamante, D.; You, Z.B.; Castel, M.N.; Johansson, S.; Goiny, M.; Terenius, L.; Hökfelt, T.; Herrera-Marschitz, M. Effect of single and repeated methamphetamine treatment on neurotransmitter release in substantia nigra and neostriatum of the rat. J. Neurochem. 2002, 83, 645–654. [Google Scholar] [CrossRef]
- Zaitsu, K.; Hayashi, Y.; Kusano, M.; Tsuchihashi, H.; Ishii, A. Application of metabolomics to toxicology of drugs of abuse: A mini review of metabolomics approach to acute and chronic toxicity studies. Drug Metab. Pharmacokinet. 2016, 31, 21–26. [Google Scholar] [CrossRef]
- Zheng, T.; Liu, L.; Shi, J.; Yu, X.; Xiao, W.; Sun, R.; Zhou, Y.; Aa, J.; Wang, G. The metabolic impact of methamphetamine on the systemic metabolism of rats and potential markers of methamphetamine abuse. Mol. BioSyst. 2014, 10, 1968–1977. [Google Scholar] [CrossRef]
- Panlilio, L.V.; Goldberg, S.R. Self-administration of drugs in animals and humans as a model and an investigative tool. Addiction 2007, 102, 1863–1870. [Google Scholar] [CrossRef] [Green Version]
- Edwards, S.; Koob, G.F. Escalation of drug self-administration as a hallmark of persistent addiction liability. Behav. Pharmacol. 2013, 24, 356–362. [Google Scholar] [CrossRef]
- Bardo, M.T.; Bevins, R.A. Conditioned place preference: What does it add to our preclinical understanding of drug reward? Psychopharmacology 2000, 153, 31–43. [Google Scholar] [CrossRef]
- Huston, J.P.; Silva, M.A.; Topic, B.; Muller, C.P. What’s conditioned in conditioned place preference? Trends Pharmacol. Sci. 2013, 34, 162–166. [Google Scholar] [CrossRef]


| Reference No. | No. | Animal | Sample | Analytical Platform (Untargeted Or Targeted) | Experimental Condition (Administration Dose, Route, Times, Sampling Time, etc.) | Metabolic Changes | Metabolic Effects |
|---|---|---|---|---|---|---|---|
| [53] | 1 | Mouse | Whole brain | LC-(HR)MS and GC-MS (Untargeted) |
| Isovalerylcarnitine (↓), myo-inositol (↓), betaine (↑), glutarylcarnitine (↑), ribulose (↑), pantothenate (↑), n-acetylglutamate (↓), homocarnosine (↓), and 4-guanidinobutanoate (↓) | Neurochemical alteration by methamphetamine-induced psychomotor sensitization |
| [54] | 2 | Rat | Hippocampus, NAc, and PFC | 1H NMR (Untargeted) |
| Hippocampus, NAc and PFC: Succinate (↓), n-acetylaspartate (↓), α-ketoglutarate (↓), citrate (↓) methionine (↓), glutamine (↓), glutathione (↓), glutamate (↓) and γ-aminobutyric acid (↓) NAc and PFC: Taurine (↓), phosphocholine (↑) and serotonin (↓) Hippocampus and NAc: Acetylcysteine (↓) and homocysteic acid (↑) Hippocampus and PFC: Myo-inositol (↑) Hippocampus: Succinic acid semialdehyde (↑) NAc: Dopamine (↓) | Disturbance in neurotransmitters, oxidative stress, membrane disruption, and glial activation |
| [55] | 3 | Mouse | Whole brain | LC-(HR) and GC-MS (Untargeted) |
| D1: 3-dehydrocarnitine (↑), tryptophan (↑), serotonin (↓), tyrosine (↑), fructose (↓), lactate (↑), 2-hydroxyglutarate (↑), fumarate (↑), malate (↑) and succinate (↑) D5: Ergothioneine (↑), and phosphocholine (↑) | Increased energy metabolism, disrupted mitochondrial activity, and neuronal damage |
| [56] | 4 | Rat | Microdialysate from substantia nigra and neostriatum | LC-ECD for monoamines, LC-FLD for amino acids, and dynorphine B radioimmunoassay (targeted) |
| Dopamine (↑), 3,4-dihydroxyphenylacetic acid (↓), homovanillic acid (↓), 5-hydroxyindoleacetic acid (↓), and dynorphin B (↑) | Impairment of monoamine neurotransmission and changes in amino acid homeostasis |
| Reference No. | No. | Animal | Sample | Analytical platform (Untargeted Or Targeted) | Experimental Condition (Administration Dose, Route, Times, Sampling Time, etc.) | Metabolic Changes | Metabolic Effects |
|---|---|---|---|---|---|---|---|
| [11] | 1 | Rat | Hair | LC-(HR)MS (Untargeted) |
| (L)-norvaline/betaine/5-aminopentanoate/(L)-valine (↓), acetylcarnitine (↑), 5-methylcytidine (↑), 1-methyladenosine (↑), lumichrome (↓), Cys Arg Met (↓), palmityl-L-carnitine (↑), deoxycorticosterone (↓), oleamide (↓), stearamide (↓), and hippurate (↓) | Metabolic perturbation in the central nervous system and energy production |
| [31] | 2 | Rat | Plasma | GC-MS (Untargeted) |
| N-propylamine (↑) and lauric acid (↓) | No changes in many metabolites probably due to adaptations to chronic methamphetamine administration |
| Urine | Lactose (↑), spermidine (↑) and stearic acid (↑) | ||||||
| [58] | 3 | Rat | Serum | GC-MS (Untargeted) |
| D1: Glycine (↓), valine (↓), isoleucine (↓), leucine (↓), α-ketoglutarate (↓), succinate (↓), citrate (↓), pyruvate (↓), myo-inositol-1-phosphate (↓), indoleacetate (↓) and 1H-indole-3-propanoic acid (↑) D5: Monopalmitin (↓), 3-hydroxybutyrate (↑) and stearic acid (↓) *D1: Alanine (↓), asparagine (↓), citrulline (↓), glutamate (↑), glycine (↓), proline (↓), ornithine (↓), serine (↓), threonine (↓), valine (↓), leucine (↓), isoleucine (↓), hydroxyproline (↓), taurine (↓), methionine (↓), lysine (↑), ketoleucine (↓), monopalmitin (↓), cis-9-hexadecenoic acid (↑), 3-hydroxybutyrate (↑), glycerol (↑), glycerol-3-phosphate (↓), aminomalonic acid (↓), α-ketoglutarate (↓), citrate (↓), pyruvate (↓), succinate (↓), galactonolactone (↑), creatinine (↓), indoleacetate (↓), myo-inositol (↓), myo-inositol-1-phosphate (↓), and lactate (↓) *D5: Alanine (↓), citrulline (↓), proline (↓), ornithine (↓), threonine (↓), isoleucine (↓), hydroxyproline (↓), methionine (↓), lysine (↑), monopalmitin (↓), palmitic acid (↓), heptadecanoic acid (↓), cis-9-Hexadecenoic acid (↓), 3-hydroxybutyrate (↑), stearic acid (↓), glycerol-3-phosphate (↓), α-aminoisobutyrate (↓), α-ketoglutarate (↓), citrate (↓), pyruvate (↓), galactonolactone (↓), creatinine (↓), and myo-inositol-1-phosphate (↓) *W: Isoleucine (↓), lysine (↑), palmitic acid (↓), cis-9-Hexadecenoic acid (↓), α-aminoisobutyrate (↓), α-ketoglutarate (↓), citrate (↓), succinate (↓), galactonolactone (↑), and creatinine (↓) | Elevated energy metabolism, TCA cycle and lipid metabolism, and activation of nervous system |
| Urine | D5: 3-Hydroxybutyrate (↑) and glycerol (↑) *D5: Serine (↑), glutamate (↑), alanine (↑), 3-hydroxybutyrate (↑), hippurate (↓), lactate (↑), galactonate (↑), pyruvate (↑), fumarate (↑), succinate (↑), myo-inositol (↑), and 5-hydroxyindoleacetic acid (↓) *W: Hippurate (↓) and lactate (↑) | ||||||
| [9] | 4 | Rat | Plasma | GC-TOFMS, CE-MS/MS |
| A: Glucose (↑) and 3-hydroxybutyrate (↓) B: all of the metabolites in A recovered to control levels. | Impaired energy metabolism (glycolysis, TCA cycle, and fatty acid metabolism) |
| Urine |
| A: Citrate/isocitrate (↓), saccharic acid (↑), uracil (↑), adipic acid (↓), aconitate (↓), fumarate (↓), malate (↓), succinate (↓), 5-oxoproline (↑), α-ketoglutarate (↓), oxaloacetate/pyruvate (↓), and 3-hydroxybutyrate (↓) B: all of the metabolites in A recovered to control levels. |
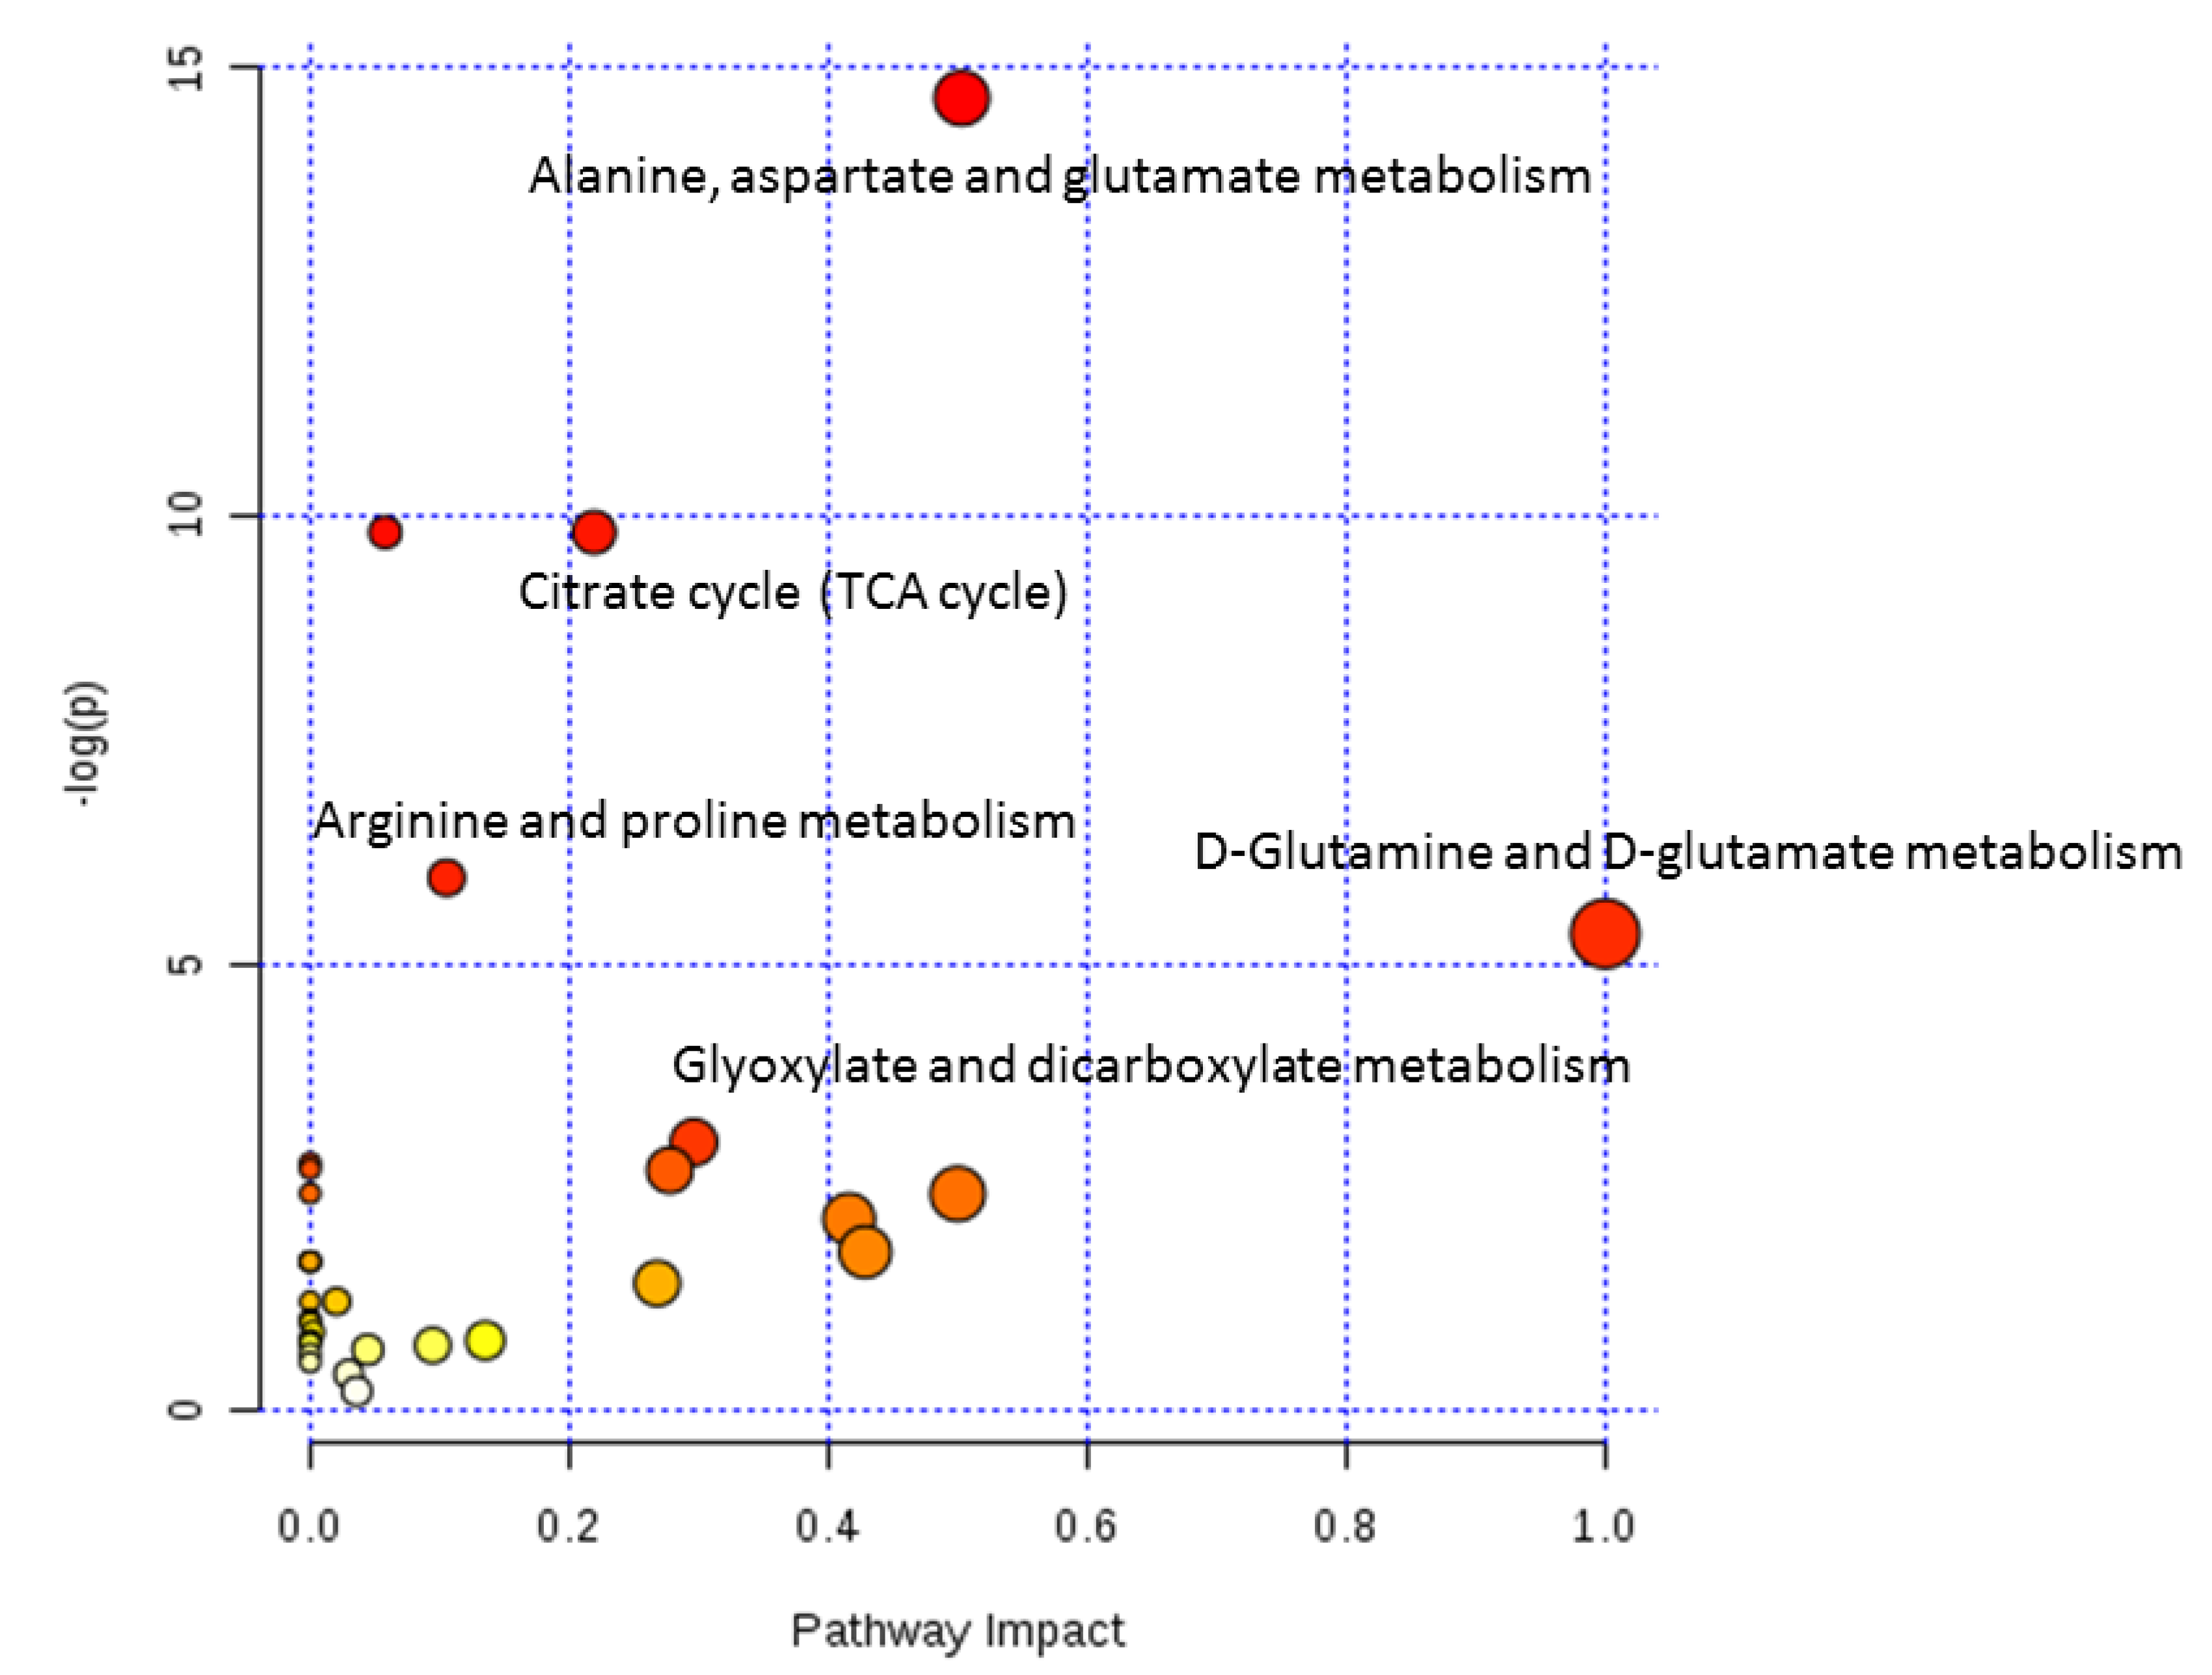
| Metabolic Pathway | Total | p | Impact | Hits | Metabolites |
|---|---|---|---|---|---|
| Alanine, aspartate, and glutamate metabolism | 24 | 4.2753 × 10⁻⁷ | 0.50315 | 7 | N-Acetylaspartate, glutamate, α-ketoglutarate, γ-aminobutyric acid, fumarate, succinic acid semialdehyde, succinate |
| Citrate cycle (TCA cycle) | 20 | 5.4591 × 10⁻⁵ | 0.21929 | 5 | Succinate, fumarate, malate, citrate, α-ketoglutarate |
| Arginine and proline metabolism | 44 | 2.5868 × 10⁻³ | 0.10545 | 5 | Fumarate, glutamate, γ-aminobutyric acid, 4-guanidinobutanoate, N-acetylglutamate |
| D-Glutamine and D-glutamate metabolism | 5 | 4.8373 × 10⁻³ | 1.0 | 2 | Glutamate, α-ketoglutarate |
| Glyoxylate and dicarboxylate metabolism | 16 | 4.9634 × 10⁻² | 0.2963 | 2 | Citrate, malate |
© 2019 by the authors. Licensee MDPI, Basel, Switzerland. This article is an open access article distributed under the terms and conditions of the Creative Commons Attribution (CC BY) license (http://creativecommons.org/licenses/by/4.0/).
Share and Cite
Kim, M.; Jang, W.-J.; Shakya, R.; Choi, B.; Jeong, C.-H.; Lee, S. Current Understanding of Methamphetamine-Associated Metabolic Changes Revealed by the Metabolomics Approach. Metabolites 2019, 9, 195. https://doi.org/10.3390/metabo9100195
Kim M, Jang W-J, Shakya R, Choi B, Jeong C-H, Lee S. Current Understanding of Methamphetamine-Associated Metabolic Changes Revealed by the Metabolomics Approach. Metabolites. 2019; 9(10):195. https://doi.org/10.3390/metabo9100195
Chicago/Turabian StyleKim, Minjeong, Won-Jun Jang, Rupa Shakya, Boyeon Choi, Chul-Ho Jeong, and Sooyeun Lee. 2019. "Current Understanding of Methamphetamine-Associated Metabolic Changes Revealed by the Metabolomics Approach" Metabolites 9, no. 10: 195. https://doi.org/10.3390/metabo9100195