Article

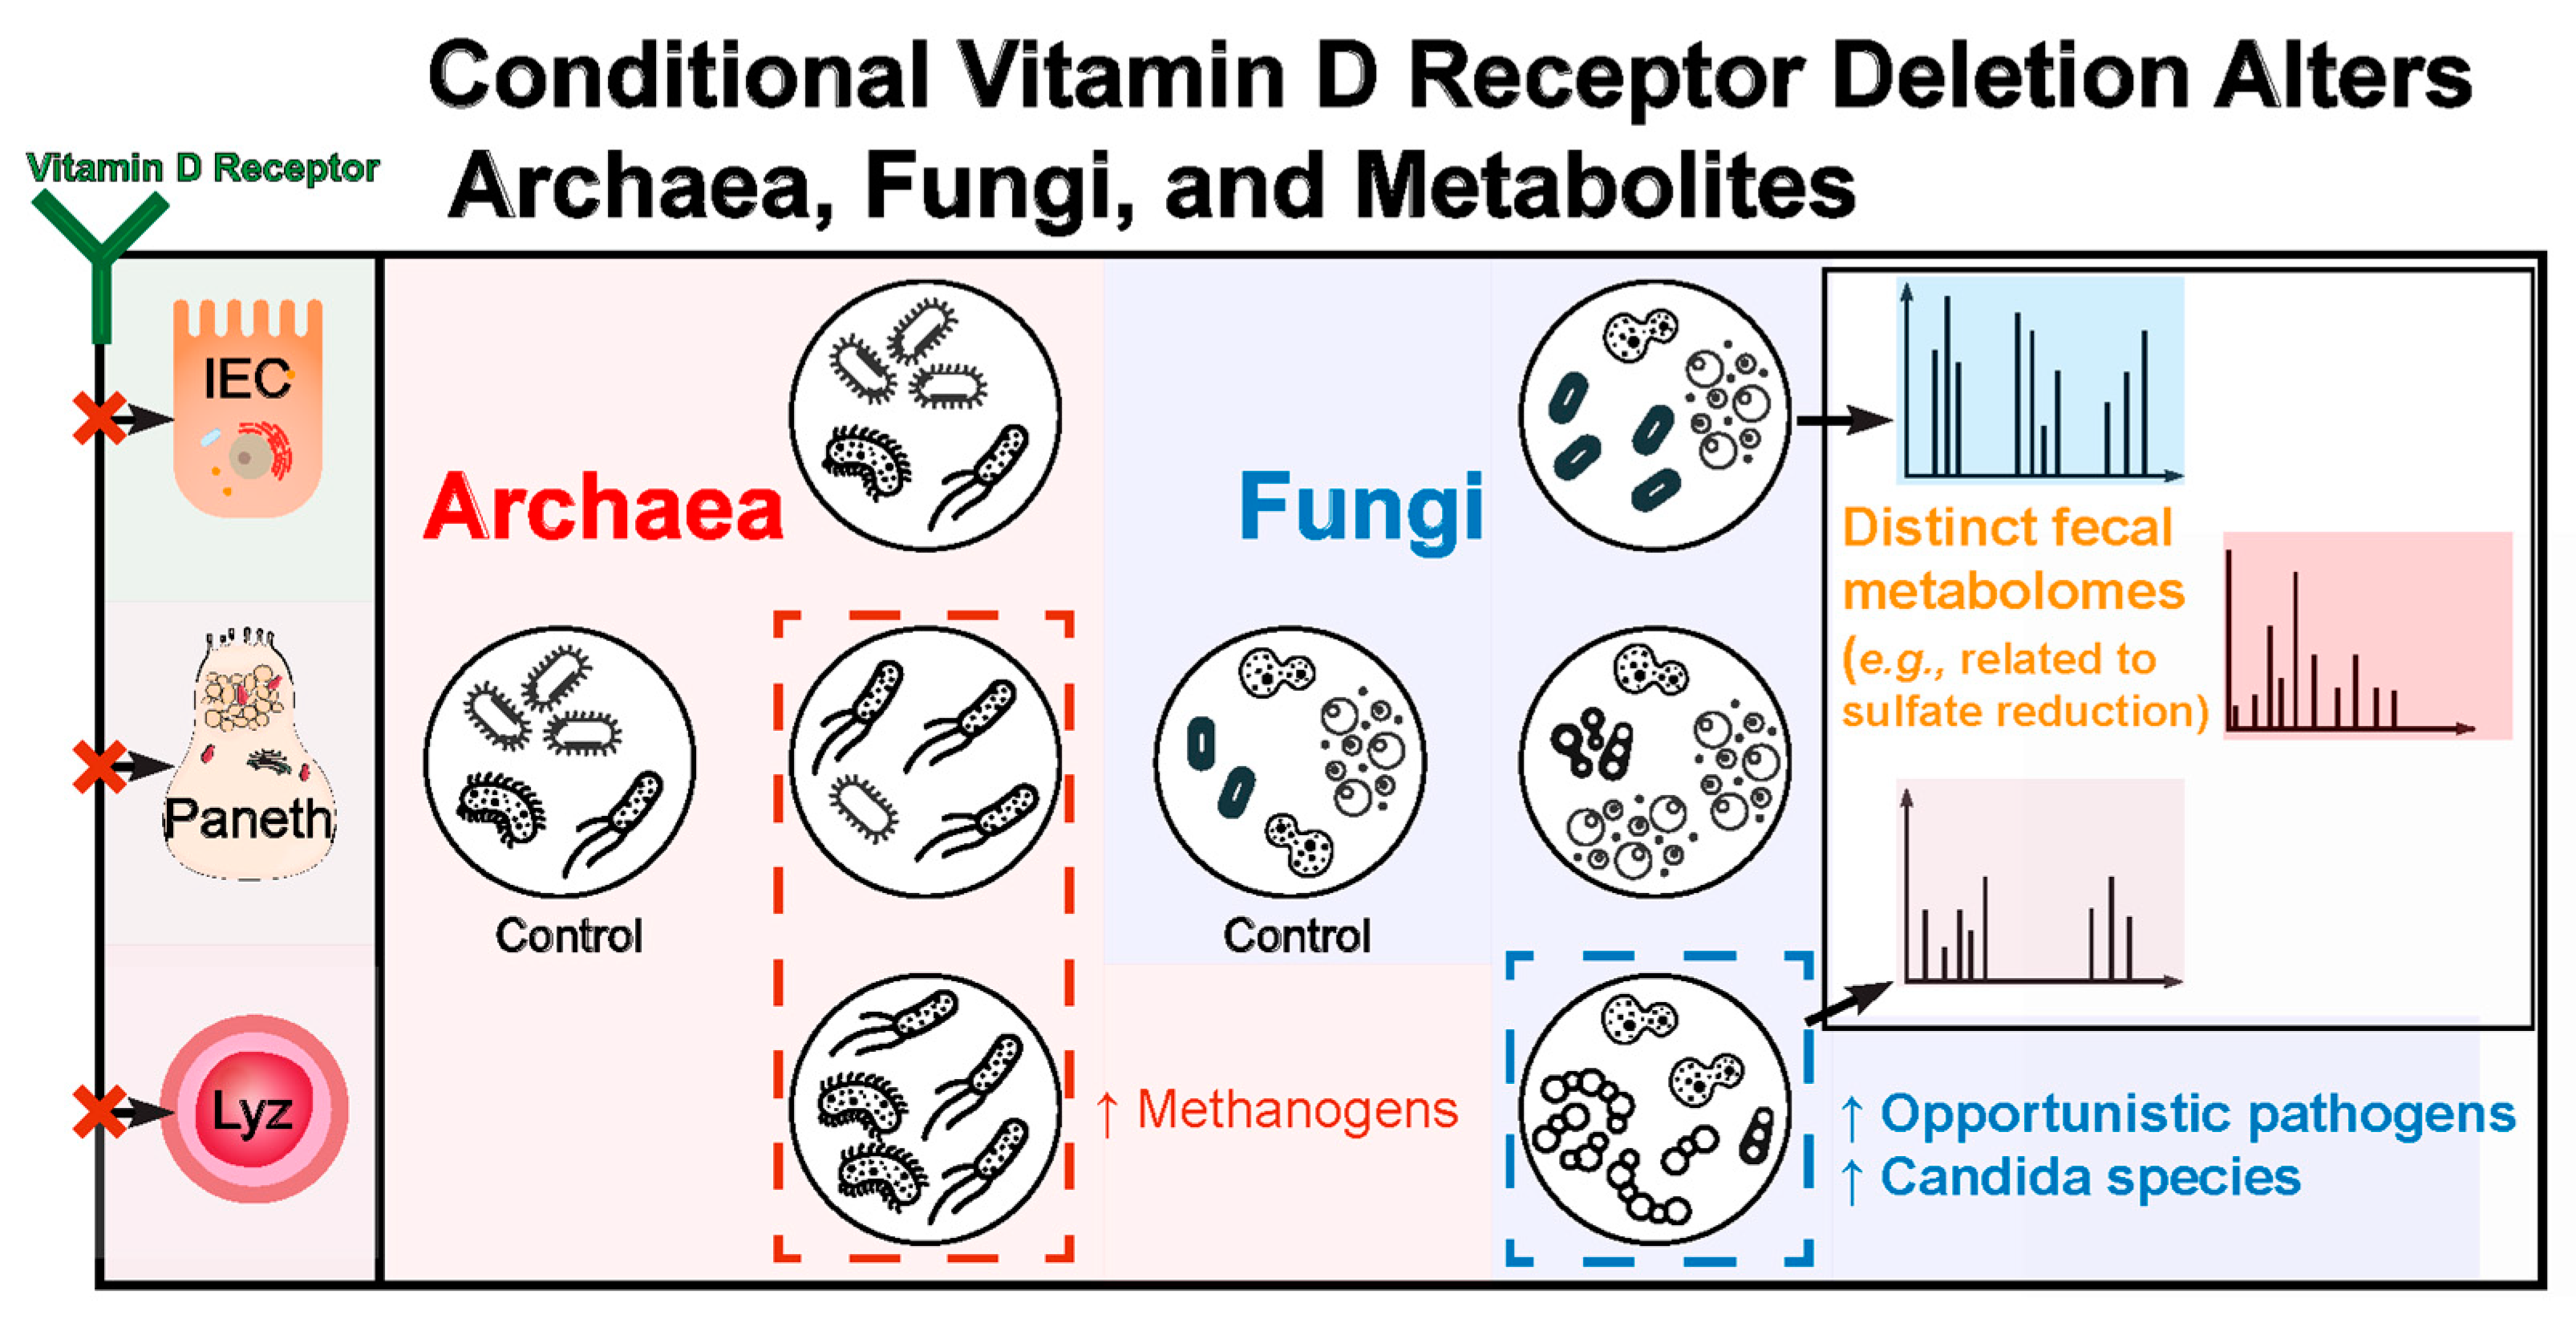
Conditional Vitamin D Receptor Deletion Induces Fungal and Archaeal Dysbiosis and Altered Metabolites

1
Department of Medicine, University of Illinois Chicago, Chicago, IL 60612, USA
2
Department of Bioengineering, University of Illinois Chicago, Chicago, IL 60607, USA
3
Jesse Brown VA Medical Center, Chicago, IL 60612, USA
4
Department of Microbiology and Immunology, University of Illinois Chicago, Chicago, IL 60612, USA
5
UIC Cancer Center, University of Illinois Chicago, Chicago, IL 60612, USA
*
Authors to whom correspondence should be addressed.
Metabolites 2024, 14(1), 32; https://doi.org/10.3390/metabo14010032
Submission received: 3 December 2023 / Revised: 24 December 2023 / Accepted: 28 December 2023 / Published: 1 January 2024

Abstract

:
A vitamin D receptor (VDR) deficiency leads to the dysbiosis of intestinal bacteria and is associated with various diseases, including cancer, infections, and inflammatory bowel disease. However, the impact of a VDR deficiency on fungi and archaea is unknown. We conditionally deleted the VDR in Paneth cells (VDRΔPC), intestinal epithelial cells (VDRΔIEC), or myeloid cells (VDRΔLyz) in mice and collected feces for shotgun metagenomic sequencing and untargeted metabolomics. We found that fungi were significantly altered in each knockout (KO) group compared to the VDRLoxp control. The VDRΔLyz mice had the most altered fungi species (three depleted and seven enriched), followed by the VDRΔPC mice (six depleted and two enriched), and the VDRΔIEC mice (one depleted and one enriched). The methanogen Methanofollis liminatans was enriched in the VDRΔPC and VDRΔLyz mice and two further archaeal species (Thermococcus piezophilus and Sulfolobus acidocaldarius) were enriched in the VDRΔLyz mice compared to the Loxp group. Significant correlations existed among altered fungi, archaea, bacteria, and viruses in the KO mice. Functional metagenomics showed changes in several biologic functions, including decreased sulfate reduction and increased biosynthesis of cobalamin (vitamin B12) in VDRΔLyz mice relative to VDRLoxp mice. Fecal metabolites were analyzed to examine the involvement of sulfate reduction and other pathways. In conclusion, a VDR deficiency caused the formation of altered fungi and archaea in a tissue- and sex-dependent manner. These results provide a foundation about the impact of a host factor (e.g., VDR deficiency) on fungi and archaea. It opens the door for further studies to determine how mycobiome and cross-kingdom interactions in the microbiome community and metabolites contribute to the risk of certain diseases.

1. Introduction

The VDR is a highly conserved nuclear receptor [1,2,3]. While vitamin D has often been discussed for its role in the body’s mineral and skeletal homeostasis [2], the VDR is expressed in many cell types, including the small and large intestines of mammals [1,3,4]. There, it plays a critical role in innate and adaptive immunity, host–microbial interactions, proliferation, differentiation, and barrier function in a tissue-specific manner and related to infant and adult diseases [1,3,4,5].
Unsurprisingly, given this wide range of functions, the VDR and vitamin D deficiency have been linked with the pathogenesis of many diseases, including inflammatory bowel disease (IBD), colorectal cancer, and infections [1,3,6,7]. One of the mechanisms by which a vitamin D/VDR deficiency contributes to these diseases is by influencing host interactions with the microbiome [1,8,9]. Understanding the host–microbial interactions modulated by the VDR will provide new insights for preventing and treating these chronic diseases.
The intestinal bacteria, viruses, fungi, and archaea serve important functions in metabolism, immunity, and nervous system regulation [10,11,12]. Fungi constitute a minority of the inhabitants in the mammalian microbiome (in humans, around 0.1%) [13,14,15]. Despite their small numbers, fungi can have a major impact in the gut. The community of intestinal fungi (collectively called “the mycobiome”) has been shown to impact host immunity, metabolism, and vitamin availability [13,15,16]. Intestinal fungi also interact with other microbes, modulating their function and abundance [10,13,15,16]. Finally, the mycobiome can act as a repository for opportunistic pathogens that dangerously replicate and disseminate when given the opportunity, usually due to dysbiosis or compromised immune function [13,17].
To date, research on VDR deficiency’s impact on the microbiome has focused on bacteria and viruses [6,8,9,18]. It is unknown how a VDR deficiency impacts the mycobiome. Archaea are unicellular organisms in a separate domain from eukaryotes and bacteria that share several features of both and are often discovered under extreme environments [19,20]. Archaea form the least studied intestinal community, which is also known as “the archaeome”. The most abundant archaea in the mammalian intestine are methanogens, anaerobes that use the byproducts of bacterial fermentation to produce gaseous methane [20,21]. This links them to bacterial energy production—a notable interaction between these communities [19,22]. The archaeome is perhaps the least understood part of the microbiome but is an area of active research [19]. For example, alterations in archaea have been reported in populations with IBD [20,23], colorectal cancer (CRC) [24,25], and irritable bowel syndrome (IBS) [20]. However, the effect of a VDR deficiency on the archaeome has not been investigated.
In the current study, we hypothesized that a VDR deficiency alters the archaeome and mycobiome. To test our hypothesis, we used VDR conditional KO mouse models. These include the VDR KO in Paneth cells, intestinal epithelial cells, and myeloid cells, along with a VDR Loxp control group [8,26]. Fecal samples were collected from mice in each group for DNA isolation, followed by shotgun metagenomic sequencing. Differential abundance testing [27] revealed impacted fungi and archaea, which were linked to impacted bacteria and viruses via correlation analyses. We also tested sex subsets to investigate the sex-dependent actions of a VDR deficiency. Finally, functional metagenomic analyses and metabolite profiling provided more evidence for the impact of microbial perturbations vs. the VDR status in different tissues.

2. Materials and Methods

2.1. Animals

All the mice that were used in this study had a C57BL/6 genetic background. We conducted conditional deletions of the VDR in specific cell types of mice, including intestinal epithelial cells, Paneth cells, and myeloid cells [8]. In brief, to generate the VDRΔIEC, VDRΔPC, and VDRΔLyz mice, VDRLoxp mice were crossed with villin-Cre, Defa6-Cre, and Lyz-Cre mice, respectively [8]. All the animals were housed in the Biologic Resources Laboratory (BRL) at the University of Illinois Chicago (UIC) and were utilized in accordance with the UIC Animal Care Committee (ACC) and the Office of Animal Care and Institutional Biosafety (OACIB) guidelines. The animal work was approved by the UIC Office of Animal Care (ACC15-231, ACC17-218, and ACC18-216). At the time of sample collection, all the animals were asymptomatic. In line with our power analysis, 10 mice (male and female, 6 to 8 weeks old) were assigned to each group for a total of 40 mice.
All the mice were housed in specific pathogen-free environments under a controlled condition of a 12 h light/12 h dark cycle at 20–22 °C and 45 ± 5% humidity, with free access to the same food and autoclaved water. All the materials that were utilized, including the cage, bedding, water bottles, and cage card holder, were autoclaved before housing the mice. The mice were housed with only mice of the same gender, and each cage had no more than 5 mice. All the mice that were subjected to our experiments were housed in groups before sample collection.
Further details about the breeding process can be found in a previous publication [8].

2.2. Shotgun Sequencing

In brief, fecal samples were collected from the colons of mice, sampled directly from the rectum, from each group with the following distribution: VDRLoxp (male: n = 3 and female: n = 7), VDRΔIEC (male: n = 5 and female: n = 5), VDRΔPC (male: n = 5 and female: n = 5), and VDRΔLyz (male: n = 5 and female: n = 5). Age-matched mice were randomly selected for the control and experimental groups. DNA was extracted with DNeasy Power Fecal kits, homogenized using heat, and fragmented into short fragments (250–600 bp fragments) before sequencing on an Illumina HiSeq system.
Basic processing of the raw data were performed by the University of Illinois Chicago Core for Research Informatics (UICCRI). The data underwent quality control checks, filtering the reads, de-noising, and metagenomic assembly [28]. The resulting assemblies were filtered to exclude contigs shorter than 1000 nucleotides, and all remaining reads were classified with a centrifuge [29]. The taxonomic annotation of each contig was obtained by searching the NCBI GenBank non-redundant nucleotide database (as described in https://merenlab.org/2016/06/18/importing-taxonomy, accessed on 13 May 2019). Further details about the shotgun sequencing procedure can be found in our previous publication [8].

2.3. Metabolomics

Fecal samples were collected from the colons of chow-fed mice from a separate cohort spanning two KO groups with the following distribution: VDRLoxp (male: n = 10 and female: n = 6), VDRΔIEC (male: n = 9 and female: n = 8), and VDRΔLyz (male: n = 5 and female: n = 5). The samples were prepared using the MicroLab STAR® system, preceded by the addition of several recovery standards for QC purposes. To separate bound small molecules, this was followed by protein precipitation with methanol and shaking for 2 min before centrifugation. TurboVap (Zymark, Hopkinton, MA, USA) was used to remove the organic solvent before overnight storage in nitrogen. Four fractions of this extract were sent for mass spectrometry analysis—one via the reverse phase (RP)/UPLC-MS/MS method with negative ion mode electrospray ionization (ESI), one via HILIC/UPLC-MS/MS with negative ion mode ESI, and two via separate RP/UPLC-MS/MS with positive ESI. Further details can be found in our previous publication [30].

2.4. Statistical Analysis

Two-sided tests of significance were performed in all the analyses. For differential abundance, correlation, and metagenomic functional analyses, the statistical significance was evaluated using q-values that corrected for the false discovery rate (FDR). Unless stated otherwise, a significance value of p ≤ 0.05 was considered statistically significant. The R Foundation for Statistical Computing Platform (version 4.2.2, 31 October 2022, Vienna, Austria) was used for the statistical analyses and plotting.

2.5. Microbiome Data Analysis

2.5.1. Alpha Diversity

Alpha diversity measures the total diversity within microbial communities/samples [31]. The Shannon diversity metric, which takes into account both species richness and evenness [32], was used to quantify the diversity of fungal species. The Shapiro–Wilk test was used to assess the distribution of alpha diversity measures, and it was found that they were normally distributed, which confirmed the appropriateness of using general linear models in this analysis. However, for the purpose of comparisons, Shannon diversity was analyzed using both general linear models and Mann–Whitney rank-sum tests controlling for sex.

2.5.2. Beta Diversity

Beta diversity measures the difference in diversity between two communities by evaluating how much one distribution of microbial taxa differs from another [33]. The Bray–Curtis dissimilarity metric was used to quantify beta diversities as follows:
B C i j = 1 2 C i j S i + S j
where Cij—the sum of lesser counts of each species found in both groups; Si—total count for all species in group i and Sj—total count for all species in group j.
In simple terms, this metric reports one minus the ratio of matching counts found in both samples across all species to the total number of counts found in both samples. A larger Bray–Curtis value indicates that two distributions are further apart [33].
First, an analysis of similarities (ANOSIM) was applied to compare dissimilarities between and within genotypes at the species level. Since the results showed that there were statistically significant differences (p < 0.05), the same non-parametric test was performed on the data of genotype and sex. Further ANOSIM tests were applied for each sex subset of all control–experimental pairs and between sex subsets of each experimental group. Finally, a non-parametric PERMANOVA was used to evaluate the impact of sex on beta diversity and the interaction term between sex and genotype [34].

2.5.3. Differential Abundance

Differential abundance was performed using the Analysis of Compositions of Microbiomes with Bias Correction 2 (ANCOM-BC2) [27]. This is a method that is used for differential abundance analysis that corrects biases caused by differences in sampling fractions, and it was selected as a conservative approach based on the review by Nearing et al. [35]. Default parameters were used, and the program was run multiple times for genotype and genotype plus sex interactions. All archaea and fungi that were statistically differentially abundant (q-value ≤ 0.1) in comparing an experimental group to their control with a magnitude of log2 fold change ≥ 0.1 were compiled and reported.

2.5.4. Correlation Analysis

Correlation analysis was performed on the microbial taxa that were found to be differentially abundant in each experimental group in this study (see Section 2.5.3) and our previous publication [8]. Before running this analysis, Shapiro–Wilk tests were performed to determine the normality of the data of the microbial taxa. Given that the differentially abundant microbial taxa were not normally distributed via these tests, we performed a Spearman correlation with the Benjamin–Hochberg correction using the Misty R package [36]. We did not report the correlations between pairs of differentially abundant taxa that were not significantly correlated with each other. A similar analysis was performed on the results from the sex subset ANCOM-BC2 analysis, although it revealed few new correlation patterns (Supplementary Figures S1 and S2).

2.5.5. Fungi Annotation

Shotgun sequencing methods often report fungi that are incapable of colonizing the gut [37,38,39]. These findings, often caused by food, contamination [17], or annotation errors [40], can distract from the fungi that are the most biologically relevant. To combat this, we implemented a literature search to annotate the fungal taxa into two groups—those with a low likelihood of being biologically relevant in the mammalian gut and those with a high likelihood of being biologically relevant. This step did not filter or remove any taxa.
First, we utilized the curated literature review by Suhr et al. [37], which identified the fungi confirmed by multiple sources to be inhabitants of the mammalian gut, to rule in relevant organisms as having a high likelihood. Next, we labeled as less likely those fungi from groups that are incapable of surviving in the gut, as described by Suhr et al. and Lavrinienko et al. [37,38,39]. These include edible macrofungi [37,38], lichen fungi [38], plant pathogens and endophytes [37,38,39], and wood-decaying fungi [37,39]. Soil fungi were deemed high likelihood, as they have been reported as opportunistic pathogens, even if the gut is not their preferred niche [37,39]. Finally, entomopathogenic fungi, which specifically infect insects [41], were flagged as less likely.
The fungi were sorted into these categories for classification using the FUNGuild functional database [42]. This database is sparse and, when a taxa was missing, it was manually categorized based on the literature-established properties of that taxa. For edible macrofungi, the genus Morchella [43], the genus Amanita [44], Hypsizygus marmoreus [45], and Coprinus comatus were uncovered [46]. For entomopathogens, the genus Hirsutella [47], Tetrapisispora blattae [48], and Metarhizium acridum were identified [49]. For plant endophytes, Rhizophagus custos [50] and Sarocladium zeae were uncovered [51]. For plant commensals, the genus Starmerella [52] and Candida magnoliae were uncovered [53]. For plant pathogens, the genus Puccinia [54], Heterobasidion irregulare [55], and Colletotrichum gloeosporioides were identified [56]. For wood-decaying fungi, the genus Coprinopsis [57] and Phlebia tremellosa were identified [58]. For lichen, Sarcogyne privigna was uncovered [59].
Differential abundance results with these annotations can be found in Supplementary Figure S3.

2.5.6. Functional Analysis

Functional analysis predicts differences in potential functionality of the overall (archaeal, fungal, bacterial, and viral) microbiomes of control animals versus those of the experimental groups. This method examines all the sequenced genes in each community and their functions (see Section 2.2), regardless of their microbe of origin, and uses this information to build functional profiles for each community at the individual gene, module, and pathway levels [60]. Functional analysis was conducted to compare the statistically significant differences (q ≤ 0.05) between each of the experimental profiles and their controls.

2.5.7. Metabolomics Analysis

The metabolomics data were analyzed by applying the Welsh’s two-sample t-test on the log-transformed data for the VDRΔLyz vs. VDRLoxp and VDRΔLyz vs. VDRΔIEC comparisons and through applying an ANOVA test on the log-transformed data for the VDRΔIEC vs. VDRLoxp comparison [8]. Effect sizes were evaluated via log2 fold changes compared to the reference group.

3. Results

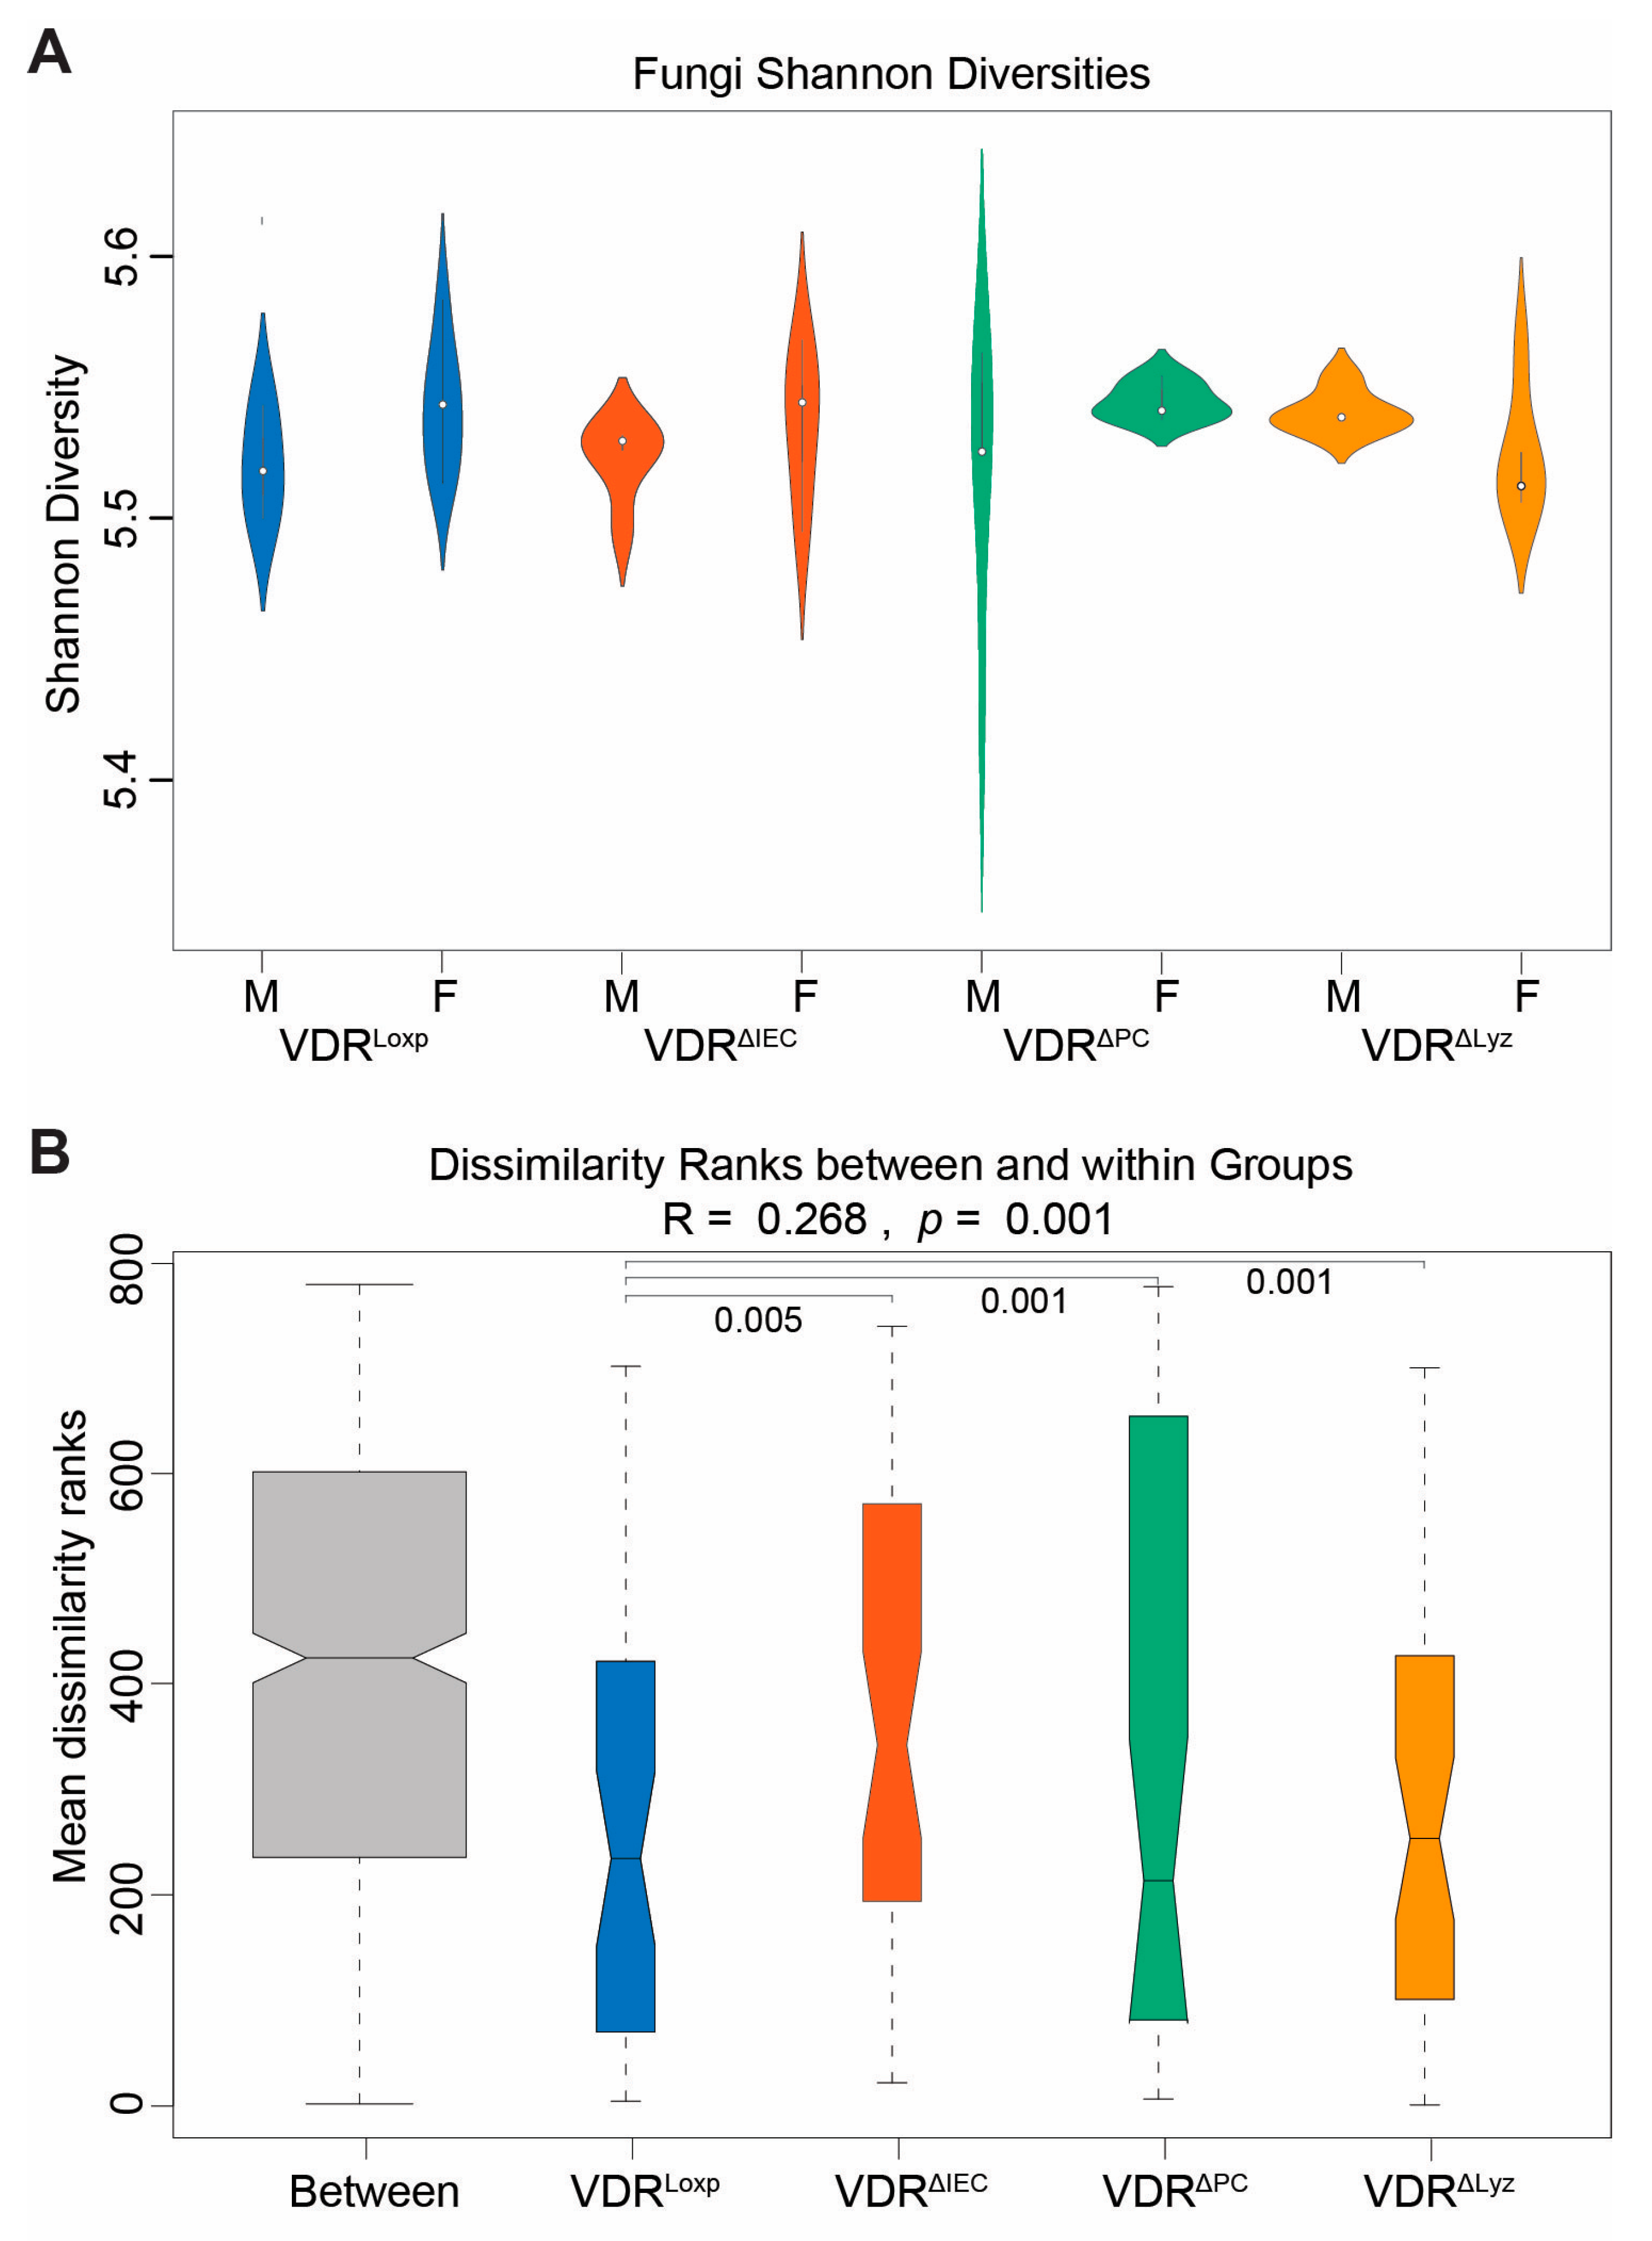
3.1. Conditional VDR KO Alters Fungal Beta Diversity

No significant differences in fungal Shannon diversity were found between the control VDRLoxp group and any of the VDRΔIEC, VDRΔPC, and VDRΔLyz groups (Figure 1A). A general linear model that controlled for sex was then applied to compare the Shannon diversities of each experimental group with the control group. No significant difference was found in a gender-specific manner.
Regarding the beta diversities, all the knockout groups encompassed distributions of the fungal species that were significantly different from the distributions of the VDRLoxp control group (p < 0.05) (Figure 1B).

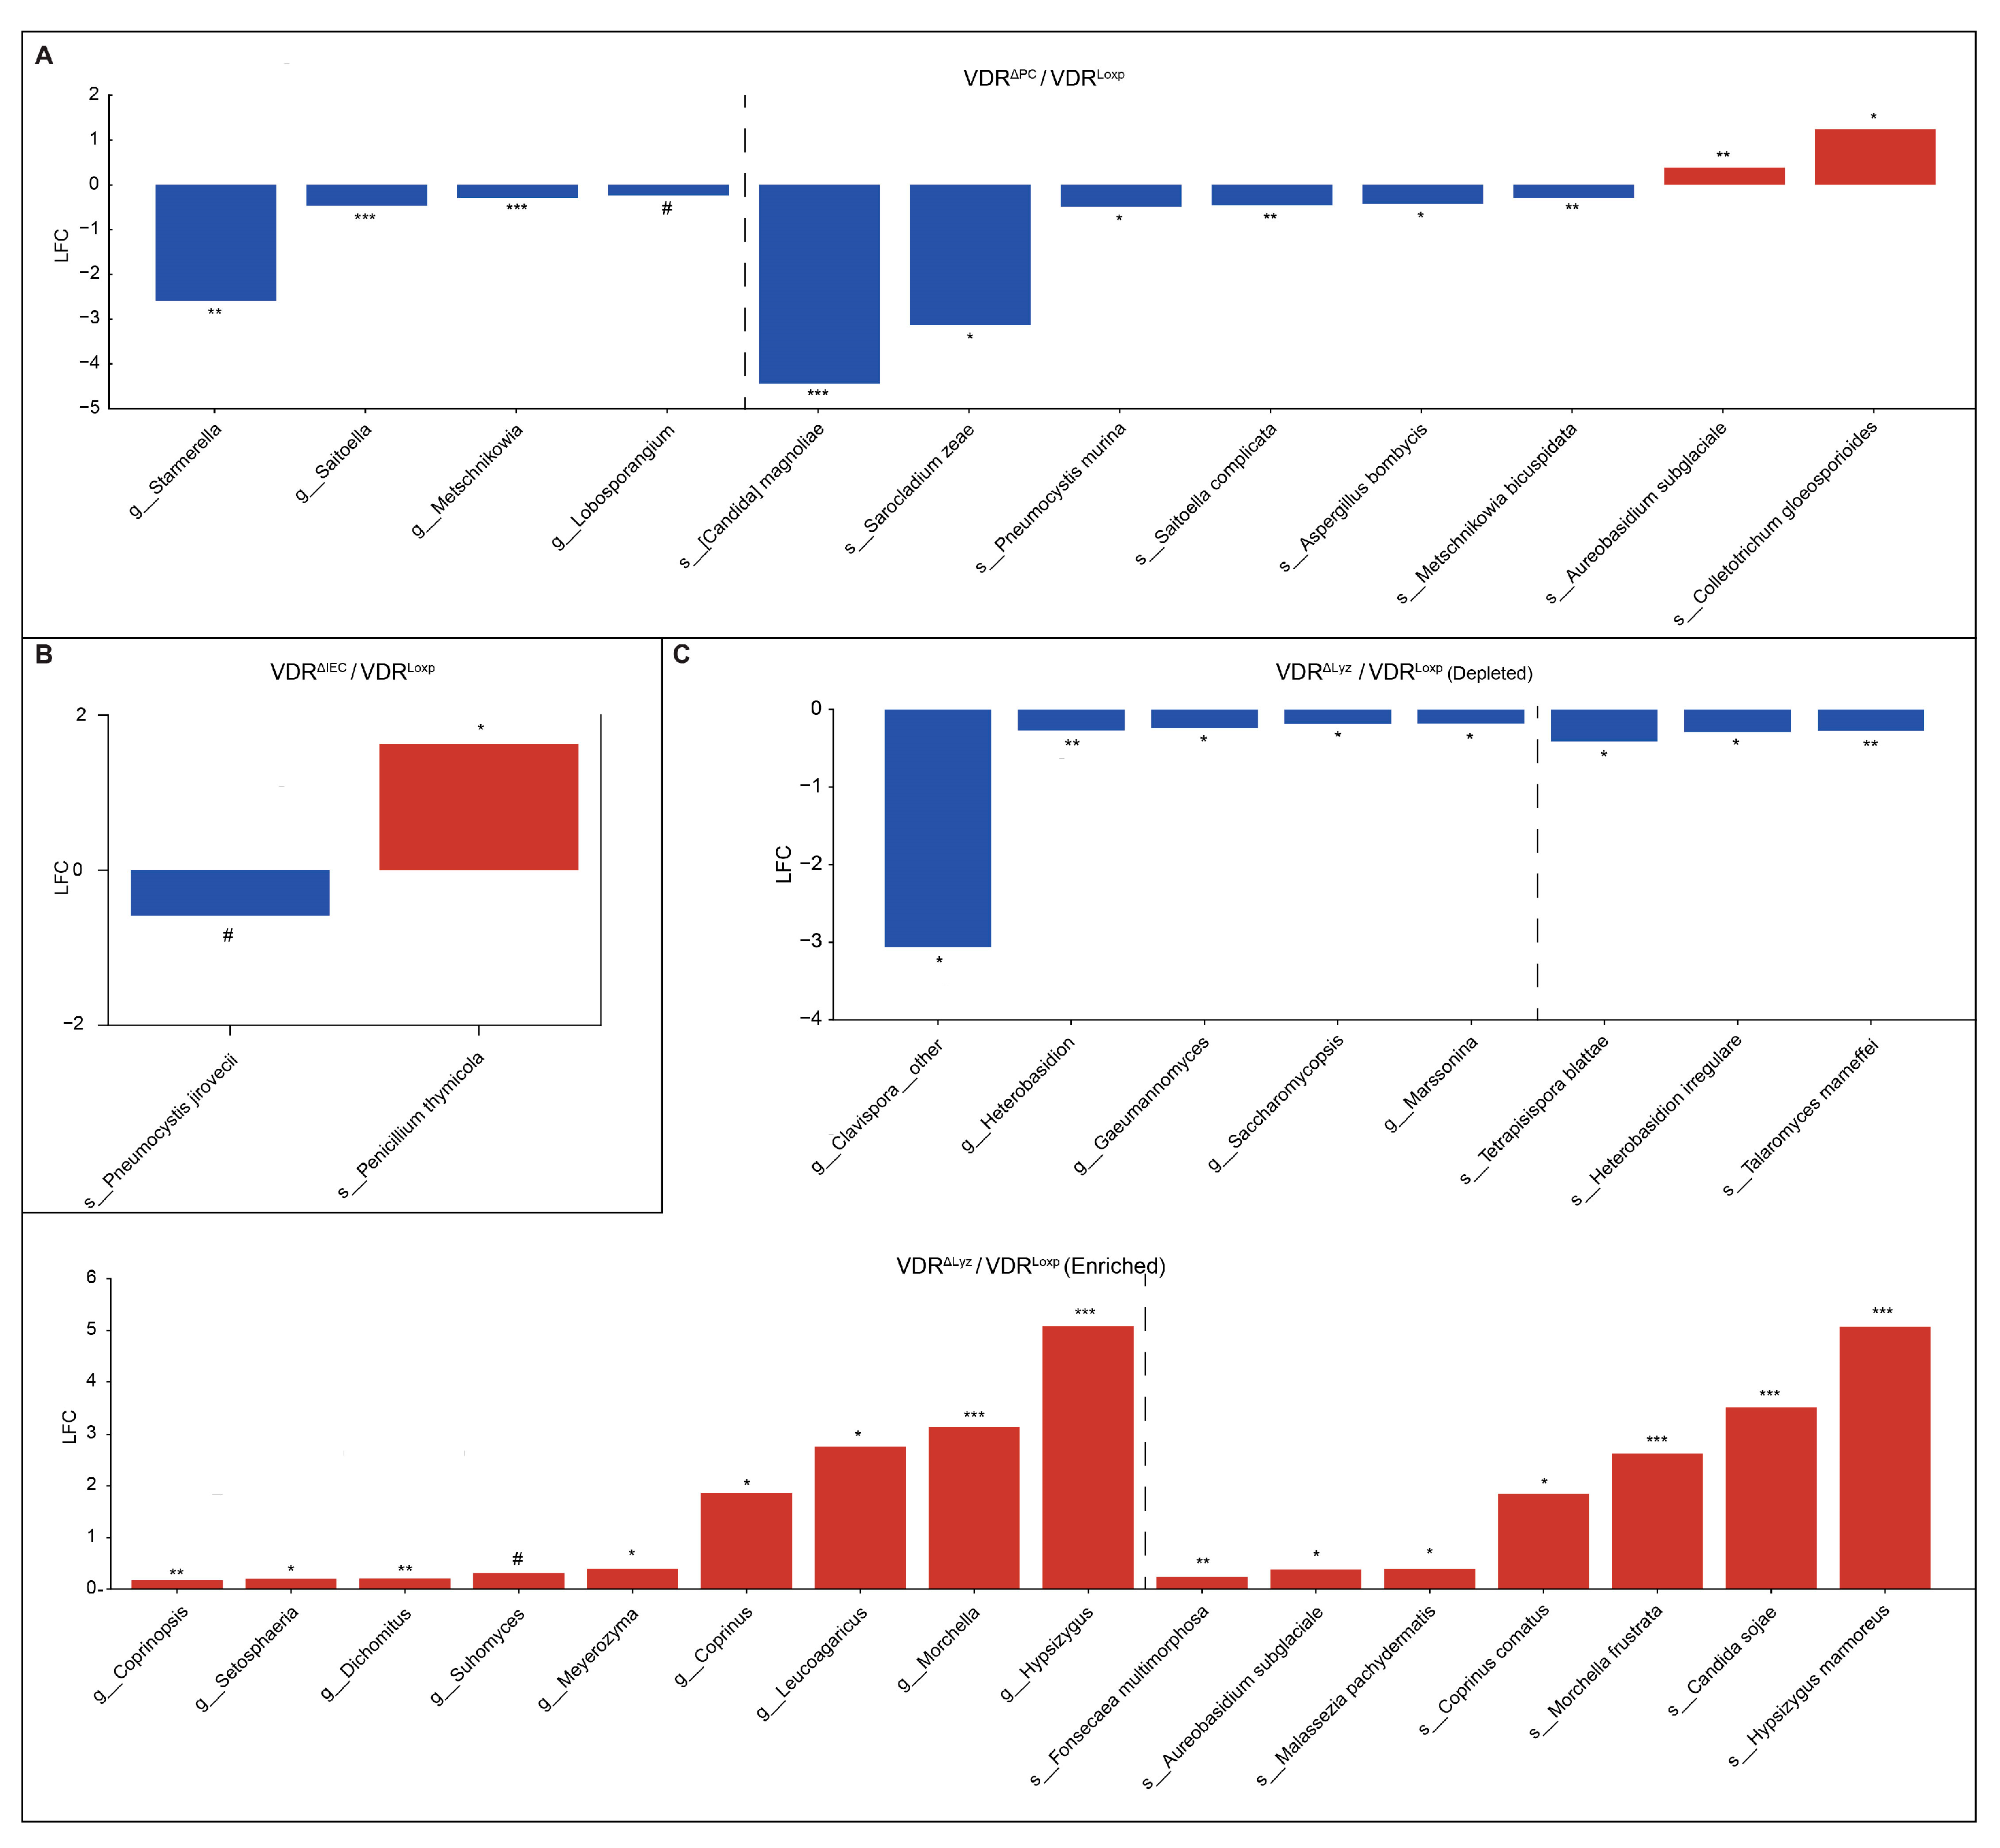
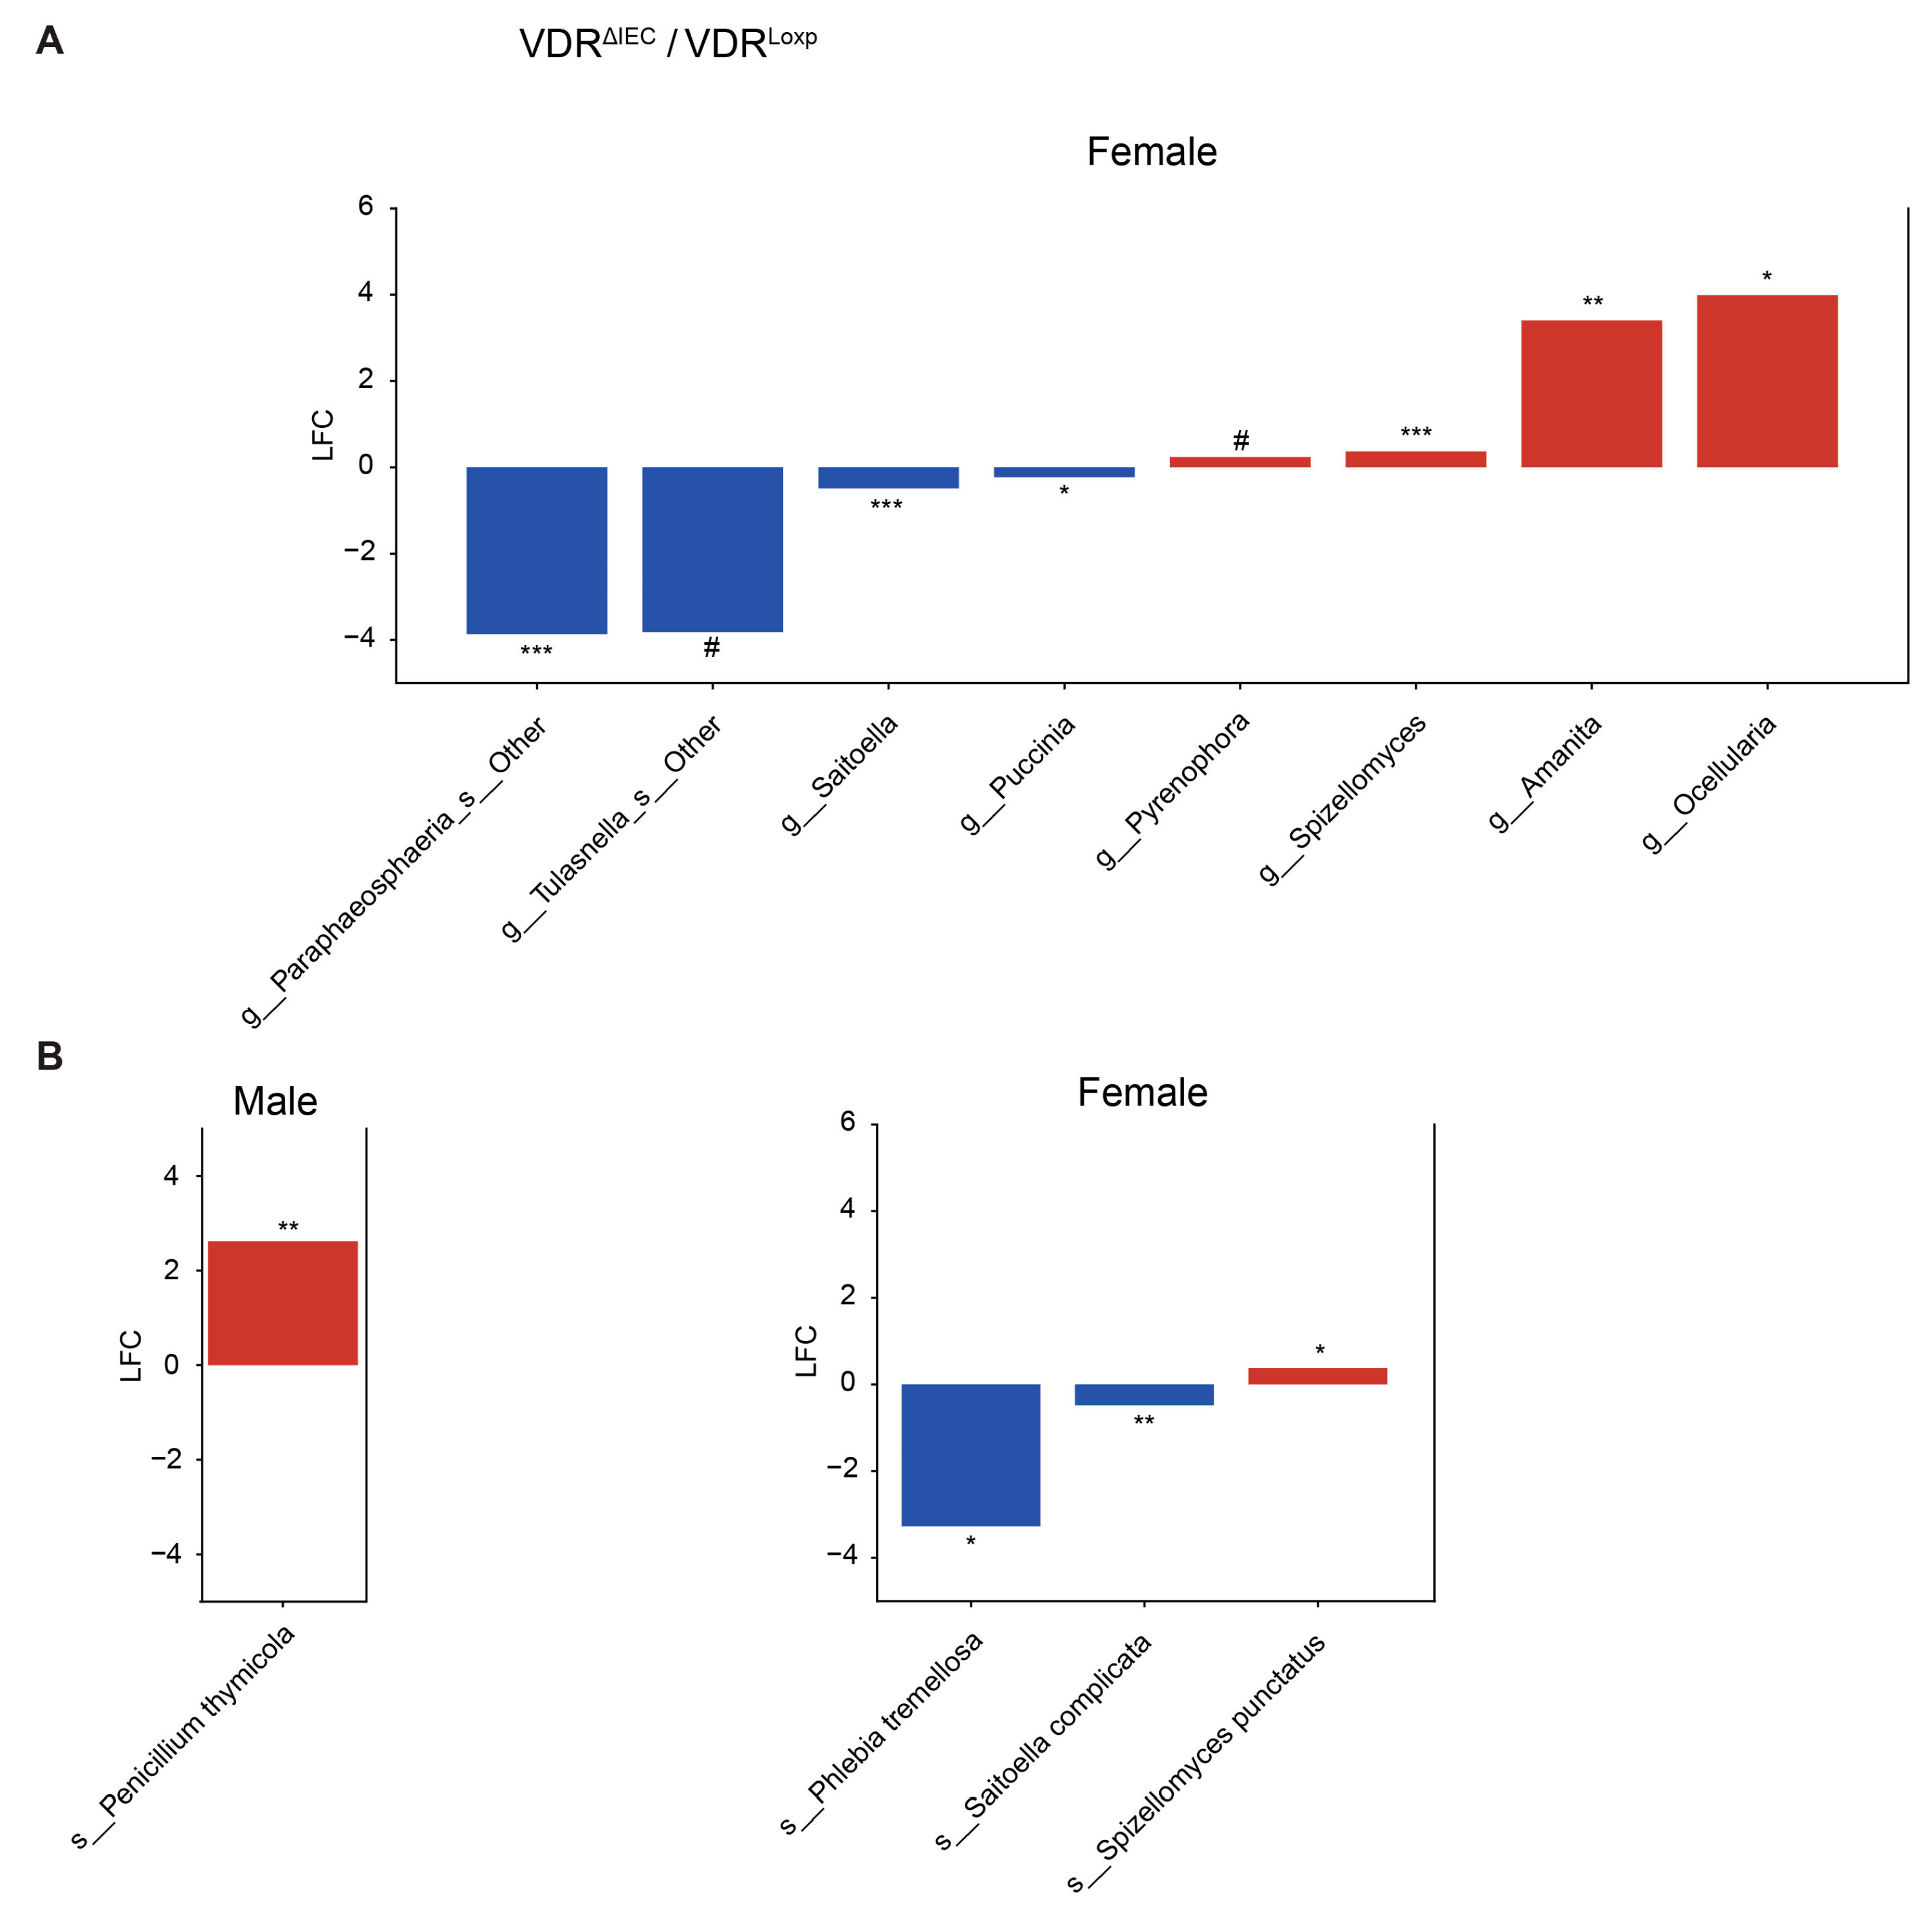
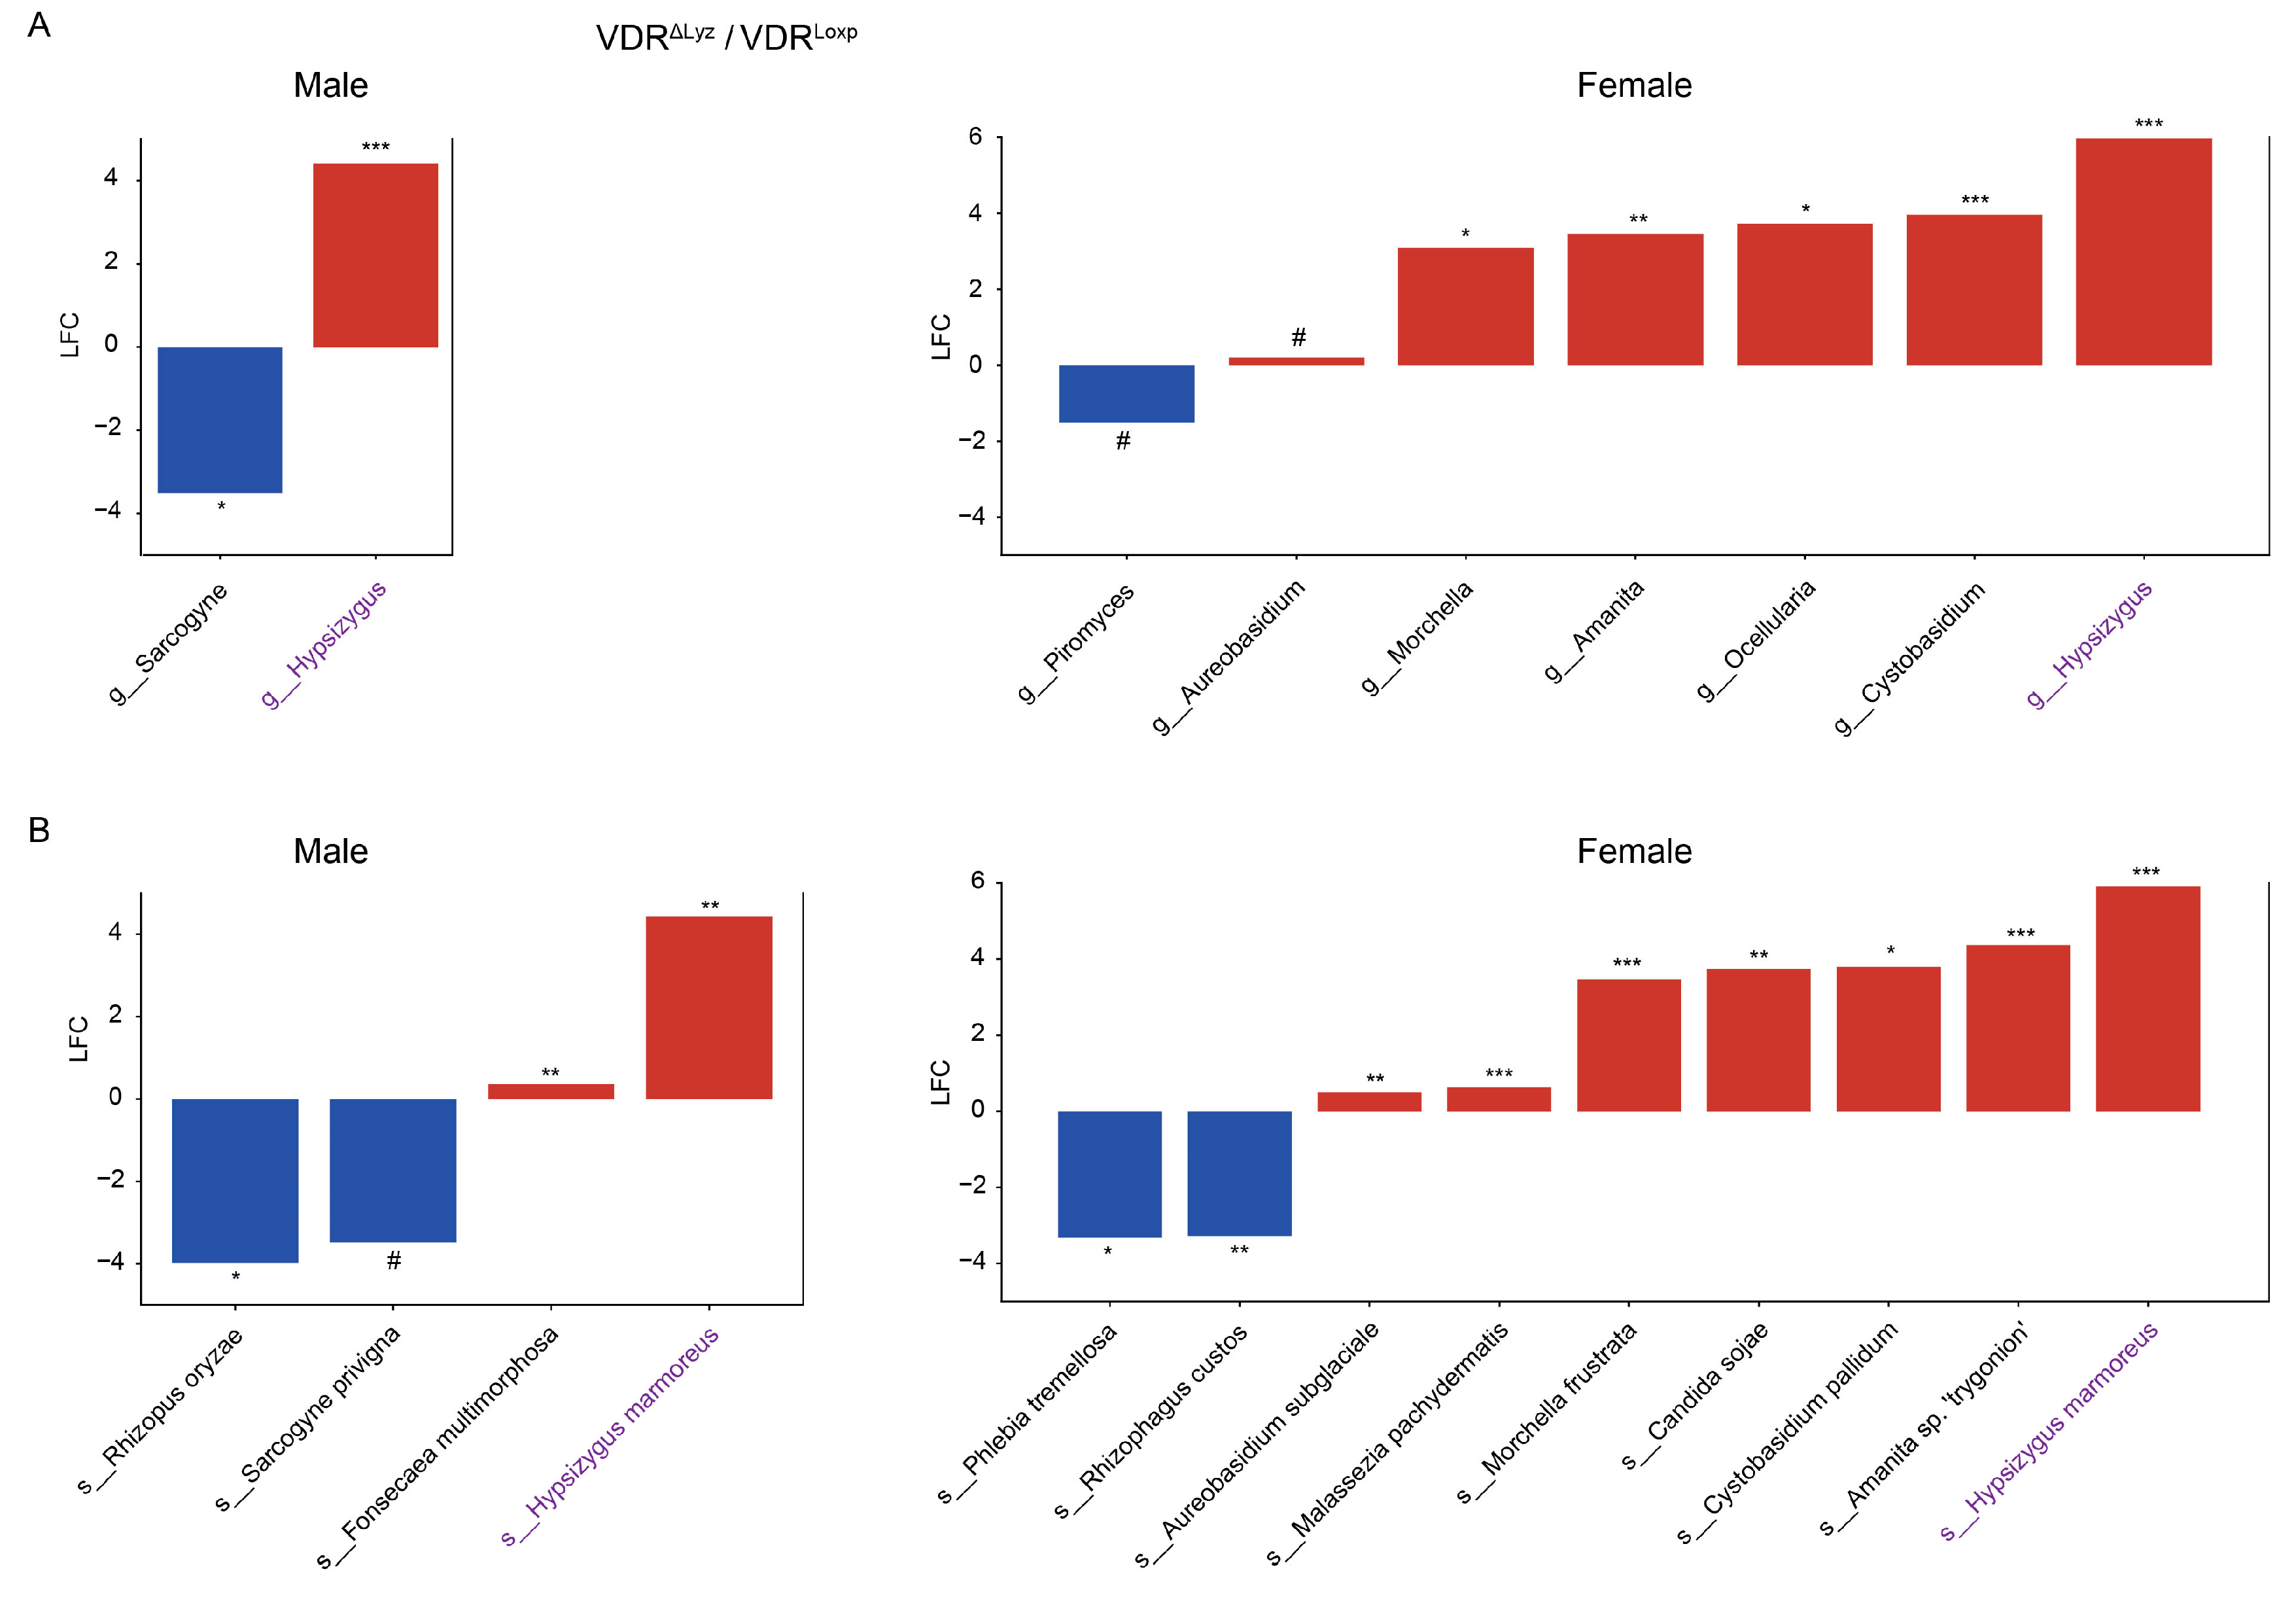
3.2. Differentially Abundant Fungi Vary by VDR KO in Different Tissues

Having shown that a VDR deletion changes the overall fungal communities, we next investigated which specific members of those communities were impacted by searching for microbes that were differentially abundant between the KO and control groups. This was carried out using the Analysis of Compositions of Microbiomes with Bias Correction 2, a conservative differential abundant toolkit that controls for biases due to sampling [27]. The findings that were uncovered using the ANCOM-BC2 toolkit were followed by the application of significance (q ≤ 0.1) and fold change thresholds (│log2(Fold change)│ ≥ 0.1) to narrow down the relevant taxa.
Each VDR KO group had distinct fungi relative to the control group over a wide range of log2 fold changes (from −4.5 to 5.0) (Figure 2). The VDRΔPC group exhibited a decrease in ten such taxa (including the genera Starmerella, Saitoella, Metschnikowia, and Lobosporangium, along with the species Candida magnoliae, Sarocladium zeae, Pneumocystis murina, Saitoella complicata, Aspergillus bombycis, and Metschnikowia bicuspidata) and an increase in two taxa (the species Aureobasidium subglaciale and Colletotrichum gleosporioides). The VDRΔIEC group showed a decrease in a single species (Pneumocystis jirovecii) and an increase in a single species (Penicillum thymicola). Finally, the VDRΔLyz group displayed eight taxa that were depleted (the genera Heterobasidion, Gaeumannomyces, Saccharomycopsis, and Marssonina, along with the species Tetrapisispora blattae, Heterobasidion irregulare, Talormyces marneffei, and an unidentified Clavispora species) relative to the VDRLoxp group and sixteen that were relatively enriched (the genera Coprinopsis, Setosphaeria, Dichomitus, Suhomyces, Meyerozyma, Coprinus, Leucoagaricus, Morchella, and Hypsizygus, along with the species Fonsecaea multimorphosa, Aureobasidium subglaciale, Malassezia pachydermatis, Coprinus comatus, Morchella furstrata, Canddia sojae, and Hypsizygus mammoreus).

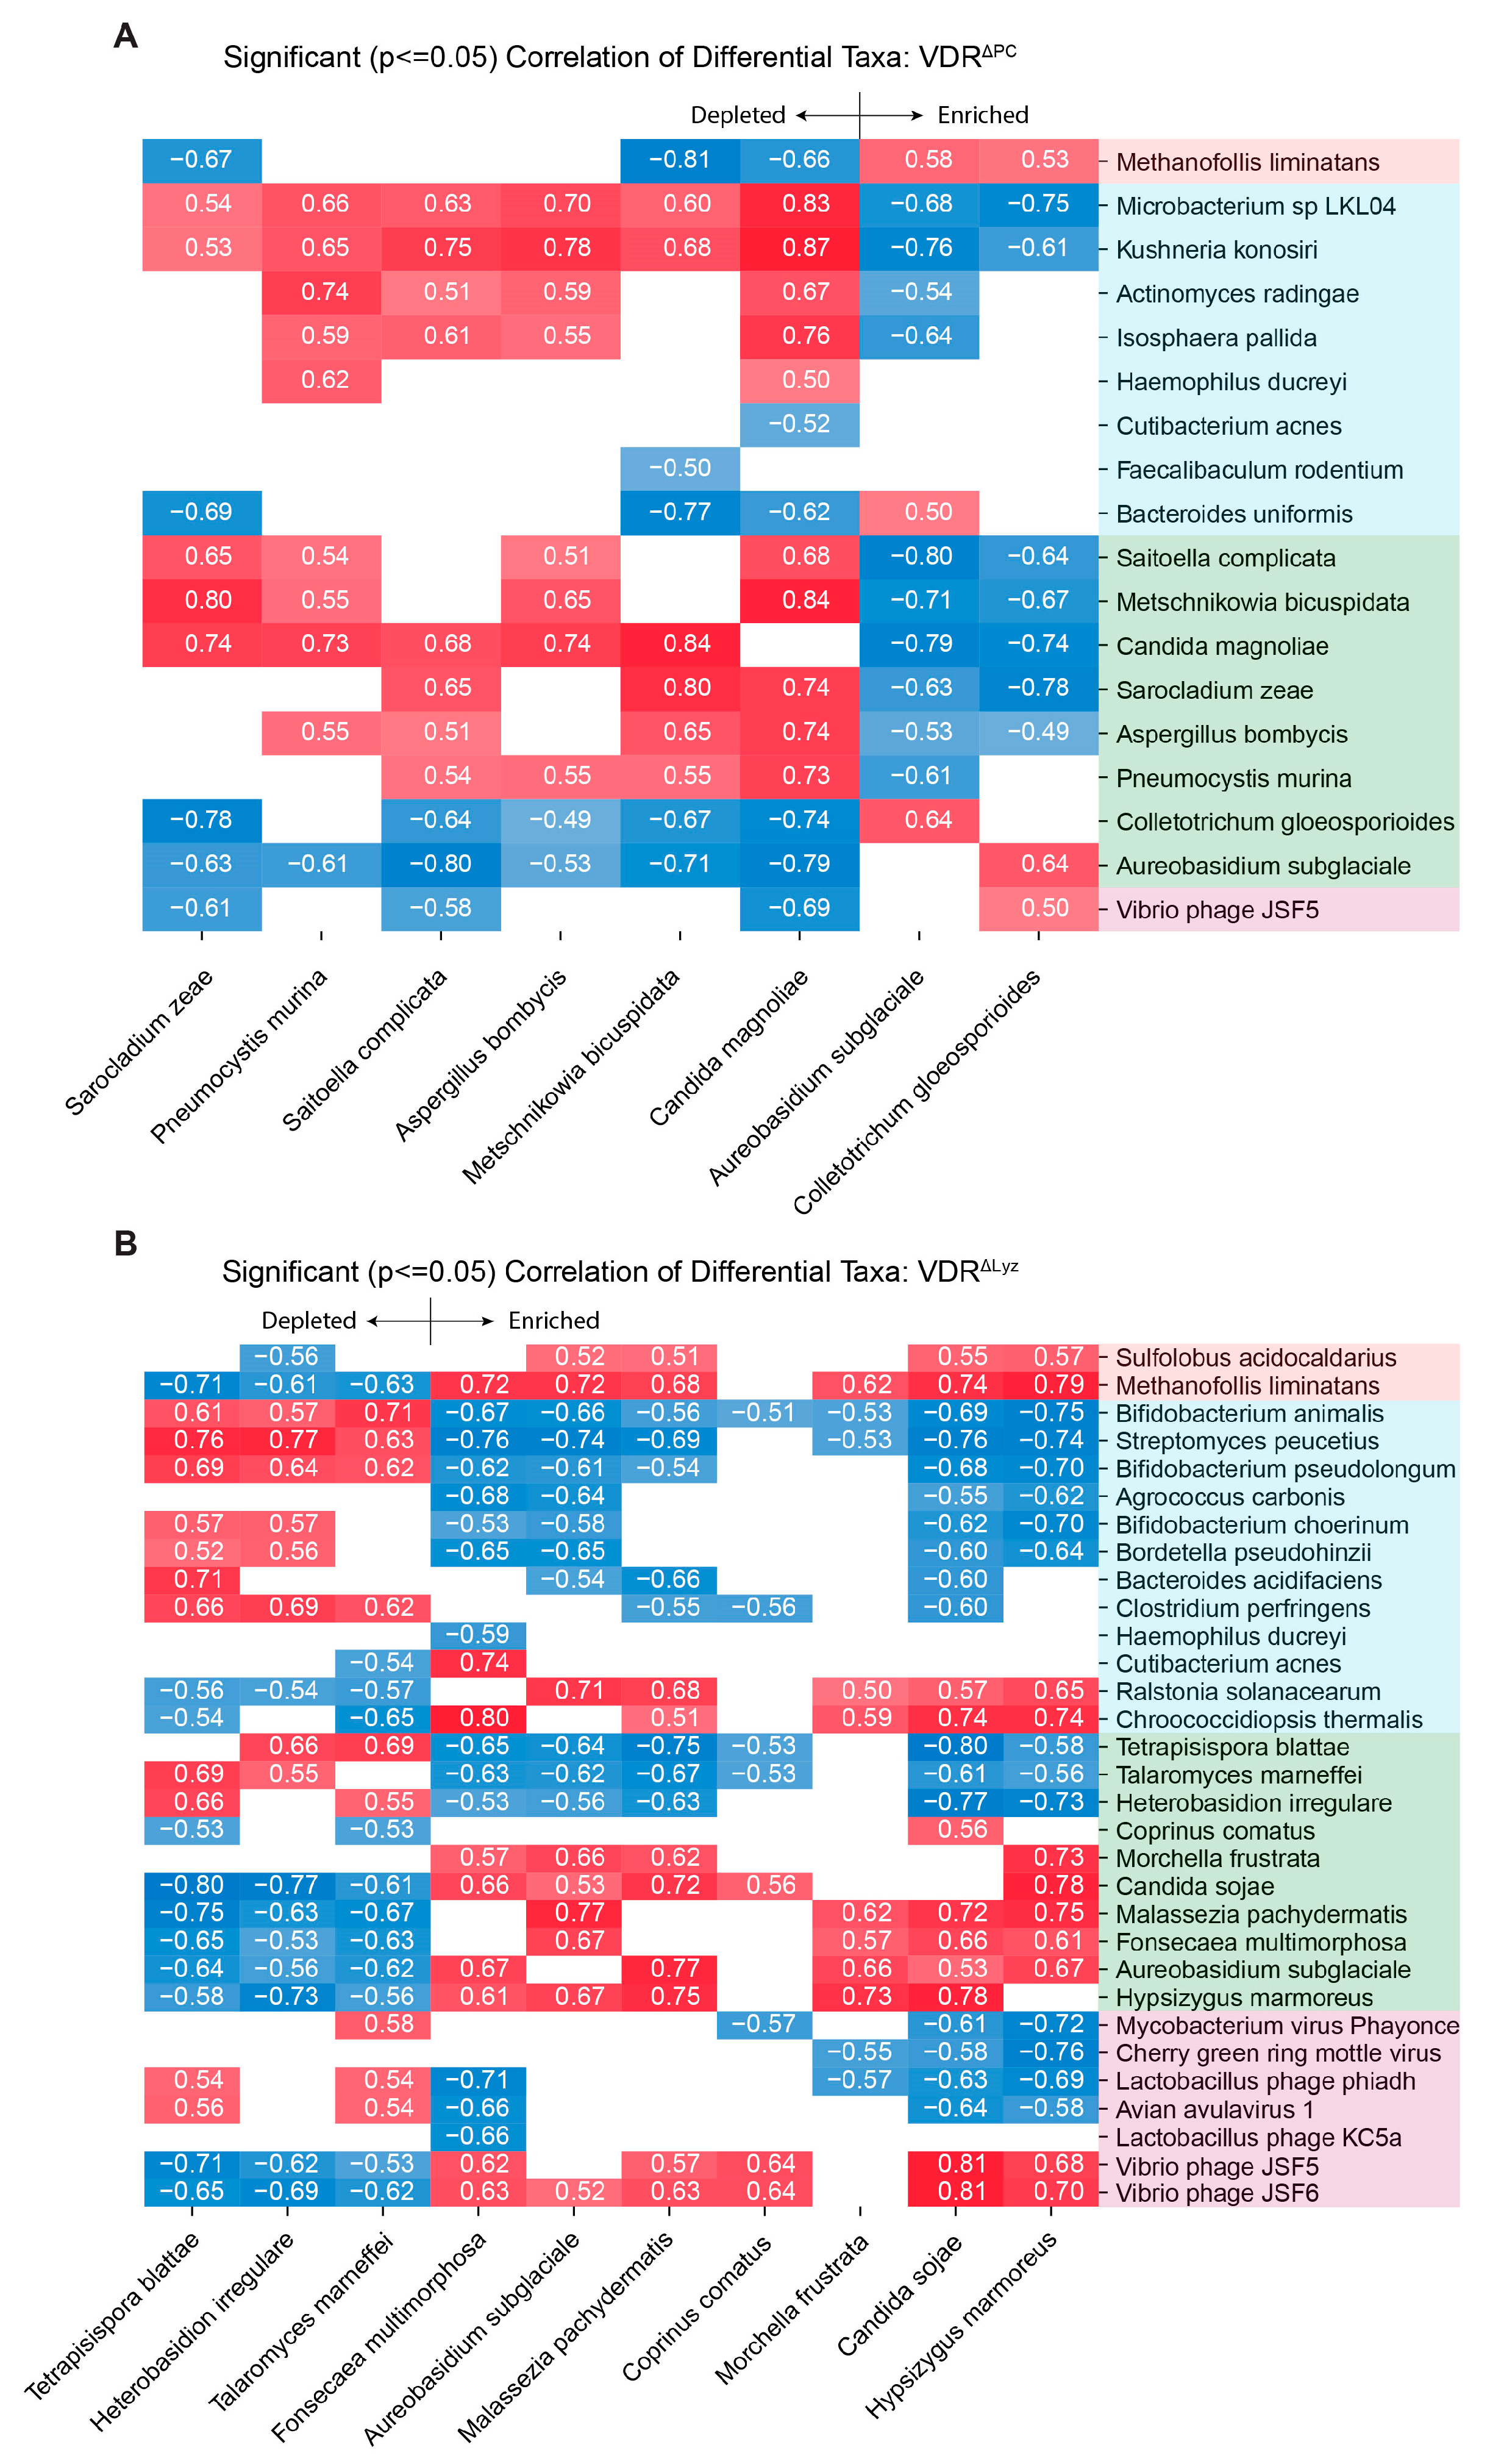
3.3. Significant Fungal Correlations Exist with Archaea, Bacteria, and Viruses

We performed correlation analyses to study how knockout-induced changes in fungi may relate to the changes in archaeal, bacterial, and viral populations. Those pairs of differentially abundant microbial taxa (q ≤ 0.1) that have significant correlations (p ≤ 0.05) are displayed (Figure 3). Decreasing correlation patterns exhibited positive correlations with the fungi that were less abundant in the knockout mice and negative correlations with the fungi that were more abundant. Increasing correlation patterns displayed positive correlations with the fungi that were more abundant in the KO mice and negative correlations with the fungi that were less abundant.
Within the VDRΔPC group, multiple bacterial species (Microbacterium sp LKL104, Isosphaera pallida, Kushneria konosiri, and Actinomyces radingae) and several fungal species (Saitoella complicate, Metschnikowia bicuspidata, Candida magnolia, Sarocladium zeae, Aspergillus bombycis, and Pneumocystis murina) follow a decreasing correlation pattern (Figure 3A). One archaeal species (Methanofollis liminatans), one bacterial species (Bacteroides uniformis), two fungal species (Colletotrichum gloeosporioides and Aureobasidium subglaciale), and one virus (Vibrio phage JSF5) followed an increasing correlation pattern. In contrast, there were no significant correlation pairs in the VDRΔIEC group. Within the VDRΔLyz group, however, many bacterial species (Bacteroides acidifaciens, Bifidobacterium animalis, Bifidobacterium choerinum, Bifidobacterium pseudolongum, Haemophilus ducreyi, Clostriduium perfringens, Bordetella pseudohinzii, Agrococcus carbonis, and Streptomyces peucetius), three fungal species (Tetrapisispora blattae, Talaromyces marneffei, and Heterobasidion irregulare), and several viruses (Lactobacillus phage KC5a, Lactobacillus phage phiadh, Mycobacterium virus phayonce, Avian avulvavirus 1, and Cherry green ring mottle virus) followed a decreasing correlation pattern. Two archaeal species (Methanofollis liminatans and Sulfolobus acidocaldarius), three bacterial species (Cutibacterium acnes, Chroococcidiopsis thermalis, and Ralstonia solanacaerum), seven fungal species (Coprinus comatus, Morchella frustrata, Candida sojae, Malassezia pachydermatis, Fonsecea multimorphosa, Aurobasidium subglaciale, and Hypsizygus marmoreus), and two vibrio phages (Vibrio phage JSF5 and JSF6) followed an increasing correlation pattern.

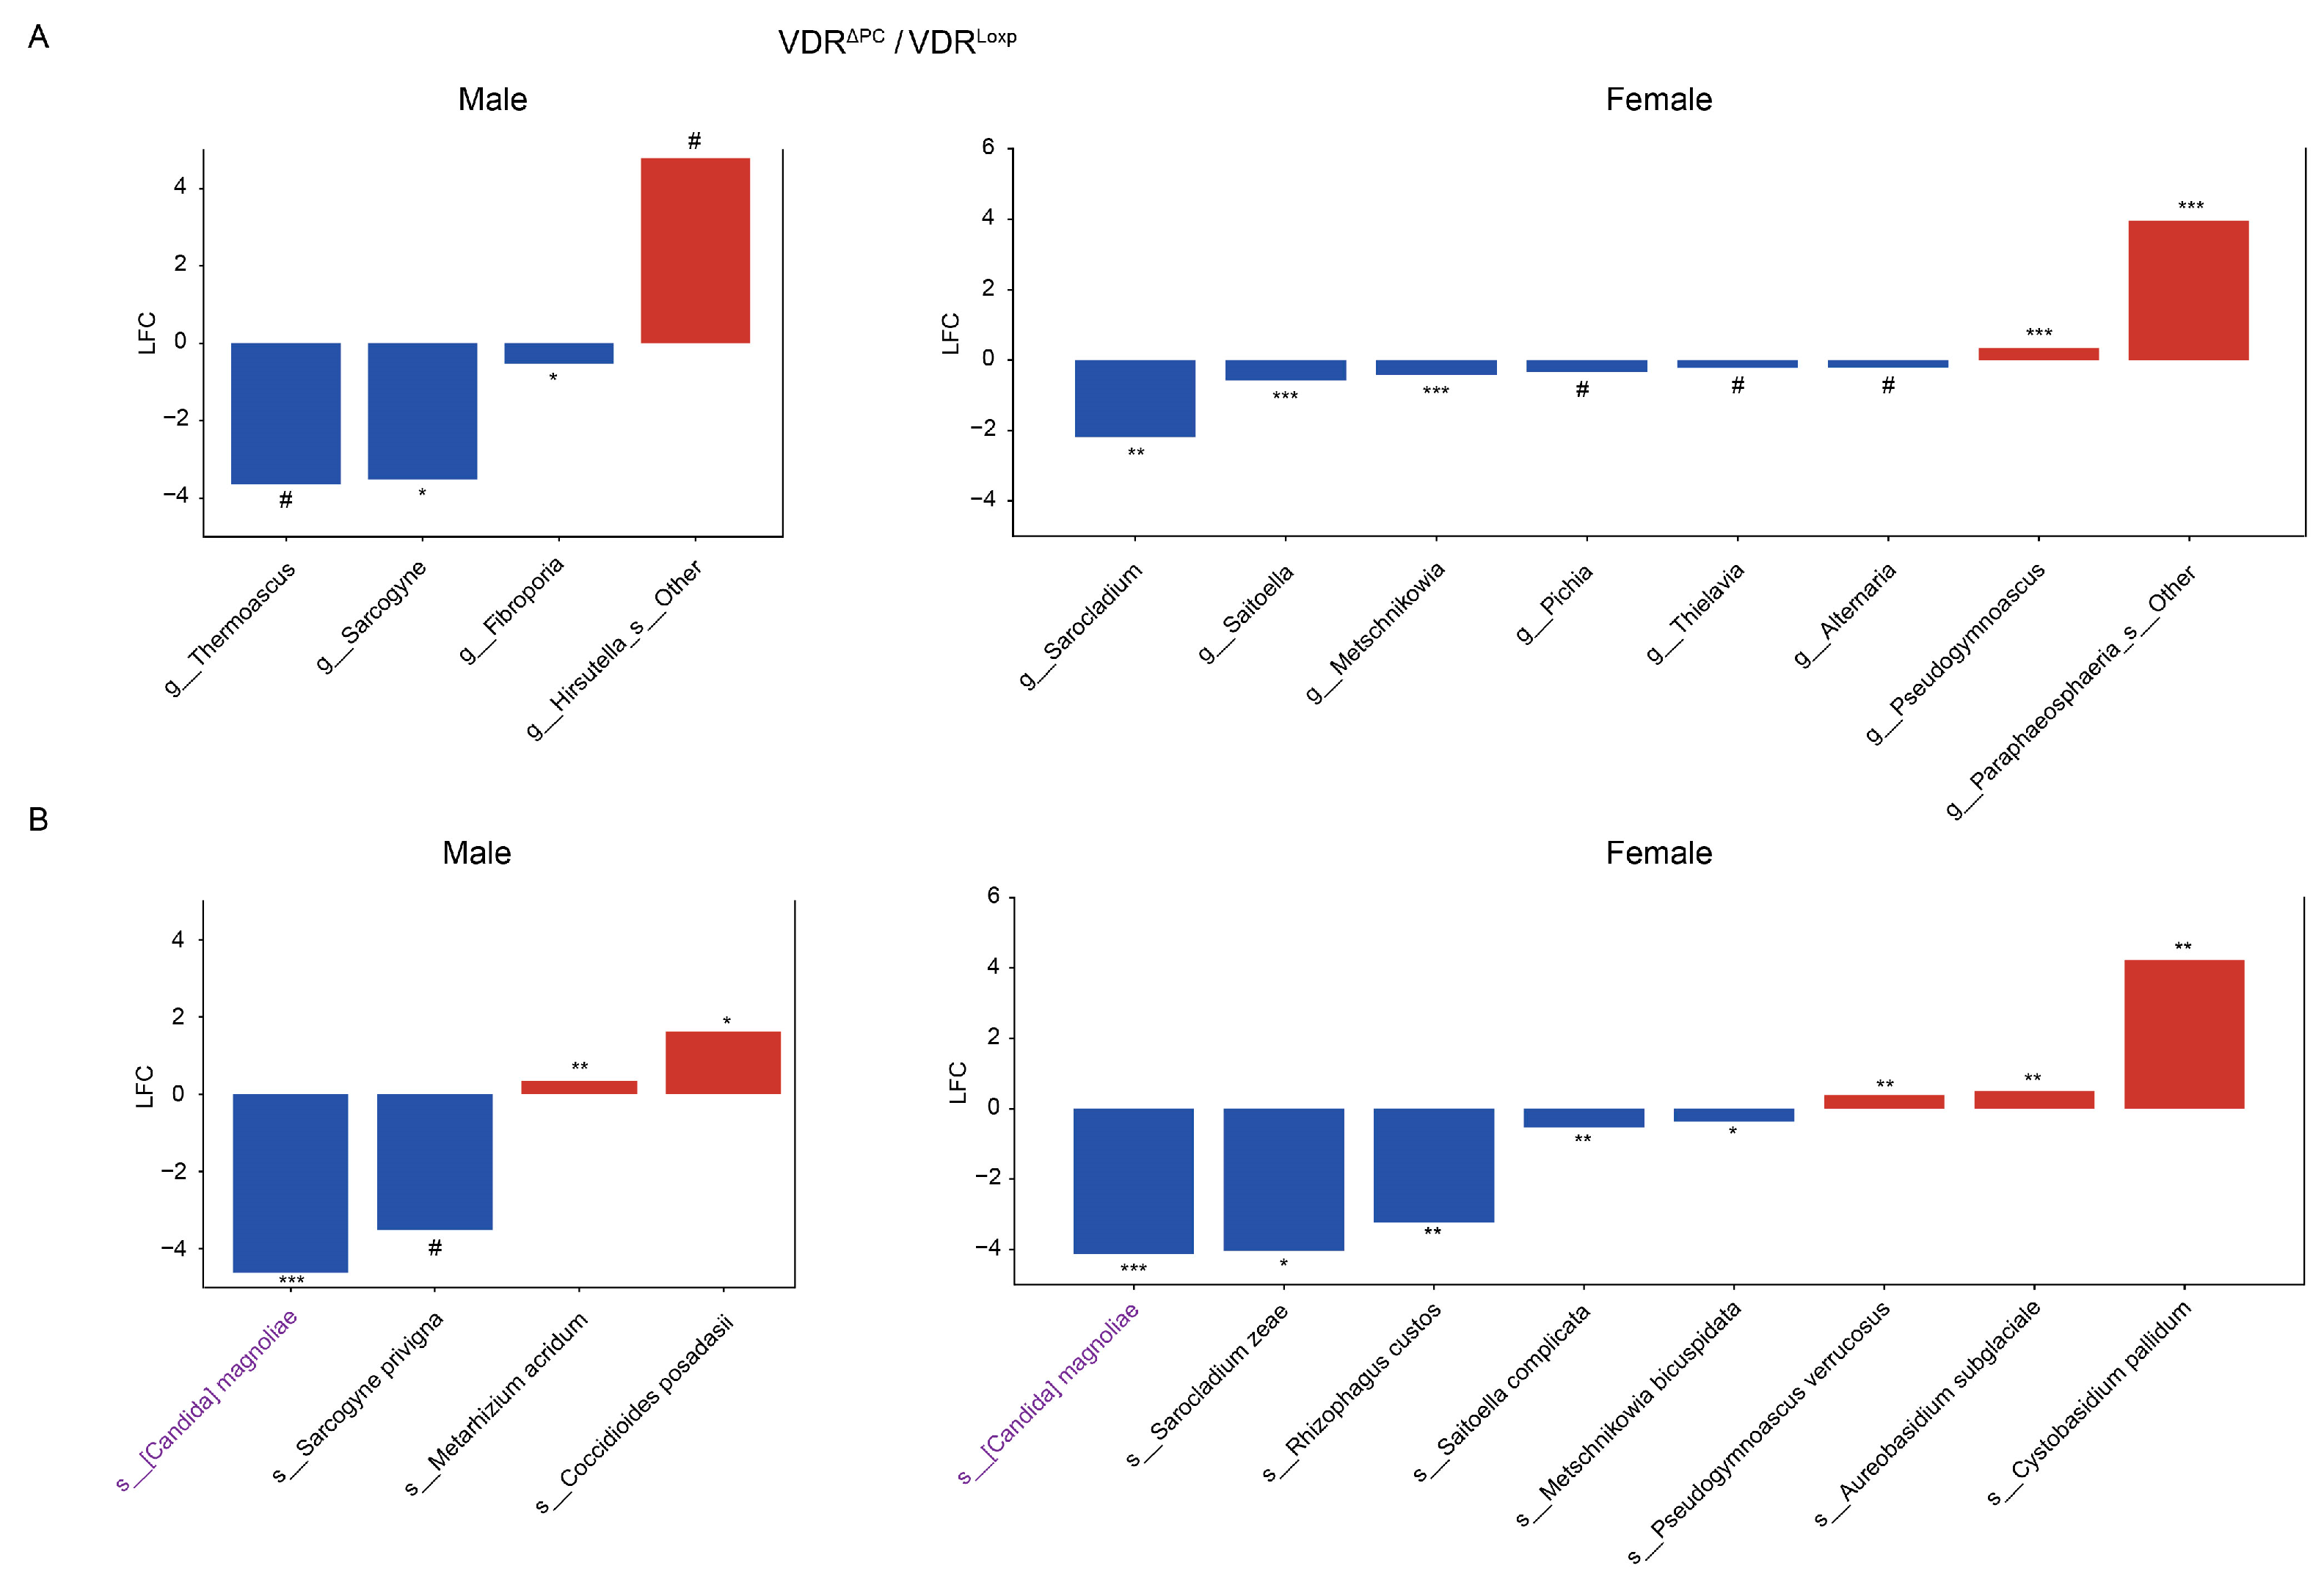
3.4. Sex Differences of Fungal Dysbiosis in the VDR KO Mice

The fungal data were split by sex, and the beta diversity of the fungal data was further tested for gender differences (Supplementary Figure S4). A subsequent PERMANOVA test [34] revealed a significant (p = 0.002) sex difference between male and female VDRΔLyz mice. ANOSIM statistical testing [34] on the sex subsets showed that, while all female experimental groups had marginally significantly (p < 0.1) different fungal distributions from the female control group, only the male VDRΔLyz group had a marginally significant (p = 0.081) different distribution from the male VDRΔLyz group (Supplementary Figure S4). What is more, ANOSIM testing between sex groups within each group revealed significant differences (p < 0.05) in the distribution of fungi within each KO group but not within the control group.
The use of ANCOM-BC2 [27] on the sex subsets revealed distinct differential fungi in each subset (Figure 4, Figure 5 and Figure 6). None of the twelve differentially abundant genera (four in males and eight in females) in the subsets of the VDRΔPC mice were found in both the male and female subsets (Figure 4A), and only Candida magnoliae of the eleven differentially abundant species (three in only male, seven in only female, and one in both) was found in both subsets (Figure 4B).
The sex subsets of the VDRΔIEC mice shared no differentially abundant taxa from the eight genera (eight in males) (Figure 5A) and four species (one in males and three in females) (Figure 5B) that were found to be significantly differentially abundant relative to the control mice.
In the VDRΔLyz group, the genus Hypsizugus was the only one of the eight differentially abundant genera (one in only males, seven in only females, and one in both) that was found in both groups (Figure 6A), and its member Hypsizygus mamoreus was the only one of the twelve differentially abundant species (three in only males, eight in only females, and one in both) that was found in both sex subsets (Figure 6B).

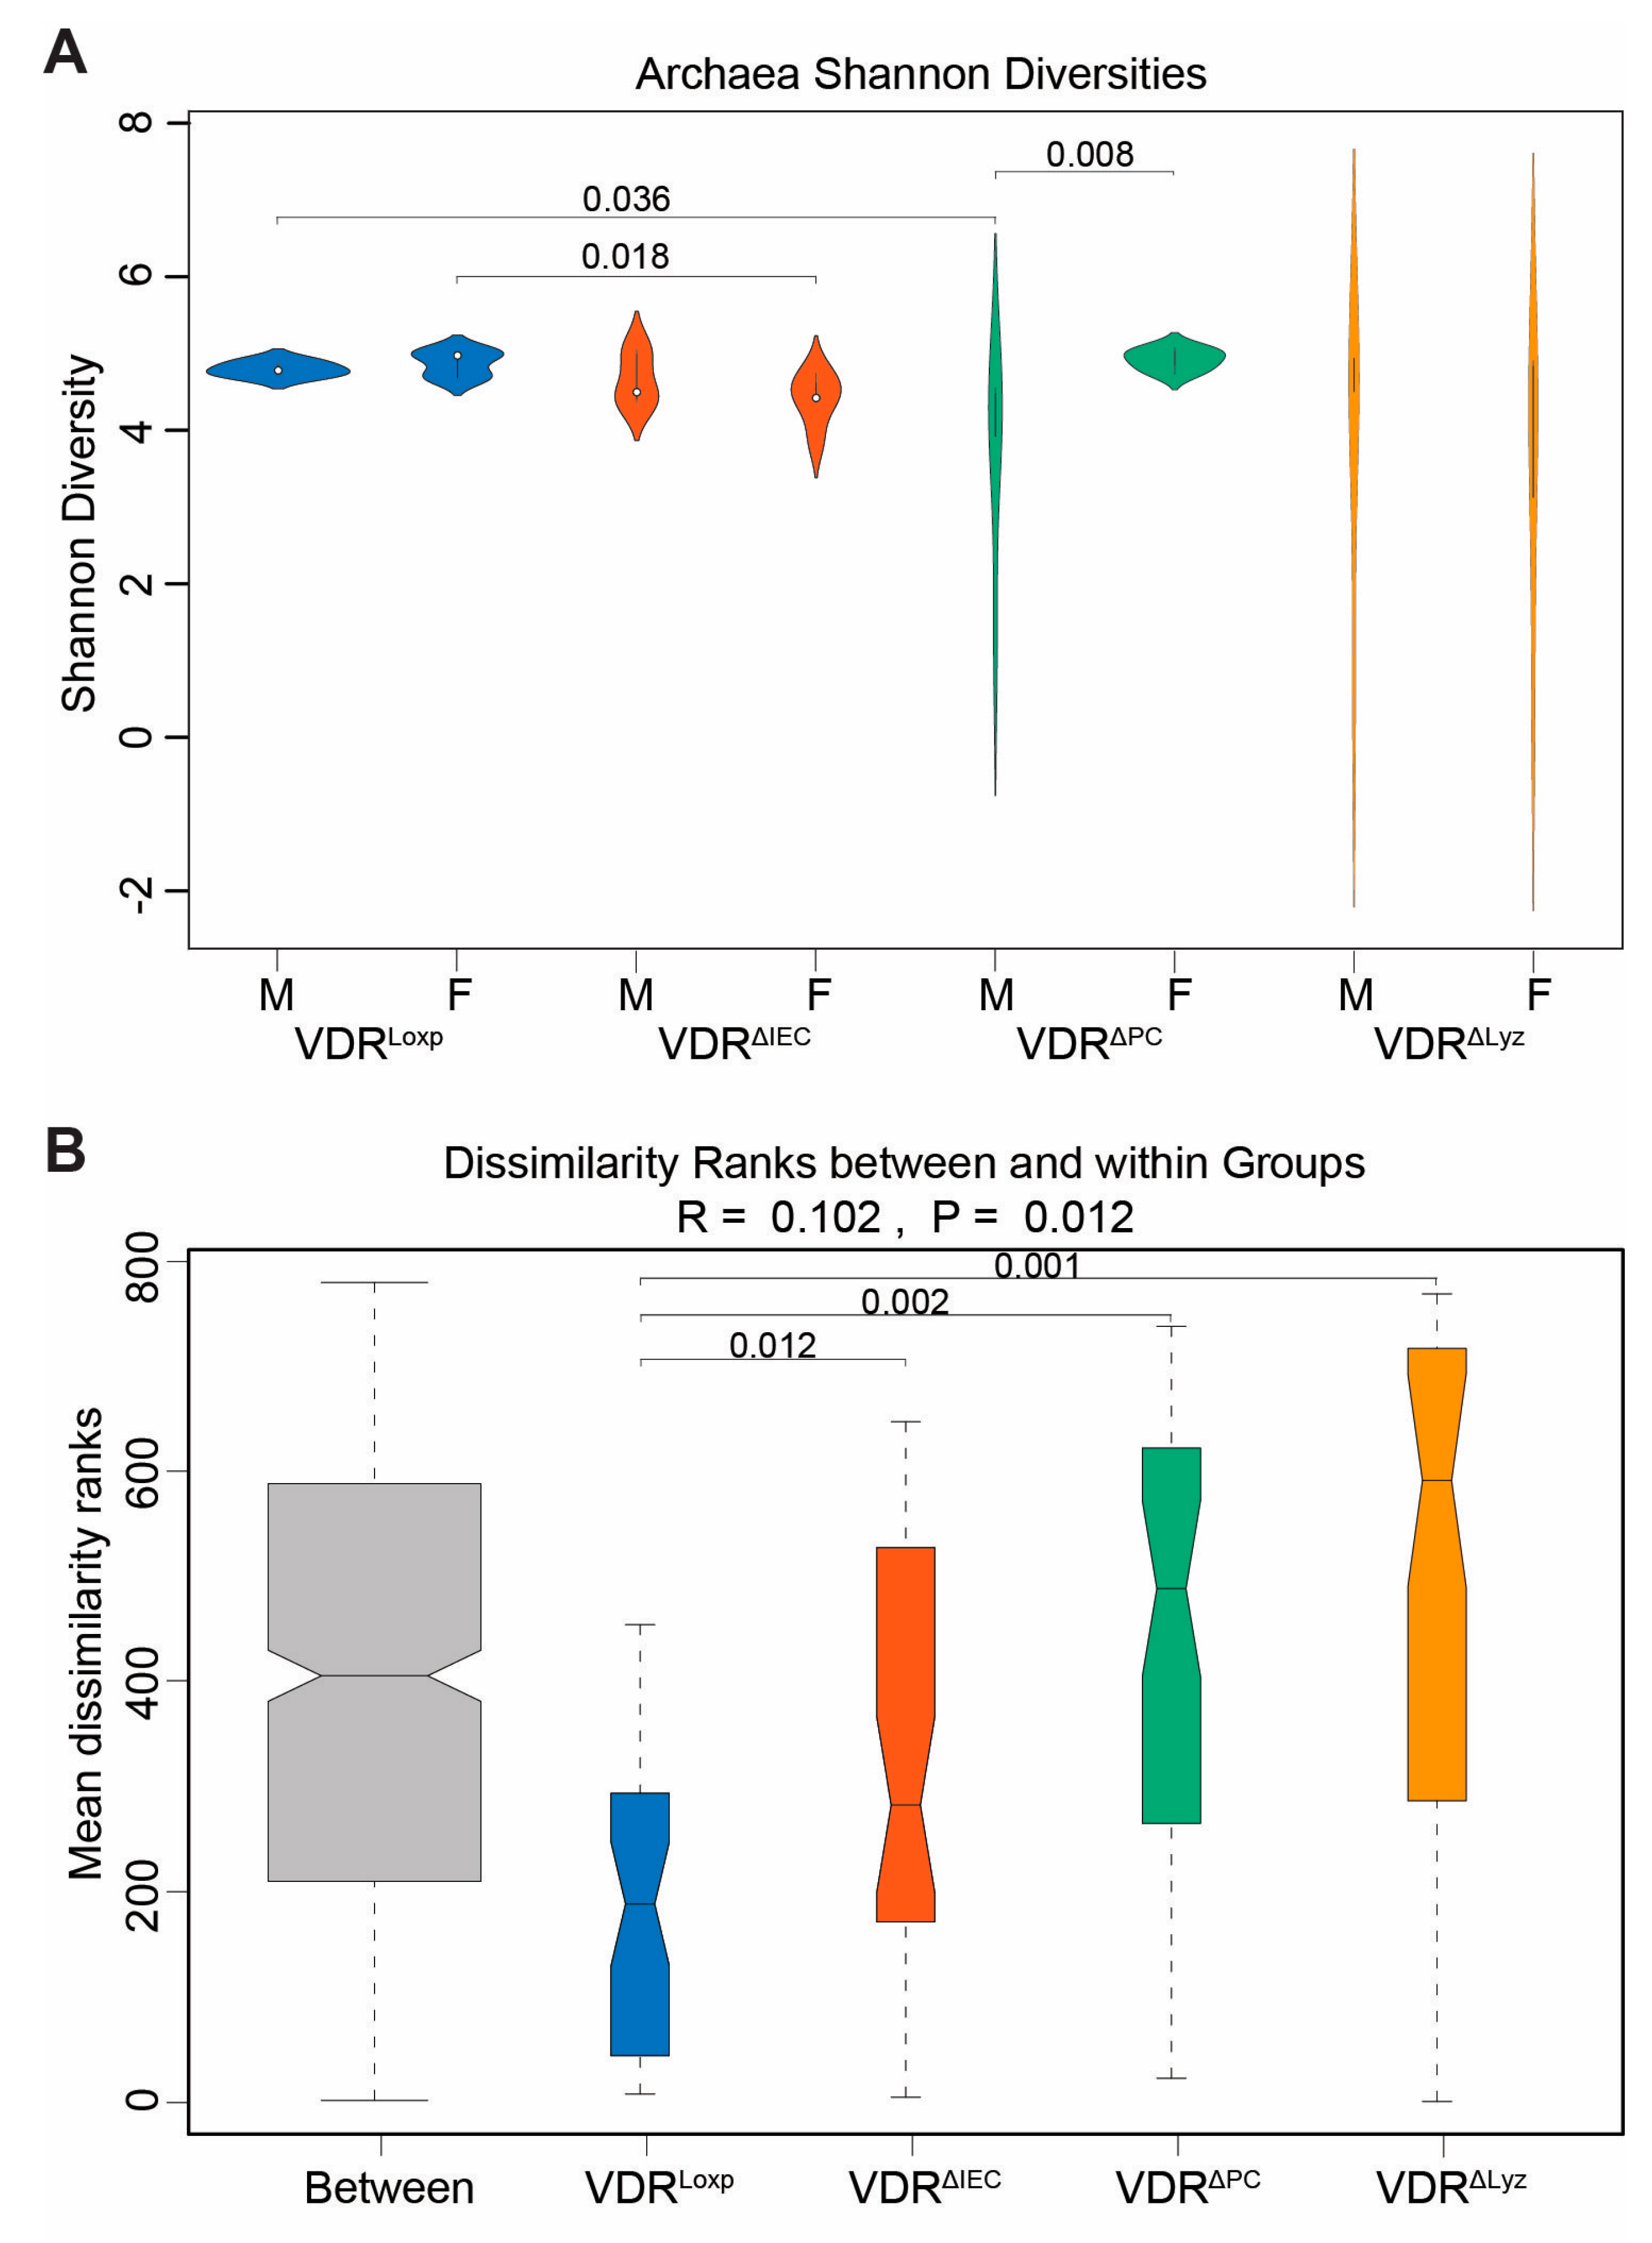
3.5. VDR Knockouts Alter Archaeal Alpha and Beta Diversities

In Figure 7A, the alpha diversity of archaea was analyzed. There was a statistically significant (p < 0.05) drop in the alpha diversity of archaeal species in male VDRΔPC mice relative to male VDRLoxp mice. There was also a similarly significant (p < 0.05) drop in the alpha diversity of archaeal species in female VDRΔIEC mice relative to female VDRLoxp mice. In the beta diversity analysis, all the knockout groups were found to have species distributions that were significantly different from the distribution of the VDRLoxp control group (p < 0.05) (Figure 7B).

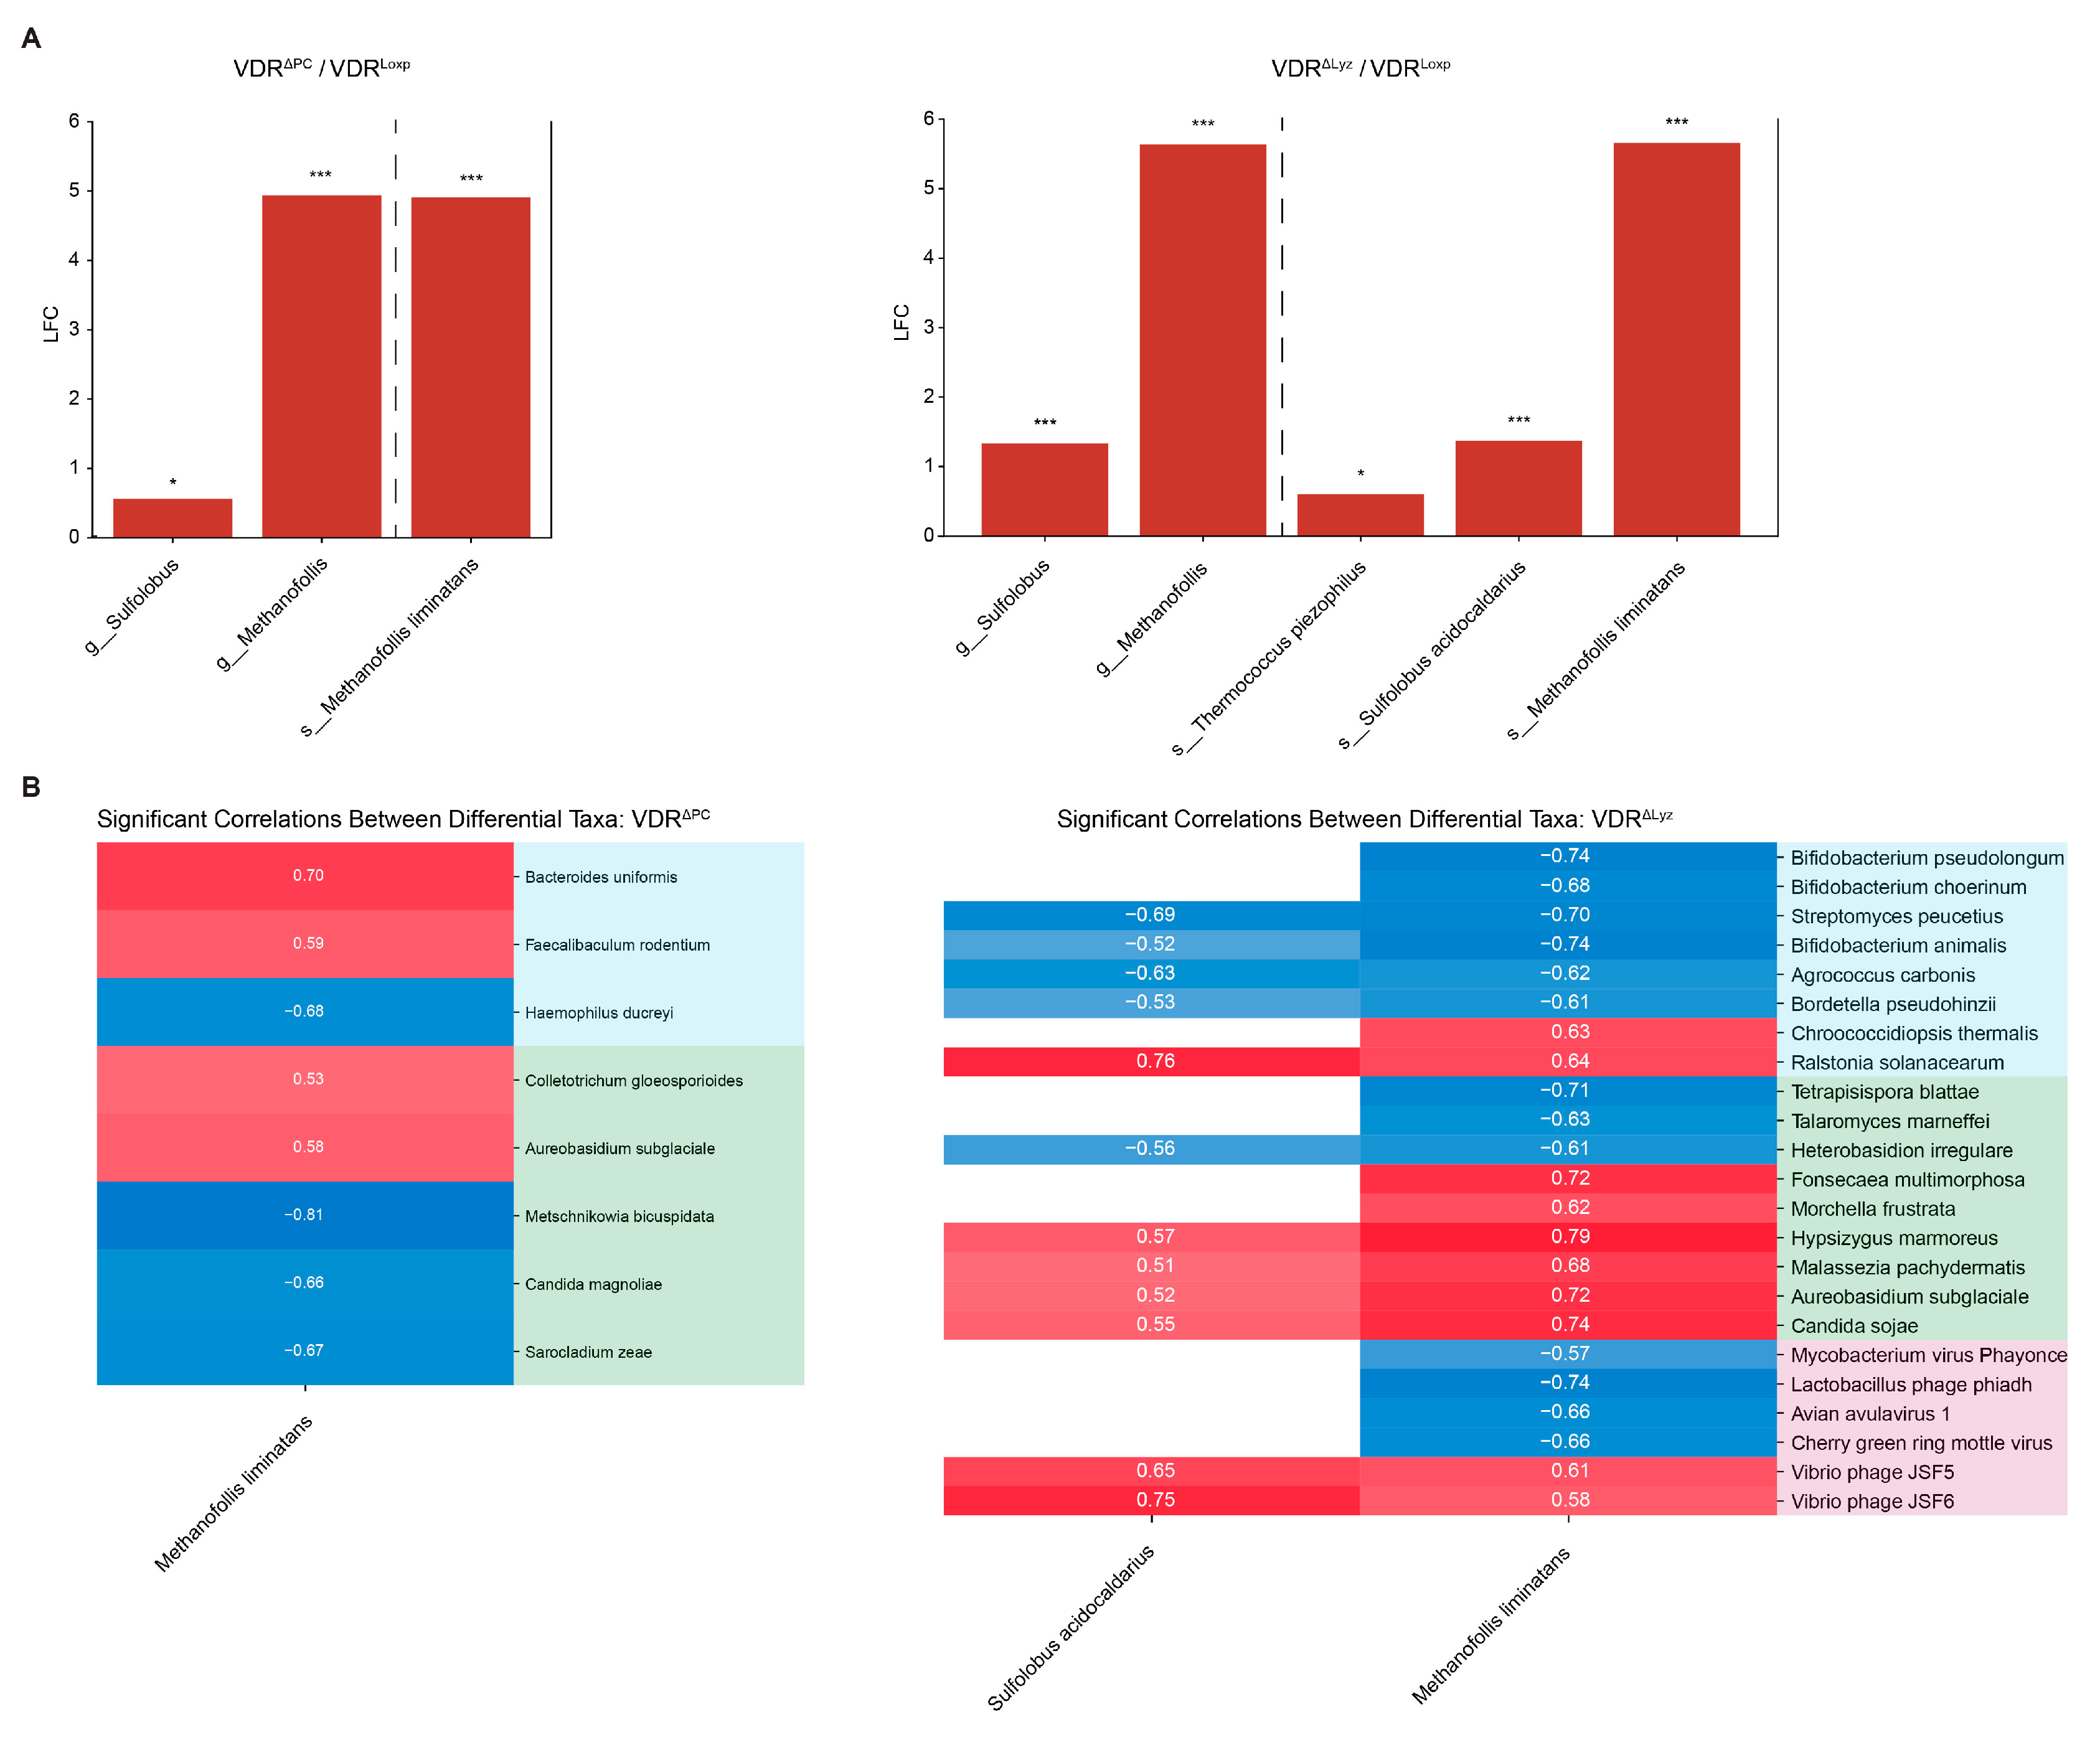
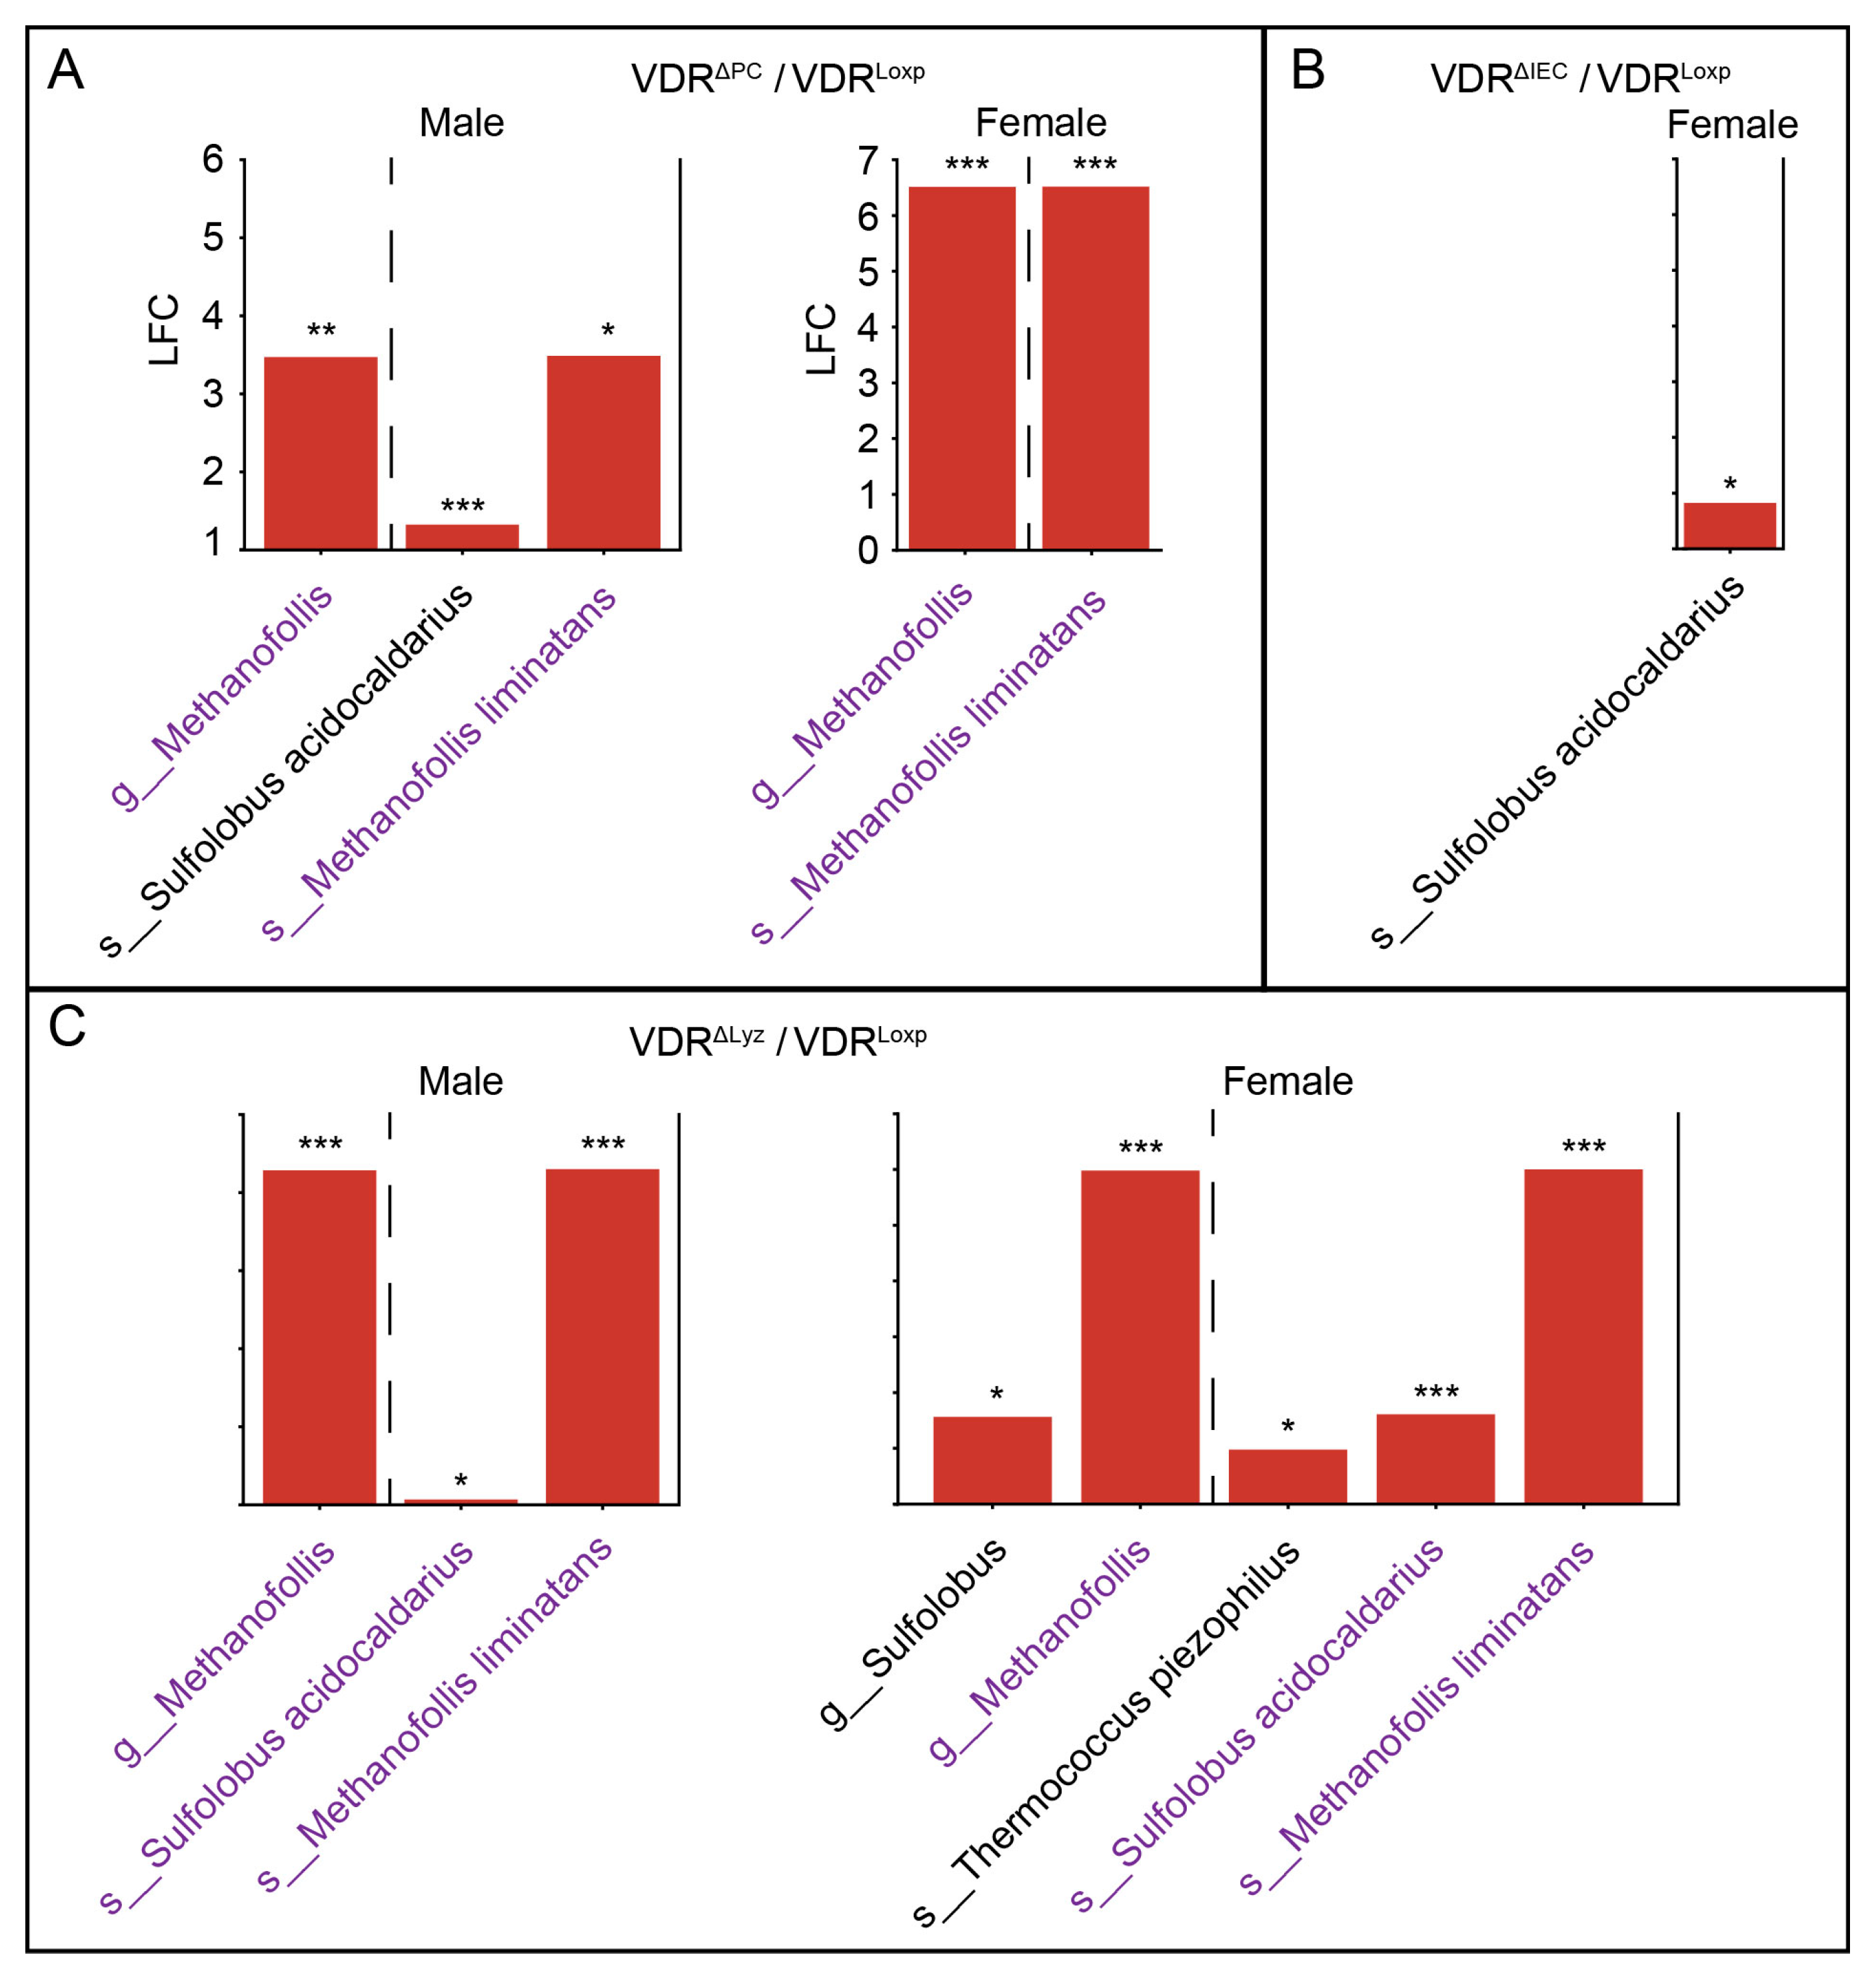
3.6. Common Set of Abundant Archaea in the VDRΔPC and VDRΔLyz Groups

The differential abundance of archaeal taxa between the control and knockout groups was performed as in the fungal analysis (see Section 3.2) (Figure 8A). Three taxa (the genera Sulfolobus and Methanofollis, along with the species Methanofollis limitans) were more abundant in both the VDRΔPC and VDRΔLyz groups compared to the control mice. Two other archaeal species (Thermococcus piezophilus and Sulfolobus acidocaldarius) were only increasingly abundant in the VDRΔLyz group. There were no differential taxa in the VDRΔIEC group compared to the VDRLoxp group.

3.7. Signficant Archaeal Correlations Exist with Bacteria, Fungi, and Viruses

In Figure 8B, correlation analyses were performed using all the differential archaeal species. Within the VDRΔPC group, two bacterial species (Bacteroides uniformis and Faecalibaculum rodentium) and two fungal species (Colletrotrichum gloeosporioides and Aureobasidium subglaciale) were positively correlated with Methanofolis liminatans, which is abundant relative to the control group. The bacteria Haemophilus ducreyi and three fungal species (Metschnikowia bicuspidata, Candida magnoliae, and Sarocladium zeae) were negatively correlated with Methanofolis liminatans. Within the VDRΔPC group, many bacteria (Bifidobacterium animalis, Bifidobacterium choerinum, Bifidobacterium pseudolongum, Bordetella pseudohinzii, Agrococcus carbonis, and Streptomyces peucetius), three fungal species (Tetrapisispora blattae, Talaromyces marneffei, and Heterobasidion irregulare), and several viruses (Lactobacillus phage phiadh, Mycobacterium virus phayonce, Avian avulavirus 1, and cherry green ring mottle virus) were negatively correlated with relatively abundant archaea. Additionally, several bacteria (Chroococcidiopsis thermalis and Ralstonia solanacearum), six fungi (Fonsecaea multimorphosa, Morchella frustrata, Hypsizygus marmoreus, Malassezia pachydermatis, Aureobasidium subglaciale, and Candida sojae), and two vibrio phages (Vibrio phages JSF5 and JSF6) were positively correlated with the archaea that were abundant in the KO group relative to the control group.

3.8. The Archaeal Dysbiosis Caused by VDR Deletions Is Sex Dependent

The drop in total diversity of archaeal species was specific to certain sex subsets (male VDRΔPC and female VDRΔIEC), and the male and female VDRΔPC mice have significantly (p < 0.05) different total diversities (Figure 7A). Next, as in the fungal analysis, beta diversity was calculated on the sex subsets (Supplementary Figure S5). The subsequent PERMANOVA test [34] revealed a non-significant (p > 0.05) sex–genotype interaction term. However, ANOSIM statistical testing on the sex subsets showed that, while all the female experimental groups had marginally significantly (p < 0.1) different archaeal distributions from the female control group, none of the male sub-groups had a marginally significantly (p < 0.1) different distribution (Supplementary Figure S5). Additional ANOSIM testing between sex groups within each group revealed significant differences (p = 0.01) between the archaeal distributions of the male and female VDRΔPC mice.
The use of ANCOM-BC2 on the sex subsets produced largely overlapping taxa (Figure 9). The two Methanofollis taxa (the genus Methanofollis and the species Methanofollis liminatans) were enriched in both sex subsets of the VDRΔPC (Figure 9A) and VDRΔLyz (Figure 9C) groups relative to their matched control groups. One species (Sulfolobus acidocaidarius) was relatively enriched in the male subset of the VDRΔPC group but not the female subset (Figure 9A). In contrast, this species was abundant relative to Loxp in the female subset of the VDRΔIEC group but not the male subset (Figure 9B). Sulfolobus acidocaidarius was also enriched relative to Loxp in both sex subsets of the VDRΔLyz group, but its genus (Sulfolobus) was only relatively enriched in the female subset (Figure 9C). Finally, Thermococcus piezophillus was enriched relative to the control mice in the female but not the male VDRΔIEC subdivisions (Figure 9C).

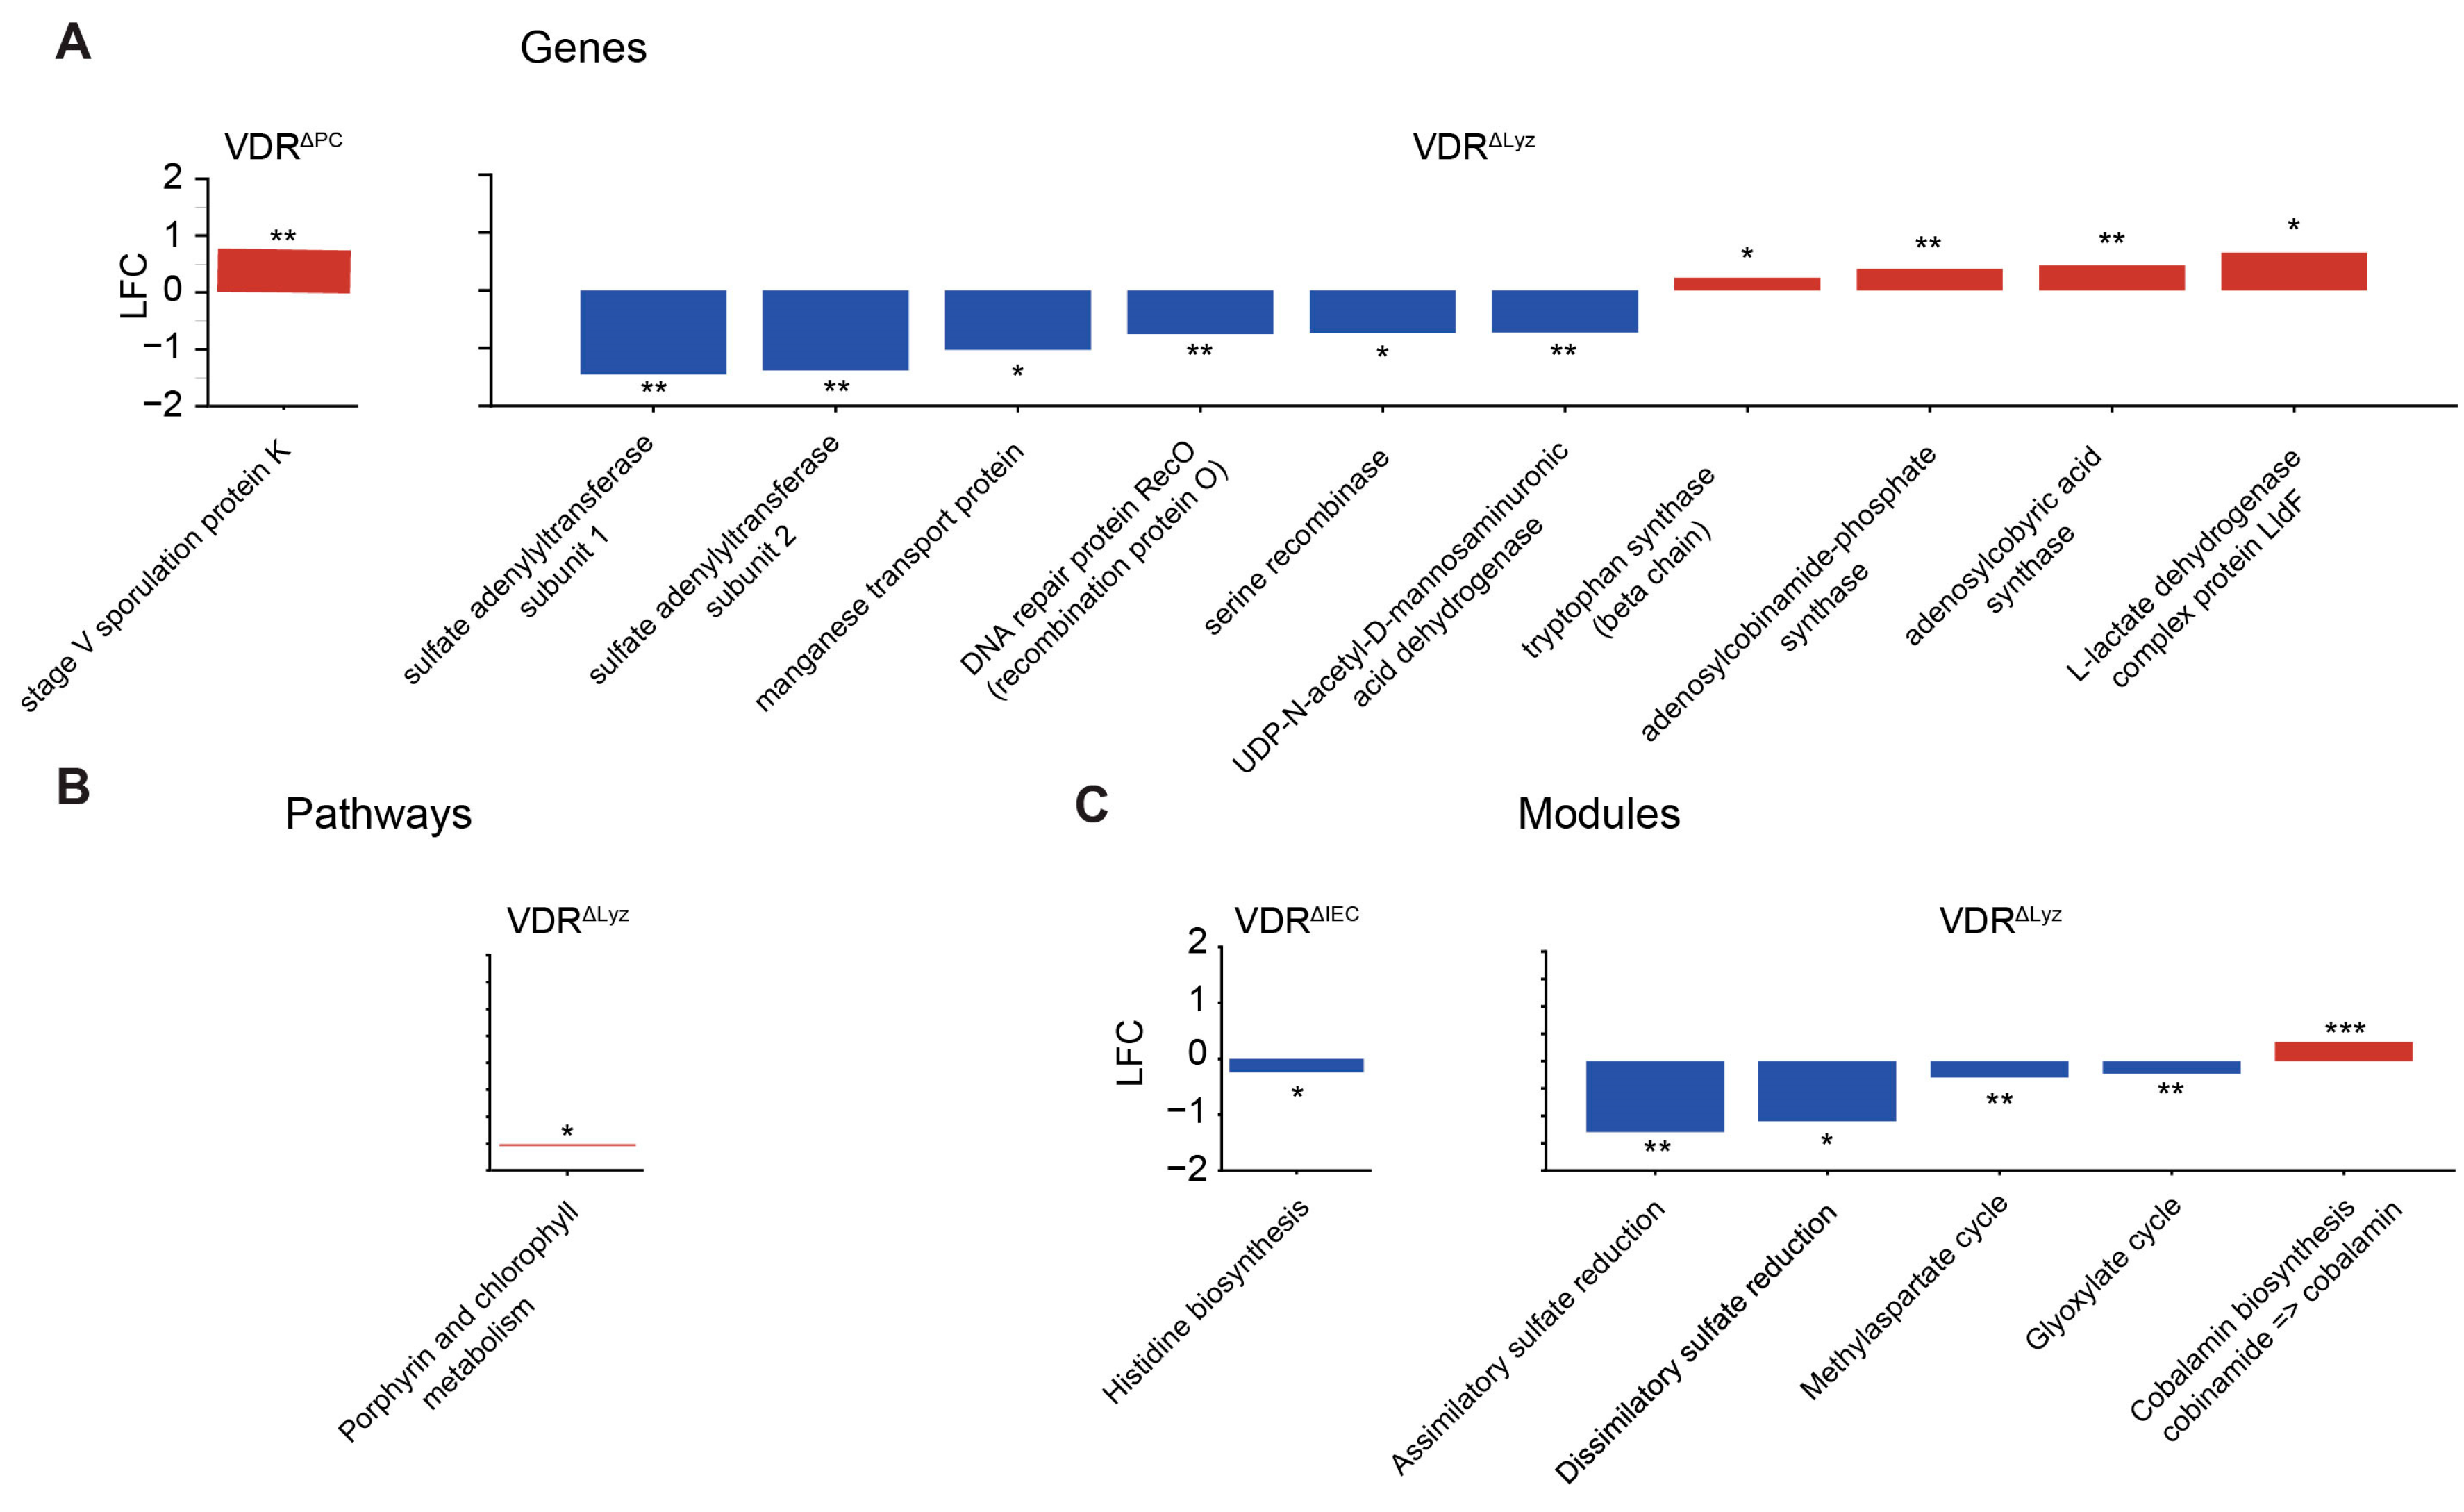
3.9. Functional Metagenomics

Functional metagenomics was performed to investigate differences in the predictive functional capacities of the microbiomes in the control and KO mice. All genes found to be significantly different between the control group and a KO group except one (stage five sporulation protein k, increased in the VDRΔIEC mice relative to VDRLoxp mice) originate from the VDRΔLyz to VDRLoxp comparison (Figure 10A). Most of these were reduced in the KO group (sulfate adenyltransferase subunits 1 and 2, manganese transport protein, DNA repair protein recombination protein O, serine recombinase, and UDP-N-acetyl-D-mannosaminuronic acid dehydrogenase) relative to the control group; however, four were increased (tryptophan synthase (beta chain), adenosylcobinamide-phosphate synthase, adenylcobyric acid synthase, and the L-lactate dehydrogenase complex protein Lldf). Only a single pathway, porphyrin and chlorophyl metabolism, was found to deviate between any of the KO groups and the control group (Figure 10B). This pathway was significantly increased in the VDRΔLyz mice. Three modules were predicted to differ between the VDRΔLyz and VDRLoxp groups (Figure 10C). These included a predicted decrease in two sulfate reduction modules (assimilatory sulfate reduction and dissimilatory sulfate reduction) relative to the control mice and a predicted increase in the vitamin B12 (cobalamin) biosynthesis module. The genomes of four microbes that were differentially abundant in the VDRΔLyz group contained genes relating to these modules (Table 1).

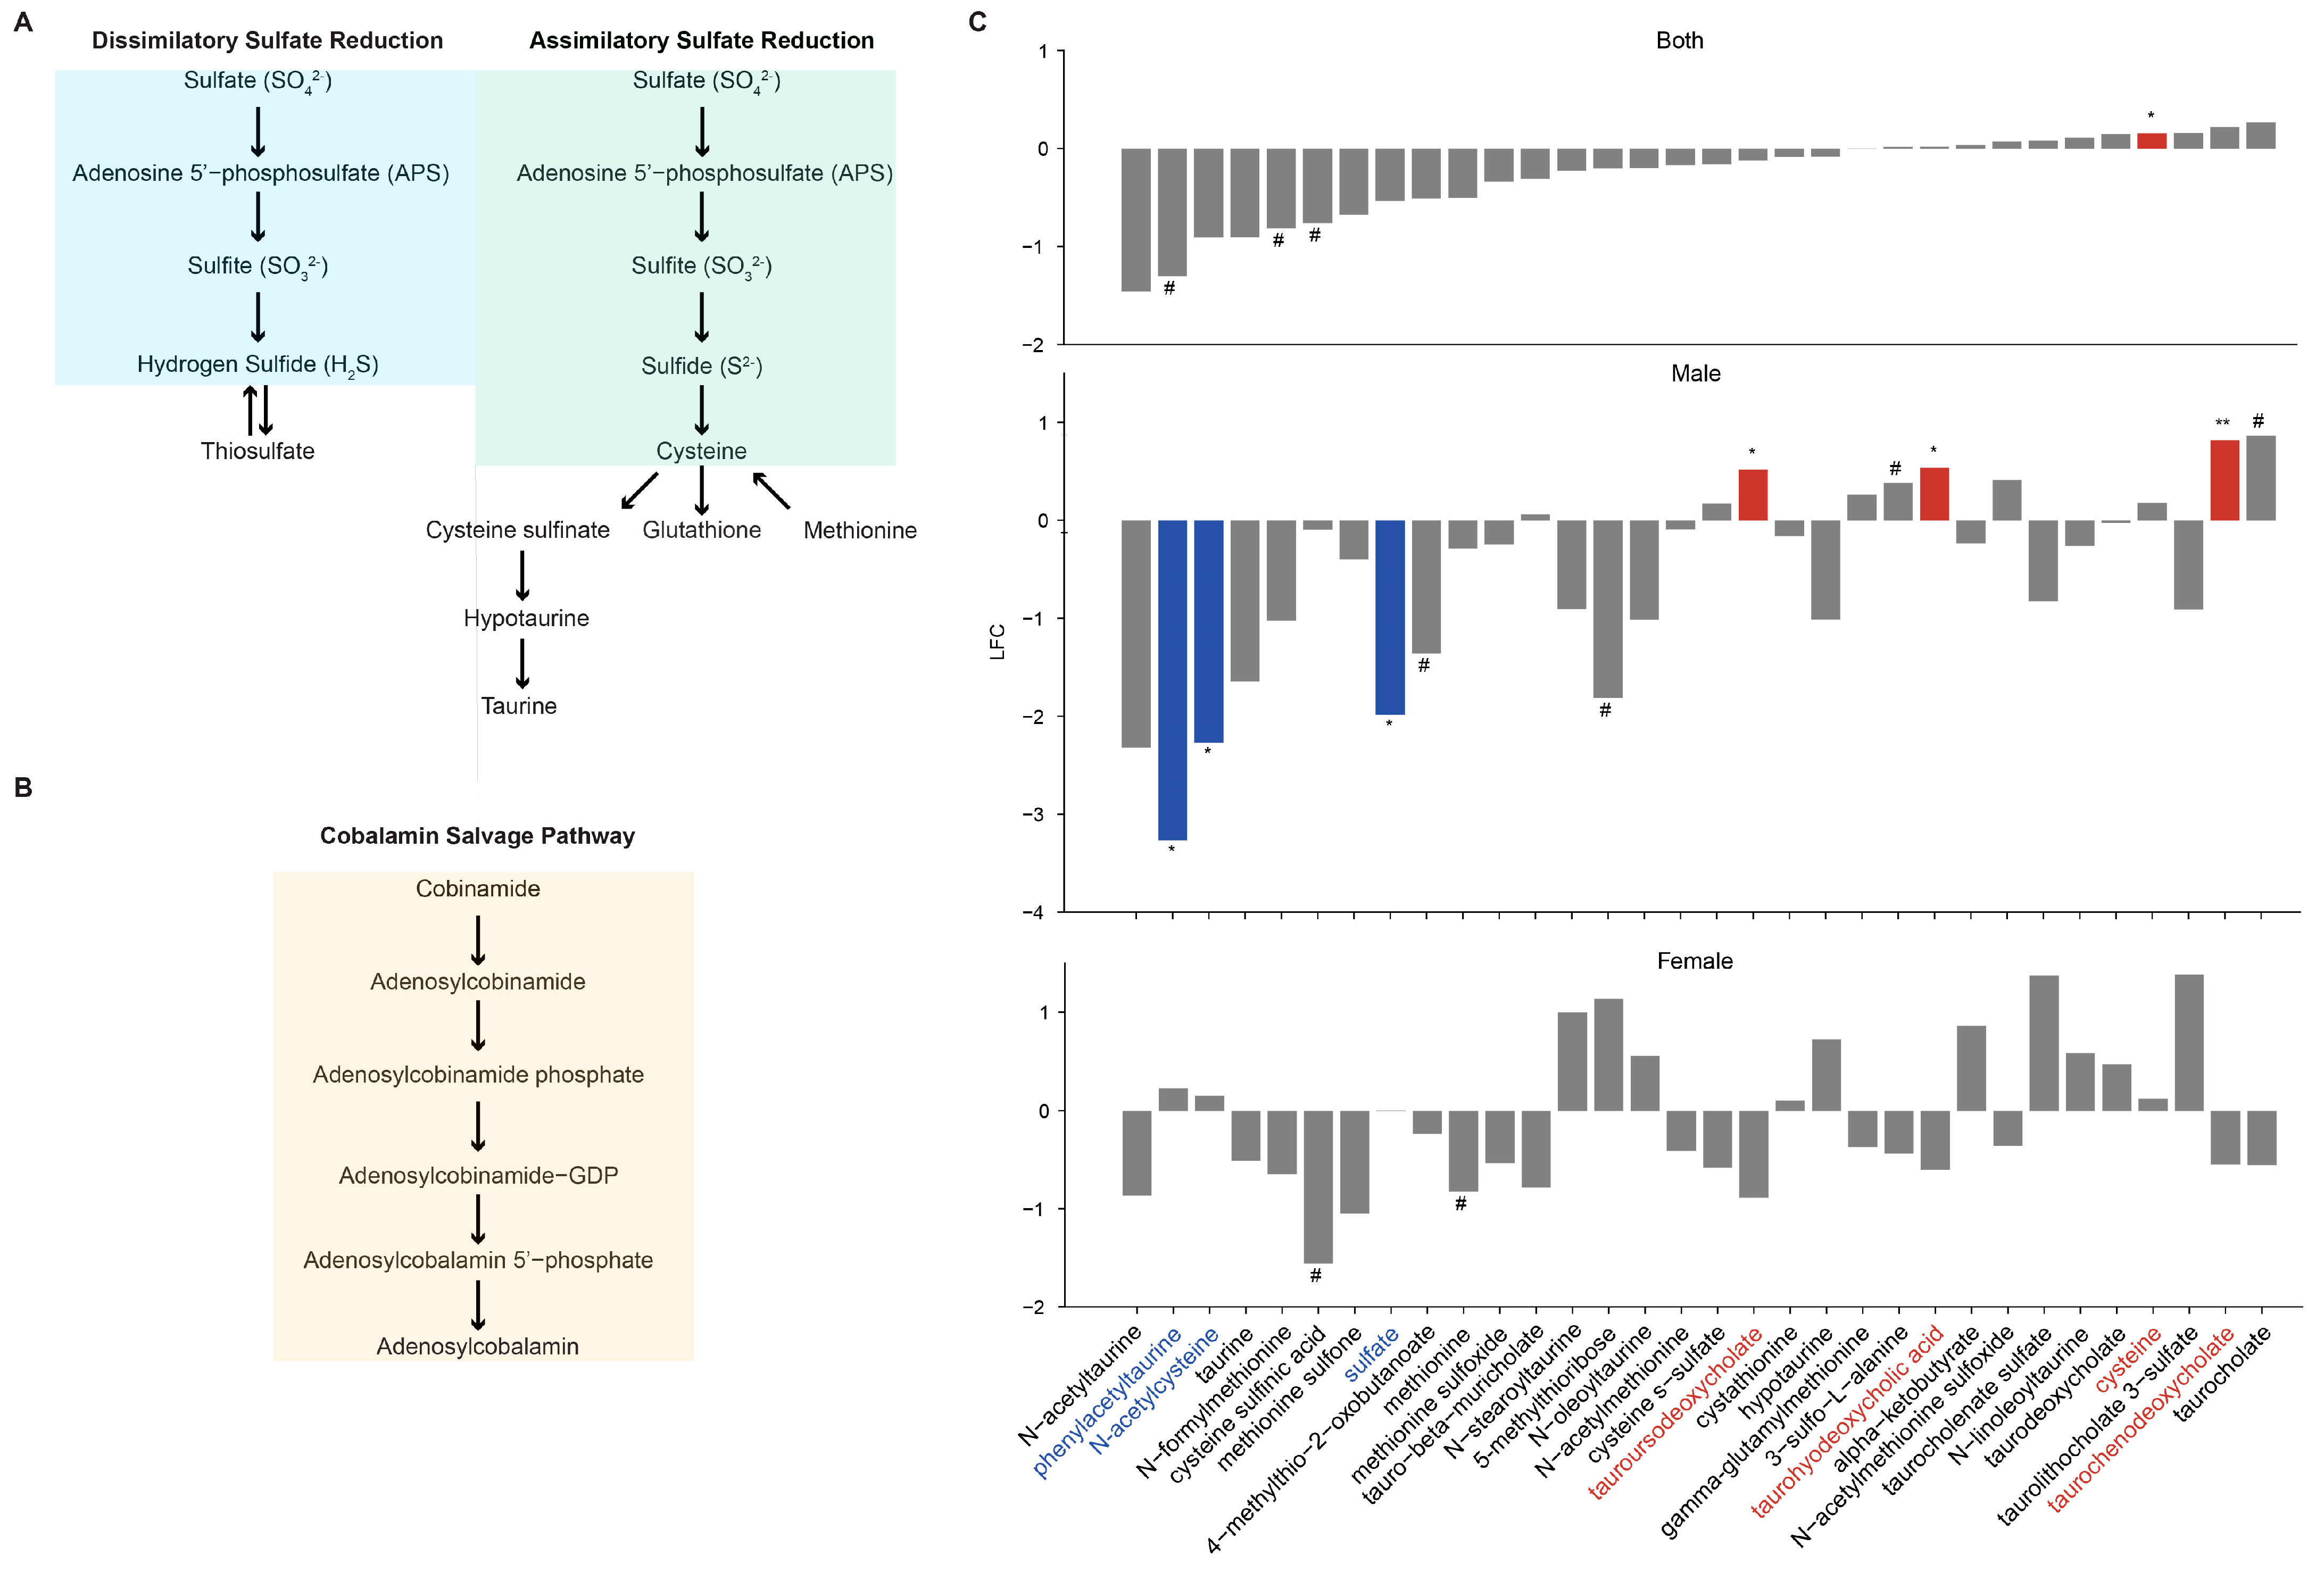
3.10. Metabolomic Signiture Related to VDR KO in Myeloid Cells

To investigate/validate the functional impacts of these predicted changes, we analyzed the fecal metabolomes of a separate cohort of VDRΔLyz, VDRΔIEC, and VDRLoxp mice. After analyzing the overall changes in these metabolites, we focused on the metabolites relating to sulfate reduction (Figure 11A) and cobalamin salvage (Figure 11B) pathways within the VDRΔLyz vs. VDRLoxp comparison. The VDRΔLyz mice had a significant (p < 0.05) increase in cysteine, the immediate product of assimilatory sulfate reduction (Figure 11C), relative to the VDRLoxp mice. Furthermore, the male subgroup of the VDRΔLyz mice had a significantly lower abundance of sulfate itself, the primary input of both assimilatory and dissimilatory sulfate reduction, relative to the control mice.

4. Discussion

In the current study, we have demonstrated that fungi and archaea were significantly altered in each VDR KO group compared to the VDRLoxp control. The VDRΔLyz mice had the most altered fungal species (three depleted and seven enriched), the VDRΔPC mice the second most (six depleted and two enriched), and the VDRΔIEC mice had the fewest (one depleted and one enriched). The methanogen Methanofollis limitans was enriched in the VDRΔPC and VDRΔLyz mice, and two further archaeal species (Thermococcus piezophilus and Sulfolobus acidocaldarius) were enriched in the VDRΔPC mice compared to the VDRLoxp group. Significant correlations existed among altered fungi, archaea, bacteria, and viruses in the KO mice. Functional metagenomics showed changes in several biologic functions. These results provide a foundation about the impact of a VDR deficiency, as a host factor, on fungi and archaea and cross-kingdom interactions in the microbiome community.
Disruption to the normal microbiome leads to an imbalance and increases susceptibility to further perturbations. This is why dysbiosis is often associated with pathology, for instance, drops in archaeal diversity like those seen here have been reported in obesity [65] and amyotrophic lateral sclerosis (ALS) [66], suggesting that this trend can either be a biomarker or a driver of an illness. Fungal dysbiosis is also common in disease states [67], likely due to the important impact that the mycobiome has on host immunity [68]. Different types of fungal dysbiosis have been linked to colorectal cancer (CRC) [69] and Crohn’s disease [70]. In most pathologic states (infection, inflammatory disease, etc.), a VDR deficiency is one of many factors contributing to pathogenesis [1,9,71]. Our model targets one specific gene in a tissue-specific manner and provides the evidence for host factors in shaping the microbiome and modulating the risk of diseases.
The VDR regulation of fungi and archaea occurs in a tissue-specific manner, evidenced by the differential archaea and fungi across the KO groups. The VDRΔLyz mice harbored multiple opportunistic intestinal pathogens in increased abundance. The increase in three types of Candida (the genera Myerozyma and Suhomyces, along with the species Candida sojae) in these mice relative to the control mice is also noteworthy, as the relative abundance of Candida has been reported in inflammatory intestinal illnesses [72] and specifically Crohn’s disease [65]. Additionally, the relative abundance of M. pachydermatis in the myeloid knockouts may be significant, as human studies found an increase in total Malassezia in patients with IBD compared to healthy controls [70]. Similarly, the microbiome of patients with CRC showed an increased level of Malasseziomycetes [69]. The VDRΔPC and VDRΔLyz knockouts promoted archaea with the potential to impact the sulfur and methane metabolism mechanisms of the host. Methanogenic archaea are associated with Crohn’s disease etiology [10]. The dramatic rise in Methanofollis after VDR deletions may predispose to IBD. The predictive functional analysis provides another angle for the relevance of this archaeal growth—competition with sulfur reduction microbes. Another abundant archaeon, Sulfolobus [73], is capable of sulfur metabolism [74]. Methanogens and sulfate-reducing bacteria (SRB) compete for H2 in the intestine [22]. Potentially, the dramatic increase in methanogens after VDR deletion is driving a concurrent drop in SRB. However, none of the most common intestinal SRB [75,76] were reported to be in lower abundance in the KO animals compared to the control mice [8]. Targeted measurement of metabolites and PCR validation of SRB are needed for future studies.
In the mammalian intestine, both archaea [73] and fungi [10] interact with the other members of the microbiome. First, the strong correlations between and within archaea and fungi suggest potential interactions within these populations and reinforce the need to consider them together in predicting host health and disease. In the VDRΔLyz mice, abundant fungi and archaea were negatively correlated with a group of benign commensals (Bifidobacterium animalis, Bifidobacterium choerinum, Bifidobacterium pseudolongum, and Bacteroides acidfaciens). This raises the possibility that they play a role in suppressing the growth of certain bacteria, which could promote a pro-inflammatory state with increased susceptibility to enteropathogenic bacteria [77]. Our previous study involving VDRΔLyz mice has shown their susceptibility to Salmonella infection [78]. VDRΔPC mice are also susceptible to Salmonella infection and intestinal inflammation [79]. The significant correlations with the virus Lactobacillus phage phiadh [8], which infects another commensal [80], suggest an additional layer of interaction between these communities or may reflect the decrease in Lactobacillus johnsonii [8]. Interestingly, the fungi and archaea of this group were also negatively correlated with the two pathogens Clostridium perfringins and Bordetella psuedo hinzii. Whether the deletion has a protective effect is unclear. Again, there is a viral analog—a positive correlation with increased levels [8] of vibrio phages. As bacterial phages can modulate host functionality [81], it is possible that this correlation with viruses heralds a modulation of pathogens through interactions with the archaea and fungi. At the metabolite level, there is a significant decrease in compounds formed from cysteine (N-acetylcysteine) and taurine (phenylacetyltaurine) but increases in three secondary bile acids derived from taurine (taurodeoxycholate, taurohyodeoxycholic acid, and taurochenodeoxycholate). The significant correlations among differentially abundant microbes across domains and metabolites are worthy of further exploration.
It is possible that the sex-mediated dysbiosis shown here constitutes one aspect of a multifactorial perturbation driving illnesses. The sex of an animal impacts the development and clinical presentation of gastrointestinal diseases, like IBD [82] and infections [83], in that animal. Indeed, sex has been shown to impact the mammalian mycobiome, even in the absence of pathology [84]. It is therefore unsurprising that the sexes of the VDR knockout mice modulate the impact that this deletion has on the total archaeal diversity and fungal species levels in the guts of those mice. A recent study on CRC and the microbiome showed the gender difference that Carnobacterium maltaromaticum boosts intestinal vitamin D production to suppress CRC in female mice [85]. Gender differences were also noticed in our previous studies on VDR regulation of the virome [8] and high-fat diet (HFD) obesity [30]. HF- fed female VDRΔIEC mice showed increased taurolithocholate 3-sulfate and taurocholenate sulfate levels. Given these findings, future vitamin D/VDR studies should continue to elucidate whether the differences seen in our study have a functional impact on the intestinal microbial community in human diseases.
There are several limitations of this study. One limitation comes from the sequencing and isolation methods. Most microbiota isolation and sequencing protocols are specially designed for identifying bacteria, which biases them away from detecting archaea and fungi [20]. Additionally, microbiome studies are intrinsically limited to establishing associations between variables rather than causality [86]. Further experiments, like the use of selective antibiotics to remove certain organisms from the intestinal niche [13], measurements like methane exhalation [87], or targeted fecal metabolomics [88], are required to evaluate vitamin or methane synthesis and to elucidate the mechanisms and physiological functions involved in the impact of a VDR deficiency.

5. Conclusions

In the current study, we report the significant correlations existed among altered archaea, fungi, bacteria, viruses, and metabolites in the VDR deficiency mice in a tissue- and gender-dependent manner. These leads to changes in the biologic functions, e.g., sulfate reduction and biosynthesis of Vitamin B12 (Figure 12). By identifying the specific fungi and archaea implicated in VDR deficiencies and the networks of microbes with which they may be interacting, we open the door for studies to elucidate how these understudied microbial populations may be contributing to the effects of a VDR deficiency. Indeed, our functional metagenomic results provide promising physiologic processes through which fungi and archaea may be driving or worsening the impact that a VDR deficiency has on the risks of certain diseases.

Supplementary Materials

The following supporting information can be downloaded at: https://www.mdpi.com/article/10.3390/metabo14010032/s1, Figure S1: Fungi Correlations in Sex-Subsets; Figure S2: Archaea Correlations in Sex-Subsets; Figure S3: Differential Fungi in the KO mice; Figure S4: Sex-Differences of Fungal Dysbiosis in the VDR KO mice; Figure S5: Sex-Differences of Archaeal dysbiosis in VDR KO mice.

Author Contributions

Investigation, formal analysis, software, methodology D.J.C. and Y.X.; investigation, animal models, and resources, Y.-G.Z.; writing—original draft preparation, D.J.C.; writing—review and editing, J.S. and Y.X.; visualization, D.J.C. and Y.-G.Z.; Conceptualization, supervision, Y.X., J.S.; project administration and funding acquisition, J.S. All authors have read and agreed to the published version of the manuscript.

Funding

Our study was supported by the IllNET RECOVER pilot grant (PIs: Jun Sun & Yinglin Xia), VA Merit Award 1 I101BX004824-01, the DOD grant W81XWH-20-1-0623 (BC191198), NIDDK/National Institutes of Health grant R01DK134343, R01 DK105118, and R01DK114126, and the Crohn’s & Colitis Foundation Senior Research Award (grant no. 902766) to Jun Sun. This study’s sponsors played no role in the study design, data collection, analysis, and interpretation of the data. The contents do not represent the views of the United States Department of Veterans Affairs or the United States Government.

Institutional Review Board Statement

This study received approval from the Office of Animal Care and Institutional Biosafety (OACIB) and the UIC Animal Care Committee (ACC) under the accession numbers ACC15-231, ACC17-218, and ACC18-216.

Informed Consent Statement

Not applicable.

Data Availability Statement

The data will be posted in https://zenodo.org/ (accessed on 1 December 2023).

Conflicts of Interest

The authors declare no conflicts of interest.

References

  1. Bakke, D.; Sun, J. Ancient Nuclear Receptor VDR with New Functions: Microbiome and Inflammation. Inflamm. Bowel Dis. 2018, 24, 1149–1154. [Google Scholar] [CrossRef] [PubMed]
  2. Mohammad, S.; Mishra, A.; Ashraf, M.Z. Emerging Role of Vitamin D and its Associated Molecules in Pathways Related to Pathogenesis of Thrombosis. Biomolecules 2019, 9, 649. [Google Scholar] [CrossRef] [PubMed]
  3. Barbáchano, A.; Fernández-Barral, A.; Ferrer-Mayorga, G.; Costales-Carrera, A.; Larriba, M.J.; Muñoz, A. The endocrine vitamin D system in the gut. Mol. Cell. Endocrinol. 2017, 453, 79–87. [Google Scholar] [CrossRef] [PubMed]
  4. Du, J.; Chen, Y.; Shi, Y.; Liu, T.; Cao, Y.; Tang, Y.; Ge, X.; Nie, H.; Zheng, C.; Li, Y.C. 1,25-Dihydroxyvitamin D Protects Intestinal Epithelial Barrier by Regulating the Myosin Light Chain Kinase Signaling Pathway. Inflamm. Bowel Dis. 2015, 21, 2495–2506. [Google Scholar] [CrossRef] [PubMed]
  5. Sharma, A.; Yu, Y.; Lu, J.; Lu, L.; Zhang, Y.G.; Xia, Y.; Sun, J.; Claud, E.C. The Impact of Maternal Probiotics on Intestinal Vitamin D Receptor Expression in Early Life. Biomolecules 2023, 13, 847. [Google Scholar] [CrossRef] [PubMed]
  6. Ooi, J.H.; Li, Y.; Rogers, C.J.; Cantorna, M.T. Vitamin D Regulates the Gut Microbiome and Protects Mice from Dextran Sodium Sulfate–Induced Colitis123. J. Nutr. 2013, 143, 1679–1686. [Google Scholar] [CrossRef] [PubMed]
  7. Cannell, J.J.; Vieth, R.; Umhau, J.C.; Holick, M.F.; Grant, W.B.; Madronich, S.; Garland, C.F.; Giovannucci, E. Epidemic influenza and vitamin D. Epidemiol. Infect. 2006, 134, 1129–1140. [Google Scholar] [CrossRef]
  8. Zhang, J.; Zhang, Y.; Xia, Y.; Sun, J. Imbalance of the intestinal virome and altered viral-bacterial interactions caused by a conditional deletion of the vitamin D receptor. Gut Microbes 2021, 13, 1957408. [Google Scholar] [CrossRef]
  9. Jin, D.; Wu, S.; Zhang, Y.-g.; Lu, R.; Xia, Y.; Dong, H.; Sun, J. Lack of Vitamin D Receptor Causes Dysbiosis and Changes the Functions of the Murine Intestinal Microbiome. Clin. Ther. 2015, 37, 996–1009. [Google Scholar] [CrossRef]
  10. Rashed, R.; Valcheva, R.; Dieleman, L.A. Manipulation of Gut Microbiota as a Key Target for Crohn’s Disease. Front. Med. 2022, 9, 887044. [Google Scholar] [CrossRef]
  11. Coyte, K.Z.; Rakoff-Nahoum, S. Understanding Competition and Cooperation within the Mammalian Gut Microbiome. Curr. Biol. 2019, 29, R538–R544. [Google Scholar] [CrossRef] [PubMed]
  12. Kuziel, G.A.; Rakoff-Nahoum, S. The gut microbiome. Curr. Biol. 2022, 32, R257–R264. [Google Scholar] [CrossRef] [PubMed]
  13. Chin, V.K.; Yong, V.C.; Chong, P.P.; Amin Nordin, S.; Basir, R.; Abdullah, M. Mycobiome in the Gut: A Multiperspective Review. Mediat. Inflamm. 2020, 2020, e9560684. [Google Scholar] [CrossRef] [PubMed]
  14. Qin, J.; Li, R.; Raes, J.; Arumugam, M.; Burgdorf, K.S.; Manichanh, C.; Nielsen, T.; Pons, N.; Levenez, F.; Yamada, T.; et al. A human gut microbial gene catalogue established by metagenomic sequencing. Nature 2010, 464, 59–65. [Google Scholar] [CrossRef] [PubMed]
  15. Zhang, F.; Aschenbrenner, D.; Yoo, J.Y.; Zuo, T. The gut mycobiome in health, disease, and clinical applications in association with the gut bacterial microbiome assembly. Lancet Microbe 2022, 3, e969–e983. [Google Scholar] [CrossRef] [PubMed]
  16. Seed, P.C. The Human Mycobiome. Cold Spring Harb. Perspect. Med. 2015, 5, a019810. [Google Scholar] [CrossRef] [PubMed]
  17. Tiew, P.Y.; Mac Aogain, M.; Ali, N.A.t.B.M.; Thng, K.X.; Goh, K.; Lau, K.J.X.; Chotirmall, S.H. The Mycobiome in Health and Disease: Emerging Concepts, Methodologies and Challenges. Mycopathologia 2020, 185, 207–231. [Google Scholar] [CrossRef]
  18. Wu, S.; Zhang, Y.G.; Lu, R.; Xia, Y.; Zhou, D.; Petrof, E.O.; Claud, E.C.; Chen, D.; Chang, E.B.; Carmeliet, G.; et al. Intestinal epithelial vitamin D receptor deletion leads to defective autophagy in colitis. Gut 2015, 64, 1082–1094. [Google Scholar] [CrossRef]
  19. Houshyar, Y.; Massimino, L.; Lamparelli, L.A.; Danese, S.; Ungaro, F. Going beyond Bacteria: Uncovering the Role of Archaeome and Mycobiome in Inflammatory Bowel Disease. Front. Physiol. 2021, 12, 783295. [Google Scholar] [CrossRef]
  20. Matijašić, M.; Meštrović, T.; Čipčić Paljetak, H.; Perić, M.; Barešić, A.; Verbanac, D. Gut Microbiota beyond Bacteria—Mycobiome, Virome, Archaeome, and Eukaryotic Parasites in IBD. Int. J. Mol. Sci. 2020, 21, 2668. [Google Scholar] [CrossRef]
  21. Lurie-Weinberger, M.N.; Gophna, U. Archaea in and on the Human Body: Health Implications and Future Directions. PLoS Pathog. 2015, 11, e1004833. [Google Scholar] [CrossRef] [PubMed]
  22. Hoegenauer, C.; Hammer, H.F.; Mahnert, A.; Moissl-Eichinger, C. Methanogenic archaea in the human gastrointestinal tract. Nat. Rev. Gastroenterol. Hepatol. 2022, 19, 805–813. [Google Scholar] [CrossRef] [PubMed]
  23. Ghavami, S.B.; Rostami, E.; Sephay, A.A.; Shahrokh, S.; Balaii, H.; Aghdaei, H.A.; Zali, M.R. Alterations of the human gut Methanobrevibacter smithii as a biomarker for inflammatory bowel diseases. Microb. Pathog. 2018, 117, 285–289. [Google Scholar] [CrossRef] [PubMed]
  24. Coker, O.O.; Wu, W.K.K.; Wong, S.H.; Sung, J.J.Y.; Yu, J. Altered Gut Archaea Composition and Interaction with Bacteria Are Associated with Colorectal Cancer. Gastroenterology 2020, 159, 1459–1470. [Google Scholar] [CrossRef] [PubMed]
  25. Mathlouthi, N.E.H.; Oumarou Hama, H.; Belguith, I.; Charfi, S.; Boudawara, T.; Lagier, J.C.; Ammar Keskes, L.; Grine, G.; Gdoura, R. Colorectal Cancer Archaeome: A Metagenomic Exploration, Tunisia. Curr. Issues Mol. Biol. 2023, 45, 7572–7581. [Google Scholar] [CrossRef] [PubMed]
  26. Kos, C.H. Methods in Nutrition Science: Cre/loxP System for Generating Tissue-specific Knockout Mouse Models. Nutr. Rev. 2004, 62, 243–246. [Google Scholar] [CrossRef] [PubMed]
  27. Lin, H.; Peddada, S.D. Analysis of compositions of microbiomes with bias correction. Nat. Commun. 2020, 11, 3514. [Google Scholar] [CrossRef]
  28. Sun, J.; Xia, Y.; Chen, D.-G. Statistical Analysis of Microbiome Data With R. ICSA Book Series in Statistics; Springer: Singapore, 2018; Volume 847. [Google Scholar]
  29. Kim, D.; Song, L.; Breitwieser, F.P.; Salzberg, S.L. Centrifuge: Rapid and sensitive classification of metagenomic sequences. Genome Res. 2016, 26, 1721–1729. [Google Scholar] [CrossRef]
  30. Chatterjee, I.; Lu, R.; Zhang, Y.; Zhang, J.; Dai, Y.; Xia, Y.; Sun, J. Vitamin D receptor promotes healthy microbial metabolites and microbiome. Sci. Rep. 2020, 10, 7340. [Google Scholar] [CrossRef]
  31. Sherwin, W.B.; Jabot, F.; Rush, R.; Rossetto, M. Measurement of biological information with applications from genes to landscapes. Mol. Ecol. 2006, 15, 2857–2869. [Google Scholar] [CrossRef]
  32. Xia, Y.; Sun, J. Alpha Diversity. In Bioinformatic and Statistical Analysis of Microbiome Data: From Raw Sequences to Advanced Modeling with QIIME 2 and R; Springer International Publishing: Cham, Switzerland, 2023; pp. 289–333. [Google Scholar]
  33. Xia, Y.; Sun, J. (Eds.) Beta Diversity Metrics and Ordination. In Bioinformatic and Statistical Analysis of Microbiome Data: From Raw Sequences to Advanced Modeling with QIIME 2 and R; Springer International Publishing: Cham, Switzerland, 2023; pp. 335–395. [Google Scholar] [CrossRef]
  34. Xia, Y.; Sun, J. Statistical Testing of Beta Diversity. In Bioinformatic and Statistical Analysis of Microbiome Data: From Raw Sequences to Advanced Modeling with QIIME 2 and R; Springer International Publishing: Cham, Switzerland, 2023; pp. 397–433. [Google Scholar]
  35. Nearing, J.T.; Douglas, G.M.; Hayes, M.G.; MacDonald, J.; Desai, D.K.; Allward, N.; Jones, C.M.A.; Wright, R.J.; Dhanani, A.S.; Comeau, A.M.; et al. Microbiome differential abundance methods produce different results across 38 datasets. Nat. Commun. 2022, 13, 342. [Google Scholar] [CrossRef] [PubMed]
  36. Yanagida, T. Package ‘misty’, 0.5.4; 2023. Available online: https://cran.r-project.org/web/packages/misty/index.html (accessed on 1 October 2023).
  37. Suhr, M.J.; Hallen-Adams, H.E. The human gut mycobiome: Pitfalls and potentials--a mycologists perspective. Mycologia 2015, 107, 1057–1073. [Google Scholar] [CrossRef] [PubMed]
  38. Lavrinienko, A.; Scholier, T.; Bates, S.T.; Miller, A.N.; Watts, P.C. Defining gut mycobiota for wild animals: A need for caution in assigning authentic resident fungal taxa. Anim. Microbiome 2021, 3, 75. [Google Scholar] [CrossRef] [PubMed]
  39. Suhr, M.J.; Banjara, N.; Hallen-Adams, H.E. Sequence-based methods for detecting and evaluating the human gut mycobiome. Lett. Appl. Microbiol. 2016, 62, 209–215. [Google Scholar] [CrossRef] [PubMed]
  40. Tang, J.; Iliev, I.D.; Brown, J.; Underhill, D.M.; Funari, V.A. Mycobiome: Approaches to analysis of intestinal fungi. J. Immunol. Methods 2015, 421, 112–121. [Google Scholar] [CrossRef] [PubMed]
  41. Mantzoukas, S.; Kitsiou, F.; Natsiopoulos, D.; Eliopoulos, P.A. Entomopathogenic Fungi: Interactions and Applications. Encyclopedia 2022, 2, 646–656. [Google Scholar] [CrossRef]
  42. Nguyen, N.H.; Song, Z.; Bates, S.T.; Branco, S.; Tedersoo, L.; Menke, J.; Schilling, J.S.; Kennedy, P.G. FUNGuild: An open annotation tool for parsing fungal community datasets by ecological guild. Fungal Ecol. 2016, 20, 241–248. [Google Scholar] [CrossRef]
  43. Kuo, M.; Dewsbury, D.R.; O’Donnell, K.; Carter, M.C.; Rehner, S.A.; Moore, J.D.; Moncalvo, J.M.; Canfield, S.A.; Stephenson, S.L.; Methven, A.S.; et al. Taxonomic revision of true morels (Morchella) in Canada and the United States. Mycologia 2012, 104, 1159–1177. [Google Scholar] [CrossRef]
  44. Kiran, M.; Khan, J.; Sher, H.; Pfister, D.H.; Khalid, A.N. Amanita griseofusca: A new species of Amanita in section Vaginatae from Malam Jabba, Swat, Pakistan. Phytotaxa 2018, 364, 181. [Google Scholar] [CrossRef]
  45. Zhang, J.j.; Shi, L.; Chen, H.; Sun, Y.q.; Zhao, M.w.; Ren, A.; Chen, M.j.; Wang, H.; Feng, Z.y. An efficient Agrobacterium-mediated transformation method for the edible mushroom Hypsizygus marmoreus. Microbiol. Res. 2014, 169, 741–748. [Google Scholar] [CrossRef]
  46. Fan, J.; Zhang, J.; Tang, Q.; Liu, Y.; Zhang, A.; Pan, Y. Structural elucidation of a neutral fucogalactan from the mycelium of Coprinus comatus. Carbohydr. Res. 2006, 341, 1130–1134. [Google Scholar] [CrossRef] [PubMed]
  47. Reddy, N.; Mahesh, G.; Priya, M.; Singh, R.U.S.; Manjunatha, L. Chapter 43-Hirsutella. In Beneficial Microbes in Agro-Ecology; Amaresan, N., Senthil Kumar, M., Annapurna, K., Kumar, K., Sankaranarayanan, A., Eds.; Academic Press: Cambridge, MA, USA, 2020; pp. 817–831. [Google Scholar]
  48. Wolfe, K.H.; Armisén, D.; Proux-Wera, E.; ÓhÉigeartaigh, S.S.; Azam, H.; Gordon, J.L.; Byrne, K.P. Clade- and species-specific features of genome evolution in the Saccharomycetaceae. FEMS Yeast Res. 2015, 15, fov035. [Google Scholar] [CrossRef] [PubMed]
  49. Kamga, S.F.; Ndjomatchoua, F.T.; Guimapi, R.A.; Klingen, I.; Tchawoua, C.; Hjelkrem, A.-G.R.; Thunes, K.H.; Kakmeni, F.M. The effect of climate variability in the efficacy of the entomopathogenic fungus Metarhizium acridum against the desert locust Schistocerca gregaria. Sci. Rep. 2022, 12, 7535. [Google Scholar] [CrossRef] [PubMed]
  50. Sieverding, E.; Da Silva, G.A.; Berndt, R.; Oehl, F. Rhizoglomus, a new genus of the Glomeraceae. Mycotaxon 2015, 129, 373–386. [Google Scholar] [CrossRef]
  51. Kemp, N.D.; Vaughan, M.M.; McCormick, S.P.; Brown, J.A.; Bakker, M.G. Sarocladium zeae is a systemic endophyte of wheat and an effective biocontrol agent against Fusarium head blight. Biol. Control 2020, 149, 104329. [Google Scholar] [CrossRef]
  52. De Graeve, M.; De Maeseneire, S.L.; Roelants, S.L.K.W.; Soetaert, W. Starmerella bombicola, an industrially relevant, yet fundamentally underexplored yeast. FEMS Yeast Res. 2018, 18, foy072. [Google Scholar] [CrossRef] [PubMed]
  53. Yu, J.-H.; Lee, D.-H.; Oh, Y.-J.; Han, K.-C.; Ryu, Y.-W.; Seo, J.-H. Selective utilization of fructose to glucose by Candida magnoliae, an erythritol producer. Appl. Biochem. Biotechnol. 2006, 131, 870–879. [Google Scholar] [CrossRef]
  54. van der Merwe, M.; Ericson, L.; Walker, J.; Thrall, P.H.; Burdon, J.J. Evolutionary relationships among species of Puccinia and Uromyces (Pucciniaceae, Uredinales) inferred from partial protein coding gene phylogenies. Mycol. Res. 2007, 111, 163–175. [Google Scholar] [CrossRef]
  55. Gonthier, P.; Anselmi, N.; Capretti, P.; Bussotti, F.; Feducci, M.; Giordano, L.; Honorati, T.; Lione, G.; Luchi, N.; Michelozzi, M.; et al. An integrated approach to control the introduced forest pathogen Heterobasidion irregulare in Europe. For. Int. J. For. Res. 2014, 87, 471–481. [Google Scholar] [CrossRef]
  56. Gautam, A.K. Colletotrichum gloeosporioides: Biology, Pathogenicity and Management in India. J. Plant Physiol. Pathol. 2014, 2–11. [Google Scholar] [CrossRef]
  57. Badalyan, S.M.; Szafranski, K.; Hoegger, P.J.; Navarro-González, M.; Majcherczyk, A.; Kües, U. New Armenian Wood-Associated Coprinoid Mushrooms: Coprinopsis strossmayeri and Coprinellus aff. radians. Diversity 2011, 3, 136–154. [Google Scholar] [CrossRef]
  58. Kuuskeri, J.; Häkkinen, M.; Laine, P.; Smolander, O.-P.; Tamene, F.; Miettinen, S.; Nousiainen, P.; Kemell, M.; Auvinen, P.; Lundell, T. Time-scale dynamics of proteome and transcriptome of the white-rot fungus Phlebia radiata: Growth on spruce wood and decay effect on lignocellulose. Biotechnol. Biofuels 2016, 9, 192. [Google Scholar] [CrossRef] [PubMed]
  59. Knudsen, K.; Kocourková, J. Sarcogyne praetermissa (Acarosporaceae), a New Calcicolous Lichen Species from Europe, with a Key to the European Sarcogyne Species. Heia 2018, 31, 133–139. [Google Scholar] [CrossRef]
  60. Quince, C.; Walker, A.W.; Simpson, J.T.; Loman, N.J.; Segata, N. Shotgun metagenomics, from sampling to analysis. Nat. Biotechnol. 2017, 35, 833–844. [Google Scholar] [CrossRef]
  61. Kanehisa, M.; Goto, S. KEGG: Kyoto Encyclopedia of Genes and Genomes. Nucleic Acids Res. 2000, 28, 27–30. [Google Scholar] [CrossRef] [PubMed]
  62. Kushkevych, I.; Cejnar, J.; Treml, J.; Dordevic, D.; Kollar, P.; Vitezova, M. Recent Advances in Metabolic Pathways of Sulfate Reduction in Intestinal Bacteria. Cells 2020, 9, 698. [Google Scholar] [CrossRef]
  63. Teigen, L.M.; Geng, Z.; Sadowsky, M.J.; Vaughn, B.P.; Hamilton, M.J.; Khoruts, A. Dietary Factors in Sulfur Metabolism and Pathogenesis of Ulcerative Colitis. Nutrients 2019, 11, 931. [Google Scholar] [CrossRef]
  64. Fang, H.; Kang, J.; Zhang, D. Microbial production of vitamin B(12): A review and future perspectives. Microb. Cell Fact. 2017, 16, 15. [Google Scholar] [CrossRef]
  65. Li, Q.; Wang, C.; Tang, C.; He, Q.; Li, N.; Li, J. Dysbiosis of Gut Fungal Microbiota is Associated with Mucosal Inflammation in Crohn’s Disease. J. Clin. Gastroenterol. 2014, 48, 513–523. [Google Scholar] [CrossRef]
  66. Zhai, C.-D.; Zheng, J.-J.; An, B.-C.; Huang, H.-F.; Tan, Z.-C. Intestinal microbiota composition in patients with amyotrophic lateral sclerosis: Establishment of bacterial and archaeal communities analyses. Chin. Med. J. 2019, 132, 1815–1822. [Google Scholar] [CrossRef]
  67. Limon, J.J.; Skalski, J.H.; Underhill, D.M. Commensal Fungi in Health and Disease. Cell Host Microbe 2017, 22, 156–165. [Google Scholar] [CrossRef] [PubMed]
  68. Iliev, I.D.; Leonardi, I. Fungal dysbiosis: Immunity and interactions at mucosal barriers. Nat. Rev. Immunol. 2017, 17, 635–646. [Google Scholar] [CrossRef] [PubMed]
  69. Coker, O.O.; Nakatsu, G.; Dai, R.Z.; Wu, W.K.K.; Wong, S.H.; Ng, S.C.; Chan, F.K.L.; Sung, J.J.Y.; Yu, J. Enteric fungal microbiota dysbiosis and ecological alterations in colorectal cancer. Gut 2019, 68, 654–662. [Google Scholar] [CrossRef] [PubMed]
  70. Liguori, G.; Lamas, B.; Richard, M.L.; Brandi, G.; da Costa, G.; Hoffmann, T.W.; Di Simone, M.P.; Calabrese, C.; Poggioli, G.; Langella, P.; et al. Fungal Dysbiosis in Mucosa-associated Microbiota of Crohn’s Disease Patients. J. Crohns Colitis 2016, 10, 296–305. [Google Scholar] [CrossRef] [PubMed]
  71. Bakke, D.; Chatterjee, I.; Agrawal, A.; Dai, Y.; Sun, J. Regulation of Microbiota by Vitamin D Receptor: A Nuclear Weapon in Metabolic Diseases. Nucl. Recept. Res. 2018, 5, 101377. [Google Scholar] [CrossRef] [PubMed]
  72. Kumamoto, C.A. Inflammation and gastrointestinal Candida colonization. Curr. Opin. Microbiol. 2011, 14, 386–391. [Google Scholar] [CrossRef] [PubMed]
  73. Nkamga, V.D.; Henrissat, B.; Drancourt, M. Archaea: Essential inhabitants of the human digestive microbiota. Hum. Microbiome J. 2017, 3, 1–8. [Google Scholar] [CrossRef]
  74. Shivvers, D.W.; Brock, T.D. Oxidation of Elemental Sulfur by Sulfolobus acidocaldarius. J. Bacteriol. 1973, 114, 706–710. [Google Scholar] [CrossRef]
  75. Barton, L.L.; Ritz, N.L.; Fauque, G.D.; Lin, H.C. Sulfur Cycling and the Intestinal Microbiome. Dig. Dis. Sci. 2017, 62, 2241–2257. [Google Scholar] [CrossRef]
  76. Walker, A.; Schmitt-Kopplin, P. The role of fecal sulfur metabolome in inflammatory bowel diseases. Int. J. Med. Microbiol. 2021, 311, 151513. [Google Scholar] [CrossRef]
  77. Candela, M.; Perna, F.; Carnevali, P.; Vitali, B.; Ciati, R.; Gionchetti, P.; Rizzello, F.; Campieri, M.; Brigidi, P. Interaction of probiotic Lactobacillus and Bifidobacterium strains with human intestinal epithelial cells: Adhesion properties, competition against enteropathogens and modulation of IL-8 production. Int. J. Food Microbiol. 2008, 125, 286–292. [Google Scholar] [CrossRef] [PubMed]
  78. Bakke, D.S.; Zhang, J.; Zhang, Y.; Ogbu, D.; Xia, Y.; Sun, J. Myeloid vitamin D receptor regulates Paneth cells and microbial homeostasis. FASEB J. 2023, 37, e22957. [Google Scholar] [CrossRef] [PubMed]
  79. Lu, R.; Zhang, Y.G.; Xia, Y.; Zhang, J.; Kaser, A.; Blumberg, R.; Sun, J. Paneth Cell Alertness to Pathogens Maintained by Vitamin D Receptors. Gastroenterology 2021, 160, 1269–1283. [Google Scholar] [CrossRef] [PubMed]
  80. Paul, A.K.; Paul, A.; Jahan, R.; Jannat, K.; Bondhon, T.A.; Hasan, A.; Nissapatorn, V.; Pereira, M.L.; Wilairatana, P.; Rahmatullah, M. Probiotics and Amelioration of Rheumatoid Arthritis: Significant Roles of Lactobacillus casei and Lactobacillus acidophilus. Microorganisms 2021, 9, 1070. [Google Scholar] [CrossRef] [PubMed]
  81. Naser, I.B.; Hoque, M.M.; Nahid, M.A.; Tareq, T.M.; Rocky, M.K.; Faruque, S.M. Analysis of the CRISPR-Cas system in bacteriophages active on epidemic strains of Vibrio cholerae in Bangladesh. Sci. Rep. 2017, 7, 14880. [Google Scholar] [CrossRef] [PubMed]
  82. Greuter, T.; Manser, C.; Pittet, V.; Vavricka, S.R.; Biedermann, L.; on behalf of Swiss IBDnet, an official working group of the Swiss Society of Gastroenterology. Gender Differences in Inflammatory Bowel Disease. Digestion 2020, 101, 98–104. [Google Scholar] [CrossRef] [PubMed]
  83. Klein, S.L.; Flanagan, K.L. Sex differences in immune responses. Nat. Rev. Immunol. 2016, 16, 626–638. [Google Scholar] [CrossRef]
  84. Strati, F.; Di Paola, M.; Stefanini, I.; Albanese, D.; Rizzetto, L.; Lionetti, P.; Calabrò, A.; Jousson, O.; Donati, C.; Cavalieri, D.; et al. Age and Gender Affect the Composition of Fungal Population of the Human Gastrointestinal Tract. Front. Microbiol. 2016, 7, 1227. [Google Scholar] [CrossRef]
  85. Li, Q.; Chan, H.; Liu, W.X.; Liu, C.A.; Zhou, Y.; Huang, D.; Wang, X.; Li, X.; Xie, C.; Liu, W.Y.; et al. Carnobacterium maltaromaticum boosts intestinal vitamin D production to suppress colorectal cancer in female mice. Cancer Cell 2023, 41, 1450–1465. [Google Scholar] [CrossRef]
  86. Maruvada, P.; Leone, V.; Kaplan, L.M.; Chang, E.B. The Human Microbiome and Obesity: Moving beyond Associations. Cell Host Microbe 2017, 22, 589–599. [Google Scholar] [CrossRef]
  87. Levitt, M.D.; Furne, J.K.; Kuskowski, M.; Ruddy, J. Stability of Human Methanogenic Flora over 35 Years and a Review of Insights Obtained from Breath Methane Measurements. Clin. Gastroenterol. Hepatol. 2006, 4, 123–129. [Google Scholar] [CrossRef] [PubMed]
  88. Karu, N.; Deng, L.; Slae, M.; Guo, A.C.; Sajed, T.; Huynh, H.; Wine, E.; Wishart, D.S. A review on human fecal metabolomics: Methods, applications and the human fecal metabolome database. Anal. Chim. Acta 2018, 1030, 1–24. [Google Scholar] [CrossRef] [PubMed]
Figure 1. Species-level alpha and beta diversity via different tissue deletions of the VDR. (A) Distribution of Shannon diversity metrics at the species level, divided by sex, for fungi. Color indicates genotype. Subsequent ANOSIM analysis on sex subgroups revealed no statistically significant comparisons (p > 0.05). (B) Within-group versus between-group Bray–Curtis dissimilarity metrics for mice of both sexes. Color indicates genotype. Subsequent ANOSIM analysis found all control-knockout pairs to be significantly different. These results, VDRΔIEC vs. VDRLoxp (p = 0.005), VDRΔPC vs. VDRLoxp (p = 0.001), and VDRΔLyz vs. VDRLoxp (p = 0.001), are indicated on the boxplot.
Metabolites 14 00032 g001
Figure 2. Differential fungi in the KO mice. Fungal taxa that are significantly (q, # ≤ 0.1, * ≤ 0.05, ** ≤ 0.01, and *** ≤ 0.001) differentially abundant in VDR KO mice relative to the control group, not sub-dividing by sex. “s_” indicates that the taxa is a species and “g_” indicates that it is a genus—the only two taxonomic levels that were studied. LFC indicates log2 fold change, and the color indicates the direction of the shift relative to the control (blue is decreased, and red is increased). (A) VDRΔPC, (B) VDRΔIEC, and (C) VDRΔLyz.
Metabolites 14 00032 g002
Figure 3. Significant (p ≤ 0.05) correlations between significantly differentially abundant (q ≤ 0.1) species of fungi and significantly differentially abundant (q ≤ 0.1) bacteria, archaea, and viruses. The cell color indicates the magnitude of the correlation (blue = negative; red = positive), while a white space indicates no significant correlation. The colors of the row names indicate the following: peach for archaea, blue for bacteria, green for eukaryotes, and purple for viruses. (A) VDRΔPC. (B) VDRΔLyz.
Metabolites 14 00032 g003
Figure 4. Differential fungi in sex subsets of the VDRΔPC group. Fungal taxa that are significantly (q # ≤ 0.1, * ≤ 0.05, ** ≤ 0.01, and *** ≤ 0.001) differentially abundant in the VDR knockout mice relative to the control mice via sex subset. Figure (A) shows the genera and figure (B) shows the species—the only two taxonomic levels that were observed. LFC indicates the log2 fold change, and the color indicates the direction of the shift relative to the control (blue is decreased, and red is increased). Purple font indicates that a taxa was found to be differentially abundant in both the male and female groups.
Metabolites 14 00032 g004
Figure 5. Differential fungi in sex subsets of the VDRΔIEC group. Fungal taxa that are significantly (q # ≤ 0.1, * ≤ 0.05, ** ≤ 0.01, and *** ≤ 0.001) differentially abundant in the VDR knockout mice relative to the control mice via sex subset. Figure (A) shows the genera and figure (B) shows the species—the only two taxonomic levels that were observed. LFC indicates the log2 fold change, and the color indicates the direction of the shift relative to the control (blue is decreased, and red is increased). Purple font indicates that a taxa was found to be differentially abundant in both the male and female groups.
Metabolites 14 00032 g005
Figure 6. Differential fungi in sex subsets of the VDRΔLyz group. Fungal taxa that are significantly (q # ≤ 0.1, * ≤ 0.05, ** ≤ 0.01, and *** ≤ 0.001) differentially abundant in the VDR knockout mice relative to the control mice via sex subset. Figure (A) shows the genera and figure (B) shows the species—the only two taxonomic levels that were observed. LFC indicates the log2 fold change, and the color indicates the direction of the shift relative to the control (blue is decreased, and red is increased). Purple font indicates that a taxa was found to be differentially abundant in both the male and female groups.
Metabolites 14 00032 g006
Figure 7. Species-level alpha and beta diversity in the VDR KO mice compared to the VDRLoxp control group. (A) Shannon diversity by sample. Presented are the p-values of the subsequent ANOSIM analysis on the sex subgroups that were statistically significant (p ≤ 0.05) or marginally significant (p ≤ 0.1). (B) Within-group versus between-group Bray–Curtis dissimilarity metrics for mice of both sexes. Color indicates genotype. A subsequent ANOSIM analysis found all the control–knockout pairs to be significantly different. These results, VDRΔIEC vs. VDRLoxp (p = 0.012), VDRΔPC vs. VDRLoxp (p = 0.002), and VDRΔLyz vs. VDRLoxp (p = 0.001), are indicated on the boxplot.
Metabolites 14 00032 g007
Figure 8. Differential archaea and their correlation maps. (A) Archaeal taxa that are significantly (q ≤ 0.1, * ≤ 0.05, and *** ≤ 0.001) differentially abundant in the VDR KO mice relative to the control group, not splitting by sex. “s_” indicates that the taxa is a species and “g_” indicates it is a genus—the only two taxonomic levels that were used as inputs. LFC indicates the log2 fold change, and the color indicates the direction of the shift relative to the control (blue is decreased, and red is increased). (B) Significant (p ≤ 0.05) correlations between significantly (q ≤ 0.1) differentially abundant species of archaea and significantly (q ≤ 0.1) differentially abundant bacteria, fungi, and viruses. The color indicates the magnitude of the correlation (blue = negative; red = positive), while a white space indicates no significant correlation. The colors of the row names indicate the following: peach for archaea, blue for bacteria, green for eukaryotes, and purple for viruses.
Metabolites 14 00032 g008
Figure 9. Differential archaea in sex subsets. Archaeal taxa that are significantly (q ≤ 0.1, * ≤ 0.05, ** ≤ 0.01, and *** ≤ 0.001) differentially abundant in VDR knockout mice. (A) VDRΔPC, (B) VDRΔIEC, and (C) VDRΔLyz in male and female mice. “s_” indicates that the taxa is a species and “g_” indicates that it is a genus—the only two taxonomic levels that were observed. LFC indicates the log2 fold change, and the color indicates the direction of the shift relative to the control (blue is decreased, and red is increased).
Metabolites 14 00032 g009
Figure 10. Predictive functional analysis using metagenomics. (A) Genes, (B) pathways, and (C) modules that are significantly (q ≤ 0.1, * ≤ 0.05, ** ≤ 0.01, and *** ≤ 0.001) increased in the KO vs. control mice. The magnitude of this difference is given as the log2 fold change (LFC), and the color indicates the direction of the shift relative to the control.
Metabolites 14 00032 g010
Figure 11. Metabolites related to sulfate reduction. (A) The primary metabolites involved in dissimilatory and sulfate reduction, along with key downstream molecules [62,63]. (B) The primary metabolites involved in the cobalamin salvage pathway [64]. (C) The difference in the abundances of metabolites from the above pathways detected in the VDRΔLyz mice relative to the VDRLoxp mice. LFC indicates the Log2 fold change. Gray indicates a lack of statistical significance (p ≤ 0.05), while the presence of a significant difference is given by non-gray color and * annotation. A # indicates marginal significance (p ≤ 0.1).
Metabolites 14 00032 g011
Figure 12. The working model of VDR deletion and altered archaea, fungi, bacteria, viruses, and metabolites.
Metabolites 14 00032 g012
Table 1. KEGG [61] database search looking for the presence (+) or absence (-) of a gene within the genomes of differentially abundant microbes. While the genomes of all differentially abundant microbes were searched, only the microbes with at least one of the above genes (10A) in their genome are presented.
Sulfate Adenylyltransferase Subunit 1Sulfate Adenylyltransferase Subunit 2Adenosylcobyric Acid SynthaseAdenosylcobinamide-Phosphate Synthase
K00956K00957K02232K02227
Thermococcus piezophilus--++
Bordetella pseudohinzii++--
Chroococcidiopsis thermalis--++
Sulfurovum lithotrophicum++++
Disclaimer/Publisher’s Note: The statements, opinions and data contained in all publications are solely those of the individual author(s) and contributor(s) and not of MDPI and/or the editor(s). MDPI and/or the editor(s) disclaim responsibility for any injury to people or property resulting from any ideas, methods, instructions or products referred to in the content.

