
Polymorphisms −374 T/A and −429 T/C of the Receptor for Advanced Glycation End-Products (RAGE) and Serum Levels of RAGE (sRAGE) Are Not Associated with Metabolic Syndrome
 , and
, and
Abstract
:1. Introduction
2. Materials and Methods
2.1. Participants
2.2. Data Collection
2.3. Blood Sampling and Analyses
2.4. Genomic DNA Isolation
2.5. AGER Genotyping Assay
2.6. Statistical Analysis
3. Results
3.1. Descriptive Analysis of the SNPs
3.2. Association of the Polymorphisms with MS
3.3. Genetic Risk Score and Haplotypes
4. Discussion
5. Conclusions
Author Contributions
Funding
Institutional Review Board Statement
Informed Consent Statement
Data Availability Statement
Acknowledgments
Conflicts of Interest
References
- Alberti, K.G.M.M.; Eckel, R.H.; Grundy, S.M.; Zimmet, P.Z.; Cleeman, J.I.; Donato, K.A.; Fruchart, J.C.; James, W.P.T.; Loria, C.M.; Smith, S.C., Jr. Harmonizing the metabolic syndrome: A joint interim statement of the international diabetes federation task force on epidemiology and prevention; National heart, lung, and blood institute; American heart association; World heart federation; International Atherosclerosis Society; and International Association for the Study of Obesity. Circulation 2009, 120, 1640–1645. [Google Scholar] [CrossRef] [PubMed]
- Ott, C.; Jacobs, K.; Haucke, E.; Santos, A.N.; Grune, T.; Simm, A. Role of advanced glycation end products in cellular signaling. Redox Biol. 2014, 2, 411–429. [Google Scholar] [CrossRef] [PubMed]
- Ramasamy, R.; Yan, S.F.; Schmidt, A.M. Receptor for AGE (RAGE): Signaling mechanisms in the pathogenesis of diabetes and its complications. Ann. N. Y. Acad. Sci. 2011, 1243, 88–102. [Google Scholar] [CrossRef] [PubMed]
- Wautier, M.-P.; Guillausseau, P.-J.; Wautier, J.-L. Activation of the receptor for advanced glycation end products and consequences on health. Diabetes Metab. Syndr. Clin. Res. Rev. 2017, 11, 305–309. [Google Scholar] [CrossRef]
- Hudson, B.I.; Carter, A.M.; Harja, E.; Kalea, A.Z.; Arriero, M.; Yang, H.; Grant, P.J.; Schmidt, A.M. Identification, classification, and expression of RAGE gene splice variants. FASEB J. 2008, 22, 1572–1580. [Google Scholar] [CrossRef]
- Raucci, A.; Cugusi, S.; Antonelli, A.; Barabino, S.M.; Monti, L.; Bierhaus, A.; Reiss, K.; Saftig, P.; Bianchi, M.E. A soluble form of the receptor for advanced glycation endproducts (RAGE) is produced by proteolytic cleavage of the membrane-bound form by the sheddase a disintegrin and metalloprotease 10 (ADAM10). FASEB J. 2008, 22, 3716–3727. [Google Scholar] [CrossRef]
- Falcone, C.; Emanuele, E.; D’Angelo, A.; Buzzi, M.P.; Belvito, C.; Cuccia, M.; Geroldi, D. Plasma Levels of Soluble Receptor for Advanced Glycation End Products and Coronary Artery Disease in Nondiabetic Men. Arterioscler. Thromb. Vasc. Biol. 2005, 25, 1032–1037. [Google Scholar] [CrossRef]
- Emanuele, E.; D’Angelo, A.; Tomaino, C.; Binetti, G.; Ghidoni, R.; Politi, P.; Bernardi, L.; Maletta, R.; Bruni, A.; Geroldi, D. Circulating Levels of Soluble Receptor for Advanced Glycation End Products in Alzheimer Disease and Vascular Dementia. Arch. Neurol. 2005, 62, 1734–1736. [Google Scholar] [CrossRef]
- Glasnovic, A.; Cvija, H.; Stojic, M.; Ivčević, S.; Romic, D.; Ticinovic, N.; Vuletic, V.; Lazibat, I.; Grcevic, D. Decreased Level of sRAGE in the Cerebrospinal Fluid of Multiple Sclerosis Patients at Clinical Onset. Neuroimmunomodulation 2014, 21, 226–233. [Google Scholar] [CrossRef]
- Iłżecka, J. Serum-soluble receptor for advanced glycation end product levels in patients with amyotrophic lateral sclerosis. Acta Neurol. Scand. 2009, 120, 119–122. [Google Scholar] [CrossRef]
- Bobek, D.; Grčević, D.; Kovačić, N.; Lukić, I.K.; Jelušić, M. The presence of high mobility group box-1 and soluble receptor for advanced glycation end-products in juvenile idiopathic arthritis and juvenile systemic lupus erythematosus. Pediatr. Rheumatol. 2014, 12, 50. [Google Scholar] [CrossRef]
- Ma, C.-Y.; Ma, J.-L.; Jiao, Y.-L.; Li, J.-F.; Wang, L.-C.; Yang, Q.-R.; You, L.; Cui, B.; Chen, Z.-J.; Zhao, Y.-R. The Plasma Level of Soluble Receptor for Advanced Glycation End Products Is Decreased in Patients with Systemic Lupus Erythematosus. Scand. J. Immunol. 2012, 75, 614–622. [Google Scholar] [CrossRef]
- Jiao, L.; Weinstein, S.J.; Albanes, D.; Taylor, P.R.; Graubard, B.I.; Virtamo, J.; Stolzenberg-Solomon, R.Z. Evidence That Serum Levels of the Soluble Receptor for Advanced Glycation End Products Are Inversely Associated with Pancreatic Cancer Risk: A Prospective Study. Cancer Res. 2011, 71, 3582–3589. [Google Scholar] [CrossRef]
- Tesarova, P.; Kalousova, M.; Jachymova, M.; Mestek, O.; Petruzelka, L.; Zima, T. Receptor for Advanced Glycation End Products (RAGE)—Soluble Form (sRAGE) and Gene Polymorphisms in Patients with Breast Cancer. Cancer Investig. 2007, 25, 720–725. [Google Scholar] [CrossRef]
- Yilmaz, Y.; Ulukaya, E.; Gul, O.O.; Arabul, M.; Gul, C.B.; Atug, O.; Oral, A.Y.; Aker, S.; Dolar, E. Decreased plasma levels of soluble receptor for advanced glycation endproducts (sRAGE) in patients with nonalcoholic fatty liver disease. Clin. Biochem. 2009, 42, 802–807. [Google Scholar] [CrossRef]
- Brix, J.M.; Höllerl, F.; Kopp, H.-P.; Schernthaner, G. The soluble form of the receptor of advanced glycation endproducts increases after bariatric surgery in morbid obesity. Int. J. Obes. 2012, 36, 1412–1417. [Google Scholar] [CrossRef]
- Kalousová, M.; Hodková, M.; Kazderová, M.; Fialová, J.; Tesař, V.; Dusilová-Sulková, S.; Zima, T. Soluble Receptor for Advanced Glycation End Products in Patients with Decreased Renal Function. Am. J. Kidney Dis. 2006, 47, 406–411. [Google Scholar] [CrossRef]
- Nakamura, T.; Sato, E.; Fujiwara, N.; Kawagoe, Y.; Ueda, Y.; Suzuki, T.; Yamada, S.; Takeuchi, M.; Fukami, K.; Ueda, S.; et al. Positive association of serum levels of advanced glycation end products and high mobility group box–1 with asymmetric dimethylarginine in nondiabetic chronic kidney disease patients. Metabolism 2009, 58, 1624–1628. [Google Scholar] [CrossRef]
- Šebeková, K.; Krivošíková, Z.; Gajdoš, M. Total plasma Nε-(carboxymethyl)lysine and sRAGE levels are inversely associated with a number of metabolic syndrome risk factors in non-diabetic young-to-middle-aged medication-free subjects. Clin. Chem. Lab. Med. 2014, 52, 139–149. [Google Scholar] [CrossRef]
- Gurecká, R.; Koborová, I.; Csongová, M.; Šebek, J.; Šebeková, K. Correlation among soluble receptors for advanced glycation end-products, soluble vascular adhesion protein-1/semicarbazide-sensitive amine oxidase (sVAP-1) and cardiometabolic risk markers in apparently healthy adolescents: A cross-sectional study. Glycoconj. J. 2016, 33, 599–606. [Google Scholar] [CrossRef]
- Zaki, M.; Kamal, S.; Kholousi, S.; El-Bassyouni, H.T.; Yousef, W.; Reyad, H.; Mohamed, R.; Basha, W.A. Serum soluble receptor of advanced glycation end products and risk of metabolic syndrome in Egyptian obese women. EXCLI J. 2017, 16, 973–980. [Google Scholar] [CrossRef] [PubMed]
- Momma, H.; Niu, K.; Kobayashi, Y.; Huang, C.; Chujo, M.; Otomo, A.; Tadaura, H.; Miyata, T.; Nagatomi, R. Higher serum soluble receptor for advanced glycation end product levels and lower prevalence of metabolic syndrome among Japanese adult men: A cross-sectional study. Diabetol. Metab. Syndr. 2014, 6, 33. [Google Scholar] [CrossRef] [PubMed]
- Haddad, M.; Knani, I.; Bouzidi, H.; Berriche, O.; Hammami, M.; Kerkeni, M. Plasma Levels of Pentosidine, Carboxymethyl-Lysine, Soluble Receptor for Advanced Glycation End Products, and Metabolic Syndrome: The Metformin Effect. Dis. Markers 2016, 2016, 6248264. [Google Scholar] [CrossRef] [PubMed]
- Reynaert, N.L.; Gopal, P.; Rutten, E.P.; Wouters, E.F.; Schalkwijk, C.G. Advanced glycation end products and their receptor in age-related, non-communicable chronic inflammatory diseases; Overview of clinical evidence and potential contributions to disease. Int. J. Biochem. Cell Biol. 2016, 81, 403–418. [Google Scholar] [CrossRef]
- Vissing, H.; Aagaard, L.; Tommerup, N.; Boel, E. Localization of the Human Gene for Advanced Glycosylation End Product-Specific Receptor (AGER) to Chromosome 6p21.3. Genomics 1994, 24, 606–608. [Google Scholar] [CrossRef]
- Hudson, B.I.; Stickland, M.H.; Futers, T.S.; Grant, P.J. Effects of Novel Polymorphisms in the RAGE Gene on Transcriptional Regulation and Their Association with Diabetic Retinopathy. Diabetes 2001, 50, 1505–1511. [Google Scholar] [CrossRef]
- Falcone, C.; Geroldi, D.; Buzzi, M.P.; Emanuele, E.; Yilmaz, Y.; Fontana, J.M.; Vignali, L.; Boiocchi, C.; Sbarsi, I.; Cuccia, M. The −374T/A RAGE Polymorphism Protects Against Future Cardiac Events in Nondiabetic Patients with Coronary Artery Disease. Arch. Med. Res. 2008, 39, 320–325. [Google Scholar] [CrossRef]
- Falcone, C.; Campo, I.; Emanuele, E.; Buzzi, M.P.; Zorzetto, M.; Sbarsi, I.; Cuccia, M. Relationship between the -374T/A RAGE gene polymorphism and angiographic coronary artery disease. Int. J. Mol. Med. 2004, 14, 1061–1064. [Google Scholar] [CrossRef]
- Picheth, G.; Costantini, C.O.; Pedrosa, F.O.; Martinez, T.L.D.R.; De Souza, E.M. The −374A allele of the receptor for advanced glycation end products (RAGE) gene promoter is a protective factor against cardiovascular lesions in type 2 diabetes mellitus patients. Clin. Chem. Lab. Med. 2007, 45, 1268–1272. [Google Scholar] [CrossRef]
- Yuan, D.; Yuan, D.; Liu, Q. Association of the Receptor for Advanced Glycation End Products Gene Polymorphisms with Diabetic Retinopathy in Type 2 Diabetes: A Meta-Analysis. Ophthalmologica 2012, 227, 223–232. [Google Scholar] [CrossRef]
- Lu, W.; Feng, B. The -374A Allele of the RAGE Gene As a Potential Protective Factor for Vascular Complications in Type 2 Diabetes: A Meta-Analysis. Tohoku J. Exp. Med. 2010, 220, 291–297. [Google Scholar] [CrossRef]
- Sullivan, C.M.; Futers, T.S.; Barrett, J.H.; Hudson, B.I.; Freeman, M.S.; Grant, P.J. RAGE polymorphisms and the heritability of insulin resistance: The Leeds Family Study. Diabetes Vasc. Dis. Res. 2005, 2, 42–44. [Google Scholar] [CrossRef]
- Peng, F.; Hu, D.; Jia, N.; Li, X.; Li, Y.; Chu, S.; Zhu, D.; Shen, W.; Lin, J.; Niu, W. Association of Four Genetic Polymorphisms of AGER and Its Circulating Forms with Coronary Artery Disease: A Meta-Analysis. PLoS ONE 2013, 8, e70834. [Google Scholar] [CrossRef]
- Shi, Z.; Lu, W.; Xie, G. Association between the RAGE gene -374T/A, -429T/C polymorphisms and diabetic nephropathy: A meta-analysis. Ren. Fail. 2015, 37, 751–756. [Google Scholar] [CrossRef]
- Kucukhuseyin, O.; Aydogan, H.Y.; Isbir, C.S.; Isbir, T. Associations of -374T/A polymorphism of receptor for advanced glycation end products (RAGE) gene in Turkish diabetic and non-diabetic patients with coronary artery disease. In Vivo 2009, 23, 949–954. [Google Scholar]
- Lindholm, E.; Bakhtadze, E.; Cilio, C.; Agardh, E.; Groop, L.; Agardh, C.-D. Association between LTA, TNF and AGER Polymorphisms and Late Diabetic Complications. PLoS ONE 2008, 3, e2546. [Google Scholar] [CrossRef]
- Liu, L.; Qiu, X.-B. Association between the receptor for advanced glycation end products gene polymorphisms and coronary artery disease. Mol. Biol. Rep. 2013, 40, 6097–6105. [Google Scholar] [CrossRef]
- Ng, Z.X.; Kuppusamy, U.R.; Tajunisah, I.; Fong, K.C.S.; Chua, K.H. Association analysis of −429T/C and −374T/A polymorphisms of receptor of advanced glycation end products (RAGE) gene in Malaysian with type 2 diabetic retinopathy. Diabetes Res. Clin. Pract. 2012, 95, 372–377. [Google Scholar] [CrossRef]
- Niu, W.; Qi, Y.; Wu, Z.; Liu, Y.; Zhu, D.; Jin, W. A meta-analysis of receptor for advanced glycation end products gene: Four well-evaluated polymorphisms with diabetes mellitus. Mol. Cell. Endocrinol. 2012, 358, 9–17. [Google Scholar] [CrossRef]
- Kang, P.; Tian, C.; Jia, C. Association of RAGE gene polymorphisms with type 2 diabetes mellitus, diabetic retinopathy and diabetic nephropathy. Gene 2012, 500, 1–9. [Google Scholar] [CrossRef]
- Qayyum, S.; Afzal, M.; Naveed, A.K. Association analysis of 374T/A (rs1800624) receptor for advanced glycation end-products (RAGE) gene polymorphism with diabetic retinopathy in Pakistani patients. Pak. J. Med. Sci. 2021, 37, 733–739. [Google Scholar] [CrossRef] [PubMed]
- Ahuja, P.; Waris, A.; Siddiqui, S.S.; Mukherjee, A. Single nucleotide variants of receptor for advanced glycation end-products (AGER) gene: Is it a new opening in the risk assessment of diabetic retinopathy?—A review. J. Genet. Eng. Biotechnol. 2022, 20, 17. [Google Scholar] [CrossRef] [PubMed]
- Gaens, K.H.J.; Ferreira, I.; Van Der Kallen, C.J.H.; Van Greevenbroek, M.M.J.; Blaak, E.E.; Feskens, E.; Dekker, J.M.; Nijpels, G.; Heine, R.J.; Hart, L.; et al. Association of Polymorphism in the Receptor for Advanced Glycation End Products (RAGE) Gene with Circulating RAGE Levels. J. Clin. Endocrinol. Metab. 2009, 94, 5174–5180. [Google Scholar] [CrossRef] [PubMed]
- Slager, S.; Schaid, D. Case-Control Studies of Genetic Markers: Power and Sample Size Approximations for Armitage’s Test for Trend. Hum. Hered. 2001, 52, 149–153. [Google Scholar] [CrossRef]
- Schane, R.E.; Ling, P.M.; Glantz, S.A. Health Effects of Light and Intermittent Smoking. Circulation 2010, 121, 1518–1522. [Google Scholar] [CrossRef]
- Martín, J.V.; González, M.J.; Galán, I. Aspectos metodológicos en la medición del consumo de alcohol: La importancia de los patrones de consumo [Methodological issues in the measurement of alcohol consumption: The importance of drinking patterns]. Rev. Esp. Salud Pública 2014, 88, 433–446. [Google Scholar] [CrossRef]
- Rosas, J.; González, A.; Aschner, P.; Bastarrachea, R.; Sinay, I.; Gil, J.C.; de Loredo, L.; Ramos, O.; Lúquez, H.; da Silva Filho, R.L.; et al. Epidemiología, Diagnóstico, Control, Prevención y Tratamiento del Síndrome Metabólico en Adultos. Consenso Latinoam. Asoc. Latinoam. Diabetes 2010, 8, 25–44. [Google Scholar]
- Serveaux-Dancer, M.; Jabaudon, M.; Creveaux, I.; Belville, C.; Blondonnet, R.; Gross, C.; Constantin, J.-M.; Blanchon, L.; Sapin, V. Pathological Implications of Receptor for Advanced Glycation End-Product (AGER) Gene Polymorphism. Dis. Markers 2019, 2019, 2067353. [Google Scholar] [CrossRef]
- Pettersson-Fernholm, K.; Forsblom, C.; Hudson, B.I.; Perola, M.; Grant, P.J.; Groop, P.-H.; for the FinnDiane Study Group. The Functional −374 T/A RAGE Gene Polymorphism Is Associated with Proteinuria and Cardiovascular Disease in Type 1 Diabetic Patients. Diabetes 2003, 52, 891–894. [Google Scholar] [CrossRef]
- Dos Santos, K.G.; Canani, L.H.; Gross, J.L.; Tschiedel, B.; Souto, K.E.P.; Roisenberg, I. The −374A allele of the receptor for advanced glycation end products gene is associated with a decreased risk of ischemic heart disease in African-Brazilians with type 2 diabetes. Mol. Genet. Metab. 2005, 85, 149–156. [Google Scholar] [CrossRef]
- Engelen, L.; Ferreira, I.; Gaens, K.H.; Henry, R.M.; Dekker, J.M.; Nijpels, G.; Heine, R.J.; Hart, L.M.; van Greevenbroek, M.M.; van der Kallen, C.J.; et al. The association between the −374T/A polymorphism of the receptor for advanced glycation endproducts gene and blood pressure and arterial stiffness is modified by glucose metabolism status: The Hoorn and CoDAM studies. J. Hypertens. 2010, 28, 285–293. [Google Scholar] [CrossRef]
- Boor, P.; Celec, P.; Klenovicsová, K.; Vlková, B.; Szemes, T.; Minárik, G.; Turňa, J.; Šebeková, K. Association of biochemical parameters and RAGE gene polymorphisms in healthy infants and their mothers. Clin. Chim. Acta 2010, 411, 1034–1040. [Google Scholar] [CrossRef]
- Wang, Y.; Zhang, W.; Zhao, H.; Wang, Y.; Lu, C.; Li, X.; Wang, Y.; Xiao, Y.; Wang, Y.; Wang, B. Fasting blood soluble RAGE may be causally implicated in impaired glucose metabolism in Chinese patients with primary hypertension. Gene 2018, 639, 11–17. [Google Scholar] [CrossRef]
- Mehta, R.; Shaw, G.; Masschelin, P.; Felix, S.; Otgonsuren, M.; Baranova, A.; Goodman, Z.; Younossi, Z. Polymorphisms in the receptor for advanced glycation end-products (RAGE) gene and circulating RAGE levels as a susceptibility factor for non-alcoholic steatohepatitis (NASH). PLoS ONE 2018, 13, e0199294. [Google Scholar] [CrossRef]
- Kankova, K.; Benes, P.; Kuchrickova, S. Functional Analysis of the Common Haplotype in the Receptor for Advanced Glycation End-Products Gene Previously Identified as a Susceptibility Factor for Diabetic Nephropathy. Exp. Clin. Endocrinol. Diabetes 2010, 118, 93–95. [Google Scholar] [CrossRef]
- Pradhan, A.D. Sex Differences in the Metabolic Syndrome: Implications for Cardiovascular Health in Women. Clin. Chem. 2014, 60, 44–52. [Google Scholar] [CrossRef]
- Meyer, M.R.; Clegg, D.J.; Prossnitz, E.R.; Barton, M. Obesity, insulin resistance and diabetes: Sex differences and role of oestrogen receptors. Acta Physiol. 2011, 203, 259–269. [Google Scholar] [CrossRef]
- Rochlani, Y.; Pothineni, N.V.; Mehta, J.L. Metabolic Syndrome: Does It Differ between Women and Men? Cardiovasc. Drugs Ther. 2015, 29, 329–338. [Google Scholar] [CrossRef]
- Tanaka, N.; Yonekura, H.; Yamagishi, S.-I.; Fujimori, H.; Yamamoto, Y.; Yamamoto, H. The Receptor for Advanced Glycation End Products Is Induced by the Glycation Products Themselves and Tumor Necrosis Factor-α through Nuclear Factor-κB, and by 17β-Estradiol through Sp-1 in Human Vascular Endothelial Cells. J. Biol. Chem. 2000, 275, 25781–25790. [Google Scholar] [CrossRef]
- Jackson, S.; James, M.; Abrams, P. The effect of oestradiol on vaginal collagen metabolism in postmenopausal women with genuine stress incontinence. BJOG 2002, 109, 339–344. [Google Scholar] [CrossRef]
- Brand, J.S.; Van Der Tweel, I.; Grobbee, D.E.; Emmelot-Vonk, M.H.; Van Der Schouw, Y.T. Testosterone, sex hormone-binding globulin and the metabolic syndrome: A systematic review and meta-analysis of observational studies. Leuk. Res. 2011, 40, 189–207. [Google Scholar] [CrossRef] [PubMed]
- Kupelian, V.; Hayes, F.J.; Link, C.L.; Rosen, R.; McKinlay, J.B. Inverse Association of Testosterone and the Metabolic Syndrome in Men Is Consistent across Race and Ethnic Groups. J. Clin. Endocrinol. Metab. 2008, 93, 3403–3410. [Google Scholar] [CrossRef] [PubMed]
- Ter Horst, R.; Munckhof, I.C.V.D.; Schraa, K.; Aguirre-Gamboa, R.; Jaeger, M.; Smeekens, S.P.; Brand, T.; Lemmers, H.; Dijkstra, H.; Galesloot, T.E.; et al. Sex-Specific Regulation of Inflammation and Metabolic Syndrome in Obesity. Arterioscler. Thromb. Vasc. Biol. 2020, 40, 1787–1800. [Google Scholar] [CrossRef] [PubMed]
- Goulart, A.; Germer, S.; Rexrode, K.; Martin, M.; Zee, R. Polymorphisms in advanced glycosylation end product-specific receptor (AGER) gene, insulin resistance, and type 2 diabetes mellitus. Clin. Chim. Acta 2008, 398, 95–98. [Google Scholar] [CrossRef] [PubMed]
- Zee, R.Y.; Romero, J.R.; Gould, J.L.; Ricupero, D.A.; Ridker, P.M. Polymorphisms in the Advanced Glycosylation End Product–Specific Receptor Gene and Risk of Incident Myocardial Infarction or Ischemic Stroke. Stroke 2006, 37, 1686–1690. [Google Scholar] [CrossRef]
- Martínez-Cortés, G.; Salazar-Flores, J.; Fernández-Rodríguez, L.G.; Castellanos, R.R.; Rodríguez-Loya, C.; Velarde-Félix, J.S.; Muñoz-Valle, J.F.; Parra-Rojas, I.; Rangel-Villalobos, H. Admixture and population structure in Mexican-Mestizos based on paternal lineages. J. Hum. Genet. 2012, 57, 568–574. [Google Scholar] [CrossRef]
- Colhoun, H.M.; McKeigue, P.M.; Smith, G.D. Problems of reporting genetic associations with complex outcomes. Lancet 2003, 361, 865–872. [Google Scholar] [CrossRef]
- Cheng, H.; Zhu, W.; Zhu, M.; Sun, Y.; Sun, X.; Jia, D.; Yang, C.; Yu, H.; Zhang, C. Susceptibility of six polymorphisms in the receptor for advanced glycation end products to type 2 diabetes: A systematic review and meta-analysis. Endocr. J. 2021, 68, 993–1010. [Google Scholar] [CrossRef]
- De Villiers, C.B.; Kroese, M.; Moorthie, S. Understanding polygenic models, their development and the potential application of polygenic scores in healthcare. J. Med. Genet. 2020, 57, 725–732. [Google Scholar] [CrossRef]
- Selvin, E.; Halushka, M.K.; Rawlings, A.M.; Hoogeveen, R.C.; Ballantyne, C.M.; Coresh, J.; Astor, B.C. sRAGE and Risk of Diabetes, Cardiovascular Disease, and Death. Diabetes 2013, 62, 2116–2121. [Google Scholar] [CrossRef]
- Hudson, B.I.; Dong, C.; Gardener, H.; Elkind, M.S.; Wright, C.B.; Goldberg, R.; Sacco, R.L.; Rundek, T. Serum levels of soluble receptor for advanced glycation end-products and metabolic syndrome: The Northern Manhattan Study. Metabolism 2014, 63, 1125–1130. [Google Scholar] [CrossRef]
- Sakurai, S.; Yamamoto, Y.; Tamei, H.; Matsuki, H.; Obata, K.-I.; Hui, L.; Miura, J.; Osawa, M.; Uchigata, Y.; Iwamoto, Y.; et al. Development of an ELISA for esRAGE and its application to type 1 diabetic patients. Diabetes Res. Clin. Pract. 2006, 73, 158–165. [Google Scholar] [CrossRef]
- Yonekura, H.; Yamamoto, Y.; Sakurai, S.; Petrova, R.G.; Abedin, M.J.; Li, H.; Yasui, K.; Takeuchi, M.; Makita, Z.; Takasawa, S.; et al. Novel splice variants of the receptor for advanced glycation end-products expressed in human vascular endothelial cells and pericytes, and their putative roles in diabetes-induced vascular injury. Biochem. J. 2003, 370, 1097–1109. [Google Scholar] [CrossRef]
- Prasad, K.; Mishra, M. AGE-RAGE Stress, Stressors, and Antistressors in Health and Disease. Int. J. Angiol. 2018, 27, 1–12. [Google Scholar] [CrossRef]


| Variables | Non-MS Group n = 80 Median (IQR) | Metabolic Syndrome Group n = 80 Median (IQR) | p |
|---|---|---|---|
| Age (years) | 34.50 (9.5) | 37.00 (10.0) | 0.008 |
| BMI (kg/m2) | 23.87 (2.9) | 29.80 (5.0) | <0.001 |
| Waist circumference (cm) | 84.90 (7.2) | 100.75 (10.3) | <0.001 |
| SBP (mmHg) | 109.00 (15.5) | 126.00 (18.0) | <0.001 |
| DBP (mmHg) | 72.00 (10.0) | 79.50 (12.0) | <0.001 |
| Creatinine (mg/dL) | 1.00 (0.2) | 1.10 (0.2) | 0.249 |
| Glucose (mg/dL) | 90.00 (16.5) | 106.00 (13.5) | <0.001 |
| Triglycerides (mg/dL) | 85.50 (48.5) | 208.00 (113.0) | <0.001 |
| HDL-C (mg/dL) | 47.00 (10.0) | 33.00 (7.0) | <0.001 |
| sRAGE (pg/mL) | 1883.90 (955.5) | 1989.21 (1156.4) | 0.137 |
| SNP | Alleles | Non-MS Group | MS Group | p | Genotypes | Non-MS Group | MS Group | p | ||||
|---|---|---|---|---|---|---|---|---|---|---|---|---|
| n | % | n | % | n | % | n | % | |||||
| −374 T/A | T | 122 | 76 | 115 | 73 | 0.48 | TT | 45 | 56 | 42 | 53 | 0.57 |
| A | 38 | 24 | 43 | 27 | TA | 32 | 40 | 31 | 39 | |||
| AA | 3 | 3.8 | 6 | 7.6 | ||||||||
| −429 T/C | T | 141 | 88 | 146 | 91 | 0.36 | TT | 62 | 78 | 67 | 84 | 0.59 |
| C | 19 | 12 | 14 | 8.8 | TC | 17 | 21 | 12 | 15 | |||
| CC | 1 | 1.3 | 1 | 1.3 | ||||||||
| Non-MS Group | MS Group | |||||||||||||
|---|---|---|---|---|---|---|---|---|---|---|---|---|---|---|
| TT | TA | AA | p | TT | TA | AA | p | |||||||
| n = 45 | n = 32 | n = 3 | n = 42 | n = 31 | n = 6 | |||||||||
| Median | (IQR) | Median | (IQR) | Median | (IQR) | Median | (IQR) | Median | (IQR) | Median | (IQR) | |||
| Age (years) | 33.00 | (9.00) | 36.50 | (10.50) | 33.00 | (16.0) | 0.66 | 37.00 | (10.00) | 39.00 | (9.00) | 36.00 | (5.00) | 0.74 |
| WC (cm) | 84.50 | (9.40) | 85.10 | (6.00) | 87.50 | (17.1) | 0.64 | 100.50 | (12.30) | 101.10 | (11.50) | 98.75 | (5.50) | 0.67 |
| BMI (kg/m2) | 23.86 | (3.50) | 23.87 | (2.80) | 25.22 | (5.2) | 0.56 | 29.27 | (5.20) | 30.10 | (5.60) | 29.32 | (2.30) | 0.84 |
| SBP (mg/dL) | 110.00 | (19.00) | 107.50 | (13.00) | 99.67 | (27.0) | 0.22 | 125.00 | (19.00) | 132.00 | (20.00) | 124.50 | (4.00) | 0.52 |
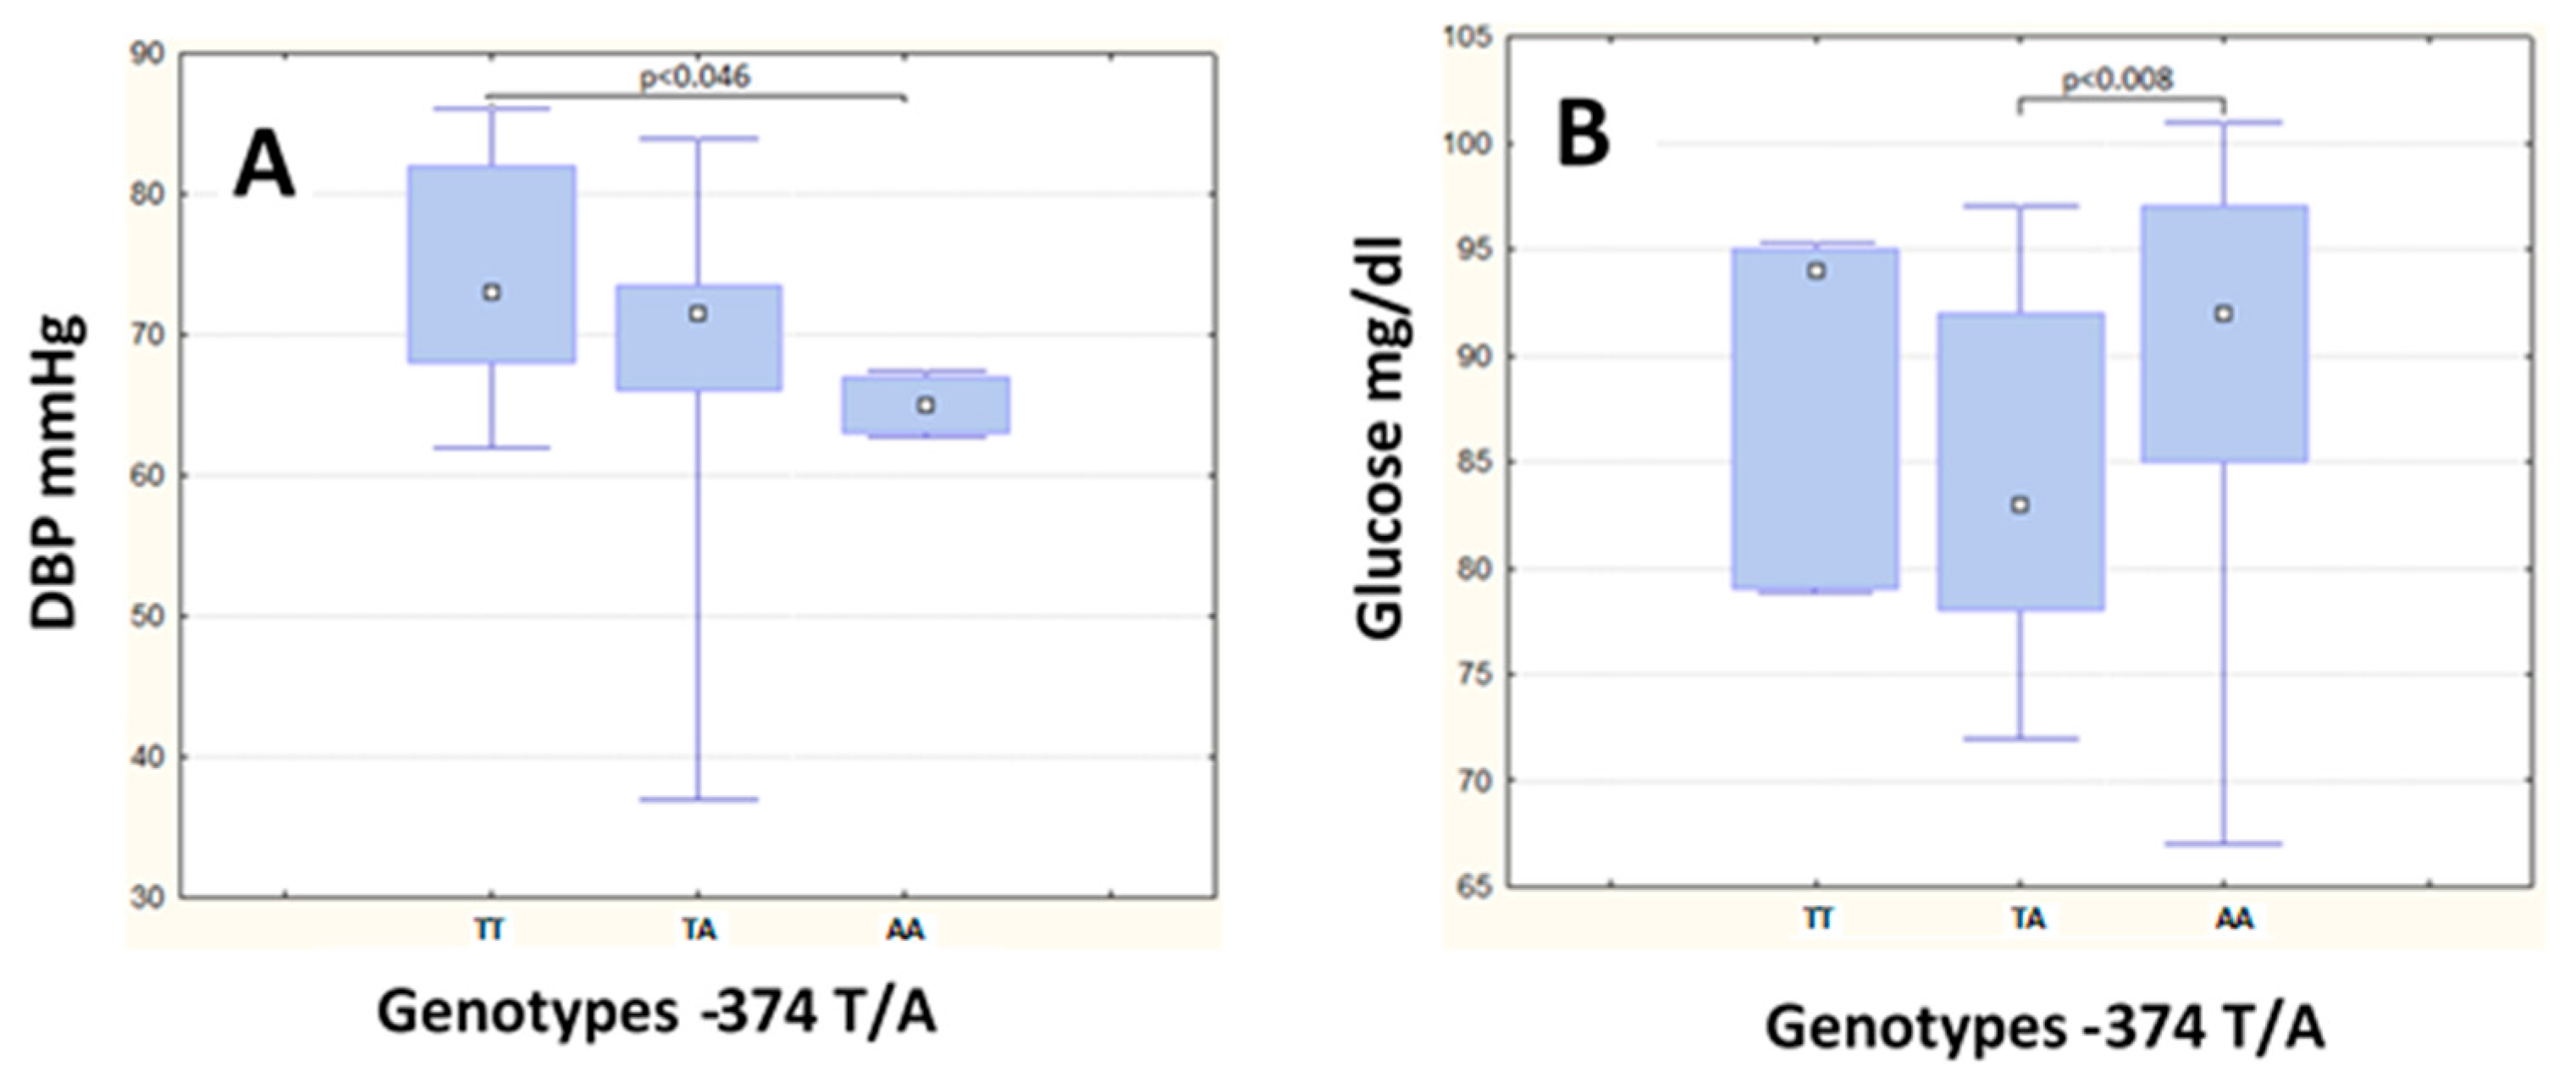
| DBP (mg/dL) | 73.00 | (14.00) | 71.50 | (7.50) | 65.00 | (4.0) | 0.008 a | 79.00 | (14.00) | 84.00 | (10.00) | 75.00 | (12.00) | 0.24 |
| Glucose (mg/dL) | 92.00 | (12.00) | 83.00 | (14.00) | 94.00 | (16.0) | 0.01 b | 107.00 | (14.00) | 105.00 | (10.00) | 107.00 | (17.00) | 0.88 |
| Creatinine (mg/dL) | 1.00 | (0.20) | 1.05 | (0.20) | 1.00 | (0.3) | 0.43 | 1.05 | (0.20) | 1.10 | (0.30) | 1.15 | (0.60) | 0.57 |
| Triglycerides (mg/dL) | 93.00 | (50.00) | 82.50 | (46.00) | 64.00 | (70.0) | 0.34 | 203.00 c | (88.00) | 228.00 | (162.00) | 170.50 | (28.00) | 0.16 |
| HDL-C (mg/dL) | 47.00 | (11.00) | 46.00 | (10.50) | 51.00 | (15.0) | 0.22 | 32.00 | (6.00) | 34.00 | (7.00) | 32.00 | (6.00) | 0.13 |
| sRAGE (pg/mL) | 1919.48 d | (1020.60) | 1694.63 | (895.60) | 2645.47 | (1809) | 0.48 | 1989.21 | (1311.00) | 2222.37 | (1240.60) | 1924.14 | (1020.20) | 0.67 |
| Non-MS Group | MS Group | |||||||||
|---|---|---|---|---|---|---|---|---|---|---|
| TT | TC | p | TT | TC | p | |||||
| n = 62 | n = 17 | n = 67 | n = 12 | |||||||
| Median | (IQR) | Median | (IQR) | Median | (IQR) | Median | (IQR) | |||
| Age (years) | 33.00 | (8.00) | 38.00 | (10.00) | 0.06 | 37.00 | (10.00) | 40.00 | (10.00) | 0.77 |
| WC (cm) | 84.75 | (7.10) | 86.30 | (7.10) | 0.25 | 101.00 | (10.50) | 101.50 | (11.40) | 0.35 |
| BMI (kg/m2) | 23.87 | (2.80) | 23.49 | (2.60) | 0.53 | 29.45 | (5.00) | 32.41 | (5.60) | 0.08 |
| SBP (mg/dL) | 109.00 | (16.00) | 110.00 | (15.00) | 0.75 | 129.00 | (17.00) | 120.50 | (14.50) | 0.19 |
| DBP (mg/dL) | 73.00 | (11.00) | 71.00 | (6.00) | 0.70 | 80.00 | (12.00) | 80.00 | (9.50) | 0.82 |
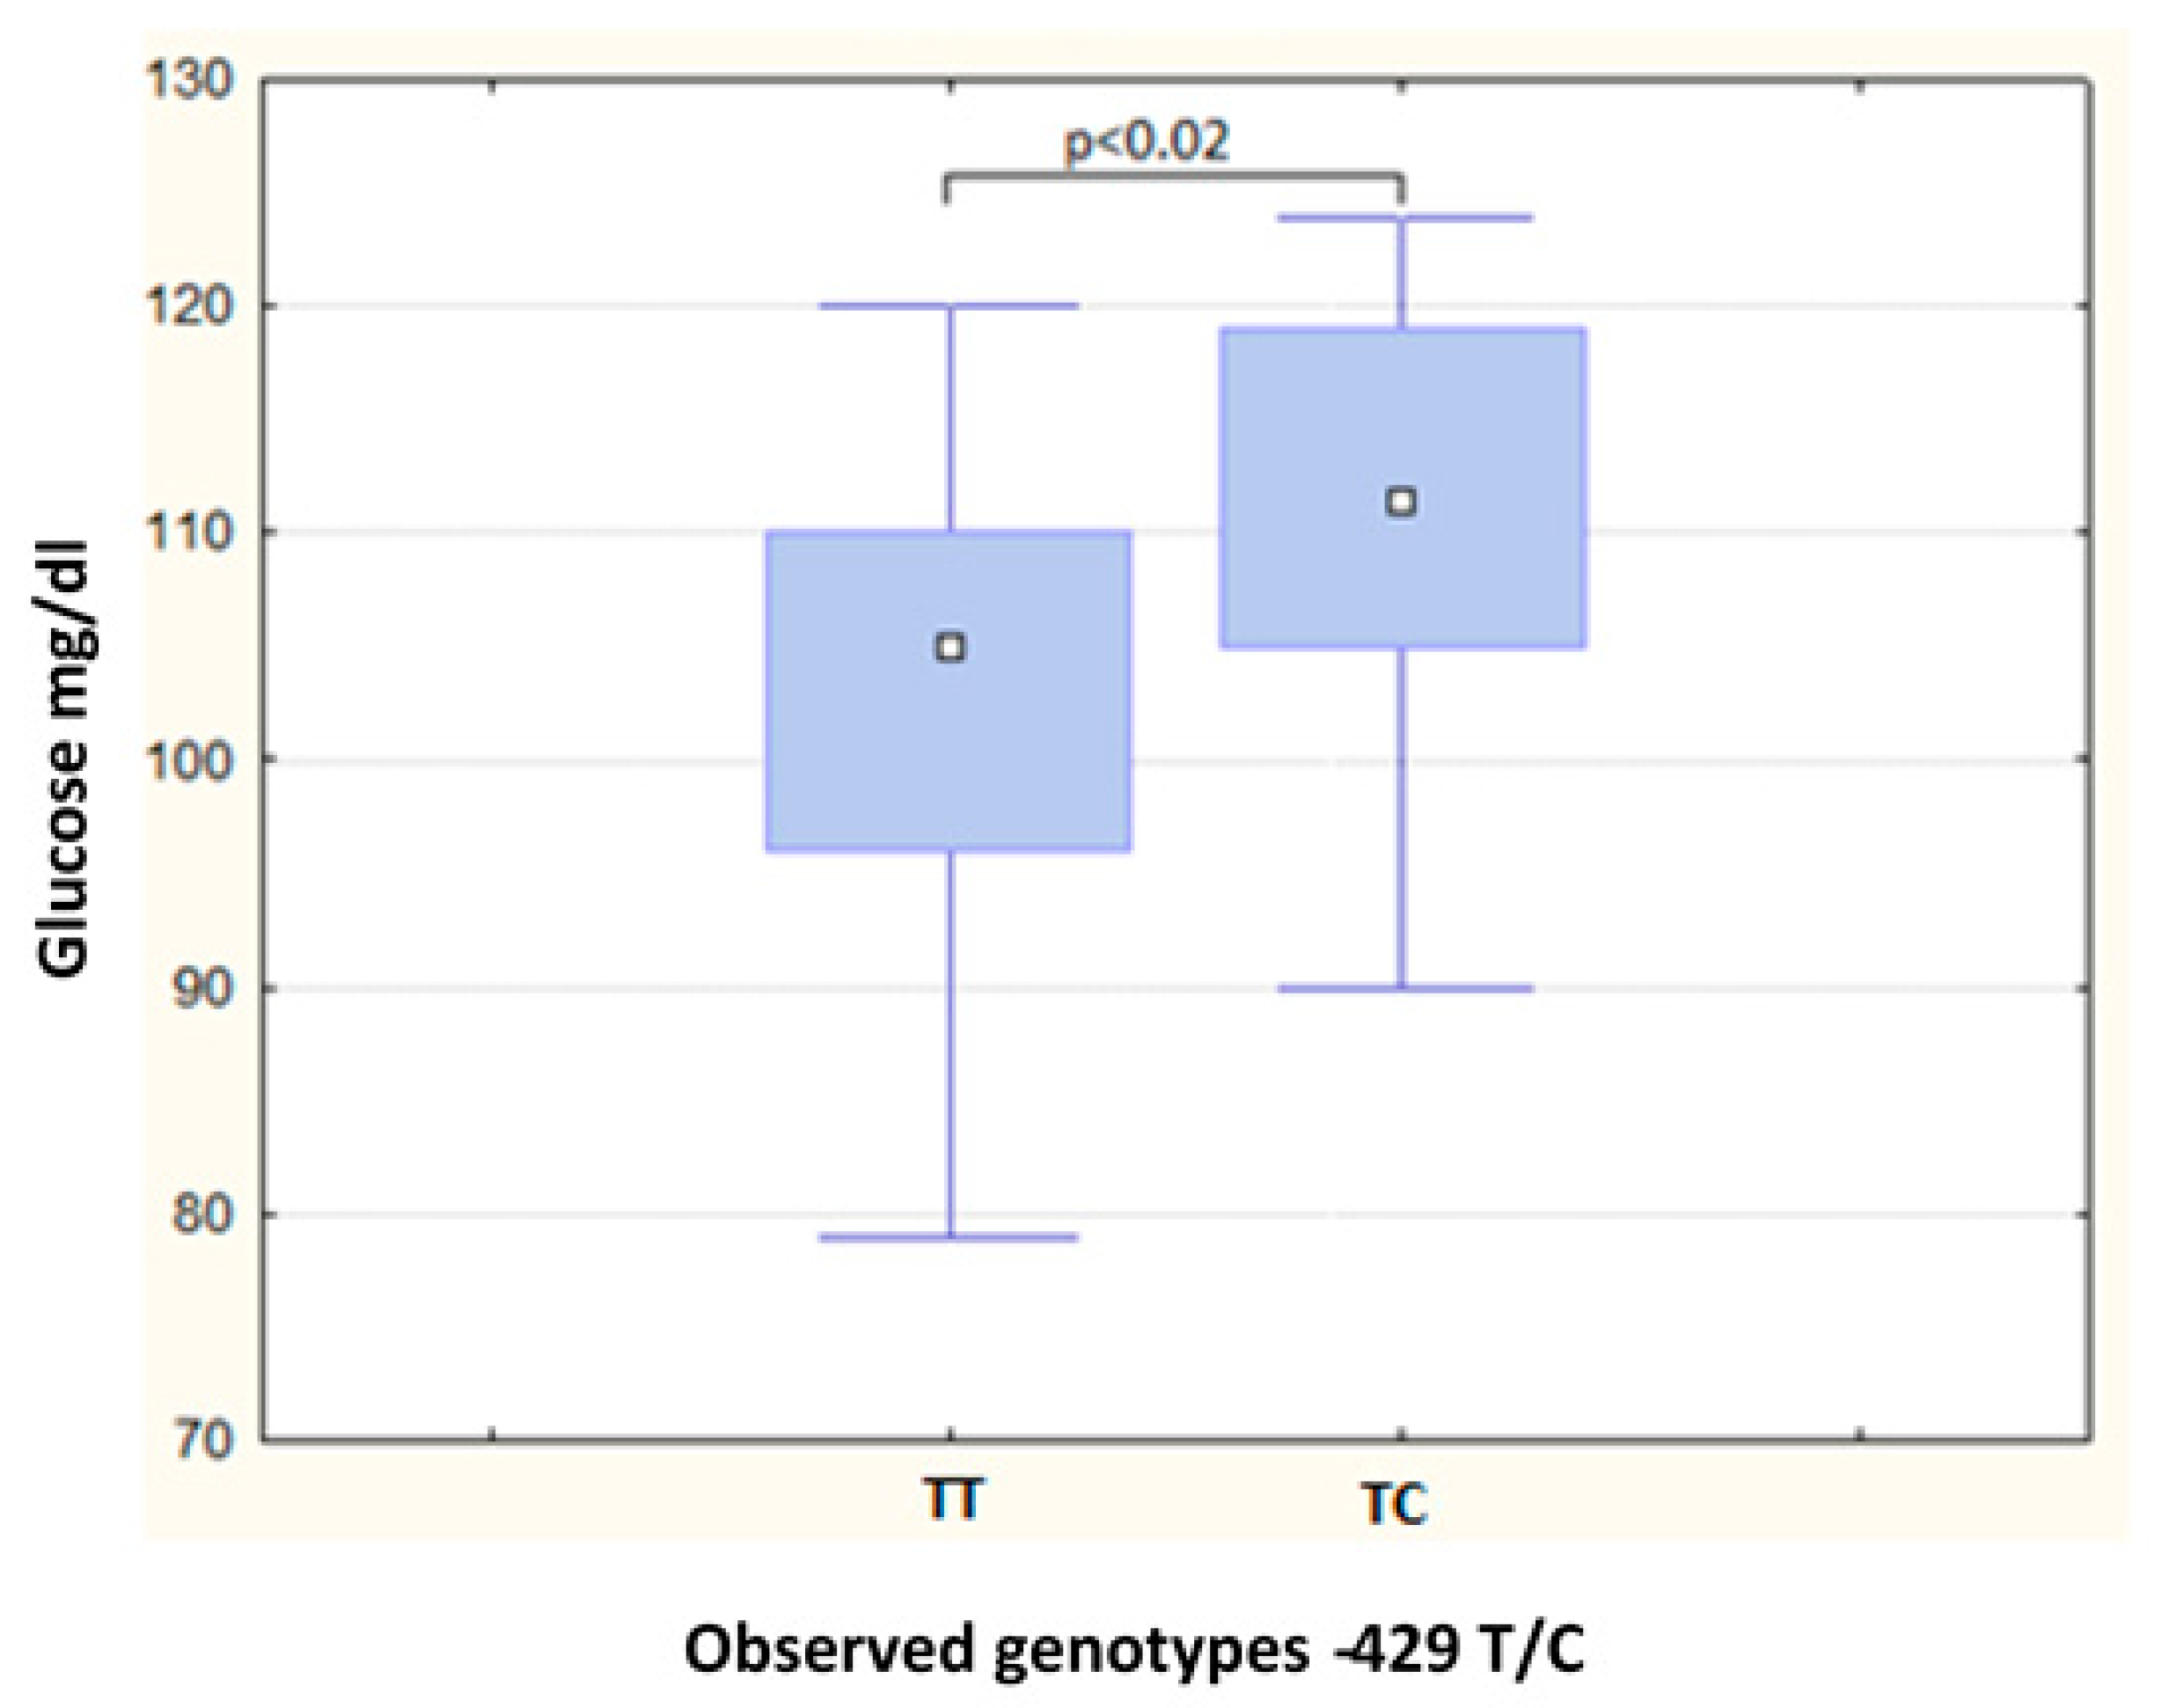
| Glucose (mg/dL) | 87.50 | (16.00) | 91.00 | (14.00) | 0.52 | 105.00 | (14.00) | 111.50 | (14.00) | 0.02 a |
| Creatinine (mg/dL) | 1.00 | (0.20) | 1.00 | (0.20) | 0.42 | 1.10 | (0.20) | 1.10 | (0.20) | 0.36 |
| Triglycerides (mg/dL) | 89.50 | (50.00) | 80.00 | (40.00) | 0.90 | 203.00 | (115.00) | 210.00 b | (63.00) | 0.84 |
| HDL-C (mg/dL) | 47.00 | (11.00) | 49.00 | (12.00) | 0.63 | 33.00 | (6.00) | 30.50 | (10.00) | 0.17 |
| sRAGE (pg/mL) | 1859.43 c | (999.80) | 1919.48 | (767.10) | 0.80 | 2013.04 | (1278.00) | 1805.00 | (695.10) | 0.35 |
| Haplotype | Frequency | Ratios MS, Non-MS | X2 | p |
|---|---|---|---|---|
| TT | 0.642 | 102.4:57.6, 103.0:57.0 | 0.004 | 0.95 |
| AT | 0.255 | 43.6:116.4, 38.0:122.0 | 0.51 | 0.48 |
| TC | 0.103 | 14.0:146.0, 19.0:141.0 | 0.845 | 0.36 |
Disclaimer/Publisher’s Note: The statements, opinions and data contained in all publications are solely those of the individual author(s) and contributor(s) and not of MDPI and/or the editor(s). MDPI and/or the editor(s) disclaim responsibility for any injury to people or property resulting from any ideas, methods, instructions or products referred to in the content. |
© 2023 by the authors. Licensee MDPI, Basel, Switzerland. This article is an open access article distributed under the terms and conditions of the Creative Commons Attribution (CC BY) license (https://creativecommons.org/licenses/by/4.0/).
Share and Cite
González-Guerrero, D.E.; Lazo-de-la-Vega-Monroy, M.-L.; Gómez-Ojeda, A.; Luévano-Contreras, C.; Rojas-Rubio, A.; Garay-Sevilla, M.E. Polymorphisms −374 T/A and −429 T/C of the Receptor for Advanced Glycation End-Products (RAGE) and Serum Levels of RAGE (sRAGE) Are Not Associated with Metabolic Syndrome. Metabolites 2023, 13, 521. https://doi.org/10.3390/metabo13040521
González-Guerrero DE, Lazo-de-la-Vega-Monroy M-L, Gómez-Ojeda A, Luévano-Contreras C, Rojas-Rubio A, Garay-Sevilla ME. Polymorphisms −374 T/A and −429 T/C of the Receptor for Advanced Glycation End-Products (RAGE) and Serum Levels of RAGE (sRAGE) Are Not Associated with Metabolic Syndrome. Metabolites. 2023; 13(4):521. https://doi.org/10.3390/metabo13040521
Chicago/Turabian StyleGonzález-Guerrero, Diana Elizabeth, Maria-Luisa Lazo-de-la-Vega-Monroy, Armando Gómez-Ojeda, Claudia Luévano-Contreras, Armando Rojas-Rubio, and Ma. Eugenia Garay-Sevilla. 2023. "Polymorphisms −374 T/A and −429 T/C of the Receptor for Advanced Glycation End-Products (RAGE) and Serum Levels of RAGE (sRAGE) Are Not Associated with Metabolic Syndrome" Metabolites 13, no. 4: 521. https://doi.org/10.3390/metabo13040521