
The Effect of 75 Grams of Glucose during OGTT on Plasma Markers of Lipid and Lipoprotein Peroxidation, Oxidized LDL and Thiobarbituric Acid Reactive Substances, in People with Increased Body Mass
 , ,
, ,
Abstract
:1. Introduction and Aims
2. Material and Methods
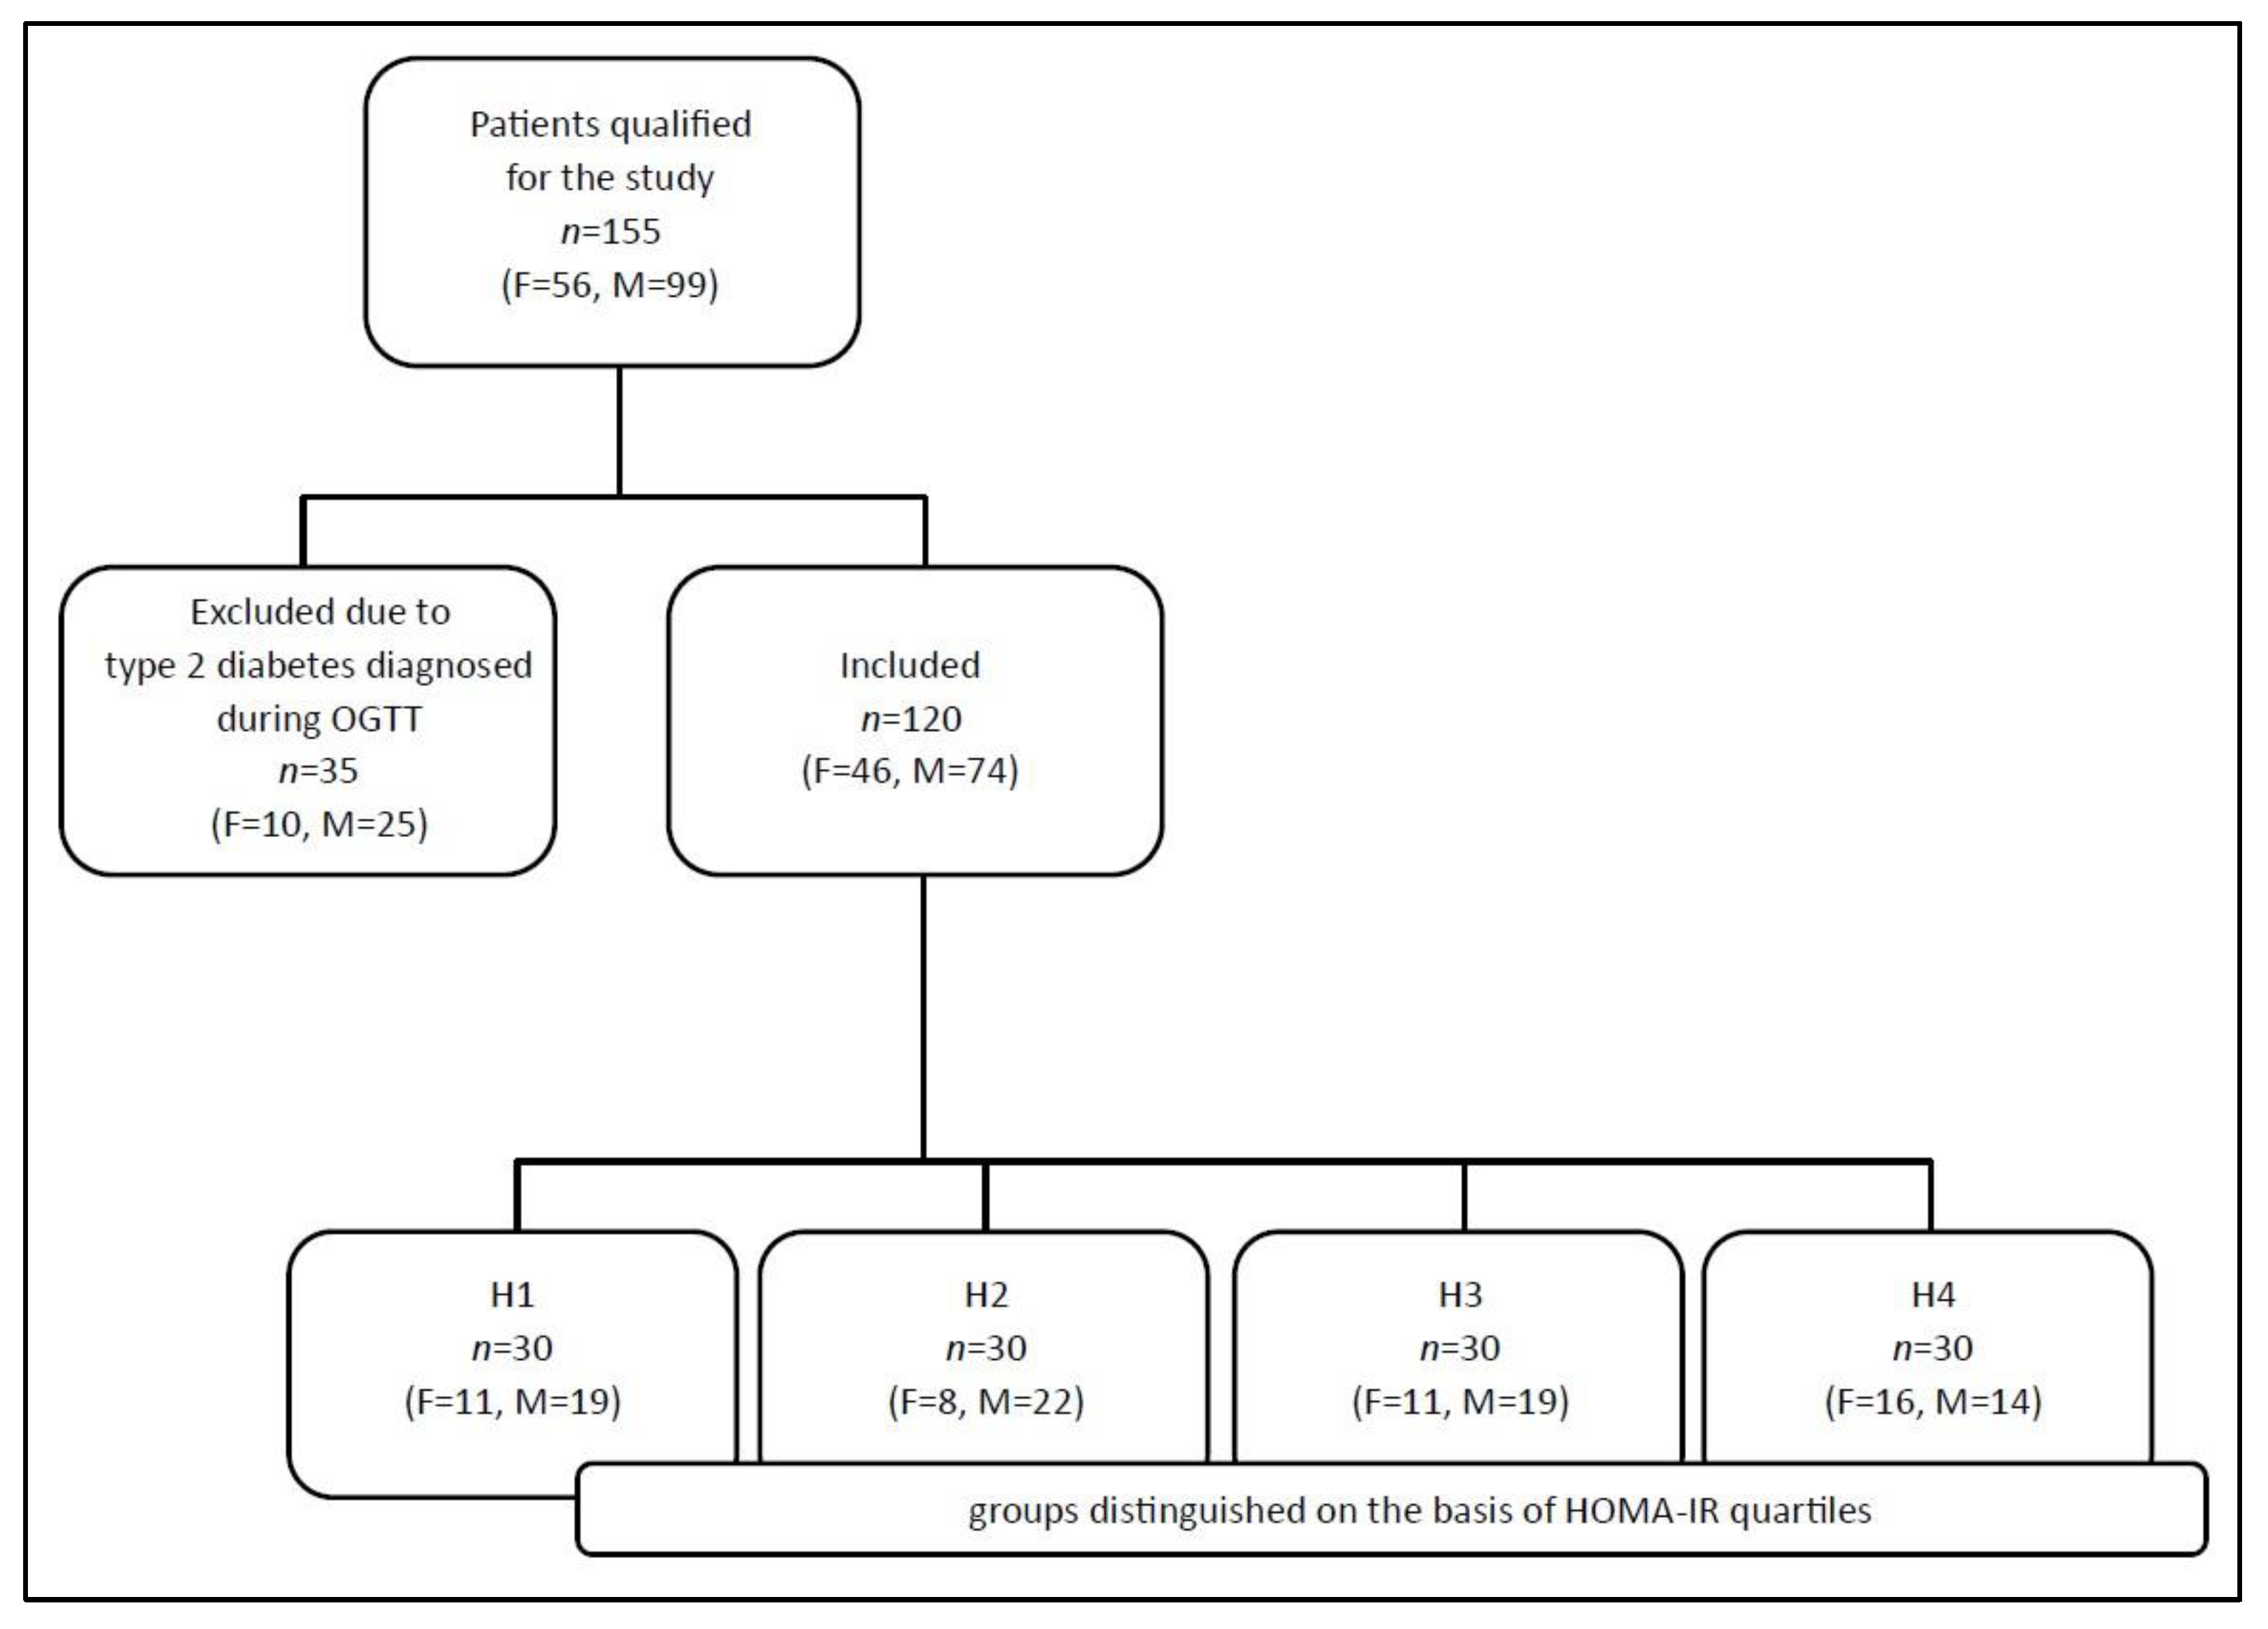
2.1. Study Population
2.2. Measurements and Analysis
2.3. Statistical Methods
3. Results
4. Discussion
5. Limitations and Strength
6. Conclusions
Author Contributions
Funding
Institutional Review Board Statement
Informed Consent Statement
Data Availability Statement
Conflicts of Interest
References
- World Health Organization. Obesity and Overweight. Available online: https://www.who.int/news-room/fact-sheets/detail/obesity-and-overweight (accessed on 10 January 2022).
- Chooi, Y.C.; Ding, C.; Magkos, F. The epidemiology of obesity. Metab. Clin. Exp. 2019, 92, 6–10. [Google Scholar] [CrossRef] [PubMed] [Green Version]
- Czerska, M.; Mikołajewska, K.; Zieliński, M.; Gromadzińska, J.; Wąsowicz, W. Today’s oxidative stress markers. Med. Pr. 2015, 66, 393–405. [Google Scholar] [CrossRef] [PubMed]
- Bartosz, G. Druga Twarz Tlenu. Wolne Rodniki w Przyrodzie; Wydawnictwo Naukowe PWN: Warsaw, Poland, 2008; pp. 29, 99–109, 208–214. [Google Scholar]
- Tai, W.-Y.; Yang, Y.-C.; Lin, H.-J.; Huang, C.-P.; Cheng, Y.-L.; Chen, M.-F.; Yen, H.-L.; Liau, I. Interplay between Structure and Fluidity of Model Lipid Membranes under Oxidative Attack. J. Phys. Chem. B 2010, 114, 15642–15649. [Google Scholar] [CrossRef] [PubMed]
- Jiang, H.; Zhou, Y.; Nabavi, S.M.; Sahebkar, A.; Little, P.J.; Xu, S.; Weng, J.; Ge, J. Mechanisms of oxidized LDL-mediated endothelial dysfunction and its consequences for the development of atherosclerosis. Front. Cardiovasc. Med. 2022, 9, 925923. [Google Scholar] [CrossRef]
- Summerhill, V.I.; Grechko, A.V.; Yet, S.-F.; Sobenin, I.A.; Orekhov, A.N. The atherogenic role of circulating modified lipids in atherosclerosis. Int. J. Mol. Sci. 2019, 20, 3561. [Google Scholar] [CrossRef] [Green Version]
- Suruga, K.; Miyoshi, T.; Kotani, K.; Ichikawa, K.; Miki, T.; Osawa, K.; Ejiri, K.; Toda, H.; Nakamura, K.; Morita, H.; et al. Higher oxidized high-density lipoprotein to apolipoprotein A-I ratio is associated with high-risk coronary plaque characteristics determined by CT angiography. Int. J. Cardiol. 2021, 1, 193–198. [Google Scholar] [CrossRef]
- Peterson, S.J.; Shapiro, J.I.; Thompson, E.; Singh, S.; Liu, L.; Weingarten, J.A.; O’Hanlon, K.; Bialczak, A.; Bhesania, S.R.; Abraham, N.G. Oxidized HDL, adipokines, and endothelial dysfunction: A potential biomarker profile for cardiovascular risk in women with obesity. Obesity 2019, 27, 87–93. [Google Scholar] [CrossRef] [Green Version]
- He, L.; He, T.; Farrar, S.; Ji, L.; Liu, T.; Ma, X. Antioxidants maintain cellular redox homeostasis by elimination of reactive oxygen species. Cell. Physiol. Biochem. 2017, 44, 532–553. [Google Scholar] [CrossRef]
- Gayoso-Diz, P.; Otero-González, A.; Rodriguez-Alvarez, M.X.; Gude, F.; García, F.; De Francisco, A.; Quintela, A.G. Insulin resistance (HOMA-IR) cut-off values and the metabolic syndrome in a general adult population: Effect of gender and age: EPIRCE cross-sectional study. BMC Endocr. Disord. 2013, 13, 47. [Google Scholar] [CrossRef] [Green Version]
- Tang, Q.; Li, X.; Song, P.; Xu, L. Optimal cut-off values for the homeostasis model assessment of insulin resistance (HOMA-IR) and pre-diabetes screening: Developments in research and prospects for the future. Drug Discov. Ther. 2015, 9, 380–385. [Google Scholar] [CrossRef] [Green Version]
- Ohkawa, H.; Ohishi, N.; Yagi, K. Assay for lipid peroxides in animal tissues by thiobarbituric acid reaction. Anal. Biochem. 1979, 95, 351–358. [Google Scholar] [CrossRef] [PubMed]
- Holvoet, P.; Macy, E.; Landeloos, M.; Jones, D.; Nancy, J.S.; Van De Werf, F.; Tracy, R.P. Analytical performance and diagnostic accuracy of immunometric assays for the measurement of circulating oxidized LDL. Clin. Chem. 2006, 52, 760–764. [Google Scholar] [CrossRef] [PubMed]
- Boullier, A.; Bird, D.A.; Chang, M.-K.; Dennis, E.A.; Friedman, P.; Gillotte-Taylor, K.; Hörkkö, S.; Palinski, W.; Quehenberger, O.; Shaw, P.; et al. Scavenger receptors, oxidized LDL, and atherosclerosis. Ann. N. Y. Acad. Sci. 2001, 947, 214–222. [Google Scholar] [CrossRef] [PubMed]
- Murphy, J.E.; Tedbury, P.R.; Homer-Vanniasinkam, S.; Walker, J.H.; Ponnambalam, S. Biochemistry and cell biology of mammalian scavenger receptors. Atherosclerosis 2005, 182, 1–15. [Google Scholar] [CrossRef]
- Liguori, I.; Russo, G.; Curcio, F.; Bulli, G.; Aran, L.; DELLA-Morte, D.; Gargiulo, G.; Testa, G.; Cacciatore, F.; Bonaduce, D.; et al. Oxidative stress, aging, and diseases. Clin. Interv. Aging. 2018, 13, 757–772. [Google Scholar] [CrossRef] [PubMed] [Green Version]
- Couillard, C.; Ruel, G.; Archer, W.R.; Pomerleau, S.; Bergeron, J.; Couture, P.; Lamarche, B.; Bergeron, N. Circulating levels of oxidative stress markers and endothelial adhesion molecules in men with abdominal obesity. J. Clin. Endocrinol. Metab. 2005, 90, 6454–6459. [Google Scholar] [CrossRef] [PubMed] [Green Version]
- Fayez, S.; Aziz, G.; Rehan, M. Insulin resistance is triggered by oxidative stress in mildly obese men. J. Am. Sci. 2010, 6, 604–611. [Google Scholar]
- Regnstrom, J.; Nilsson, J.; Tornvall, P.; Hamsten, A.; Landou, C. Susceptibility to low-density lipoprotein oxidation and coronary atherosclerosis in man. Lancet 1992, 339, 1183–1186. [Google Scholar] [CrossRef]
- Babiy, A.V.; Gebicki, J.M.; Sullivan, D.R.; Willey, K. Increased oxidizability of plasma lipoproteins in diabetic patients can be decreased by probucol therapy and is not due to glycation. Biochem. Pharmacol. 1992, 43, 995–1000. [Google Scholar] [CrossRef]
- Montes-Nieto, R.; Insenser, M.; Murri, M.; Fernández-Durán, E.; Ojeda-Ojeda, M.; Martínez-García, M.; Luque-Ramírez, M.; Escobar-Morreale, H.F. Plasma thiobarbituric acid reactive substances (TBARS) in young adults: Obesity increases fasting levels only in men whereas glucose ingestion, and not protein or lipid intake, increases postprandial concentrations regardless of sex and obesity. Mol. Nutr. Food Res. 2017, 61, 1700425. [Google Scholar] [CrossRef]
- Yildirim, T.; Göçmen, A.Y.; Özdemir, Z.T.; Börekci, E.; Turan, E.; Aral, Y. The effect of hyperglycemic peak induced by oral glucose tolerance test on the oxidant and antioxidant levels. Turk. J. Med. Sci. 2019, 49, 1742–1747. [Google Scholar] [CrossRef] [PubMed]
- Vincent, H.K.; Taylor, A.G. Biomarkers and potential mechanisms of obesity-induced oxidant stress in humans. Int. J. Obes. 2006, 30, 400–418. [Google Scholar] [CrossRef] [PubMed] [Green Version]
- Furukawa, S.; Fujita, T.; Shimabukuro, M.; Iwaki, M.; Yamada, Y.; Nakajima, Y.; Nakayama, O.; Makishima, M.; Matsuda, M.; Shimomura, I. Increased oxidative stress in obesity and its impact on metabolic syndrome. J. Clin. Investig. 2004, 114, 1752–1761. [Google Scholar] [CrossRef] [PubMed]
- Konukoğlu, D.; Serin, O.; Ercan, M.; Turhan, M.S. Plasma homocysteine levels in obese and non-obese subjects with or without hypertension; its relationship with oxidative stress and copper. Clin. Biochem. 2003, 36, 405–408. [Google Scholar] [CrossRef]
- Ozata, M.; Mergen, M.; Oktenli, C.; Aydin, A.; Sanisoglu, S.Y.; Bolu, E.; Yilmaz, M.; Sayal, A.; Isimer, A.; Ozdemir, I. Increased oxidative stress and hypozincemia in male obesity. Clin. Biochem. 2002, 35, 627–631. [Google Scholar] [CrossRef]
- Davì, G.; Guagnano, M.T.; Ciabattoni, G.; Basili, S.; Falco, A.; Marinopiccoli, M.; Nutini, M.; Sensi, S.; Patrono, C. Platelet activation in obese women: Role of inflammation and oxidant stress. JAMA 2002, 288, 2008–2014. [Google Scholar] [CrossRef] [Green Version]
- Block, G.; Dietrich, M.; Norkus, E.P.; Morrow, J.D.; Hudes, M.; Caan, B.; Packer, L. Factors associated with oxidative stress in human populations. Am. J. Epidemiol. 2002, 156, 274–285. [Google Scholar] [CrossRef] [Green Version]


| The Study Population n = 120 | Women n = 46 | Men n = 74 | p | |
|---|---|---|---|---|
| Age | 53.00 (45.50–61.50) | 53.00 (48.00–60.00) | 54.00 (44.00–63.00) | ns |
| BMI [kg/m2] | 33.00 (29.60–36.10) | 34.10 (30.86–36.80) | 32.12 (28.71–35.35) | ns |
| WC [cm] | 105.00 (97.00–113.00) | 100.00 (95.00–111.00) | 106.50 (100.00–117.00) | 0.0229 |
| SBP [mmHg] | 131.50 (120.00–145.00) | 130.00 (120.00–150.00) | 133.00 (125.00–145.00) | ns |
| DBP [mmHg] | 86.50 (80.00–90.50) | 84.50 (80.00–90.00) | 90.00 (80.00–95.00) | ns |
| T-C [mmol/L] | 5.33 (4.73–6.19) | 5.35 (4.73–6.21) | 5.32 (4.73–6.16) | ns |
| HDL-C [mmol/L] | 1.32 (1.11–1.57) | 1.45 (1.24–1.82) | 1.26 (1.05–1.49) | 0.0020 |
| LDL-C [mmol/L] | 3.26 (2.75–4.04) | 3.25 (2.74–4.19) | 3.30 (2.77–4.03) | ns |
| nHDL-C [mmol/L] | 3.85 (3.41–4.68) | 3.84 (3.16–4.97) | 3.86 (3.50–4.57) | ns |
| TG [mmol/L] | 1.51 (1.08–2.12) | 1.28 (0.90–1.98) | 1.61 (1.23–2.34) | 0.0262 |
| G-0’ [mmol/L] | 5.25 (4.91–5.64) | 5.30 (4.92–5.67) | 5.22 (4.88–5.64) | ns |
| G-120’ [mmol/L] | 6.38 (4.94–7.93) | 6.82 (5.33–7.98) | 6.17 (4.89–7.78) | ns |
| Ins-0’ [mU/L] | 18.13 (13.39–25.42) | 20.72 (14.64–33.13) | 16.75 (13.18–23.79) | ns |
| Ins-120’ [mU/L] | 72.50 (34.65–122.17) | 100.24 (45.63–151.72) | 60.39 (30.28–100.90) | 0.0088 |
| HOMA-IR | 4.28 (3.00–6.24) | 4.96 (3.02–7.67) | 3.83 (2.98–5.82) | ns |
| The Study Population n = 120 | Women n = 46 | Men n = 74 | p | |
|---|---|---|---|---|
| oxLDL-0’ [U/L] | 67.00 (53.15–89.12) | 78.91 (54.04–98.00) | 64.26 (50.69–77.66) | ns |
| oxLDL-120’ [U/L] | 62.11 (48.80–85.16) | 65.60 (49.20–86.40) | 60.90 (48.66–78.70) | ns |
| oxLDL-ROGTT | 0.92 (0.84–1.03) | 0.88 (0.82–1.03) | 0.94 (0.85–1.05) | ns |
| TBARS-0’ [µmol/L] | 5.70 (4.85–7.14) | 6.00 (5.27–7.32) | 5.57 (4.62–6.70) | ns |
| TBARS-120’ [µmol/L] | 6.04 (5.00–7.28) | 6.57 (5.30–7.58) | 5.56 (4.91–6.96) | 0.0207 |
| TBARS-ROGTT | 1.04 (0.94–1.15) | 1.05 (0.98–1.16) | 1.03 (0.93–1.14) | ns |
| H1 n = 30 | H2 n = 30 | H3 n = 30 | H4 n = 30 | p | |
|---|---|---|---|---|---|
| Age | 56.50 (50.00–64.00) | 53.50 (44.00–60.00) | 51.00 (44.00–61.00) | 53.00 (40.00–59.00) | ns |
| BMI [kg/m2] | 29.23 (26.32–33.70) | 30.97 (27.51–32.99) | 33.31 (32.70–37.04) | 36.95 (33.90–40.80) | <0.0001 |
| WC [cm] | 96.00 (90.00–104.00) | 104.50 (97.00–110.00) | 107.00 (103.00–113.00) | 112.00 (103.00–124.00) | <0.0001 |
| SBP [mmHg] | 135.50 (120.00–148.00) | 130.00 (117.00–142.00) | 130.00 (128.00–141.00) | 140.00 (125.00–150.00) | ns |
| DBP [mmHg] | 84.00 (71.00–90.00) | 83.00 (80.00–90.00) | 86.50 (80.00–95.00) | 90.00 (80.00–95.00) | ns |
| T-C [mmoL/L] | 5.42 (4.90–6.21) | 5.34 (4.87–6.32) | 5.37 (4.80–6.34) | 4.98 (4.52–6.03) | ns |
| HDL-C [mmol/L] | 1.54 (1.33–1.81) | 1.36 (1.17–1.60) | 1.21 (1.03–1.48) | 1.23 (1.04–1.38) | 0.0004 |
| LDL-C [mmol/L] | 3.31 (2.93–4.04) | 3.49 (3.13–4.12) | 3.55 (2.94–4.06) | 2.94 (2.56–3.98) | ns |
| nHDL-C [mmol/L] | 3.73 (3.19–4.55) | 3.96 (3.62–4.69) | 4.31 (3.45–5.12) | 3.77 (3.21–4.57) | ns |
| TG [mmol/L] | 1.12 (0.87–1.53) | 1.46 (1.08–2.10) | 1.74 (1.35–2.40) | 1.72 (1.28–2.36) | 0.0007 |
| G-0’ [mmol/L] | 5.18 (4.65–5.49) | 5.12 (4.85–5.46) | 5.43 (5.12–5.78) | 5.37 (5.02–5.84) | 0.0180 |
| G-120’ [mmol/L] | 5.29 (4.58–6.80) | 6.00 (5.33–7.01) | 7.06 (5.28–8.12) | 7.81 (5.62–8.95) | 0.0042 |
| Ins-0’ [mU/L] | 10.10 (8.36–11.36) | 15.38 (14.74–16.90) | 21.11 (19.71–23.79) | 39.09 (32.97–66.55) | <0.0001 |
| Ins-120’ [mU/L] | 33.13 (23.69–46.75) | 60.02 (38.10–80.84) | 88.83 (29.38–123.36) | 137.60 (109.34–335.38) | <0.0001 |
| HOMA-IR | 2.27 (1.78–2.61) | 3.68 (3.27–3.84) | 5.10 (4.75–5.62) | 9.44 (7.67–14.83) | by definition |
| H1 n = 30 | H2 n = 30 | H3 n = 30 | H4 n = 30 | p | |
|---|---|---|---|---|---|
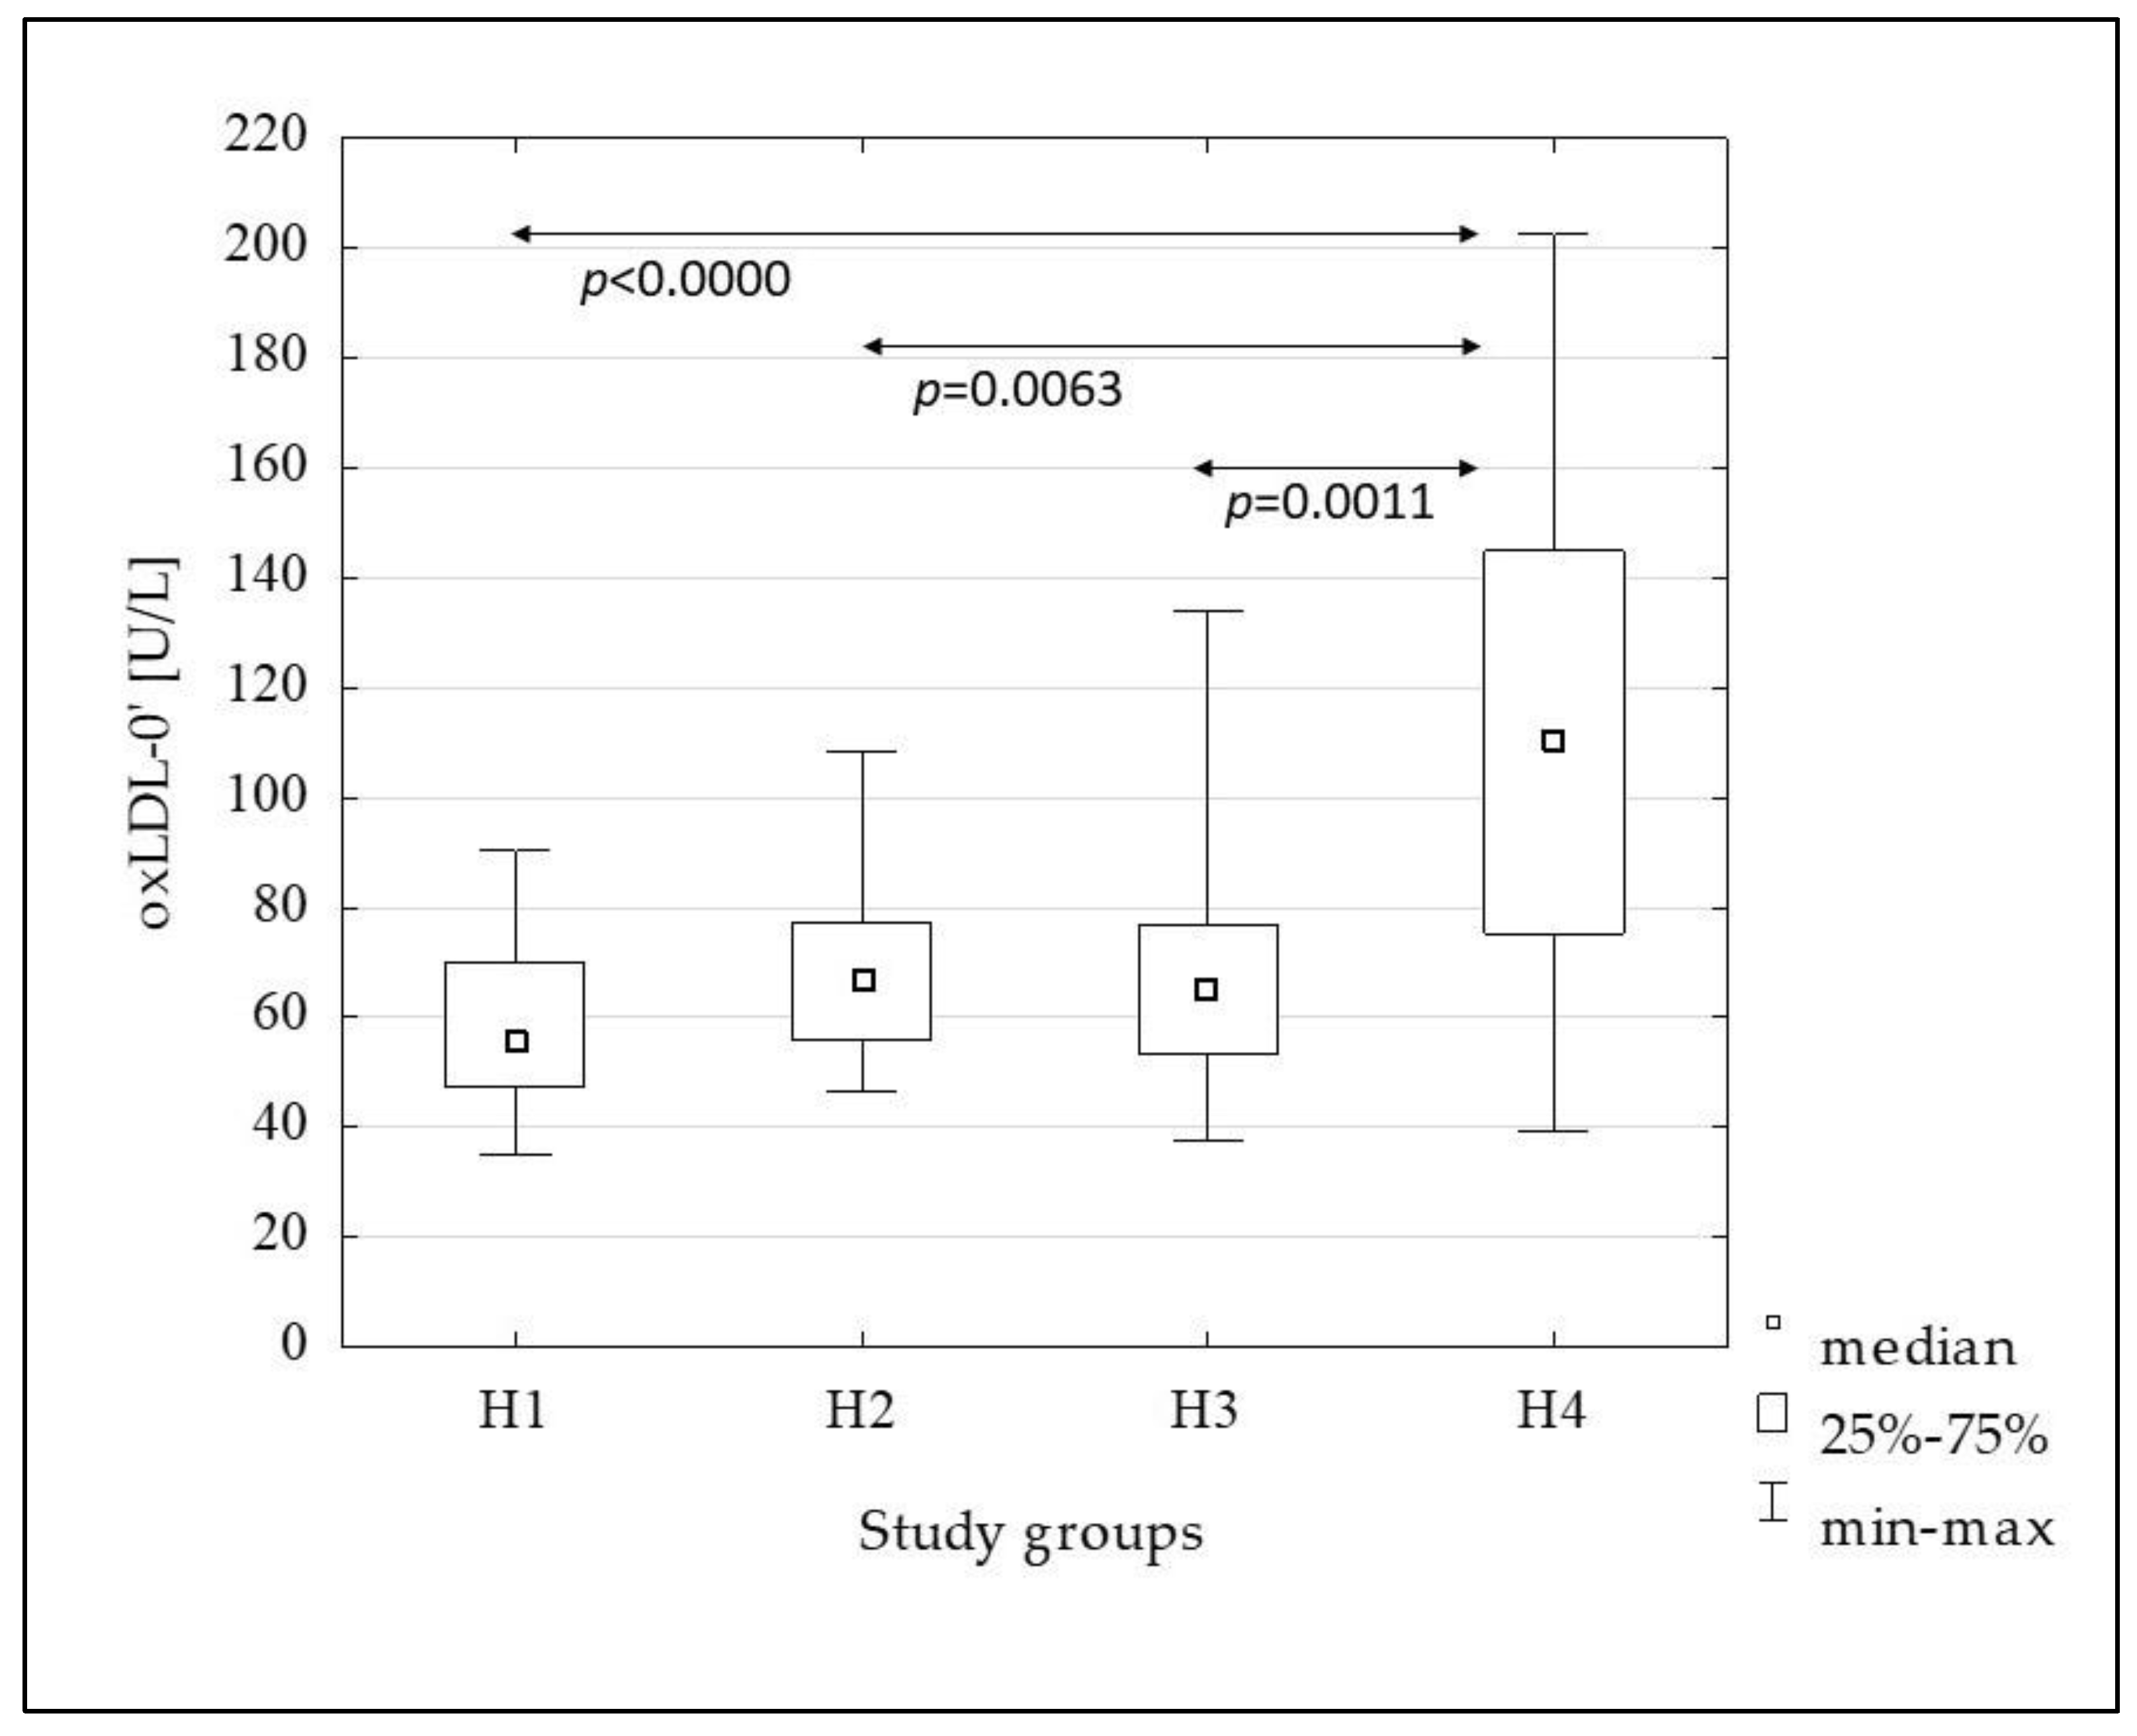
| oxLDL-0’ [U/L] | 55.87 (47.40–70.00) | 66.40 (55.80–77.21) | 65.15 (53.20–76.80) | 110.45 (75.31–145.00) | <0.0001 |
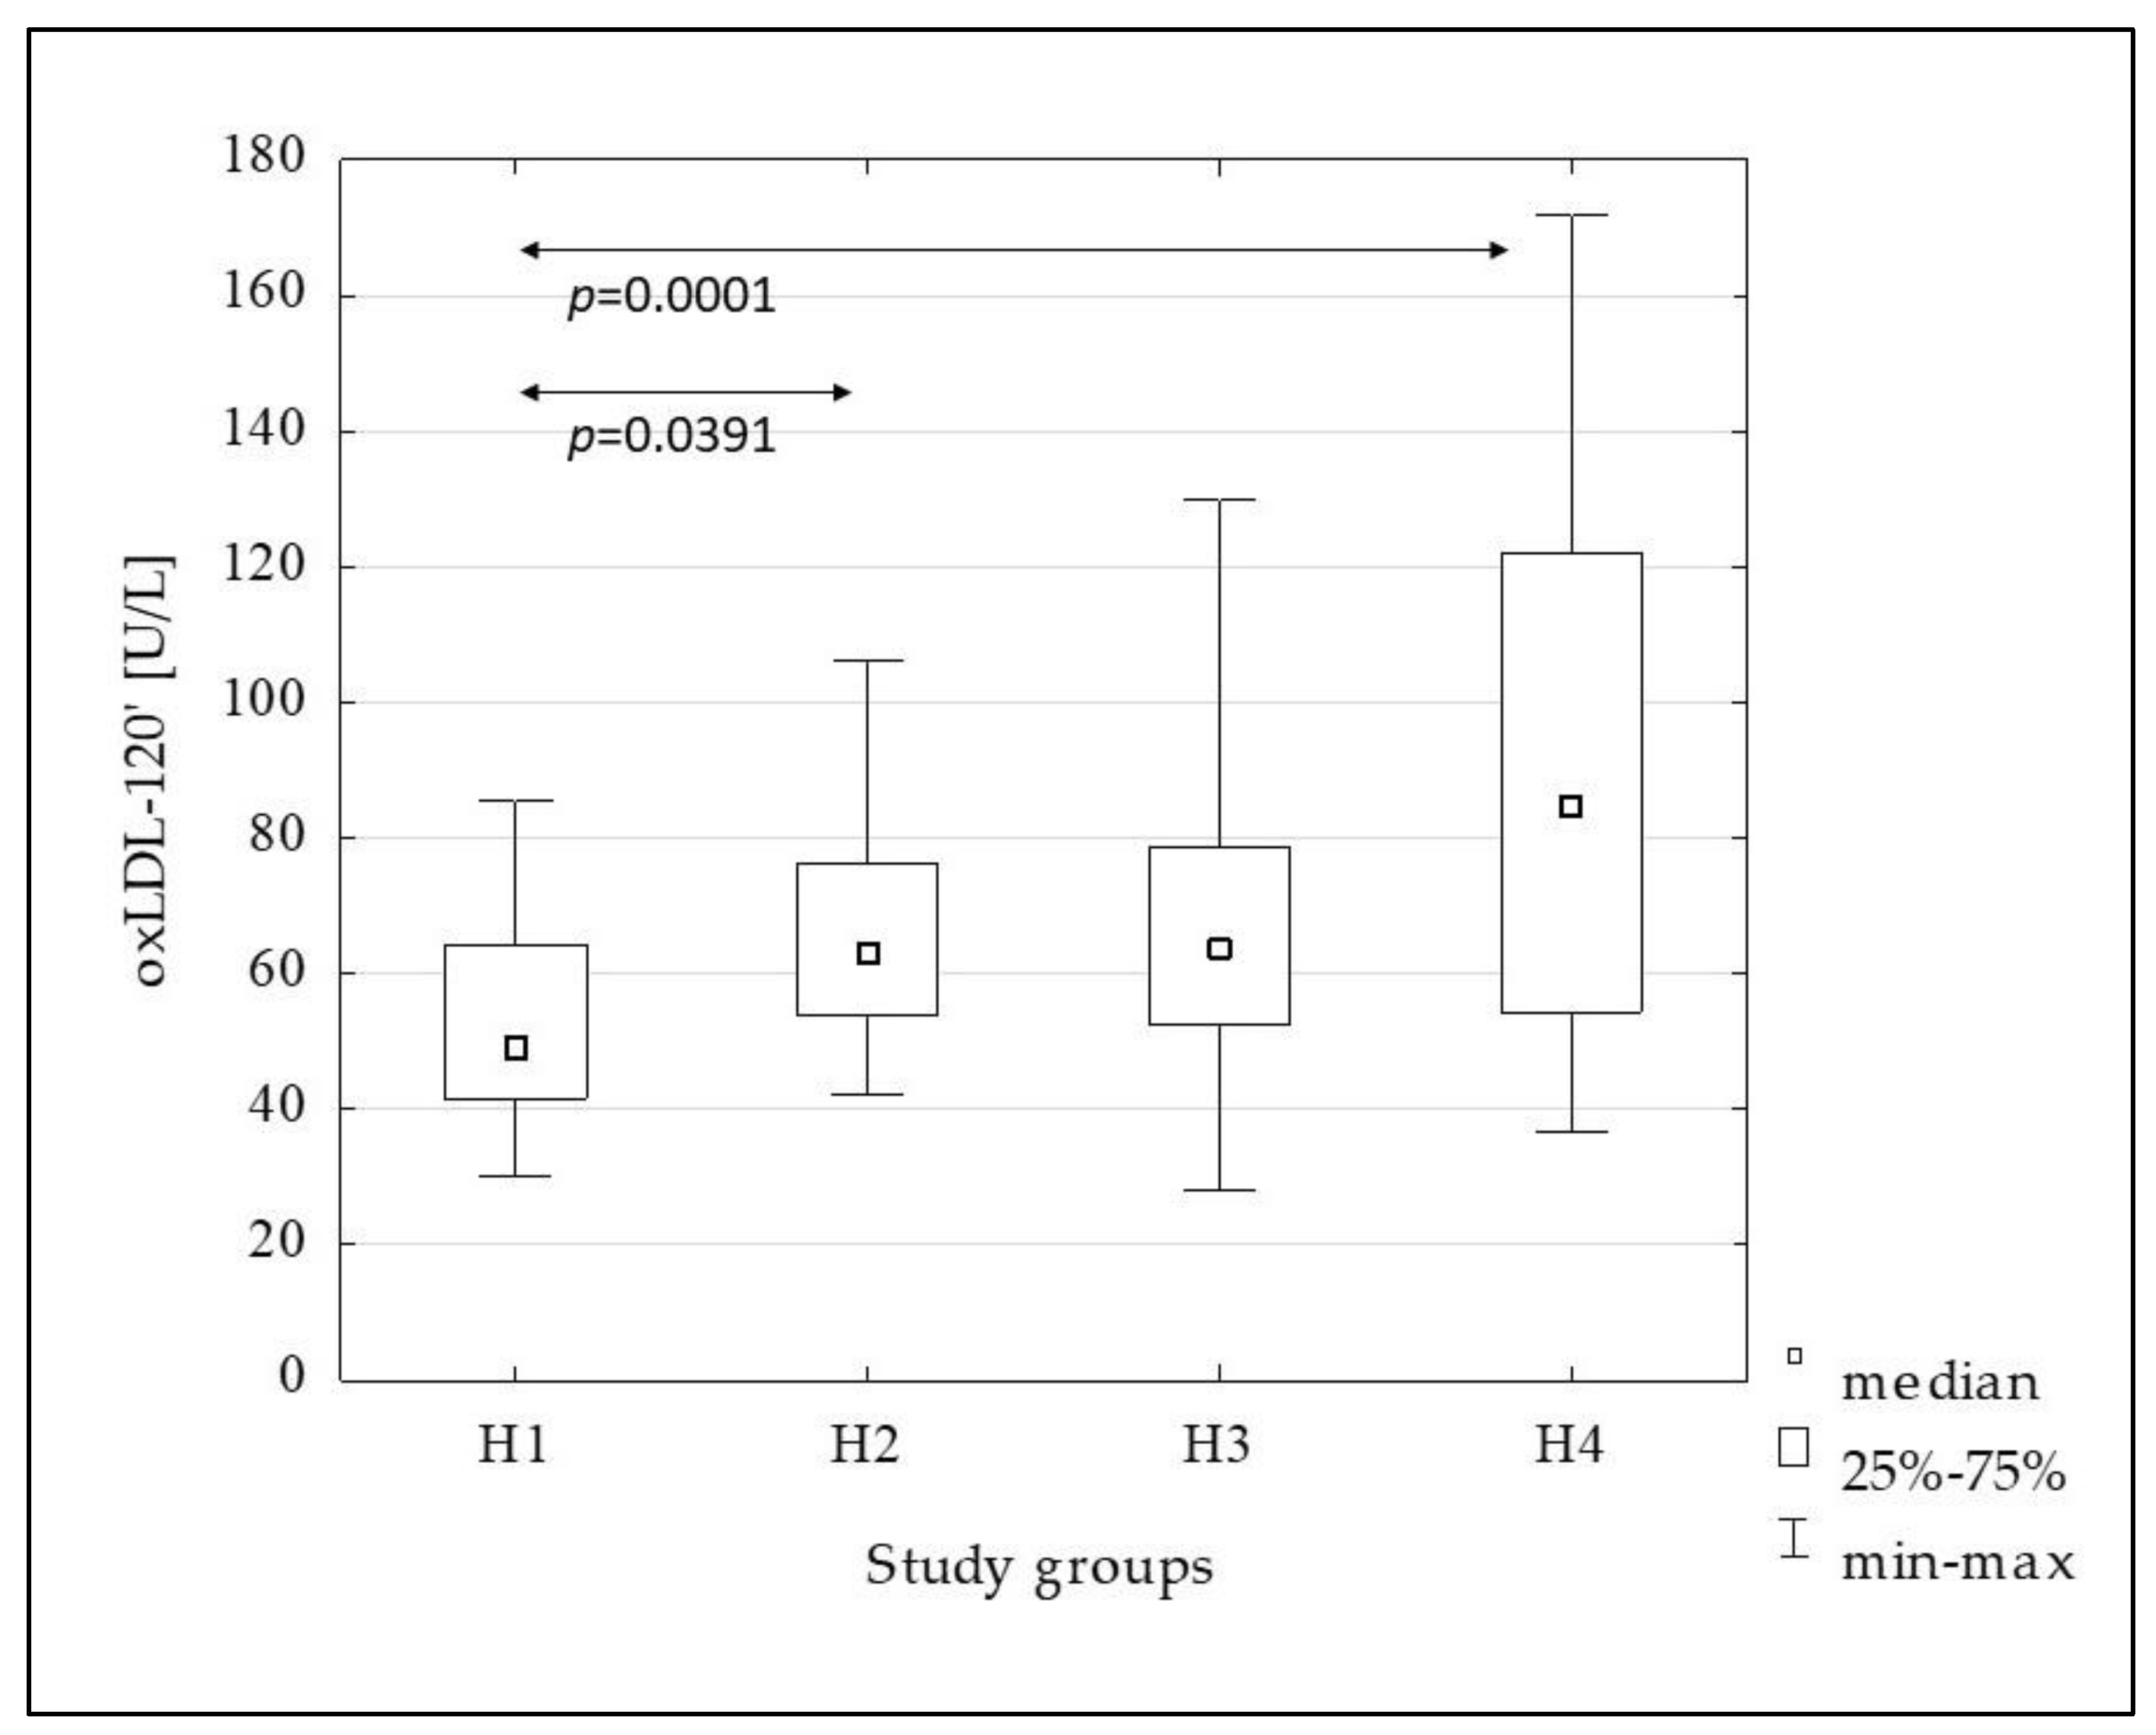
| oxLDL-120’ [U/L] | 48.80 (41.55–64.31) | 63.08 (53.99–76.26) | 63.59 (52.43–78.70) | 84.72 (54.40–122.00) | 0.0003 |
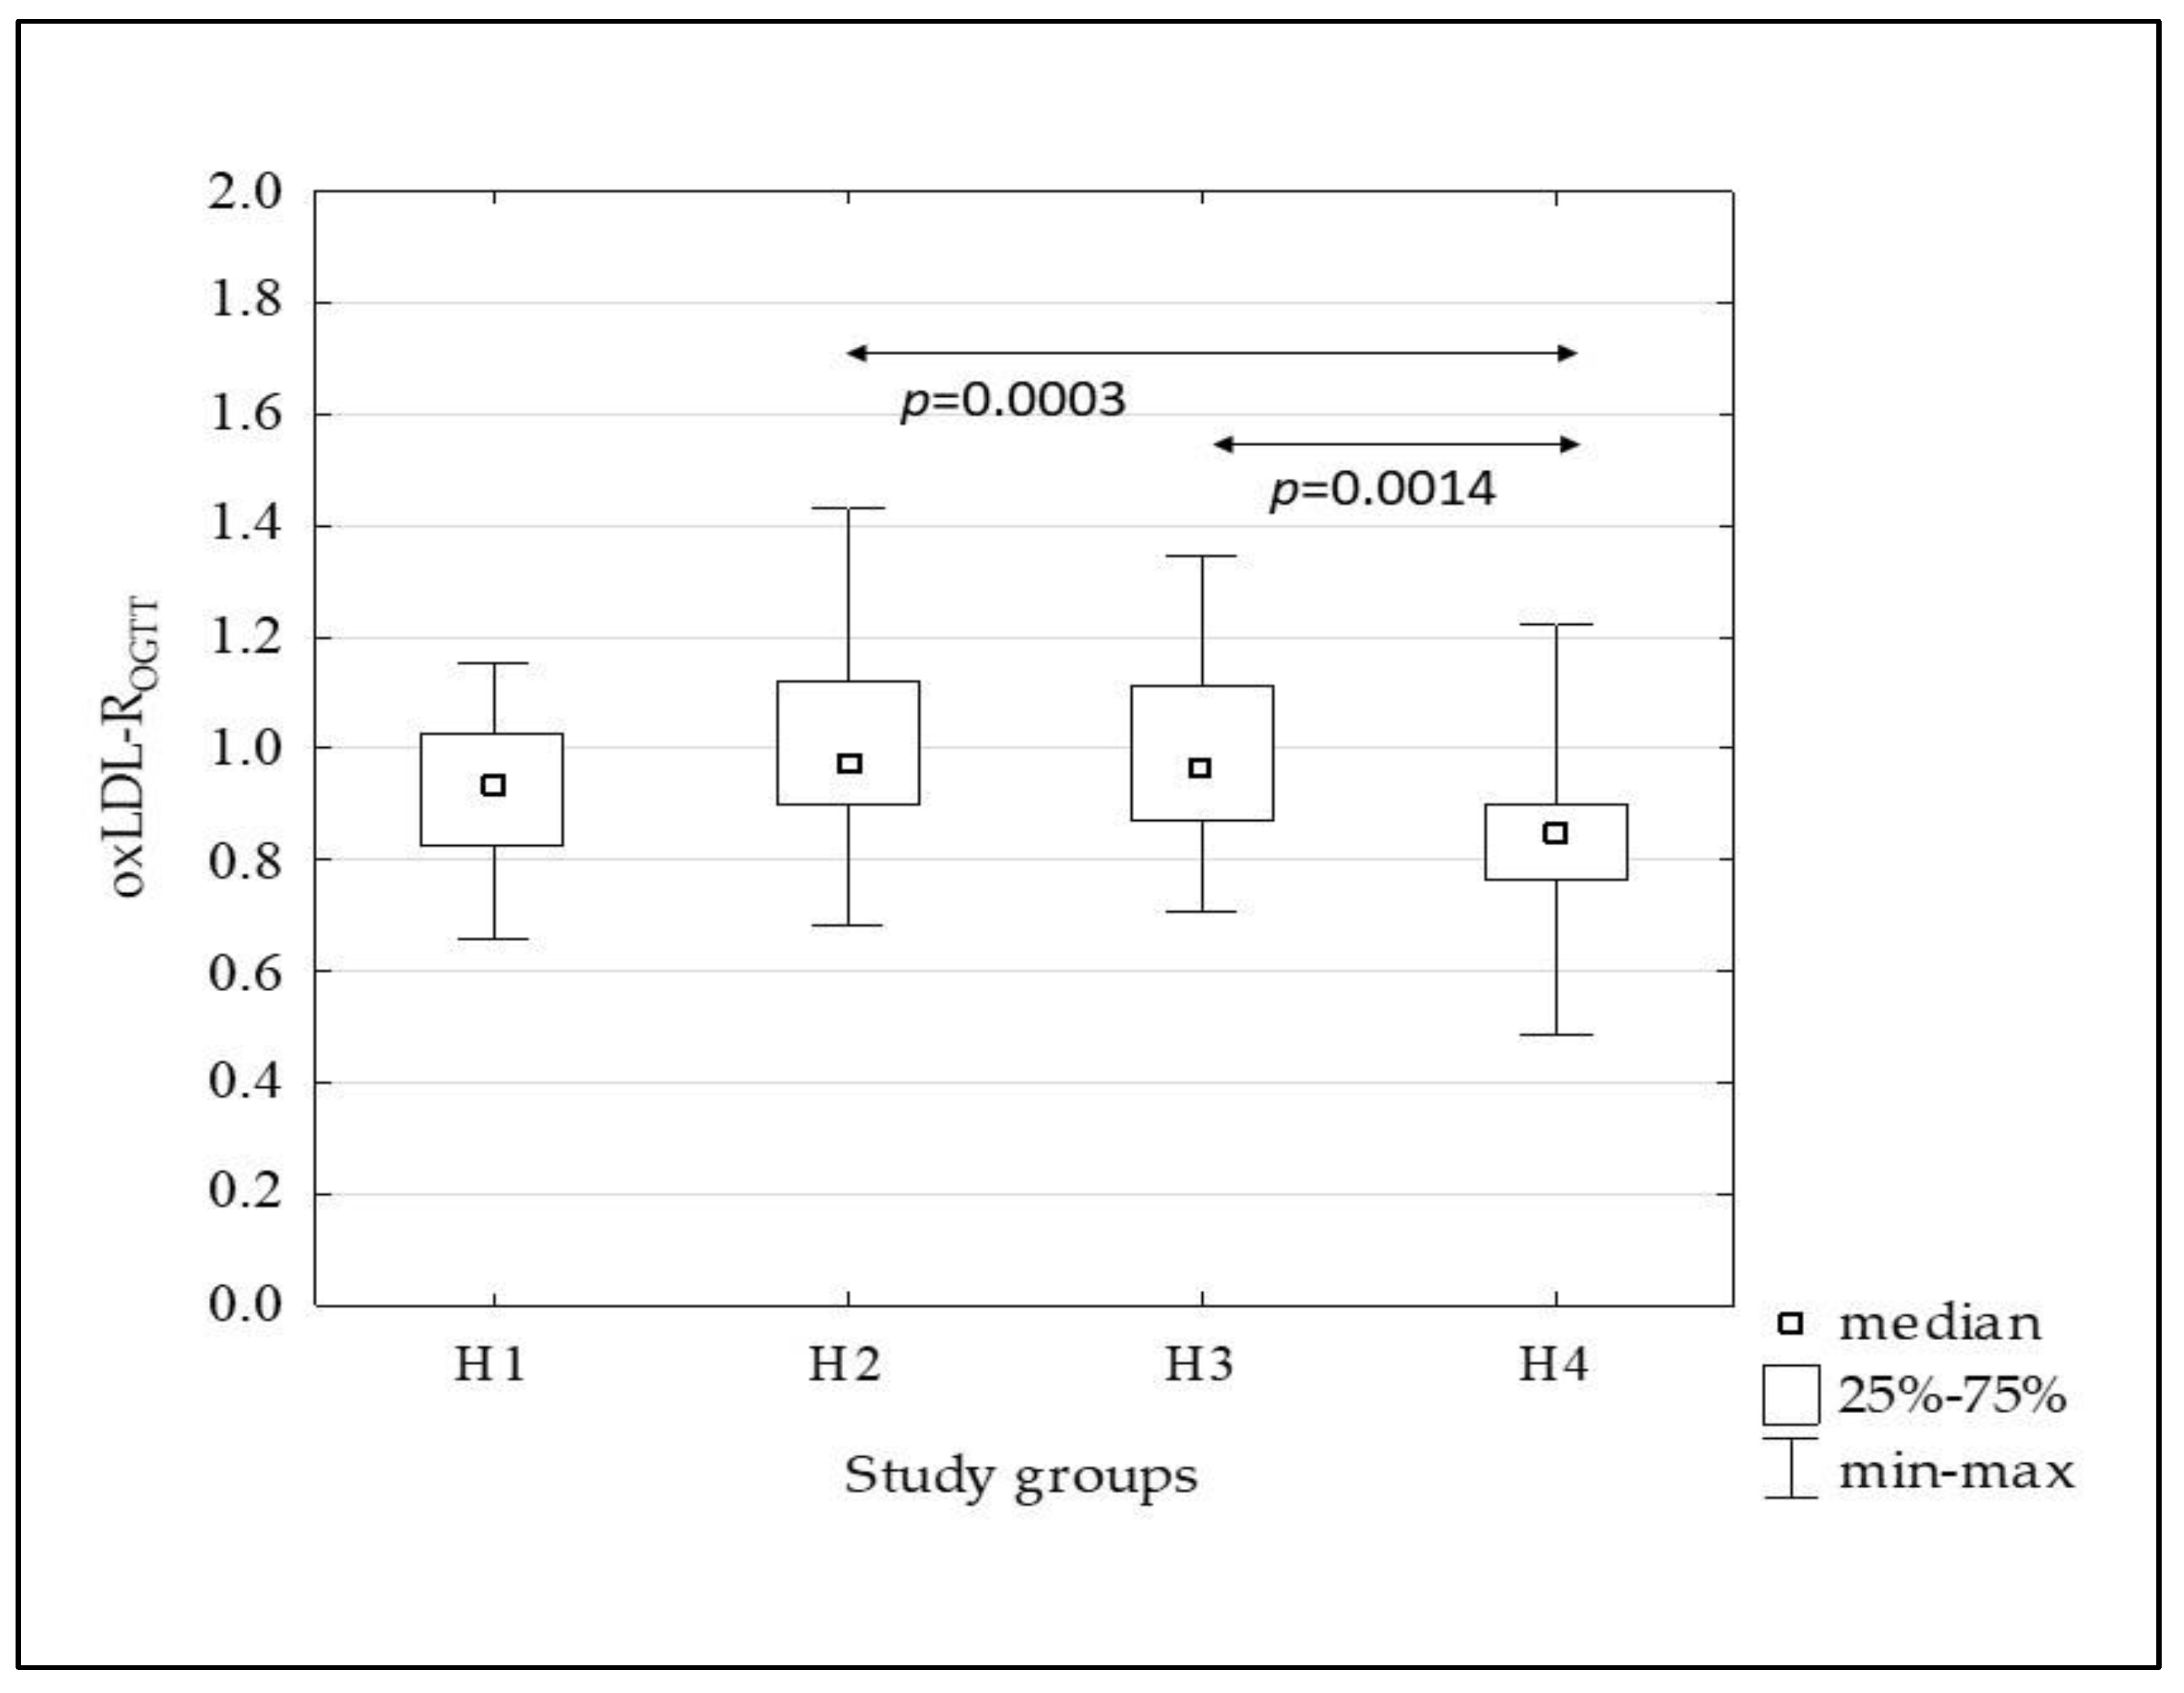
| oxLDL-ROGTT | 0.93 (0.82–1.03) | 0.98 (0.90–1.12) | 0.96 (0.87–1.11) | 0.85 (0.76–0.90) | 0.0002 |
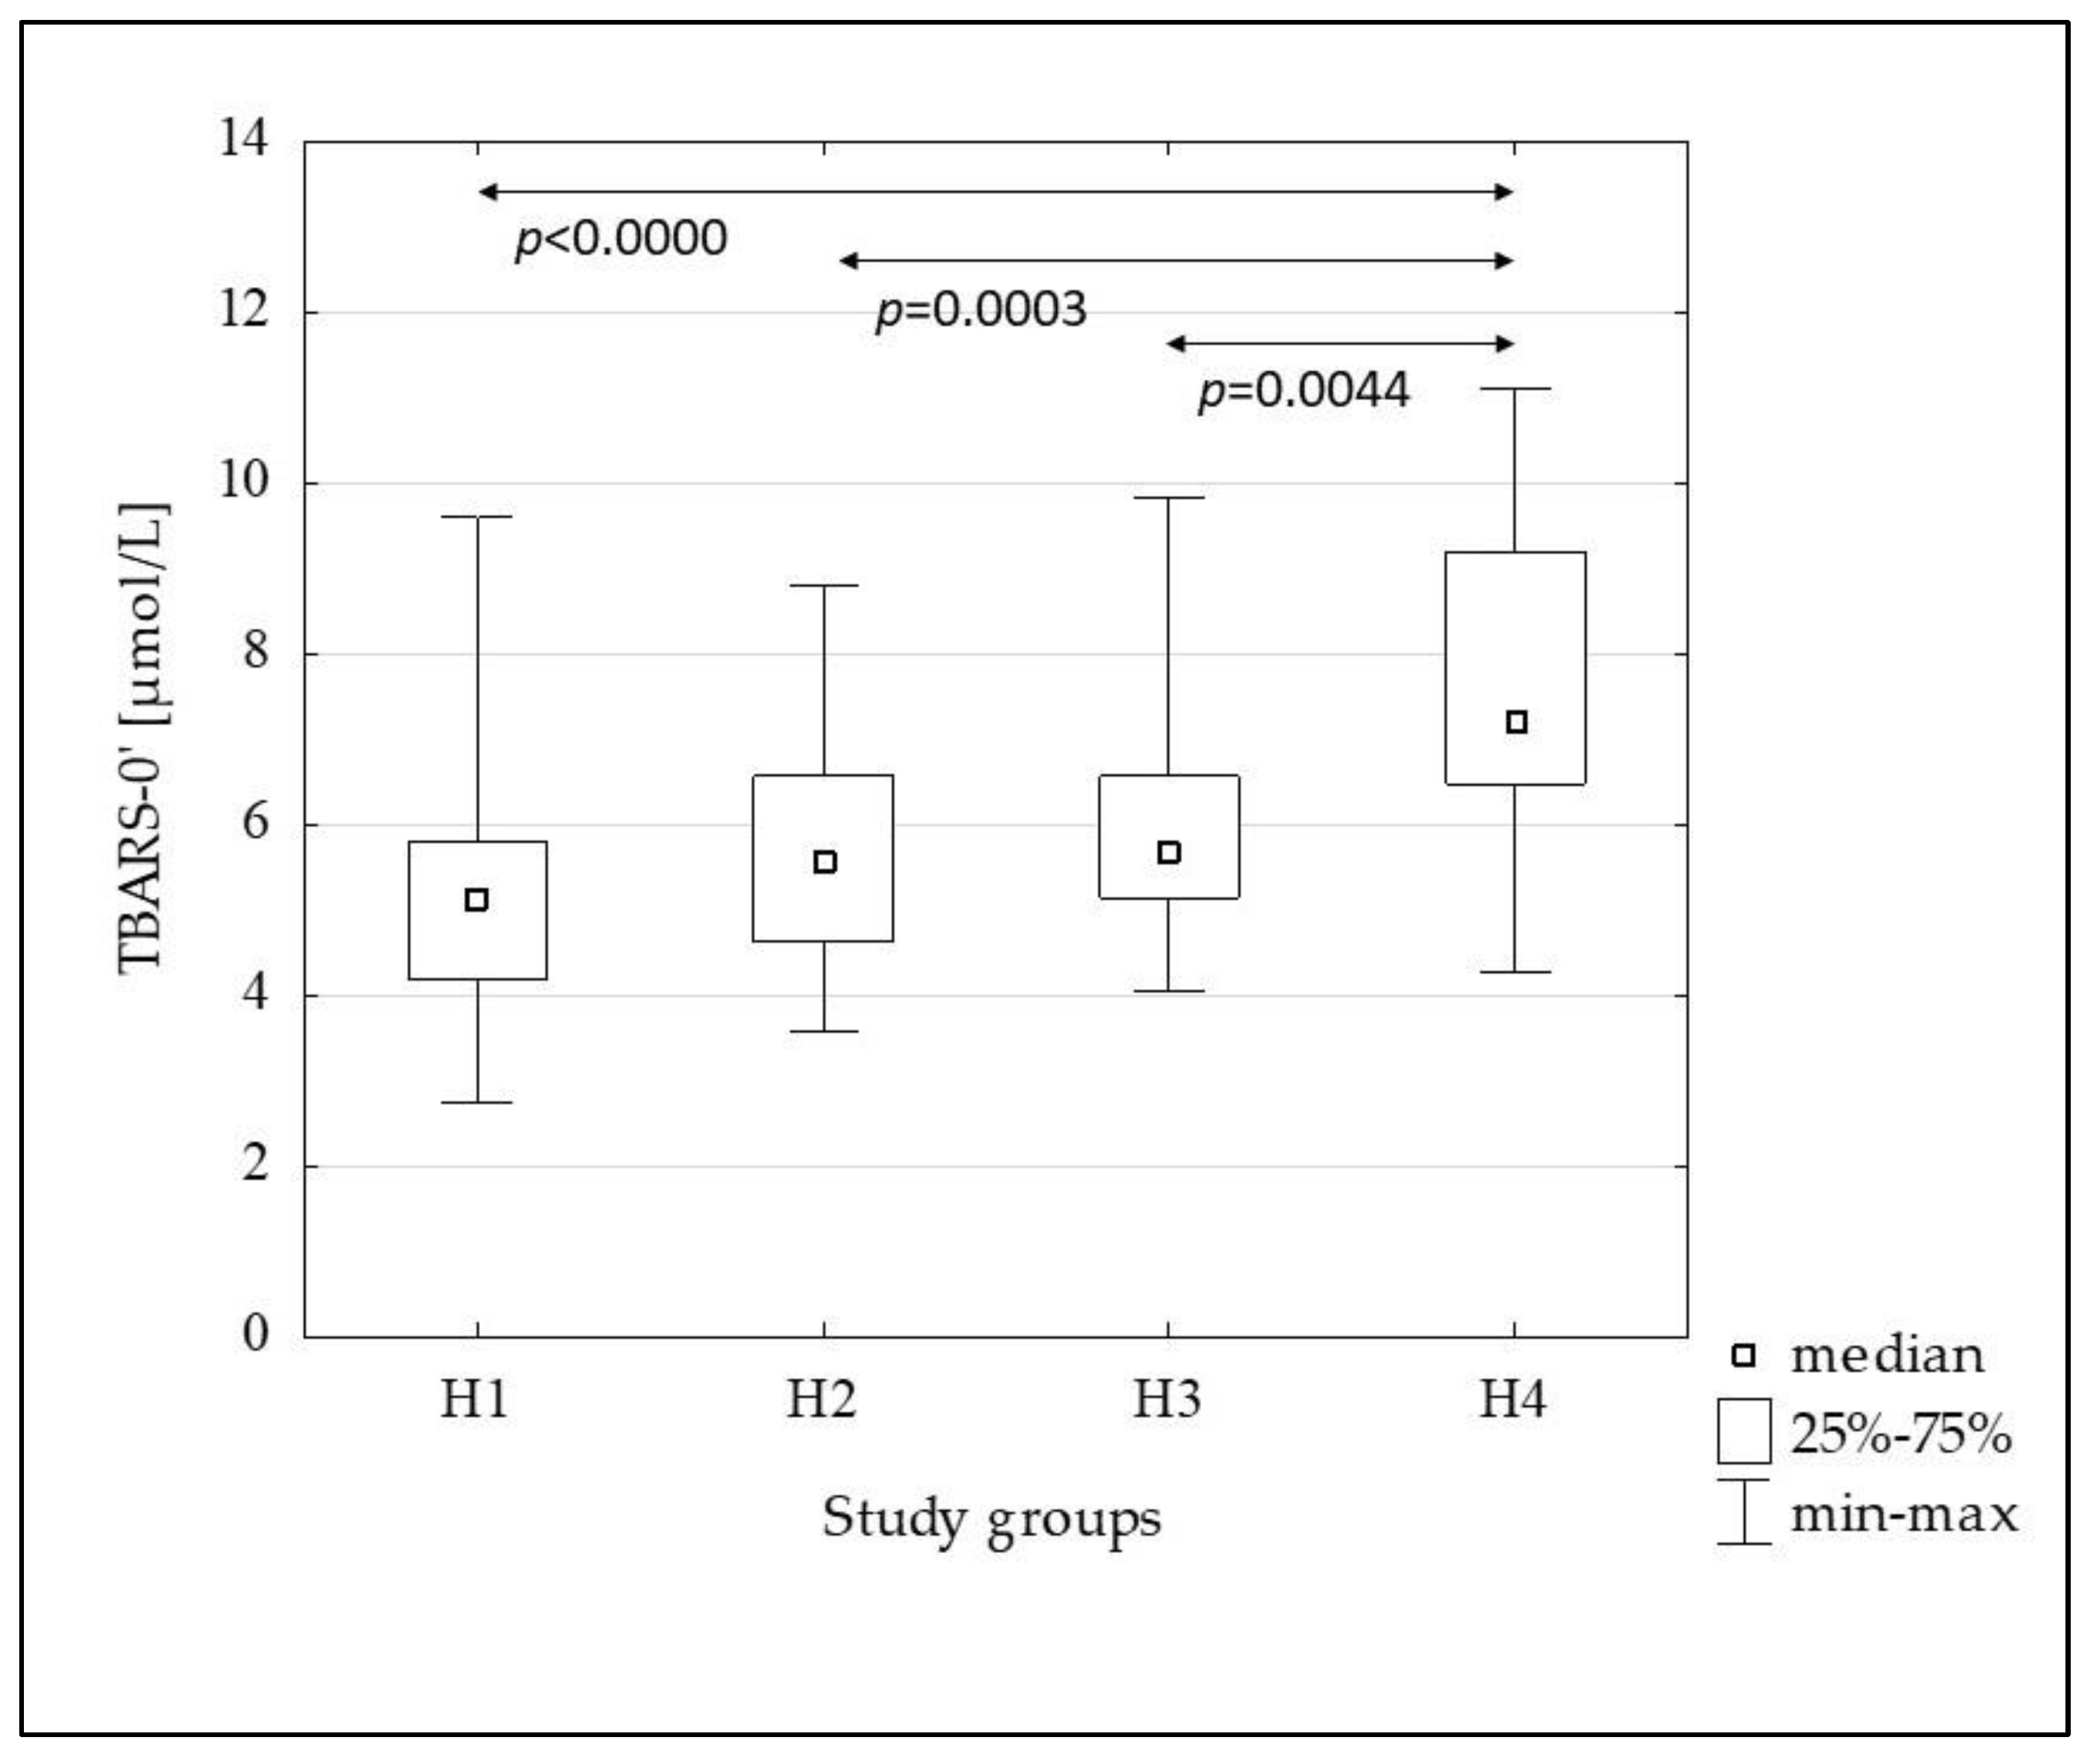
| TBARS-0’ [µmol/L] | 5.12 (4.20–5.79) | 5.57 (4.62–6.57) | 5.65 (5.14–6.57) | 7.21 (6.47–9.19) | <0.0001 |
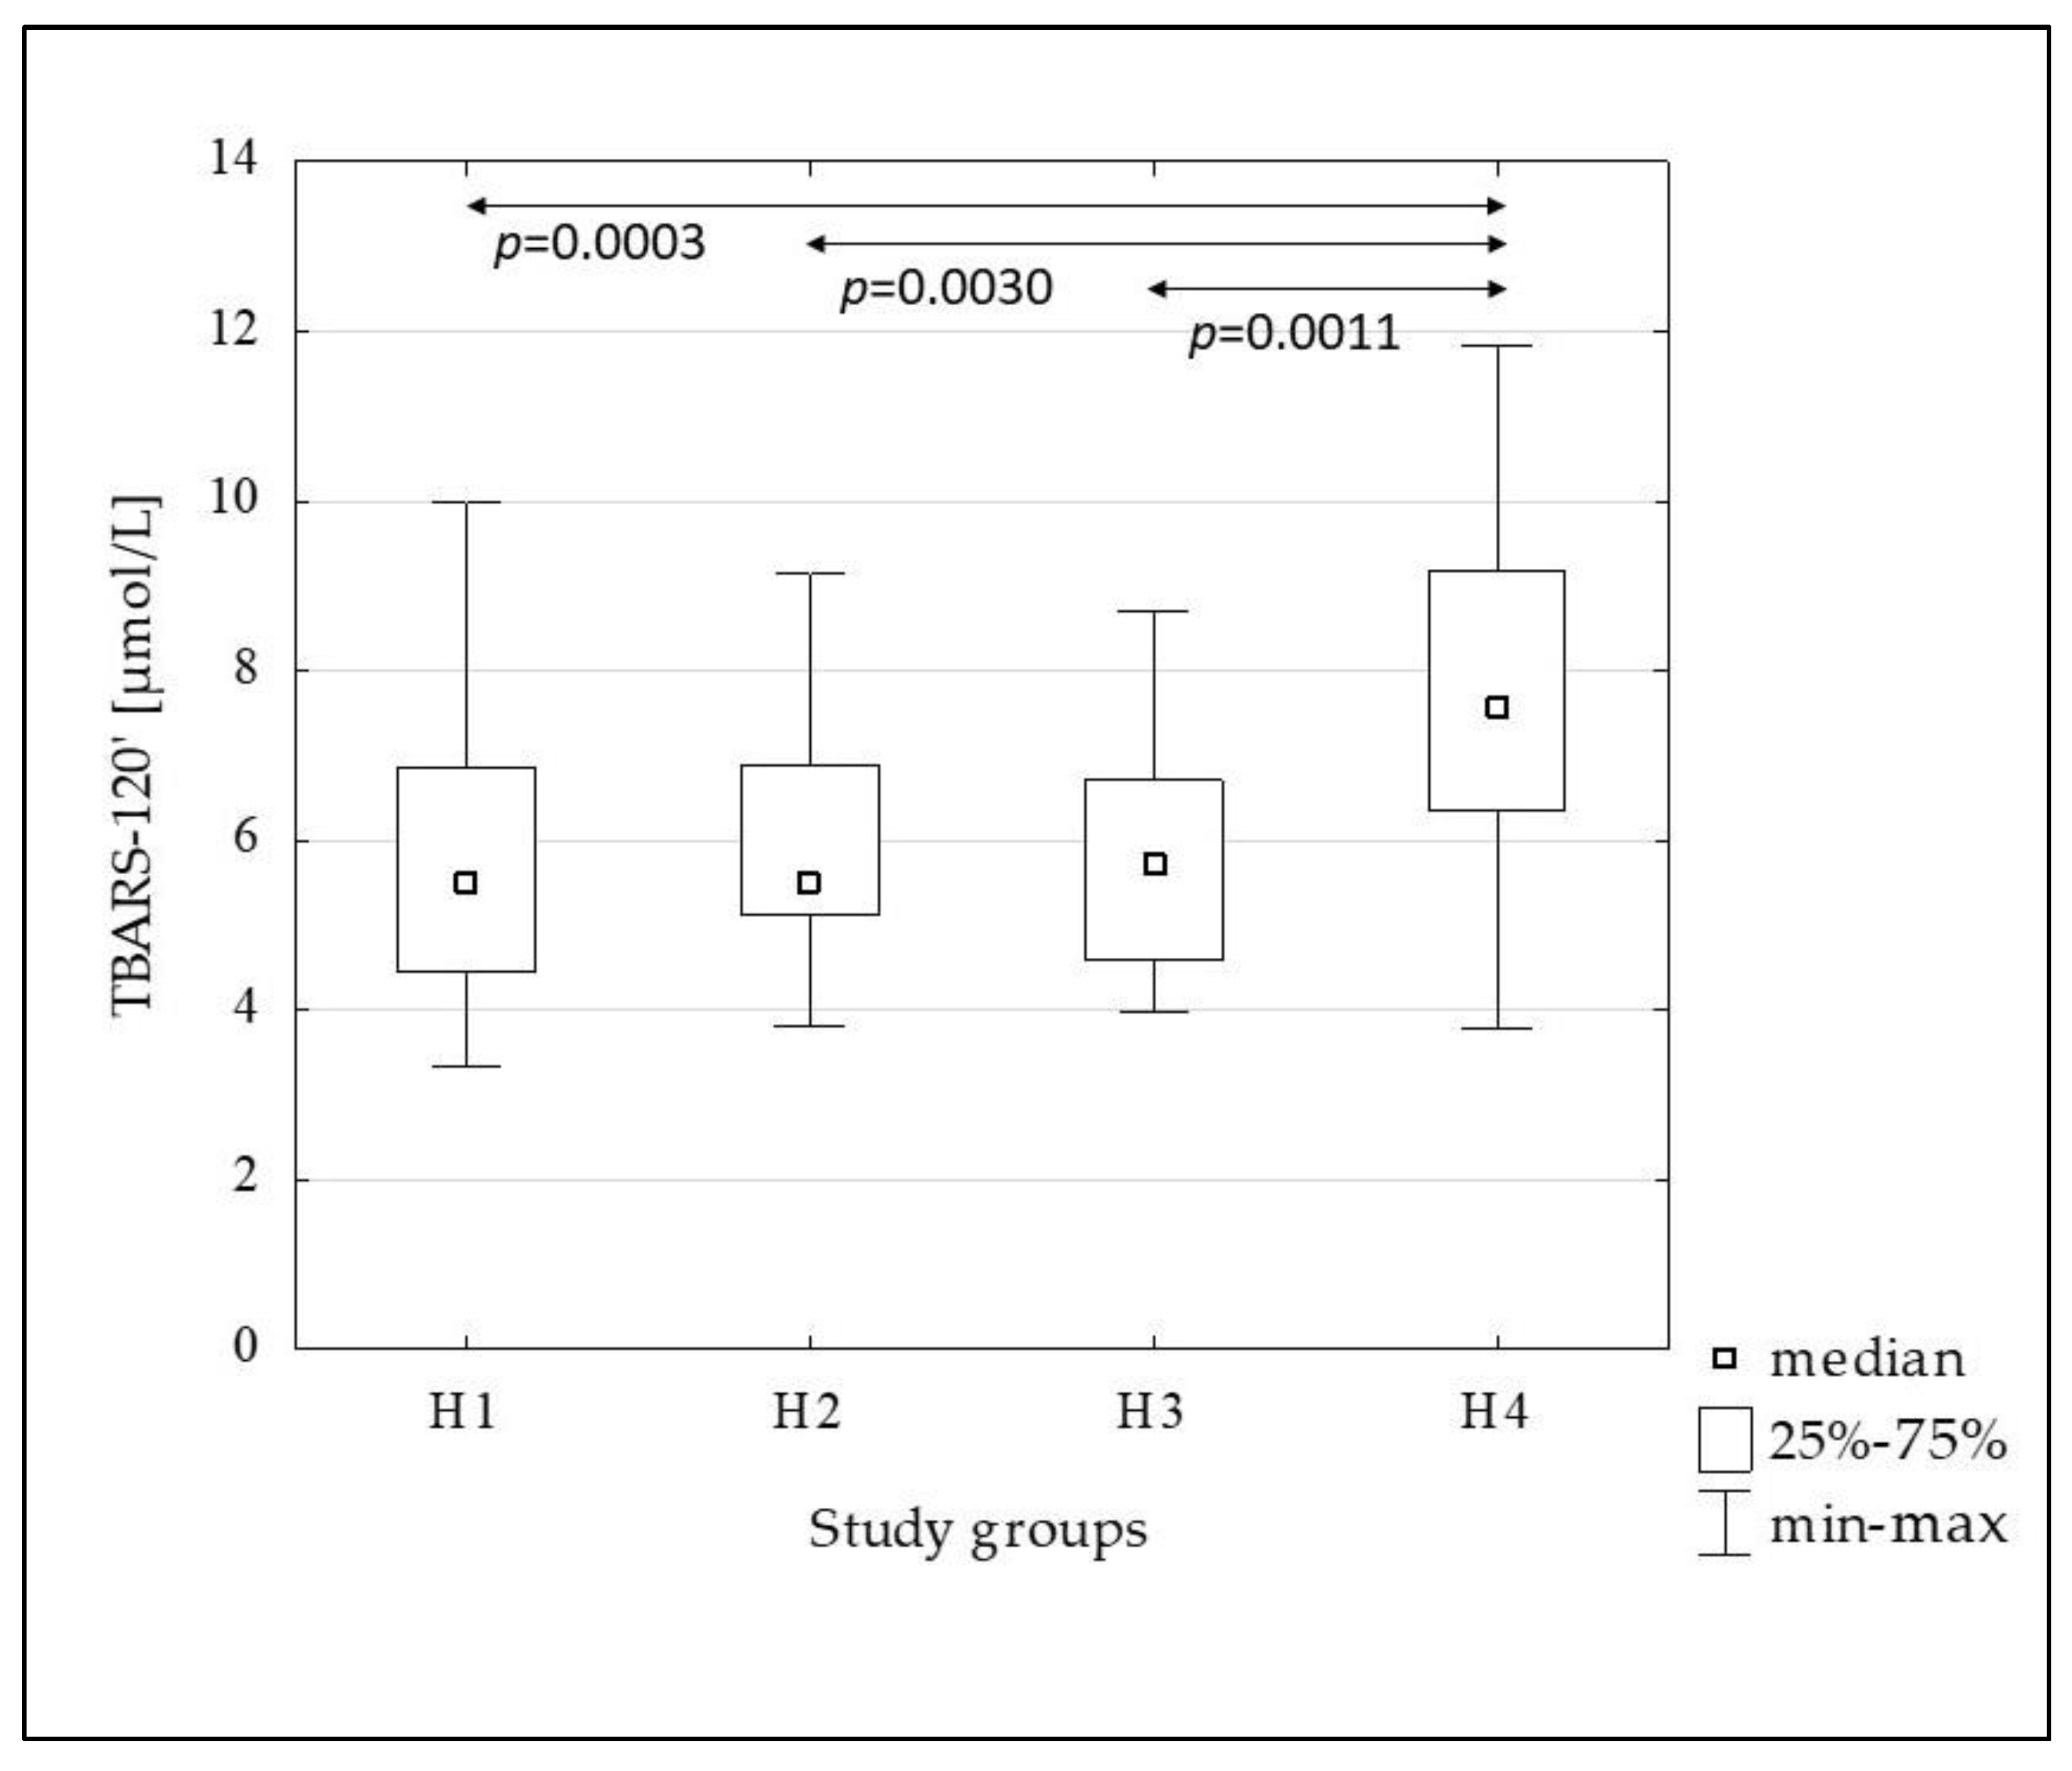
| TBARS-120’ [µmol/L] | 5.49 (4.45–6.85) | 5.53 (5.12–6.90) | 5.72 (4.59–6.70) | 7.57 (6.36–9.16) | 0.0001 |
| TBARS-ROGTT | 1.06 (0.92–1.25) | 1.04 (0.98–1.18) | 1.02 (0.93–1.13) | 1.01 (0.94–1.06) | ns |
| The Study Population n = 120 | H1 n = 30 | H2 n = 30 | H3 n = 30 | H4 n = 30 | |
|---|---|---|---|---|---|
| oxLDL-0’ [U/L] | HDL-C (−0.31; 0.0007) nHDL-C (0.27; 0.0027) TG (0.21; 0.0217) | T-C (0.42; 0.0199) nHDL-C (0.47; 0.0085) | nHDL-C (0.40; 0.0275) | ||
| oxLDL-120’ [U/L] | T-C (0.28; 0.0023) HDL-C (−0.29; 0.0014) LDL-C (0.27; 0.0033) nHDL-C (0.40; <0.0000) TG (0.20; 0.0260) | T-C (0.41; 0.0259) LDL-C (0.40; 0.0277) nHDL-C (0.46; 0.0099) | G-120’ (−0.37; 0.0420) | T-C (0.43; 0.0182) nHDL-C (0.40; 0.0295) | LDL-C (0.44; 0.0161) nHDL-C (0.46; 0.0106) |
| oxLDL-ROGTT | T-C (0.21; 0.0224) LDL-C (0.24; 0.0072) nHDL-C (0.20; 0.0307) | ||||
| TBARS-0’ [µmol/L] | HDL-C (−0.20; 0.0311) TG (0.27; 0.0024) G-120’ (0.23; 0.0134) | G-120’ (0.52; 0.0035) | |||
| TBARS-120’ [µmol/L] | TG (0.19; 0.0343) G-120’ (0.18; 0.0457) | G-120’ (0.44; 0.0158) | |||
| TBARS-ROGTT | T-C (0.19; 0.0331) | T-C (0.41; 0.0238) LDL-C (0.39; 0.0318) nHDL-C (0.46; 0.0111) |
| Variables | The Study Population n = 120 | H1 n = 30 | H2 n = 30 | H3 n = 30 | H4 n = 30 |
|---|---|---|---|---|---|
| G-0’ & G-120’ | <0.0001 | 0.0125 | 0.0036 | 0.0039 | <0.0001 |
| Ins-0’ & Ins-120’ | <0.0001 | <0.0001 | <0.0001 | <0.0001 | <0.0001 |
| oxLDL-0’ & oxLDL-120’ | <0.0001 | 0.0166 | ns | ns | <0.0001 |
| TBARS-0’ & TBARS-120’ | 0.0127 | ns | 0.0387 | ns | ns |
Disclaimer/Publisher’s Note: The statements, opinions and data contained in all publications are solely those of the individual author(s) and contributor(s) and not of MDPI and/or the editor(s). MDPI and/or the editor(s) disclaim responsibility for any injury to people or property resulting from any ideas, methods, instructions or products referred to in the content. |
© 2023 by the authors. Licensee MDPI, Basel, Switzerland. This article is an open access article distributed under the terms and conditions of the Creative Commons Attribution (CC BY) license (https://creativecommons.org/licenses/by/4.0/).
Share and Cite
Bielawska, L.; Wysocka, E.; Baszczuk, A.; Dżumak, A.; Ludziejewska, A.; Cymerys, M.; Płóciniczak, A. The Effect of 75 Grams of Glucose during OGTT on Plasma Markers of Lipid and Lipoprotein Peroxidation, Oxidized LDL and Thiobarbituric Acid Reactive Substances, in People with Increased Body Mass. Metabolites 2023, 13, 483. https://doi.org/10.3390/metabo13040483
Bielawska L, Wysocka E, Baszczuk A, Dżumak A, Ludziejewska A, Cymerys M, Płóciniczak A. The Effect of 75 Grams of Glucose during OGTT on Plasma Markers of Lipid and Lipoprotein Peroxidation, Oxidized LDL and Thiobarbituric Acid Reactive Substances, in People with Increased Body Mass. Metabolites. 2023; 13(4):483. https://doi.org/10.3390/metabo13040483
Chicago/Turabian StyleBielawska, Lena, Ewa Wysocka, Aleksandra Baszczuk, Anna Dżumak, Aleksandra Ludziejewska, Maciej Cymerys, and Alicja Płóciniczak. 2023. "The Effect of 75 Grams of Glucose during OGTT on Plasma Markers of Lipid and Lipoprotein Peroxidation, Oxidized LDL and Thiobarbituric Acid Reactive Substances, in People with Increased Body Mass" Metabolites 13, no. 4: 483. https://doi.org/10.3390/metabo13040483