Article

Expression Silencing of Mitogen-Activated Protein Kinase 8 Interacting Protein-1 Conferred Its Role in Pancreatic β-Cell Physiology and Insulin Secretion

by
Rania Saeed
1,2,
Abdul Khader Mohammed
2,
Sarra E. Saleh
1,
Khaled M. Aboshanab
1,*,
Mohammad M. Aboulwafa
1,3 and
Jalal Taneera
2,4,*
1
Department of Microbiology and Immunology, Faculty of Pharmacy, Ain Shams University, Cairo 11566, Egypt
2
Sharjah Institute for Medical Research, University of Sharjah, Sharjah 27272, United Arab Emirates
3
Faculty of Pharmacy, King Salman International University, Ras-Sudr 46612, Egypt
4
Department of Basic Sciences, College of Medicine, University of Sharjah, Sharjah 27272, United Arab Emirates
*
Authors to whom correspondence should be addressed.
Metabolites 2023, 13(2), 307; https://doi.org/10.3390/metabo13020307
Submission received: 13 January 2023 / Revised: 11 February 2023 / Accepted: 16 February 2023 / Published: 20 February 2023

Abstract

:
Mitogen-activated protein kinase 8 interacting protein-1 (MAPK8IP1) gene has been recognized as a susceptibility gene for diabetes. However, its action in the physiology of pancreatic β-cells is not fully understood. Herein, bioinformatics and genetic analyses on the publicly available database were performed to map the expression of the MAPK8IP1 gene in human pancreatic islets and to explore whether this gene contains any genetic variants associated with type 2 diabetes (T2D). Moreover, a series of functional experiments were executed in a rat insulinoma cell line (INS-1 832/13) to investigate the role of the Mapk8ip1 gene in β-cell function. Metabolic engineering using RNA-sequencing (RNA-seq) data confirmed higher expression levels of MAPK8IP1 in human islets compared to other metabolic tissues. Additionally, comparable expression of MAPK8IP1 expression was detected in sorted human endocrine cells. However, β-cells exhibited higher expression of MAPK8IP1 than ductal and PSC cells. Notably, MAPK8IP1 expression was reduced in diabetic islets, and the expression was positively correlated with insulin and the β-cell transcription factor PDX1 and MAFA. Using the TIGER portal, we found that one genetic variant, “rs7115753,” in the proximity of MAPK8IP1, passes the genome-wide significance for the association with T2D. Expression silencing of Mapk8ip1 by small interfering RNA (siRNA) in INS-1 cells reduced insulin secretion, glucose uptake rate, and reactive oxygen species (ROS) production. In contrast, insulin content, cell viability, and apoptosis without cytokines were unaffected. However, silencing of Mapk8ip1 reduced cytokines-induced apoptosis and downregulated the expression of several pancreatic β-cell functional markers including, Ins1, Ins2, Pdx1, MafA, Glut2, Gck, Insr, Vamp2, Syt5, and Cacna1a at mRNA and/or protein levels. Finally, we reported that siRNA silencing of Pdx1 resulted in the downregulation of MAPK8IP1 expression in INS-1 cells. In conclusion, our findings confirmed that MAPK8IP1 is an important component of pancreatic β-cell physiology and insulin secretion.

1. Introduction

Diabetes mellitus is characterized by insulin resistance, β-cell dysfunction, or both [1]. According to the International Diabetes Federation (http://www.idf.org, accessed on 1 February 2020), the number of people worldwide living with diabetes is 537 million. Type 2 diabetes (T2D) is the greatest prevalent type, representing almost 90% of all diabetic cases. Dysfunctional pancreatic β-cells are mediated by inflammatory cytokines and oxidative stress [2,3], which stimulate the c-Jun N-terminal kinase (JNK) signaling pathway [4]. Compelling evidence has demonstrated the involvement of the JNK signaling pathway in T2D [4,5,6]. The action of JNK necessitates the existence of a scaffold protein termed JNK interacting protein-1 (JIP-1) [7], which is abundantly expressed in the brain and pancreatic β-cells [8,9], as well as in several other tissues, such as muscle tissue, kidney tissue, and adipose tissue, but at lower levels [10,11]. The human and rat homologs of mouse JIP-1 protein were identified and named islet-brain1 (IB1) protein due to their abundant expression in insulin-producing β-cells and neurons [12]. JIP-1 or IB1 is also called mitogen-activated protein kinase 8 interacting protein-1 (MAPK8IP1). The gene symbol for human MAPK8IP1 is MAPK8IP1; the gene symbols for rat and mouse MAPK8IP1 are the same (Mapk8ip1).
In addition, MAPK8IP1 seems to be a multi-functional protein that may have other physiological functions. For example, MAPK8IP1 is localized in neurons [9] and has been implicated in c-Abl and Src tyrosine kinase signaling pathways [13,14]. Furthermore, MAPK8IP1 was also found to interact with the protein kinase Akt1 [15] and other proteins, such as IRS1 and IRS2 insulin receptors [11,16]. In addition, MAPK8IP1 acts as a regulatory protein for dynein-mediated and kinesin-mediated cargo transport along microtubules [17]. Thus, the JNK scaffold attributes of MAPK8IP1 demonstrate only one of several potential functions.
The function of MAPK8IP1 in the evolution of diabetes is controversial. Earlier research proposed that MAPK8IP1 acts as a transactivator of the GLUT2 gene [8] and identified it as a susceptibility gene for T2D, where a missense mutation in MAPK8IP1 was found to segregate with T2D in humans [18]. However, this beneficial role of MAPK8IP1 has been challenged by several reports. For example, experiments of viable Mapk8ip1−/− mice presented no evidence of a non-redundant role of MAPK8IP1 in pancreatic β-cells. Furthermore, MAPK8IP1-deficient mice (Mapk8ip1−/−) and Mapk8ip1-defective mice (Mapk8ip1S59N/S59N) did not exhibit a diabetic phenotype, in contrast to wild-type controls [16,19]. Moreover, Mapk8ip1-defective mice fed with high-fat diet (HFD) were protected against insulin resistance and obesity compared to HFD-fed WT mice [11,20]. On the other hand, while some reports have demonstrated the protective effect of MAPK8IP1 on insulin-secreting cells by regulating the activity of the JNK signaling pathway [21], others have shown further effects of MAPK8IP that were independent of JNK signaling [22].
To date, the function of MAPK8IP1 in pancreatic β-cell physiology and the pathogenesis of diabetes has not been entirely investigated. Therefore, this study aimed to examine the role of MAPK8IP1 on insulin secretion and β-cell function. This was accomplished by analysis of the RNA-sequencing data and monitoring the expression of MAPK8IP1 in human pancreatic islets with/without diabetes. In addition, a series of functional experiments were carried out in INS-1 (832/13) cells to verify the impact of Mapk8ip1 on the β-cell function.

2. Materials and Methods

2.1. Analysis of RNA-seq Data in Human Pancreatic Islets

The NCBI’s Gene Expression Omnibus (GEO) publicly available database was used to retrieve the RNA-seq expression data (https://www.ncbi.nlm.nih.gov/geo/query/acc.cgi?acc=GSE50398, accessed on 1 February 2020) [23]. As previously described, islets were previously processed [24] and RNA-sequencing was performed using Illumina’s TruSeq RNA Preparation Kit [23]. The output reads were aligned to the human reference genome (hg19) with STAR.17,18. Raw data were normalized using a trimmed mean of M-values and presented as fragments per kilobase of exon per million fragments mapped (FPKM) or transformed into log2 counts per million using the voom function (edgeR/limma R-packages). The expression data were obtained from 72 islet donors (European ancestry); of them, 51 were non-diabetic/normoglycemic donors (HbA1c < 6%; n = 51) and 21 were diabetic/hyperglycemic donors (6% ≤ HbA1c < 6.5%; n = 21).

2.2. Screening for T2D-Associated Genetic Variants in MAPK8IP1

We searched a region spanning ±100 kb upstream and downstream of MAPK8IP1 for T2D-genetic variants using the TIGER portal (http://tiger.bsc.es, accessed on 1 February 2020) [25]. As a result, three different GWAS meta-analysis datasets were explored: (i) the 70 K for the T2D project, consisting of 70,127 European ancestry subjects, including 13,857 T2D cases and 62,126 controls; (ii) the DIAGRAM 1000G, consisting of 159,208 European ancestry subjects, including 26,176 T2D cases and 132,532 controls; and (iii) the DIAGRAM Diamante T2D, consisting of 898,132 European ancestry subjects, including 74,124 T2D cases and 824,006 controls. Moreover, the T2D Knowledge Portal (T2DKP, containing 375 datasets and 377 traits) database (https://t2d.hugeamp.org, accessed on 1 February 2020) was also used for searching for T2D-genetic variants.

2.3. Culturing of INS-1 Cell Line and siRNA Transfection

Rat insulinoma INS-1 (832/13) were kindly provided by Dr. C. B. Newgaard, Duke University, USA [26]. As previously described, INS-1 (832/13) cells were cultured in RPMI-1640 medium supplemented with 10% fetal bovine serum [27]. For siRNA transfection, INS-1 cells were cultured in a 24-well plate (2 × 10⁵ cells/well) in an antibiotic-free RPMI 1640 medium. Upon reaching 60% confluency, cells were transfected with two sets of siRNA sequences against Mapk8ip1 (s137914 and s137915) or Pdx1 (s131652) or MafA (s172995) (Thermo Fisher Scientific, Waltham, MA, USA) or negative control siRNA, along with a mixture of Lipofectamine 3000 transfection reagent (Thermo Fisher Scientific, Waltham, MA, USA), as previously described [27]. The efficiency of siRNA transfection was monitored by a quantitative real-time reverse transcription polymerase chain reaction (qRT-PCR).

2.4. RNA Extraction and qRT-PCR

The high-capacity cDNA Reverse Transcription Kit (Thermo Fisher Scientific, Waltham, MA, USA) was used for complementary DNA (cDNA) synthesis from the extracted RNA. Expression of key β-cell function genes in transfected and non-transfected cells was determined by qRT-PCR using TaqMan gene expression assays through the use of gene-specific primer probes for Mapk8ip1 (Rn00587215_m1), Ins1 (Rn02121433_g1), Ins2 (Rn01774648_g1), Glut2 (Rn00563565_m1), Pdx1 (Rn00755591_m1), Gck (Rn00561265_m1), Insr (Rn00690703_ m1), and Rat Hprt1 (Rn01527840_m1). SYBR green gene expression analysis was conducted using the primers (Table 1). The relative gene expression was done via the 2−ΔΔCt method, and the qPCR reactions were performed at least three times.

2.5. Insulin Secretion and Insulin Content Assay

Glucose-stimulated insulin secretion (GSIS) assay was conducted as previously described [27]. Briefly, for two hours, secretion assay buffer (SAB) containing 2.8 mM glucose was used to wash and pre-incubate silenced and control cells. The cells were then stimulated by SAB (1 mL) incubation, as previously reported [27]. Secreted insulin and insulin content were determined using a rat insulin enzyme-linked immunoassay (ELISA) kit (Mercodia, Uppsala, Sweden) and normalized to the total amount of protein.

2.6. Glucose Uptake

A fluorescently labeled deoxyglucose analog, 2-[N-(7-nitrobenz-2-oxa-1,3-diazol-4-yl) amino]- 2-deoxy-glucose (2-NBDG) (Invitrogen #N13195, Waltham, MA, USA), was utilized as a probe for the detection of glucose uptake in cultured cells, as previously described [28]. Briefly, after 48 h transfection, cells were incubated with the 2-NBDG reagent (1 h). Cells were then trypsinized and analyzed by flow cytometry (BD FACS Aria III flow cytometer, San Jose, CA, USA) with excitation at 465 nm and emission at 540 nm.

2.7. Cell Viability Assay

Cell viability assay was conducted using the 3-(4,5-dimethylthiazol-2-yl)-2,5-diphenyl tetrazolium bromide (MTT) colorimetric assay (Sigma–Aldrich, St. Louis, MO, USA) as previously described [28]. MTT solution (10 μL) was added to transfected cells 48 h post-transfection and incubated at 37 °C for 3–4 h. The absorbance was read as 570 nm using a microplate reader (crocodile mini work-station; Crocodile Control Software) and the percentage of cell viability was calculated.

2.8. Apoptosis Assay

Transfected cells were cultured in RPMI medium in the presence and absence of a mixture of pro-apoptotic cytokines (IL-1β, 100 ng/mL; INFγ, 125 ng/mL and TNFα, 125 ng/mL) (Abcam, Cambridge, UK), as previously described [27]. Following 24 h incubation, the population of apoptotic cells was detected using the FITC Annexin-V kit (BD Biosciences, San Jose, CA, USA), as previously described [27]. Cells were analyzed using a BD FACS Aria III flow cytometer (Becton Dickinson Biosciences, San Jose, CA, USA).

2.9. Reactive Oxygen Species (ROS) Measurements

Intracellular ROS was detected using a ROS-Glo H2O2 assay kit (Cat #G8820, Promega, Madison, WI, USA). In brief, 48 h post-transfection, INS-1 cells were incubated with H2O2 substrate (3 h) at 37 °C. After incubation, ROS-Glo detection reagent (100 μL) was added to all wells and cells were incubated for another 20 min (RT). The relative luminescence was then detected using a plate reader [28].

2.10. Western Blot Analysis

Protein extractions were carried out using ice-cold NP-40 lysis containing protease inhibitor cocktail (Thermo Fisher Scientific, Waltham, MA, USA) [28]. The standard Bradford method (Bio-Rad, Hercules, CA, USA) measured the protein concentration. Western blot analyses were conducted, as previously described [28], using the following primary antibodies: MAPK8IP1 (anti-rabbit; 1:1000, #Ab24449, Abcam), Pro/Insulin (anti-mouse; 1:1000; #8138s, Cell Signaling Technology, Danvers, MA, USA), INSRβ (Anti-rabbit; 1:1000; #23413, Cell Signaling Technology, USA), PDX1 (anti-rabbit; 1:1000, #ab47267, Abcam, Cambridge, UK), MAFA (anti-rabbit; 1:1000, #ab264418, Abcam, Cambridge, UK), GLUT2 (anti-rabbit; 1:1000, #A12307, Abclonal), NEUROD1 (anti-rabbit; 1:1000, #ab213725, Abcam, Cambridge, UK), GCK (anti-rabbit; 1:100; #ab37796, Abcam, Cambridge, UK), VAMP2 (anti-rabbit; 1:1000, #13508, Cell Signaling Technology, USA), SNAP25 (anti-mouse, 1:1000, #MA5-17609, Invitrogen), JNK (anti-rabbit; 1:1000, #A48567, Abclonal), pJNK (anti-rabbit; 1:1000, #AP0631, Abclonal) or β-actin (anti-mouse, 1:1000, #A5441, Sigma–Aldrich, Taufkirchen, Germany). Horseradish peroxidase-linked anti-rabbit (#7074S, Cell Signaling Technology, USA) or anti-mouse (#7076S, Cell Signaling Technology, USA) antibodies were used as secondary antibodies. Quantification of the protein bands using the Bio-Rad Image Lab software (ChemiDocTM Touch Gel Western Blot Imaging System; Bio-Rad, Hercules, CA, USA) and the β-actin was employed as an internal control.

2.11. Statistical Analysis

Unless otherwise stated, the data are presented as means ± SEM (standard error of the mean) or ± SD (standard deviation) from at least three independent experiments, as indicated in each experiment in figure legends. The median MAPK8IP1 expression between the two groups in human islets was compared using the non-parametric Mann–Whitney test. The correlation between the expression of MAPK8IP1 and other genes/variables was determined using the non-parametric Spearman test. For the qPCR, Western blotting, cell viability, and insulin secretion experiments, the differences between negative control and MAPK8IP1-silenced cells were compared using the Student’s T-test. All the statistical analyses were conducted using GraphPad Prism (version 8.0.0 for Windows, GraphPad Software, San Diego, CA, USA, www.graphpad.com, accessed on 1 October 2022). p-values < 0.05 were considered significant. * indicates results with p < 0.05, ** p < 0.01, *** p < 0.001.

3. Results

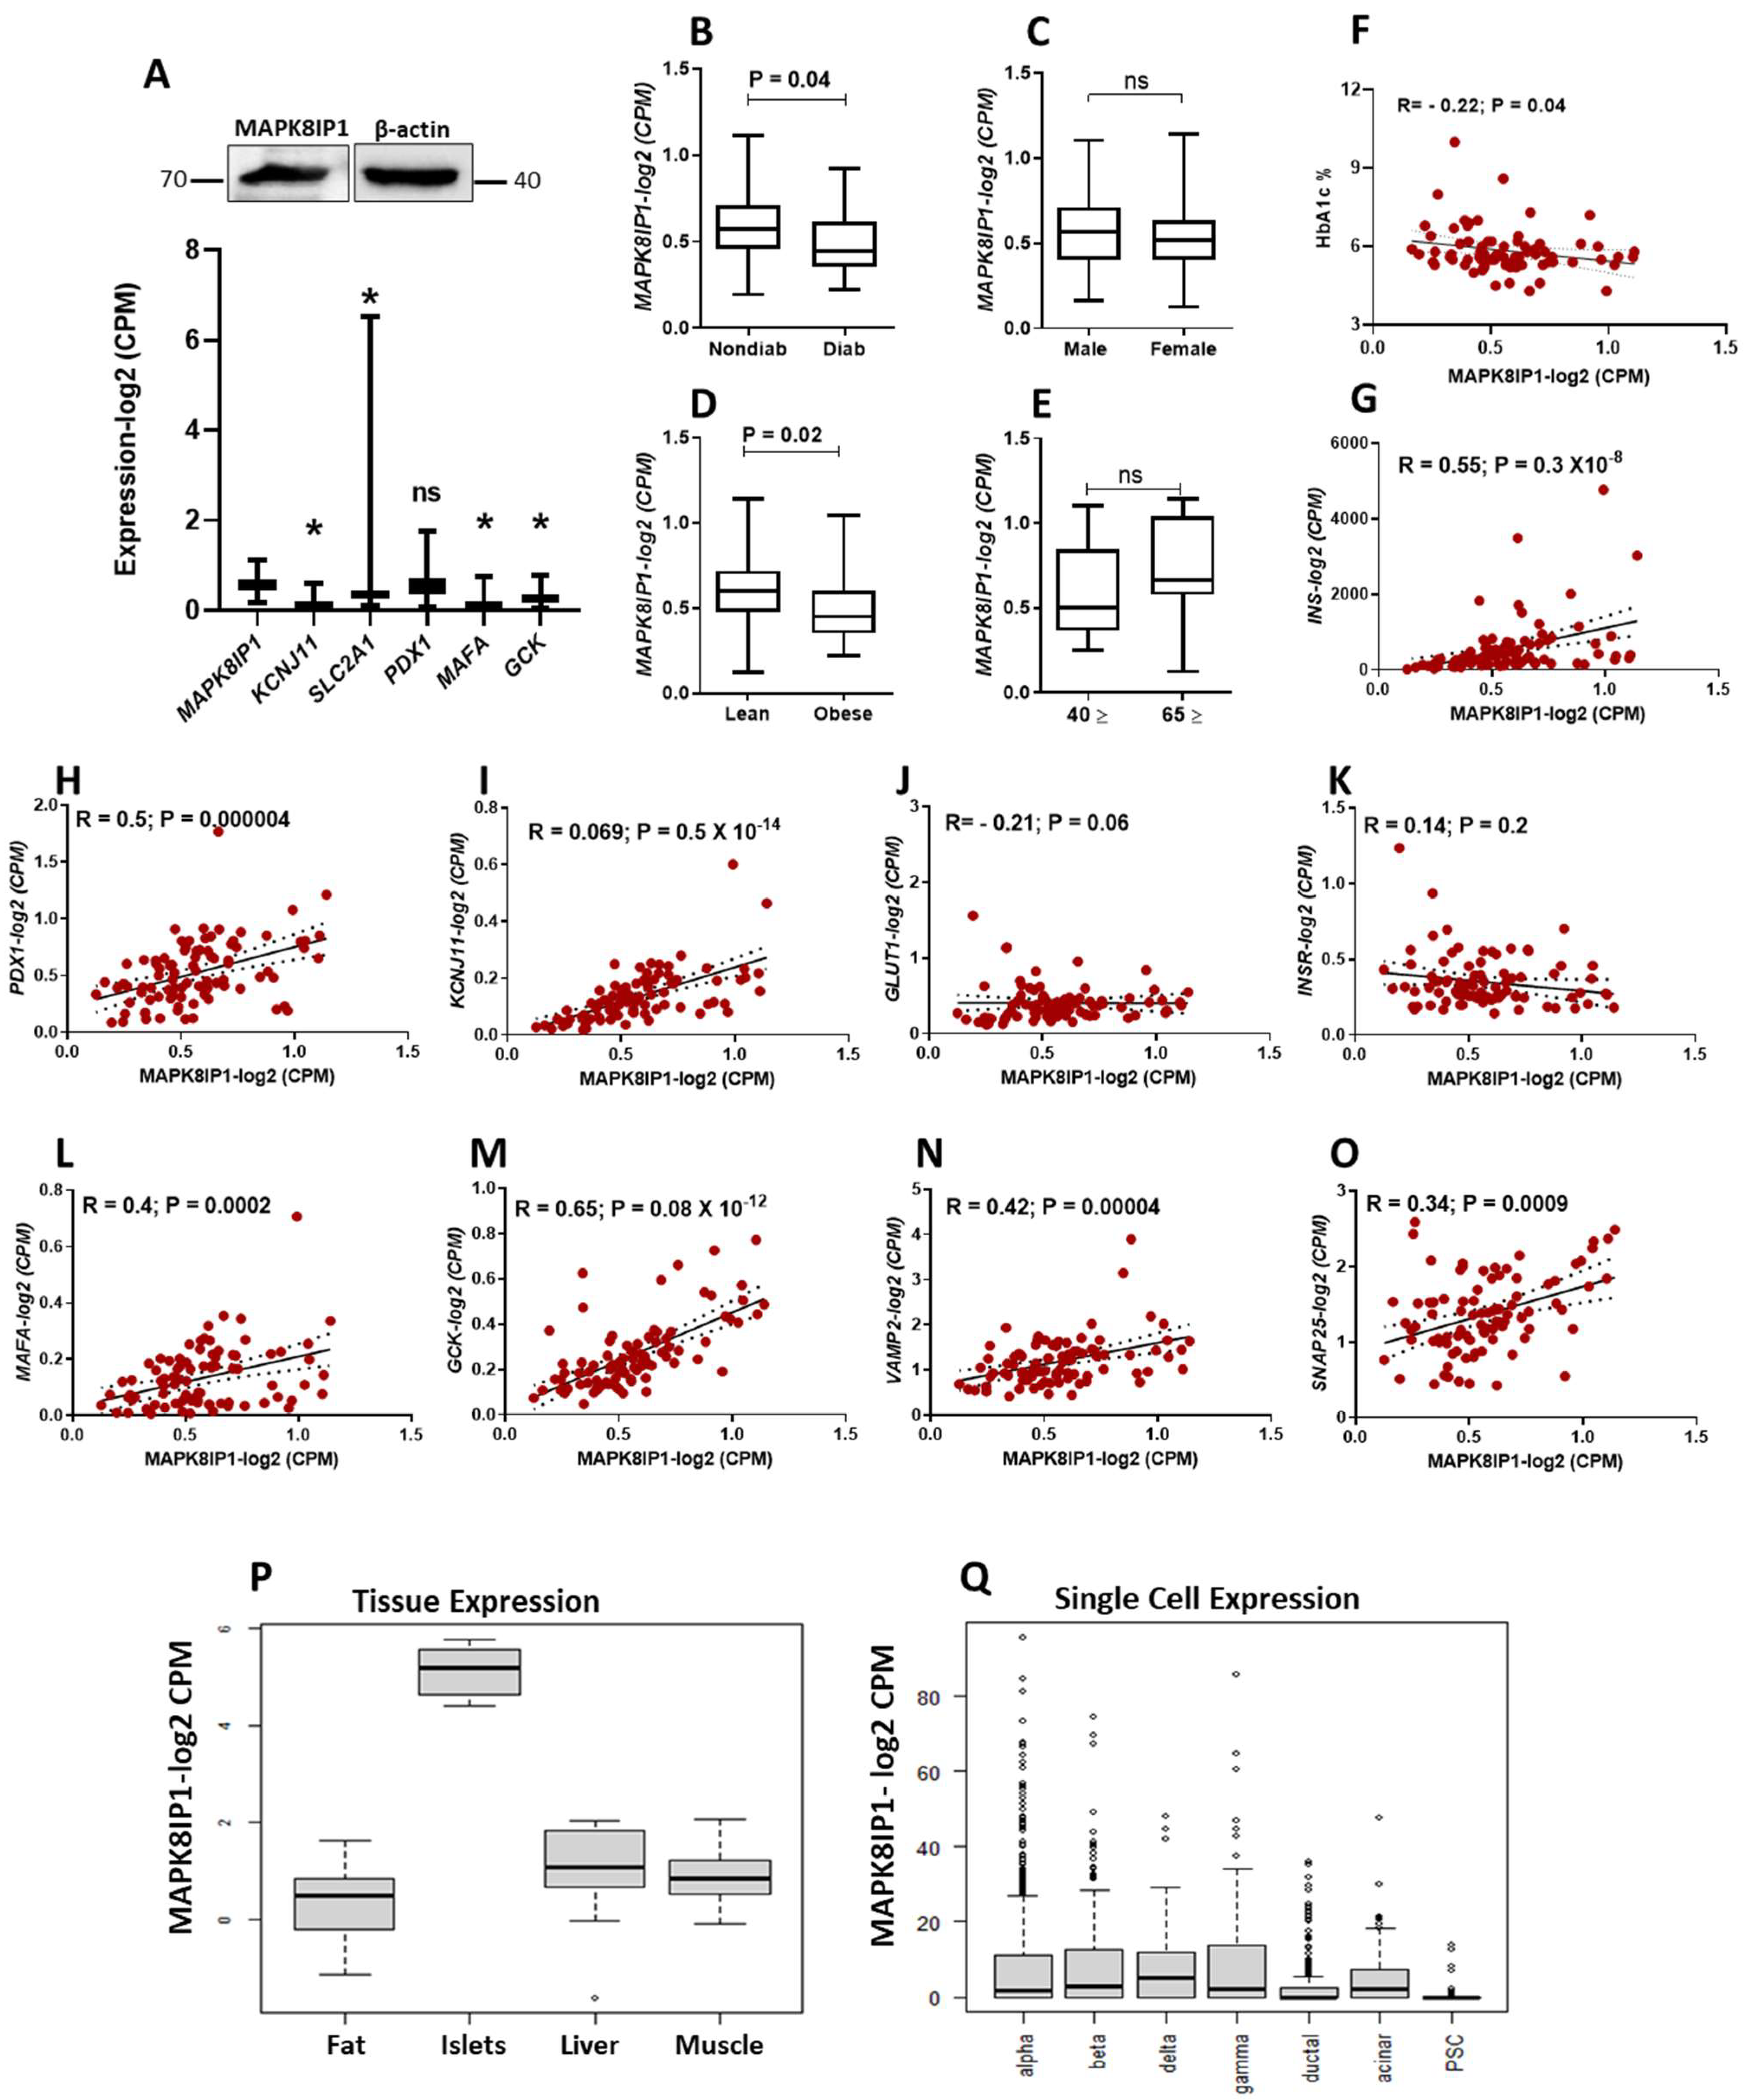
3.1. Expression Profile of MAPK8IP1 in Diabetic and Non-Diabetic Human Pancreatic Islets

To understand whether MAPK8IP1 has a potential role in the function of pancreatic β-cells, we first explored its mRNA expression in healthy human pancreatic islets (n = 57) using published RNA-seq gene expression data (https://www.ncbi.nlm.nih.gov/geo/query/acc.cgi?acc=GSE50398, accessed on 1 February 2020) [23]. As shown in the lower panel of Figure 1A, expression analysis revealed that MAPK8IP1 is expressed in healthy human islets. Remarkably, the expression of MAPK8IP1 was higher than some functional β-cell genes, including KCNJ11 or SLC2A1 (GLUT1), MAFA, and GCK genes (Figure 1A, lower panel). PDX1 exhibited an expression profile comparable to that of MAPK8IP1 (p > 0.05). Moreover, we confirmed the expression of MAPK8IP1 in human islets at protein levels from non-diabetic islets (n = 1, obtained from Prodo Lab, Aliso Viejo, CA, USA) (Figure 1A, upper panel). Exploration of the effect of diabetes/hyperglycemia status on the mRNA expression of MAPK8IP1 showed a significant reduction in the case of diabetic/hyperglycemic islets (HbA1C ≥ 6%; n = 21) compared to nondiabetic/normoglycemic islets (HbA1c < 6%; n = 50) (p = 0.04) (Figure 1B). We noticed a significant decrease in the expression of MAPK8IP1 in obese donors (BMI > 29; n = 20) compared to lean donors (BMI < 25; n = 39) (p < 0.05) (Figure 1D). However, no differences in mRNA expression of MAPK8IP1 were observed based on gender (male, n = 54 versus female, n = 36) or age (old donors ≥ 65, n = 9 versus young ≤ 40, n = 14) (Figure 1C,E). The expression of MAPK8IP1, however, correlated negatively with HbA1c levels (Figure 1F). Next, we correlated the expression of MAPK8IP1 with the expression of pancreatic β-cells’ key functional genes. MAPK8IP1 expression correlated positively (p < 0.05) with that of INS, KCNJ11, PDX1, MAFA, GCK, VAMP2, and SNAP25 and negatively with that of GLUT1 (Figure 1G–O). INSR expression showed a non-significant correlation with MAPK8IP1 (Figure 1K). Furthermore, the Islet Gene View (IGV) web tool (https://mae.crc.med.lu.se/IsletGeneView/, accessed on 1 October 2022) was used to assess MAPK8IP1 expression in different metabolic tissues [29]. As shown in Figure 1P, MAPK8IP1 showed high expression in human islets compared to other metabolic tissues. Using IGV data, we also highlighted the expression of MAPK8IP1 in sorted pancreatic endocrine cells. Pancreatic β-cells showed expression levels of MAPK8IP1 similar to those of other endocrine cells but higher than those of ductal and PSC cells. Among sorted endocrine cells, MAPK8IP1 expression in delta cells showed the highest expression level (Figure 1Q). Finally, based on GTEx data (www.gtexportal.org, accessed on 1 October 2022). GTEx Analysis Release V8; dbGaP Accession phs000424 v8, p2), distinct levels of MAPK8IP1 expression were also detected across diverse human tissue, with neurons and brain tissue showing higher MAPK8IP1 expression than other tissues (Figure S1).

3.2. Exploration of T2D Genetic Variants in MAPK8IP1

Using the recently developed tool “TIGER portal” (http://tiger.bsc.es, accessed on 1 February 2022) [25], we examined whether MAPK8IP1 contains any T2D-associated genetic variants (single nucleotide polymorphism, SNP). Three different data sets were searched (70K for T2D project, DIAGRAM Diamante, and DIAGRAM 1000 G). The top T2D-associated genetic variants of each dataset are listed in Table 2. We found that rs7115753 passes the significance threshold at the genome-wide significance threshold (p < 5.0 × 10⁻⁸). Moreover, we explored GWAS datasets for the association by utilizing the T2D Knowledge Portal (T2DKP, containing 375 datasets and 377 traits) database of rs7115753, rs11038677, and rs553011963 with T2D and other related traits. The rs7115753 showed a significant association with fasting glucose adjusted to BMI (p = 9.76 × 10−51), fasting glucose (p = 2.75 × 10⁻¹³), T2D adjusted with BMI (p = 1.37 × 10⁻⁷), and T2D (p = 1.62 × 10⁻⁷). Similarly, rs11038677 showed a significant association with fasting glucose adjusted to BMI (p = 2.45 × 10⁻²⁴), fasting glucose (p = 2.37 × 10⁻⁸), and T2D adjusted with BMI (p = 3.59 × 10⁻⁷) (Table 3).

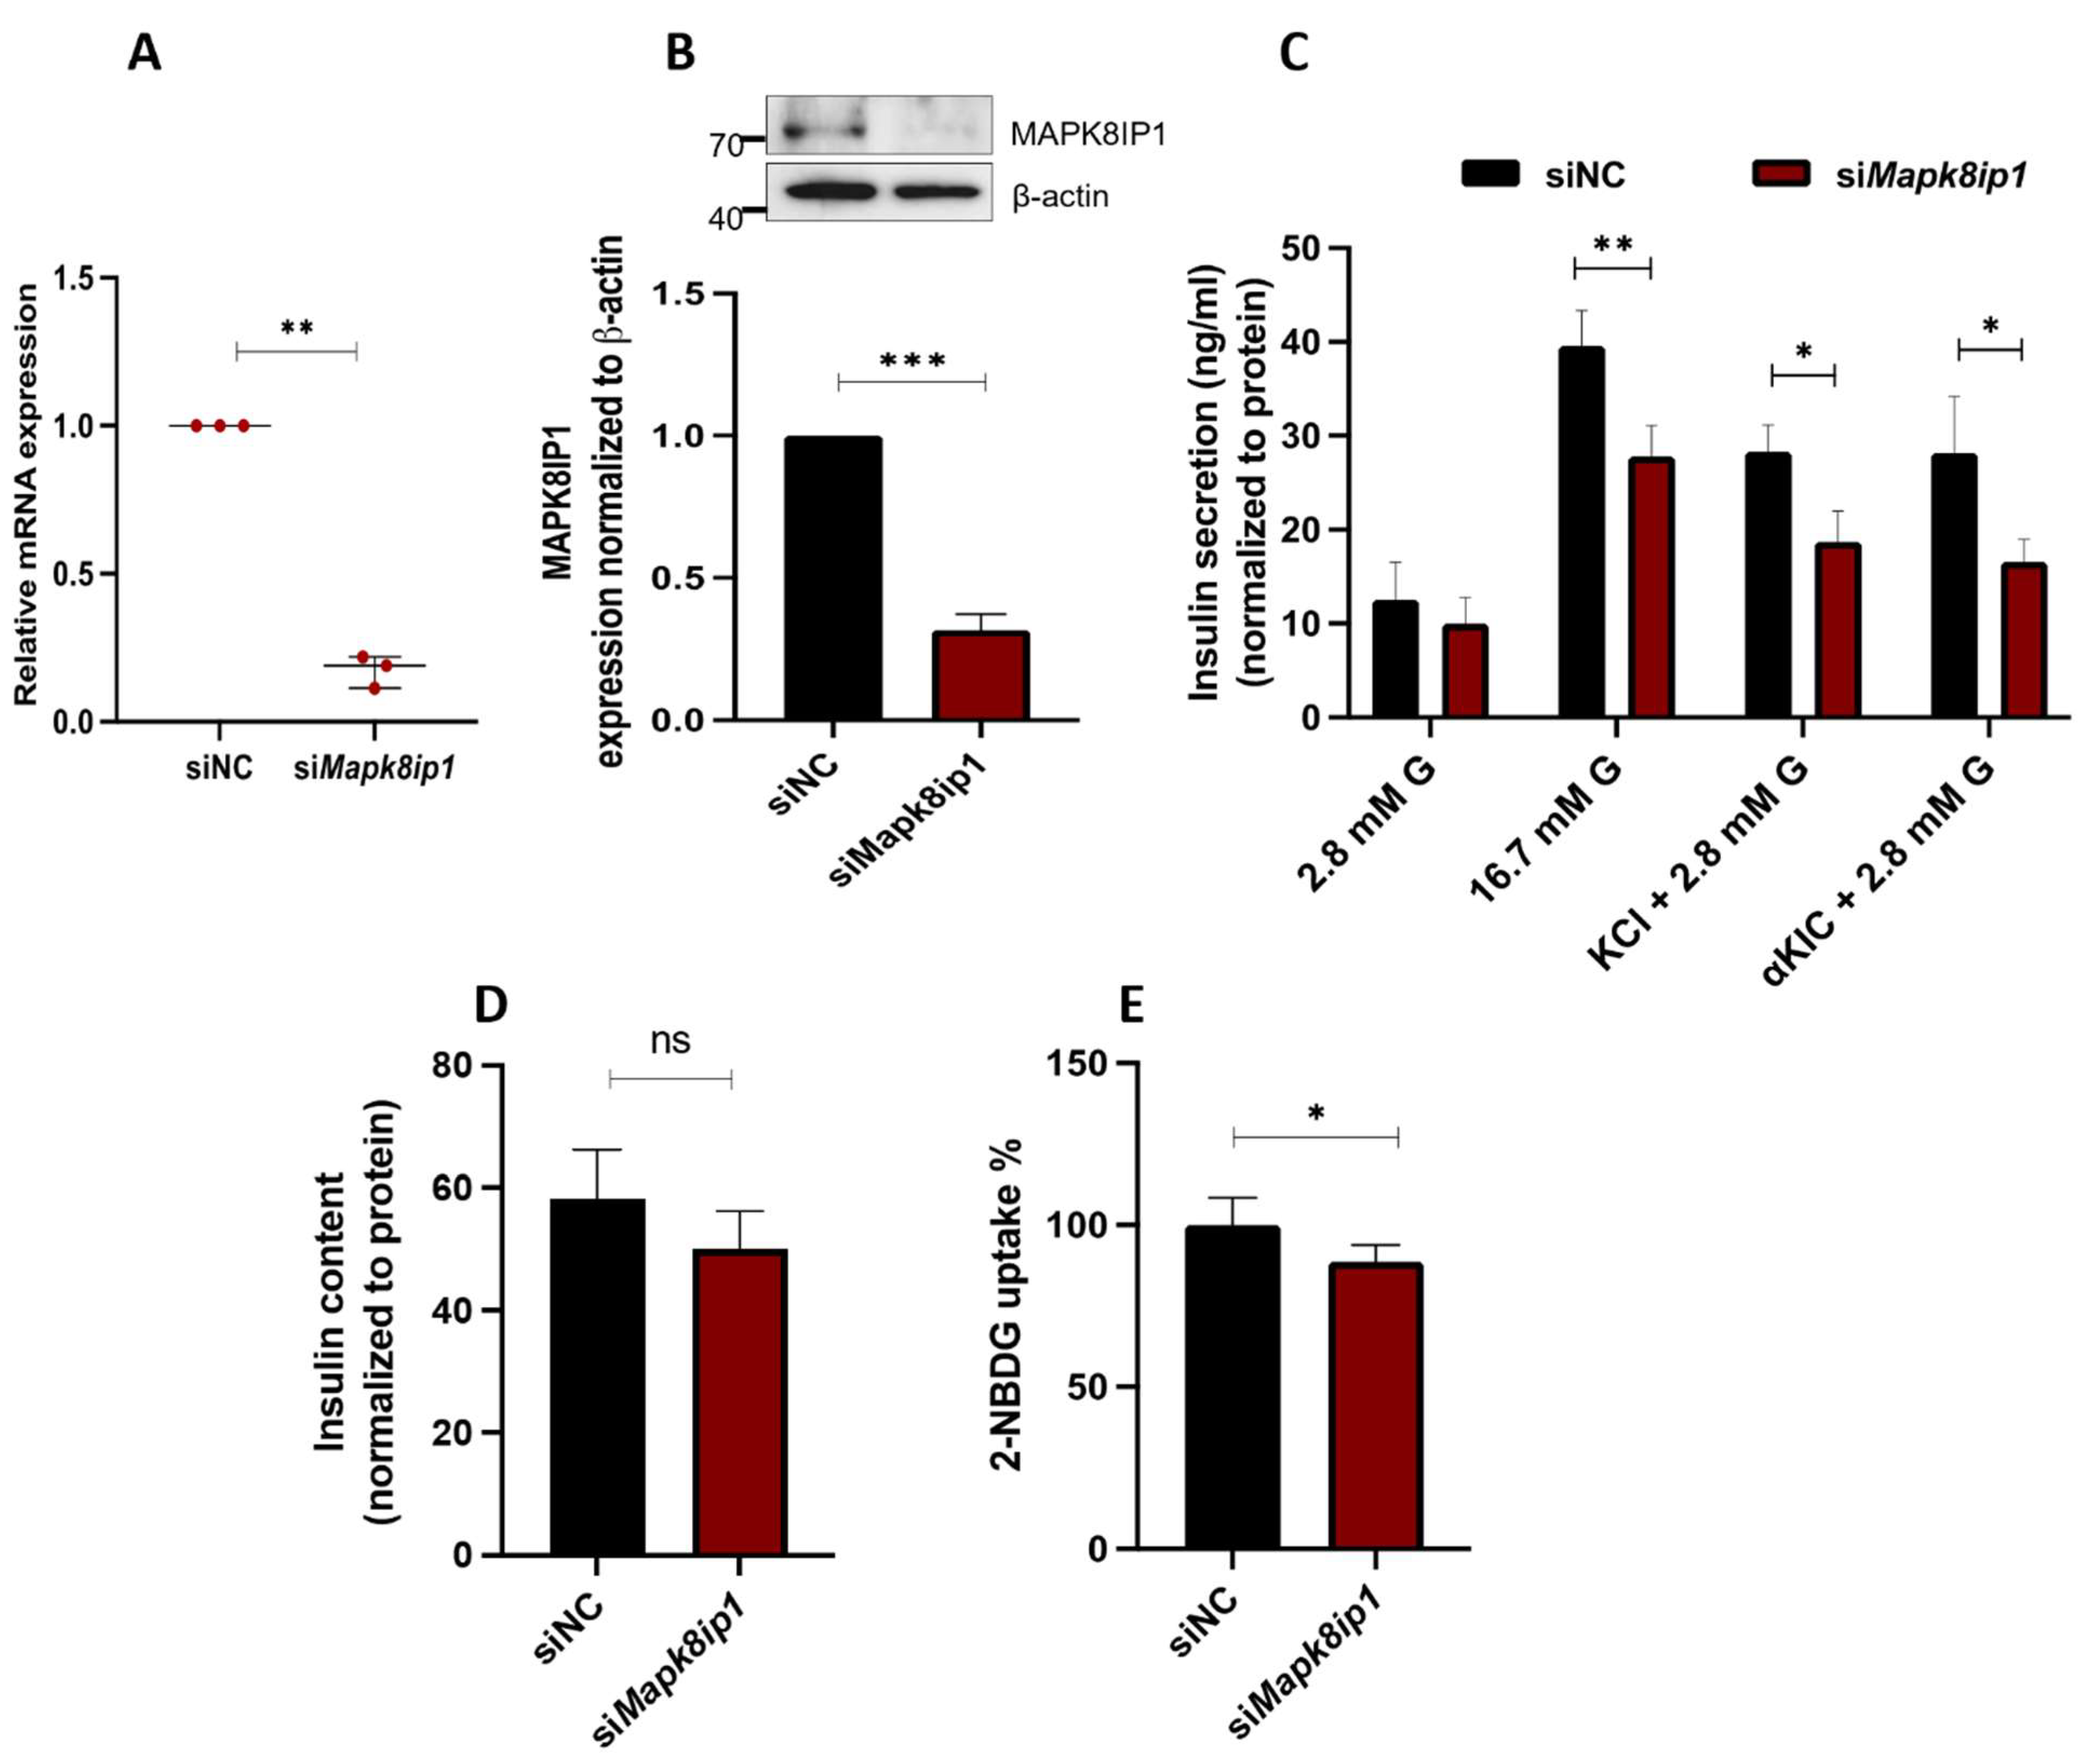
3.3. Silencing of Mapk8ip1 in INS-1 (832/13) Cells Affects Insulin Secretion and Glucose Uptake

To understand the impact of Mapk8ip1 on the function of pancreatic β-cells, we used a pool of siRNA sequences to ablate its expressions in INS-1 (832/13) cells. Expression analysis of Mapk8ip1 48 h post-transfection, assessed by qPCR, demonstrated a significantly lower expression in silenced cells (~82%; p < 0.05) than in negative control cells (Figure 2A). This was further confirmed by Western blot analysis (~60%; p < 0.05) (Figure 2B). To evaluate the consequences of Mapk8ip1 silencing on insulin secretion, transfected cells were incubated (1 h) with 2.8 mM glucose (basal level) or 16.7 mM glucose (stimulation level). As shown in Figure 2C, a significant reduction in GSIS at 16.7 mM glucose (~30%; p < 0.05) was observed in Mapk8ip1-silenced cells compared to control cells. However, no change was noticed at the basal level (2.8 mM glucose).
Moreover, the effect of Mapk8ip1 silencing on the insulin exocytosis machinery was evaluated by stimulating the transfected cells with 35 mM potassium chloride (a depolarizing agent) or 10 mM alpha ketoisocaproic acid (an agent that stimulates mitochondrial metabolism and ATP synthesis) for 1 h. As illustrated in Figure 2C, significant reductions in KCl-stimulated (~33%; p < 0.05) and α-KIC-stimulated (~40%; p < 0.05) insulin secretion were observed, compared to the negative control. On the other hand, no significant change was observed upon measurement of insulin content in Mapk8ip1-silenced cells compared to the control cells (Figure 2D). Finally, silencing of Mapk8ip1 exhibited a significant reduction (~15%; p < 0.05) in the level of glucose uptake, as determined by 2-NBDG assay, compared to control cells (Figure 2E).

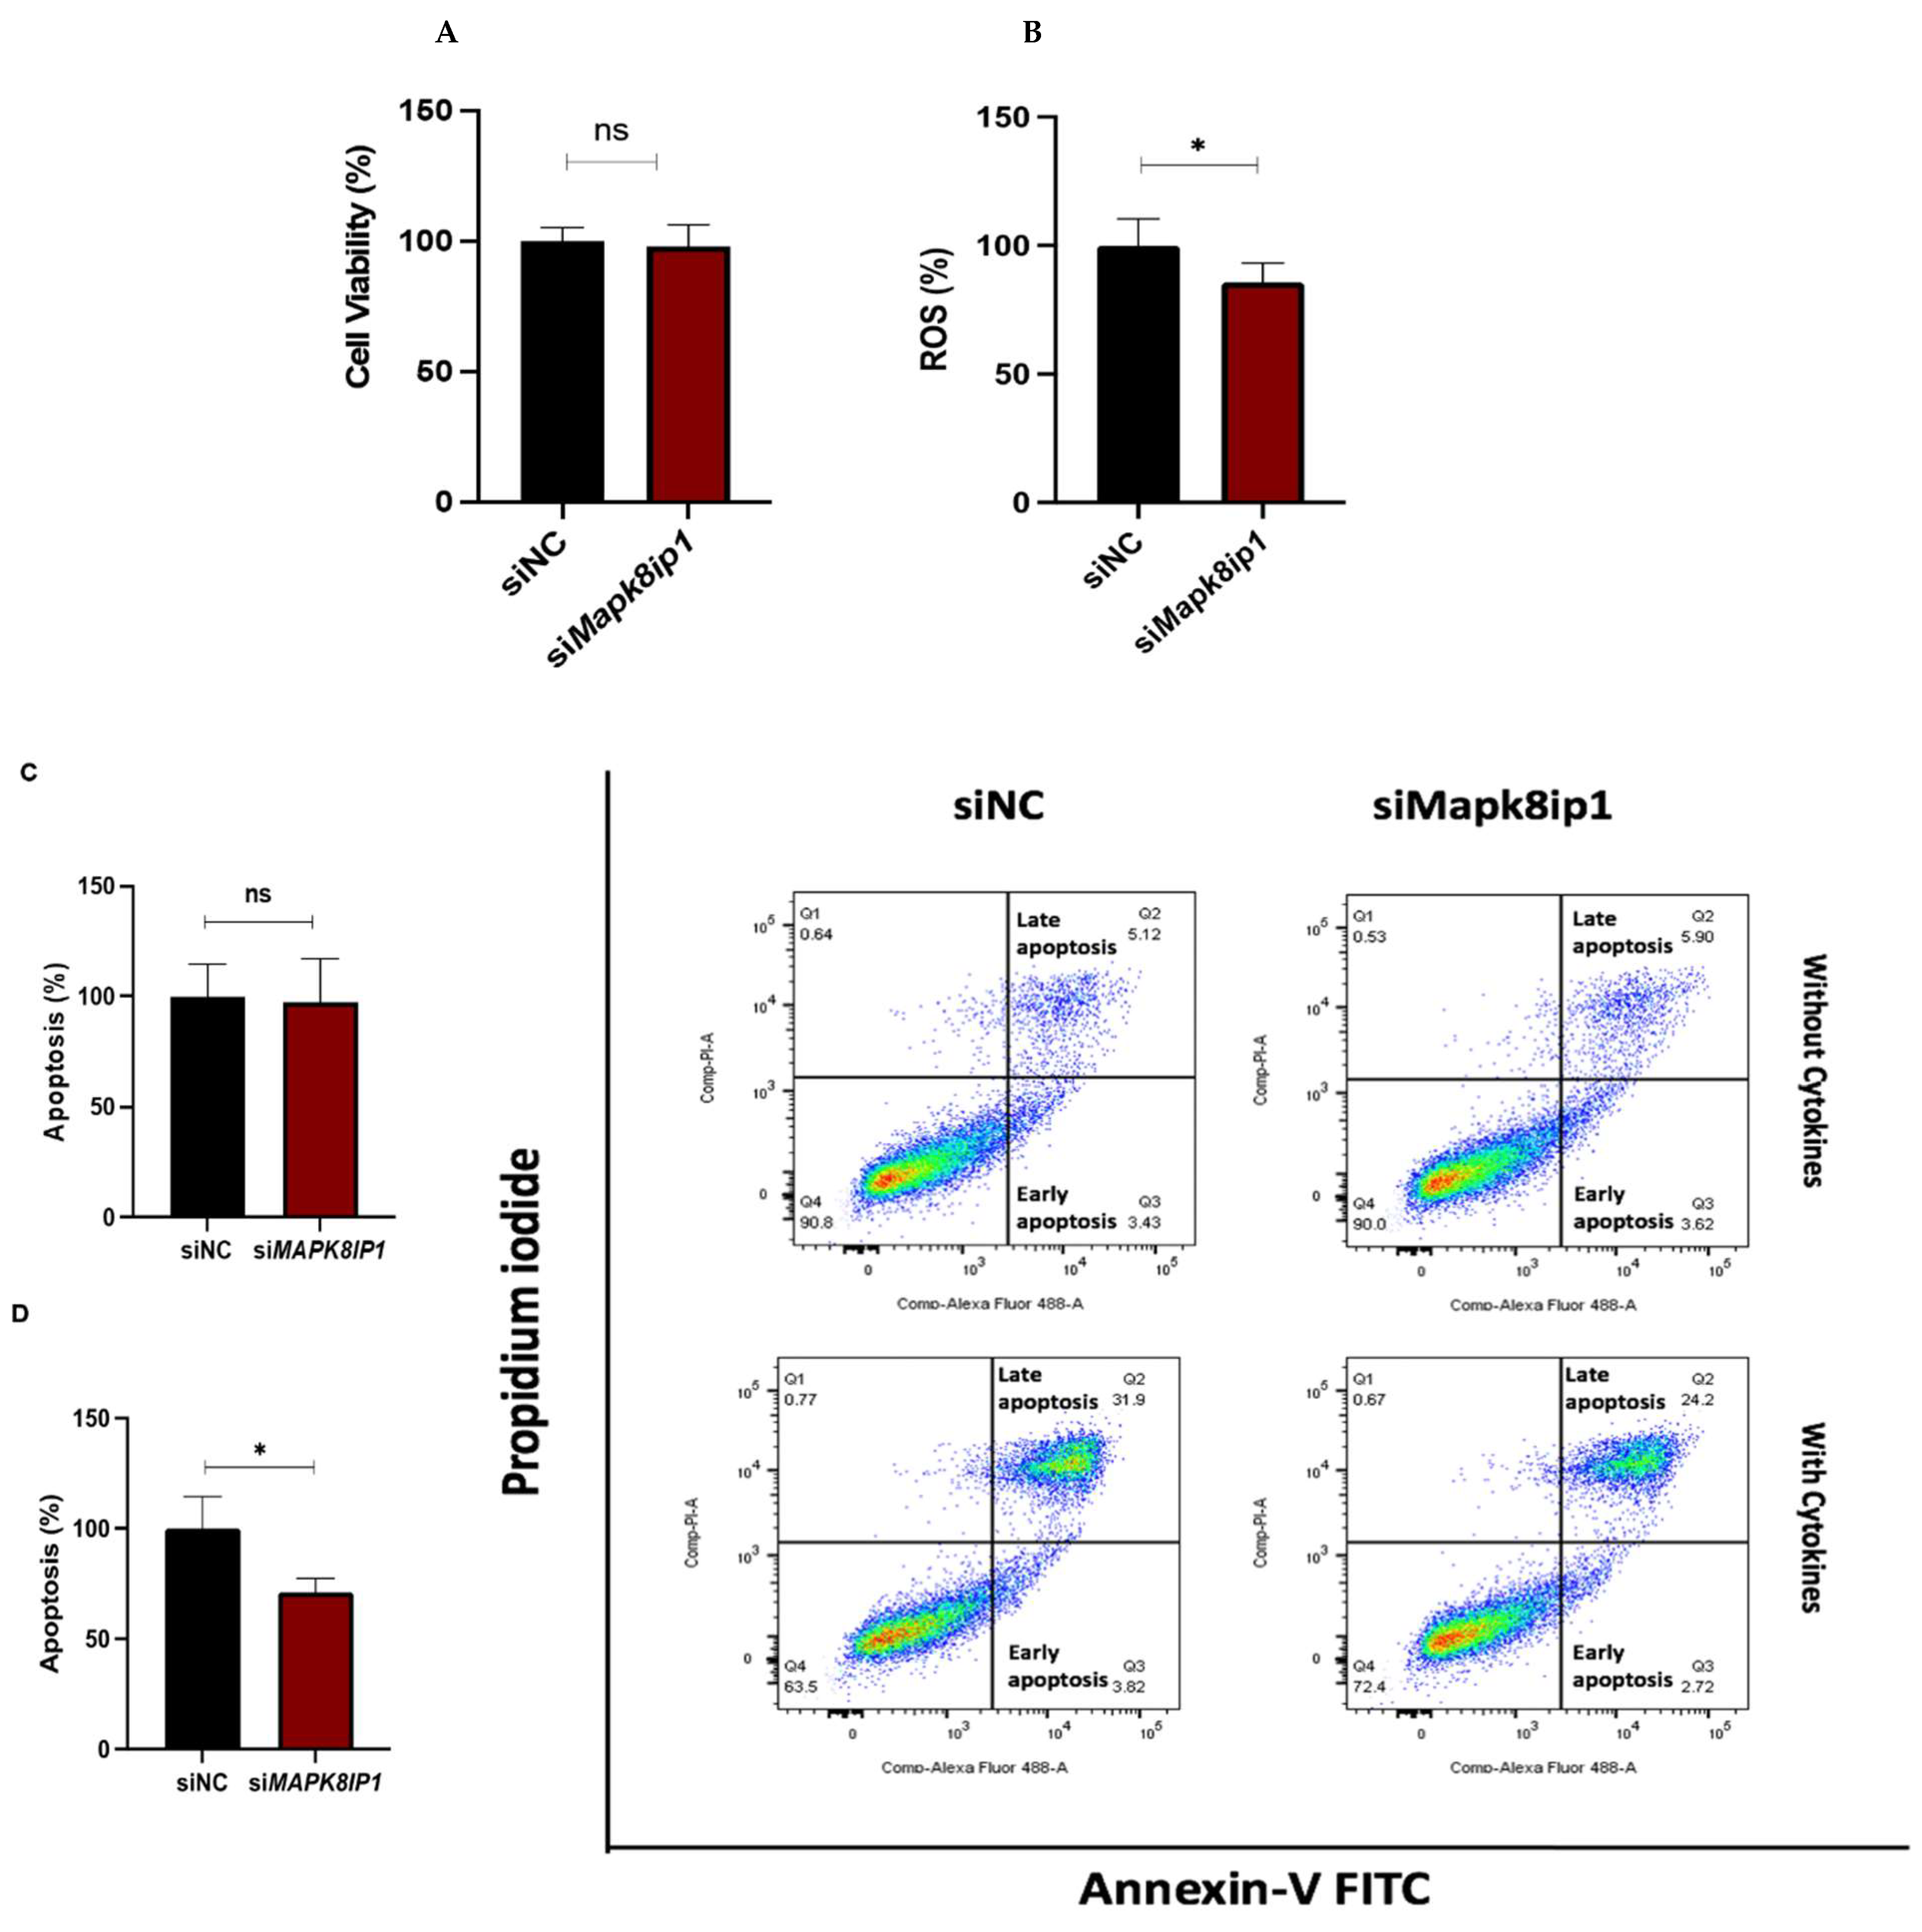
3.4. Effect of Mapk8ip1 Silencing on Cell Viability, Apoptosis, and ROS in INS-1 (832/13) Cells

Herein, we studied the effect of Mapk8ip1 silencing on cell viability, apoptosis, and ROS production. As illustrated in Figure 3A, the assessment of cell viability using MTT assay showed no differences between Mapk8ip1-silenced cells and the negative control cells. However, we noticed a significant reduction in intracellular ROS production (14%, p < 0.05) in Mapk8ip1-silenced cells compared to that in control cells (Figure 3B). On the other hand, the percentage of apoptotic cells assessed by Annexin-V staining in the absence of pro-apoptotic cytokines showed no difference in Mapk8ip1-silenced cells compared to control cells (Figure 3C). However, Mapk8ip1-silenced cells, in the presence of a mixture of pro-apoptotic cytokines (IL-1β, TNFα, and INFγ) for 24 h, showed a significant reduction (~29%) in cytokine-induced apoptosis compared to negative control cells (p < 0.05) (Figure 3D).

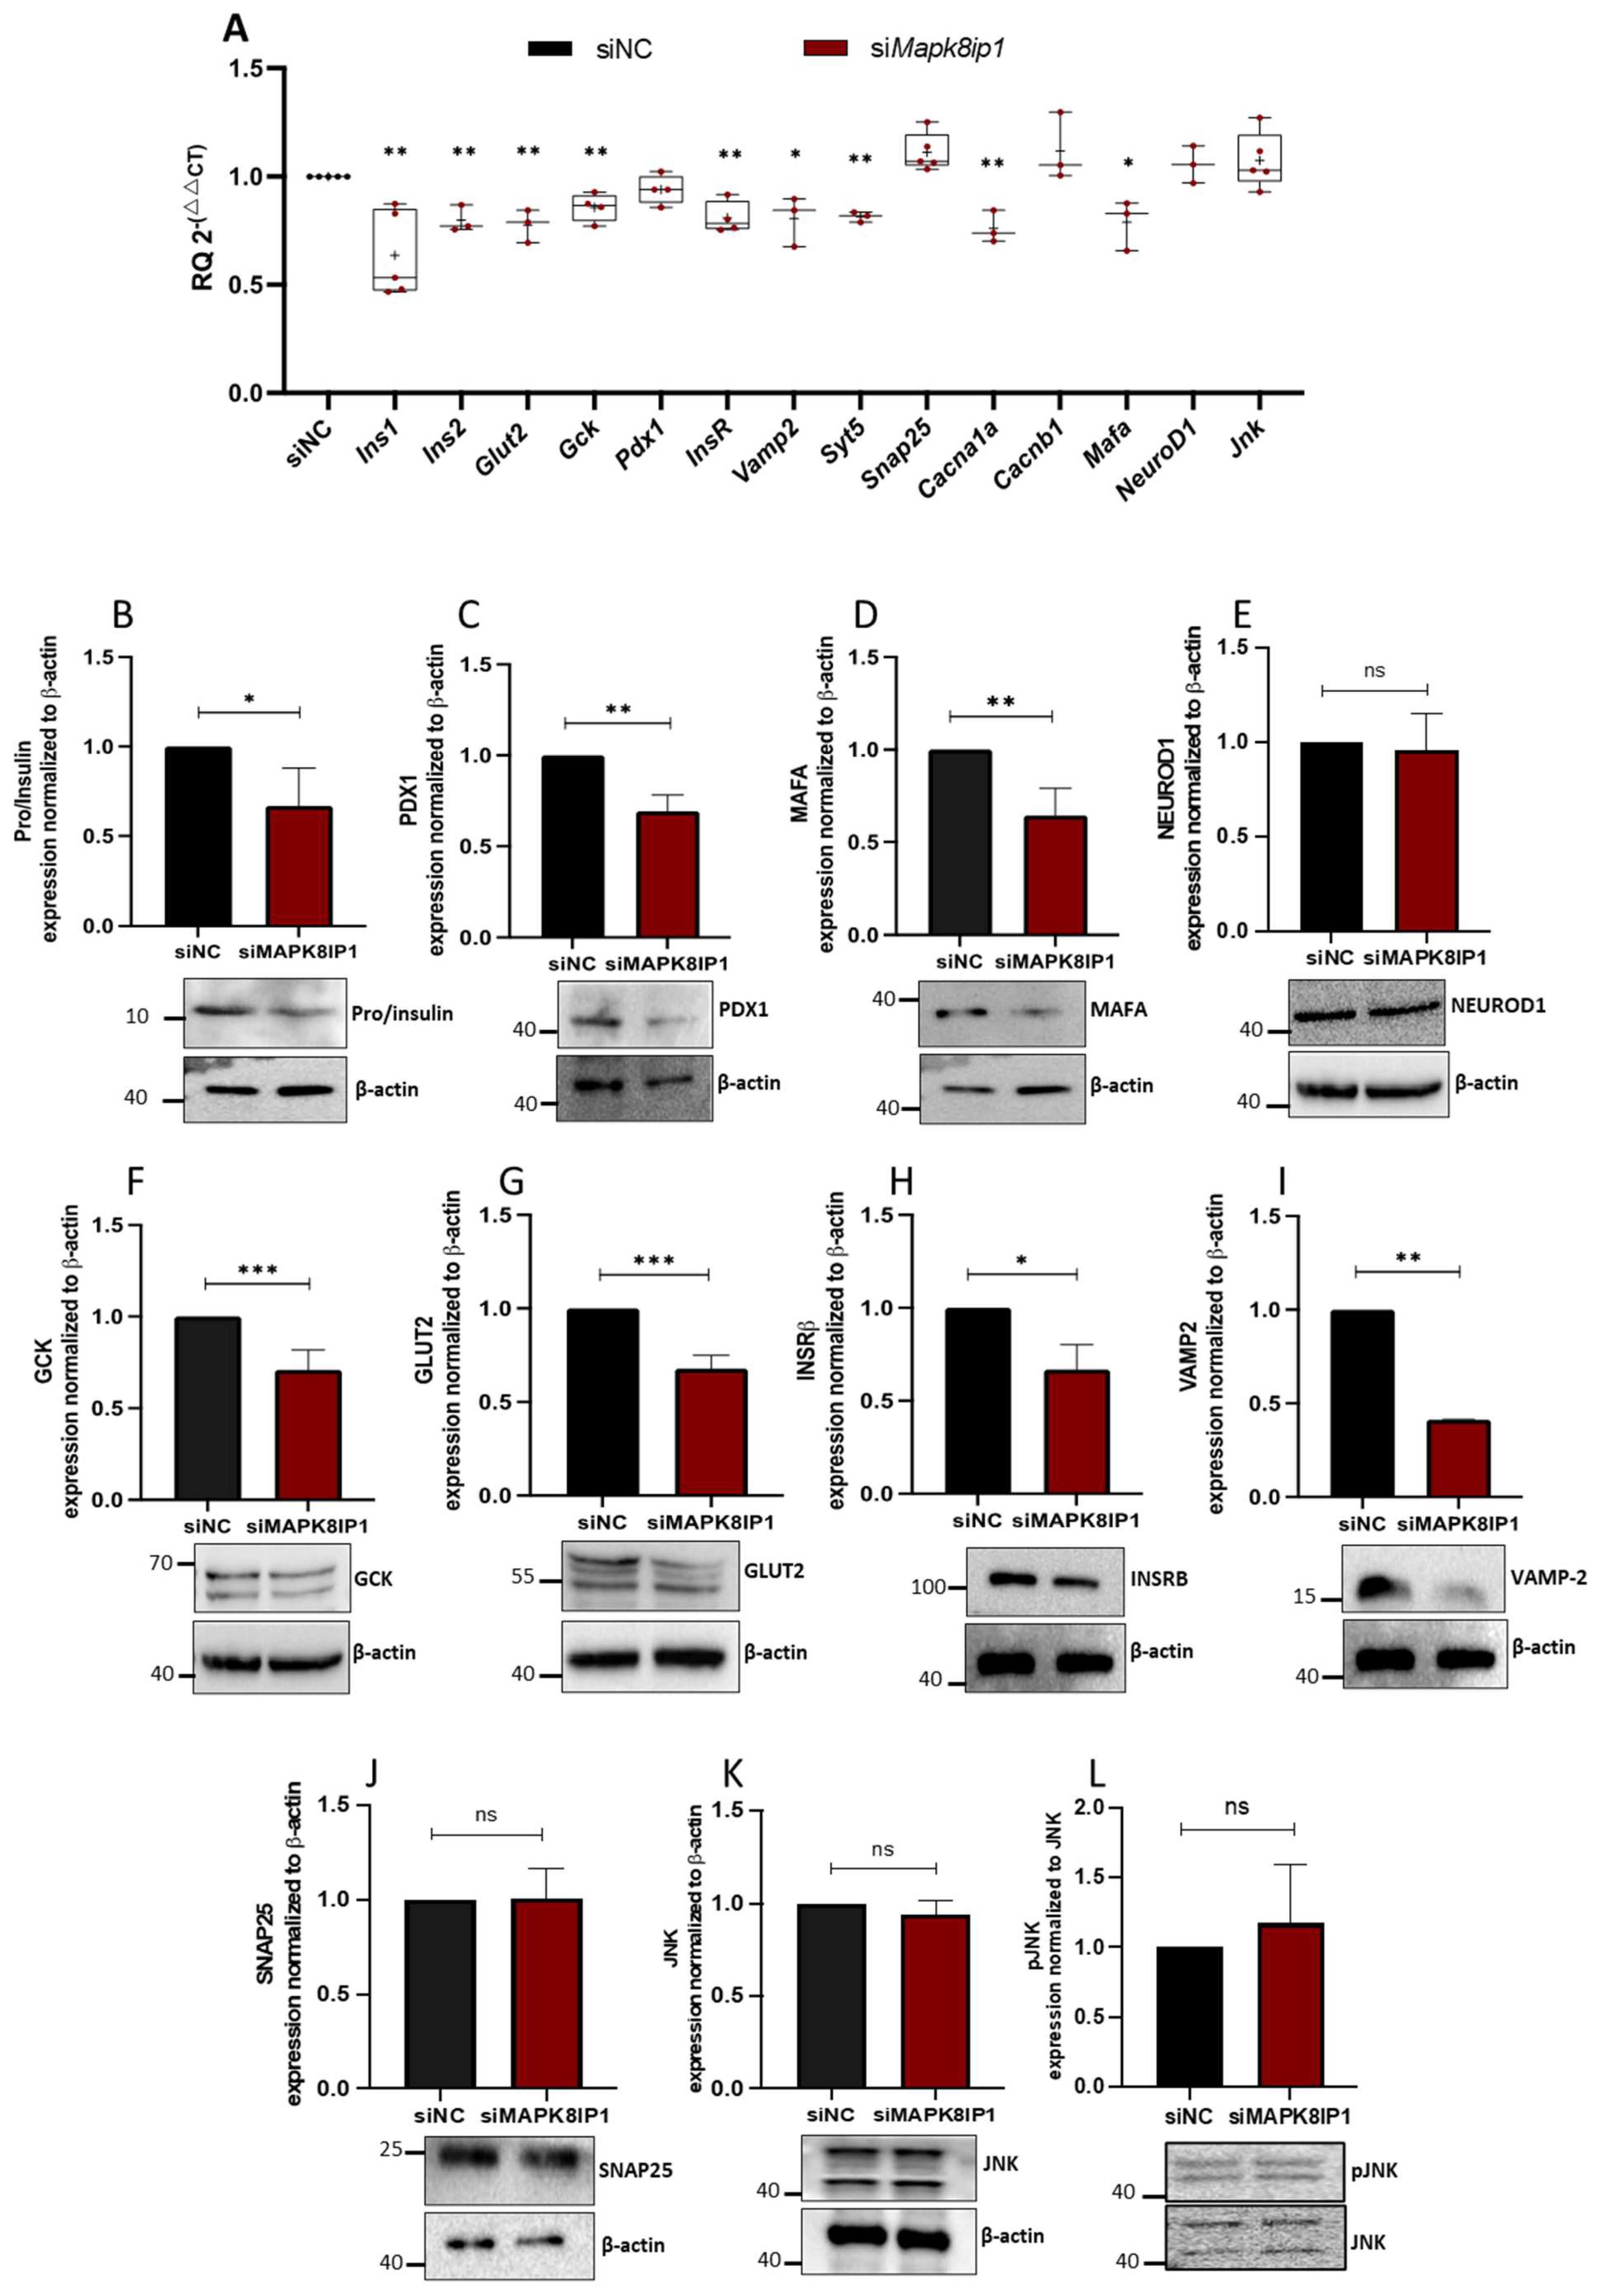
3.5. Mapk8ip1 Silencing Modifies the Expression of β-Cell Function-Related Genes

We next investigated the impact of Mapk8ip1 silencing on the expression of functional genes in β-cells at transcriptional and translational levels. As illustrated in Figure 4A, transient silencing of Mapk8ip1 in INS-1 cells was linked with a significant reduction (p < 0.05) in mRNA levels of genes involved in insulin biosynthesis (Ins1, Ins2, MafA), glucose sensing genes (Glut2, Gck), and insulin exocytotic regulatory genes (Cacna1a, Vamp2, Syt5) compared to those in control cells (Figure 4A). Expression of Pdx1, NeuroD1, Cacnb1, Snap25, and Jnk was not significantly affected. In addition, expression of Insr, which is involved in insulin signaling, was decreased (p < 0.05) in Mapk8ip1-silenced cells at the mRNA level (Figure 4A). At protein levels, a significant downregulation (p < 0.05) was observed in pro/insulin (~33%), PDX1 (~30%), MAFA (~35%), GCK (~29%), GLUT2 (~30%), INSRβ (~33%), and VAMP2 (~58%) in Mapk8ip1-silenced cells versus control cells (Figure 4B–L). In contrast, protein expression of NEUROD1, SNAP25, JNK, and phosphorylated JNK (pJNK) was not affected (Figure 4B–L). The replicas of the full-length Western blot expressions after Mapk8ip1 silencing are displayed in Figures S2–S4.

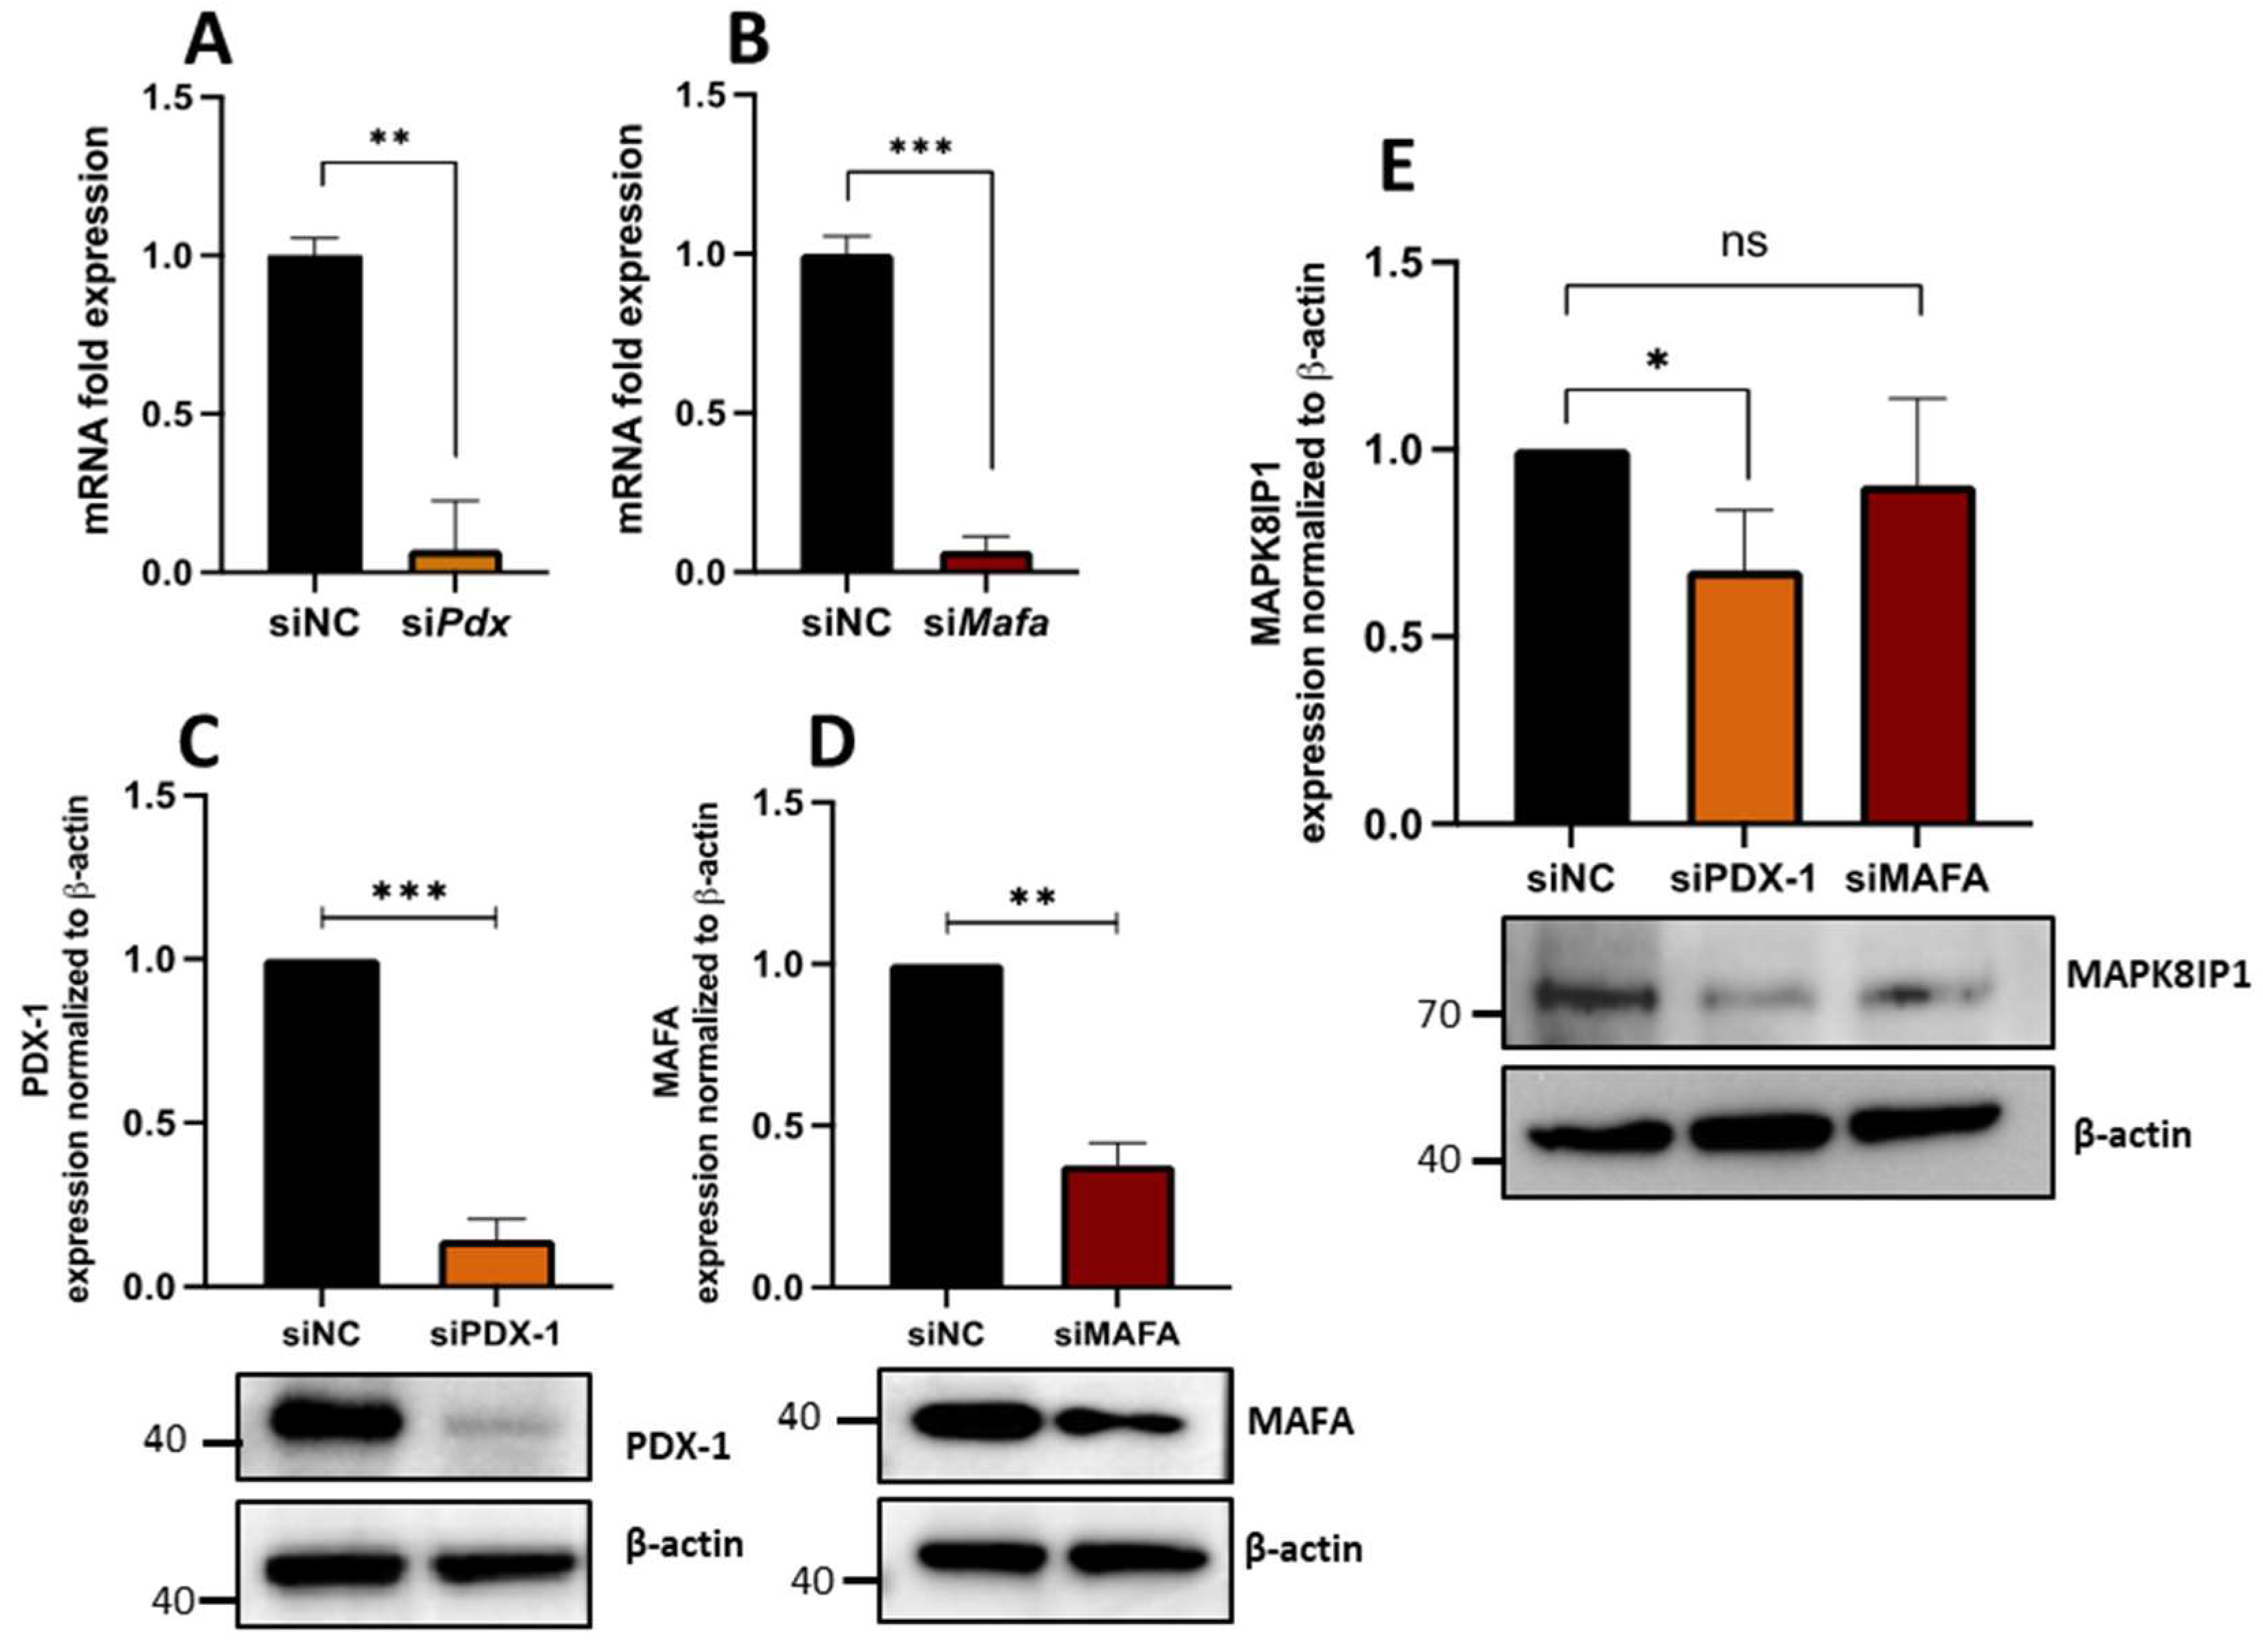
3.6. PDX1 Is Required for Proper MAPK8IP1 Expression in β-Cells

The transcription factors PDX1 and MAFA are critical regulators for β-cell identity and function [30,31,32,33]. To determine if the loss of Pdx1 or MafA in β-cells affects Mapk8ip1 expression in INS-1 cells, we silenced the expression of both genes (Pdx1 and MafA), followed by measurement of MAPK8IP1 expression levels. As shown in Figure 5A,B, siRNA silencing of Pdx1 or MafA significantly reduced the expression of each gene (p < 0.001), as determined by qPCR analysis. Knockdown was further validated at protein levels (p < 0.001) (Figure 5C,D). Notably, a significant downregulation of MAPK8IP1 expression was observed in Pdx1-silenced cells (p < 0.05) compared to control cells (Figure 5E). However, MAPK8IP1 expression in MafA-silenced cells was not affected (Figure 5E). The replicas of the full-length Western blot expression after siMafA and siPdx1 silencing are shown in Figures S5–S7.

4. Discussion

Although the expression of MAPK8IP1 and its function as a transactivator of the glucose transporter gene (GLUT2) have been demonstrated in pancreatic β-cells [8], its role in the physiology of β-cells is not fully clear and is subject to great controversy. This work presents an elaborative study that used a combined analysis of publicly available data and new functional studies to investigate different perspectives of the role of MAPK8IP1 in the physiology of β-cells. In the present study, we demonstrated that MAPK8IP1 is present in human islets and that expression was reduced in diabetic or obese donors. Furthermore, expression of MAPK8IP1 was correlated with insulin expression and the key transcription factors in β-cells. In the search for T2D-associated genetic variants in MAPK8IP1 using the TIGER portal, we found that rs7115753 passes the genome-wide significance threshold for association with T2D. Moreover, expression silencing of Mapk8ip1 in INS-1 cells reduced insulin secretion, ROS, and glucose uptake levels.
In contrast, insulin content, cell viability, and apoptosis in the absence of added cytokines (IL-1β, INFγ, and TNFα) were not affected. We also demonstrated that Mapk8ip1 silencing reduced cytokines-induced apoptosis and altered the expression of several pancreatic β-cell functional genes at the mRNA and protein levels. Taken together, our findings suggest that MAPK8IP1 is an important component of pancreatic β-cell physiology and insulin secretion.
Expression mapping of MAPK8IP1 in human islets showed high expression relative to other restricted β-cell functional genes such as KCNJ11 and MAFA (Figure 1A). Furthermore, MAPK8IP1 expression was revealed to be lower in other metabolic tissues, such as liver tissues, adipose tissues, or muscle tissues, compared to human islets. We also highlighted the expression of MAPK8IP1 in sorted pancreatic endocrine cells, where pancreatic β-cells showed expression levels of MAPK8IP1 that were similar to those of other endocrine cells but higher than those of ductal and PSC cells. These data are in line with another RNA-seq study that reported that the expression of MAPK8IP1 in human β-cells was 5.4 (normalized expression values), 5.2 in α-cells, and 4.9 in exocrine cells [34]. Thus, these data suggest that MAPK8IP1 is expressed in both endocrine and exocrine pancreatic cells.
On the other hand, our findings showed that MAPK8IP1 is reduced in diabetic/hyperglycemic islets. This raises the question of whether the reduction of MAPK8IP1 is involved in the pathogenies of T2D or just a consequence of hyperglycemia exposure (glucotoxicity). A study by Ottosson-Laakso et al. found that short-term incubation of human islets in high glucose concentrations showed no change in the expression of MAPK8IP1 [35], which rules out the impact of short-term glucotoxicity. However, the effect of long-term exposure needs further investigation. Although it is still premature to claim that the observed reduction in MAPK8IP1 in diabetic islets is involved in the pathophysiology of diabetes, the negative correlation of MAPK8IP1 expression with HbA1c levels and positive correlation with β-cell functional genes indicates the important role of MAPK8IP1 in the physiology of β-cell. A third possible explanation behind the reduction of MAPK8IP1 in diabetic islets could be a compensatory mechanism that regulates the expression.
Among the top genetic variants in the proximity of MAPK8IP1, we found that rs7115753 passed the genome-wide significance for the association with T2D. The rs7115753 is an intronic SNP located at chr11:45890462 (hg38/Human) and may not directly influence MAPK8IP1 expression. However, it might exist in linkage disequilibrium with other functional SNPs and play a role in disease risk. Moreover, intronic SNPs are also known to influence genes that are not in close proximity to them. For instance, an obesity-related SNP found in the intron of the FTO gene was found to influence the process of adipocyte browning by regulating the activity of IRX3 and IRX5, rather than directly impacting FTO itself [36,37]. Thus, further investigation is warranted to address the putative effect of the rs7115753 on the function of MAPK8IP1 or in cis (within 1 Mb of the SNP) and in trans (further than 1 Mb away or on a different chromosome).
Furthermore, rs7115753 and rs11038677 were significantly associated with fasting glucose adjusted to BMI, fasting glucose, and T2D adjusted to BMI in MAGIC 2021 glycemic traits GWAS. This interesting finding may pave the way to explore whether these genetic variants are associated with other traits in different populations.
The role of MAPK8IP1 in the development of diabetes is disputable. Earlier studies identified MAPK8IP1 as a susceptibility gene for T2D, where a missense mutation in MAPK8IP1 was found to segregate with T2D in humans [18]. Furthermore, the gene was proposed to act as a transactivator of the GLUT2 gene [8]. This was disputed in several reports that revealed a redundant role of MAPK8IP1 on β-cells and insulin sensitivity, where the absence of a detected diabetic phenotype was demonstrated in Mapk8ip1-deficient mice [19]. Moreover, Kant et al. [20] and Jaeschke et al. [11] demonstrated that HFD-fed Mapk8ip1-defective mice were protected against obesity and insulin resistance, compared to HFD-fed WT mice.
On the other hand, some reports have demonstrated a protective effect of MAPK8IP1 on insulin-secreting cells by regulating the activity of the JNK signaling pathway [21]. Alternatively, other reports have revealed pro- and anti-apoptotic effects of MAPK8IP1, independent of JNK signaling [22]. To date, the function of MAPK8IP1 in pancreatic β-cell physiology and the pathogenesis of diabetes remains elusive.
Previous studies reported an anti-apoptotic function of MAPK8IP1 and attributed this to its role in regulating the JNK signaling pathway [21,38]. Our results demonstrate that the silencing of Mapk8ip1 had no effect on apoptosis without cytokines or on basal pJNK levels but decreased cytokine-induced apoptosis. In line with our data, Mapk8ip1 knockdown was found to reduce stress-induced apoptosis in different settings [19,39]. Moreover, Ling et al. demonstrated that MAPK8IP1 protein possesses pro-apoptotic and anti-apoptotic properties independently of the effects on the JNK signaling cascade [22]. Three JNK genes have been recognized, all of which were detected in β-cells [40]. While JNK2 seems pro-apoptotic, JNK1 and JNK3 are anti-apoptotic [40,41]. The balance between the expression of the different JNK isoforms in concluding total JNK activity may be a critical determinant of β-cell survival. Therefore, additional investigations are needed to assess whether MAPK8IP1 could regulate each of the three JNK isoforms and the effect of such regulation on β-cell survival. Nevertheless, differences in the culture conditions, the concentrations used, the transfection protocol, the experimental setup, and the choice of assay used to measure cell death cannot be ruled out as possible explanations for the discrepancies between our data and the results from previous studies.
ROS imbalance plays a central role in β cell dysfunction and the pathogenesis of diabetes [42]. However, the impact of MAPK8IP1 on the generation of ROS has not been previously investigated. Our results showed a reduction of ROS via Mapk8ip1 silencing. This finding was not surprising, as it has been shown that diminished levels of ROS signaling may result in reduced insulin secretion [43].
Few studies have investigated the link of MAPK8IP1 with insulin secretion [8,18]; however, its effect on insulin content and glucose uptake has not been elucidated. Our study illustrates that expression silencing of Mapk8ip1 in INS-1 cells was associated with impaired insulin secretion and decreased glucose uptake efficiency but had no effect on insulin content. The reduced glucose uptake is speculated to contribute to the impaired GSIS observed, as glucose uptake via glucose transporters is one of the key events leading to insulin secretion.
To achieve greater insight into how Mapk8ip1 reduced insulin secretion and the cause of reduced glucose uptake, we studied the expression of several key β-pancreatic cell genes that are mainly involved in glucose sensing, insulin biosynthesis, and insulin release. Intriguingly, Mapk8ip1 silencing altered the expression of several functional genes in β-cells. Most studies focused on the impact of Mapk8ip1 on Ins and Glut2 gene expressions, while its effect on other crucial key β-cell functional genes has not been studied. It was reported that MAPK8IP1 is a candidate for T2D and is required for insulin and GLUT2 expression [18]. Data presented in this study support the notion that MAPK8IP1 is involved in regulating insulin secretion [8,18] and undoubtedly unravels the role of Mapk8ip1 silencing on the exocytosis machinery and mitochondrial metabolism. Our results showed that Mapk8ip1-silenced cells exhibited a downregulation of genes involved in insulin biosynthesis, Ins1 and Ins2, along with the transcription factor genes Pdx1 and MafA. The Pdx1 gene controls the maturation of β cell function and insulin secretion by regulating insulin gene expression [44]. The MafA gene regulates the expression of insulin [45] and is necessary for the homeostasis of mature beta cells [46]. Thus, we can speculate that knockdown of Mapk8ip1 reduced the Pdx1 and MafA expression pattern, which resulted in the observed reduced insulin secretion and β-cell dysfunction. Glut2 and Gck are both crucial elements in glucose-sensing machinery and uptake. Typically, defects in glucose-sensing machinery are associated with impaired insulin secretion and hyperglycemia [47,48]. In the current study, GLUT2 and GCK expression was also downregulated in Mapk8ip1-silenced cells at both mRNA and protein levels. These results are in contrast with previously published reports that suggested that GLUT2 expression in Mapk8ip1-silenced cells was not significantly different from that in control cells [22]. It is worth noting that the reduced expression of GLUT2, the principal glucose transporter in beta cells, was associated with decreased glucose uptake, suggesting the contribution of GLUT2 to reduced glucose uptake and GSIS observed in our study.
Additionally, the downregulation of Insr at mRNA and protein levels in Mapk8ip1-silenced cells, observed in our study, might contribute to the observed insulin secretion defect; studies have demonstrated that the ablation of Insr in beta cells can impair insulin secretion [49]. Finally, our findings show that the expression levels of genes involved in insulin exocytosis (Syt5, Vamp2, and Cacna1a) were also reduced in Mapk8ip1-silenced cells and associated with a reduction in KCl-stimulated insulin secretion. Vamp2 is involved in the docking of insulin secretory vesicles with the target membrane [50]; Syt5 mediates Ca2+-dependent exocytosis of insulin [51], while Cacna1a plays an important role in insulin release, both as a source of Ca2+ required for excitation–secretion coupling and as a scaffold for the release machinery [52]. Thus, the impairment of these insulin exocytosis genes may be another contributing factor to the reduced GSIS observed in Mapk8ip1-silenced cells.
Importantly, we noticed that Mapk8ip1 levels were reduced, at both transcription and translation levels, upon the silencing of Pdx1 in INS-1 cells. These data suggest that Mapk8ip1 expression is dependent on Pdx1 transcriptional activity. This is an interesting finding, as previous reports documented that a large fraction of diabetic patients with mutant Mapk8ip1 allele were also carriers of a Pdx1 mutation, which was previously associated with a late-onset form of diabetes [18]. Furthermore, the finding that Mapk8ip1 silencing impaired mRNA and/or protein expression of Pdx1 and reduced insulin secretion represents a β-cell dedifferentiation condition. This might suggest that the reduced Mapk8ip1 expression in diabetic islets may be direct or through loss of Pdx1.
It is worth noting that this study has some limitations. In this study, we utilized INS-1 cells as the validation in vitro model. However, certain gene expression variations due to species-specificity may exist between the rat INS-1 cells and human β-cells. This might imply functional differences across the different species. Hence, it is of great importance to further validate the findings using human islets in future studies.

5. Conclusions

In summary, our data proposed that MAPK8IP1 is involved in the physiology of pancreatic beta cells. Mapk8ip1 silencing reduced cytokines-induced apoptosis and downregulated the expression of several pancreatic β-cell functional genes, including Ins1, Ins2, MafA, Glut2, Gck, Insr, Vamp2, Syt5, and Cacna1a. Furthermore, siRNA silencing of Pdx1 resulted in downregulated Mapk8ip1 expression in INS-1 cells. Further work is required to translate the findings to human islets and to determine whether MAPK8IP1 may represent a possible target for therapeutic interventions or be used as a biomarker for β-cell dysfunction.

Supplementary Materials

The following supporting information can be downloaded at: https://www.mdpi.com/article/10.3390/metabo13020307/s1, Figure S1: Bulk tissue expression for MAPK8IP1 (ENSG00000121653.11); Figures S2–S4 (replicas 1–3): The full-length Western blot expressions after Mapk8ip1 silencing; Figure S5–S7 (replicas 1–3): the full-length Western blot expression after siMafA and siPdx1 silencing.

Author Contributions

Conceptualization, R.S., A.K.M., S.E.S., K.M.A., M.M.A. and J.T.; methodology and formal analysis, J.T., R.S. and A.K.M.; investigation, R.S. and A.K.M.; supervision and validation, J.T., M.M.A., K.M.A. and S.E.S.; writing—original draft preparation, J.T. and R.S.; writing—review and editing, M.M.A., K.M.A., J.T., S.E.S., R.S. and A.K.M.; funding acquisition, J.T. All authors have read and agreed to the published version of the manuscript.

Funding

This research was funded by the College of graduate studies, University of Sharjah, with grant numbers 22010901106 466, 2001090176 and 22010901117.

Institutional Review Board Statement

Not applicable.

Informed Consent Statement

Not applicable.

Data Availability Statement

Publicly available datasets were analyzed in this study. These data can be found here: (https://www.ncbi.nlm.nih.gov/geo/query/acc.cgi?acc=GSE50398)/ accession number GSE50398.

Conflicts of Interest

The authors declare no conflict of interest.

References

  1. Galicia-Garcia, U.; Benito-Vicente, A.; Jebari, S.; Larrea-Sebal, A.; Siddiqi, H.; Uribe, K.B.; Ostolaza, H.; Martín, C. Pathophysiology of Type 2 Diabetes Mellitus. Int. J. Mol. Sci. 2020, 21, 6275. [Google Scholar] [CrossRef]
  2. Ježek, P.; Jabůrek, M.; Plecitá-Hlavatá, L. Contribution of Oxidative Stress and Impaired Biogenesis of Pancreatic β-Cells to Type 2 Diabetes. Antioxid. Redox Signal. 2019, 31, 722–751. [Google Scholar] [CrossRef] [PubMed] [Green Version]
  3. Khin, P.-P.; Lee, J.-H.; Jun, H.-S. A Brief Review of the Mechanisms of β-Cell Dedifferentiation in Type 2 Diabetes. Nutrients 2021, 13, 1593. [Google Scholar] [CrossRef] [PubMed]
  4. Yung, J.H.M.; Giacca, A. Role of c-Jun N-terminal Kinase (JNK) in Obesity and Type 2 Diabetes. Cells 2020, 9, 706. [Google Scholar] [CrossRef] [PubMed] [Green Version]
  5. Lanuza-Masdeu, J.; Arévalo, M.I.; Vila, C.; Barberà, A.; Gomis, R.; Caelles, C. In vivo JNK activation in pancreatic β-cells leads to glucose intolerance caused by insulin resistance in pancreas. Diabetes 2013, 62, 2308–2317. [Google Scholar] [CrossRef] [Green Version]
  6. Kaneto, H.; Matsuoka, T.-A. Involvement of oxidative stress in suppression of insulin biosynthesis under diabetic conditions. Int. J. Mol. Sci. 2012, 13, 13680–13690. [Google Scholar] [CrossRef] [PubMed] [Green Version]
  7. Whitmarsh, A.J.; Cavanagh, J.; Tournier, C.; Yasuda, J.; Davis, R.J. A mammalian scaffold complex that selectively mediates MAP kinase activation. Science 1998, 281, 1671–1674. [Google Scholar] [CrossRef]
  8. Bonny, C.; Nicod, P.; Waeber, G. IB1, a JIP-1-related nuclear protein present in insulin-secreting cells. J. Biol. Chem. 1998, 273, 1843–1846. [Google Scholar] [CrossRef] [Green Version]
  9. Pellet, J.B.; Haefliger, J.A.; Staple, J.K.; Widmann, C.; Welker, E.; Hirling, H.; Bonny, C.; Nicod, P.; Catsicas, S.; Waeber, G.; et al. Spatial, temporal and subcellular localization of islet-brain 1 (IB1), a homologue of JIP-1, in mouse brain. Eur. J. Neurosci. 2000, 12, 621–632. [Google Scholar] [CrossRef]
  10. Tawadros, T.; Formenton, A.; Dudler, J.; Thompson, N.; Nicod, P.; Leisinger, H.J.; Waeber, G.; Haefliger, J.A. The scaffold protein IB1/JIP-1 controls the activation of JNK in rat stressed urothelium. J. Cell Sci. 2002, 115, 385–393. [Google Scholar] [CrossRef]
  11. Jaeschke, A.; Czech, M.P.; Davis, R.J. An essential role of the JIP1 scaffold protein for JNK activation in adipose tissue. Genes Dev. 2004, 18, 1976–1980. [Google Scholar] [CrossRef] [PubMed] [Green Version]
  12. Abderrahmani, A.; Steinmann, M.; Plaisance, V.; Niederhauser, G.; Haefliger, J.A.; Mooser, V.; Bonny, C.; Nicod, P.; Waeber, G. The transcriptional repressor REST determines the cell-specific expression of the human MAPK8IP1 gene encoding IB1 (JIP-1). Mol. Cell. Biol. 2001, 21, 7256–7267. [Google Scholar] [CrossRef] [PubMed] [Green Version]
  13. Nihalani, D.; Wong, H.; Verma, R.; Holzman, L.B. Src family kinases directly regulate JIP1 module dynamics and activation. Mol. Cell. Biol. 2007, 27, 2431–2441. [Google Scholar] [CrossRef] [Green Version]
  14. Dajas-Bailador, F.; Jones, E.V.; Whitmarsh, A.J. The JIP1 scaffold protein regulates axonal development in cortical neurons. Curr. Biol. 2008, 18, 221–226. [Google Scholar] [CrossRef] [PubMed]
  15. Song, J.J.; Lee, Y.J. Dissociation of Akt1 from its negative regulator JIP1 is mediated through the ASK1-MEK-JNK signal transduction pathway during metabolic oxidative stress: A negative feedback loop. J. Cell Biol. 2005, 170, 61–72. [Google Scholar] [CrossRef] [PubMed]
  16. Standen, C.L.; Kennedy, N.J.; Flavell, R.A.; Davis, R.J. Signal transduction cross talk mediated by Jun N-terminal kinase-interacting protein and insulin receptor substrate scaffold protein complexes. Mol. Cell Biol. 2009, 29, 4831–4840. [Google Scholar] [CrossRef] [Green Version]
  17. Fu, M.-m.; Holzbaur, E.L.F. JIP1 regulates the directionality of APP axonal transport by coordinating kinesin and dynein motors. J. Cell Biol. 2013, 202, 495–508. [Google Scholar] [CrossRef] [Green Version]
  18. Waeber, G.; Delplanque, J.; Bonny, C.; Mooser, V.; Steinmann, M.; Widmann, C.; Maillard, A.; Miklossy, J.; Dina, C.; Hani, E.H.; et al. The gene MAPK8IP1, encoding islet-brain-1, is a candidate for type 2 diabetes. Nat. Genet. 2000, 24, 291–295. [Google Scholar] [CrossRef]
  19. Whitmarsh, A.J.; Kuan, C.Y.; Kennedy, N.J.; Kelkar, N.; Haydar, T.F.; Mordes, J.P.; Appel, M.; Rossini, A.A.; Jones, S.N.; Flavell, R.A.; et al. Requirement of the JIP1 scaffold protein for stress-induced JNK activation. Genes Dev. 2001, 15, 2421–2432. [Google Scholar] [CrossRef] [Green Version]
  20. Kant, S.; Standen, C.L.; Morel, C.; Jung, D.Y.; Kim, J.K.; Swat, W.; Flavell, R.A.; Davis, R.J. A Protein Scaffold Coordinates SRC-Mediated JNK Activation in Response to Metabolic Stress. Cell Rep. 2017, 20, 2775–2783. [Google Scholar] [CrossRef] [Green Version]
  21. Bonny, C.; Oberson, A.; Steinmann, M.; Schorderet, D.F.; Nicod, P.; Waeber, G. IB1 Reduces Cytokine-induced Apoptosis of Insulin-secreting Cells. J. Biol. Chem. 2000, 275, 16466–16472. [Google Scholar] [CrossRef] [PubMed] [Green Version]
  22. Ling, Z.; Van de Casteele, M.; Dong, J.; Heimberg, H.; Haefliger, J.A.; Waeber, G.; Schuit, F.; Pipeleers, D. Variations in IB1/JIP1 expression regulate susceptibility of beta-cells to cytokine-induced apoptosis irrespective of C-Jun NH2-terminal kinase signaling. Diabetes 2003, 52, 2497–2502. [Google Scholar] [CrossRef] [PubMed] [Green Version]
  23. Fadista, J.; Vikman, P.; Laakso, E.O.; Mollet, I.G.; Esguerra, J.L.; Taneera, J.; Storm, P.; Osmark, P.; Ladenvall, C.; Prasad, R.B.; et al. Global genomic and transcriptomic analysis of human pancreatic islets reveals novel genes influencing glucose metabolism. Proc. Natl. Acad. Sci. USA 2014, 111, 13924–13929. [Google Scholar] [CrossRef] [Green Version]
  24. Taneera, J.; Lang, S.; Sharma, A.; Fadista, J.; Zhou, Y.; Ahlqvist, E.; Jonsson, A.; Lyssenko, V.; Vikman, P.; Hansson, O.; et al. A systems genetics approach identifies genes and pathways for type 2 diabetes in human islets. Cell Metab. 2012, 16, 122–134. [Google Scholar] [CrossRef] [PubMed] [Green Version]
  25. Alonso, L.; Piron, A.; Moran, I.; Guindo-Martinez, M.; Bonas-Guarch, S.; Atla, G.; Miguel-Escalada, I.; Royo, R.; Puiggros, M.; Garcia-Hurtado, X. TIGER: The gene expression regulatory variation landscape of human pancreatic islets. bioRxiv 2021, 37, 109807. [Google Scholar] [CrossRef]
  26. Hohmeier, H.E.; Mulder, H.; Chen, G.; Henkel-Rieger, R.; Prentki, M.; Newgard, C.B. Isolation of INS-1-derived cell lines with robust ATP-sensitive K+ channel-dependent and -independent glucose-stimulated insulin secretion. Diabetes 2000, 49, 424–430. [Google Scholar] [CrossRef] [Green Version]
  27. Taneera, J.; Dhaiban, S.; Hachim, M.; Mohammed, A.K.; Mukhopadhyay, D.; Bajbouj, K.; Hamoudi, R.; Salehi, A.; Hamad, M. Reduced expression of Chl1 gene impairs insulin secretion by down-regulating the expression of key molecules of β-cell function. Exp. Clin. Endocrinol. Diabetes 2019, 129, 864–872. [Google Scholar] [CrossRef]
  28. El-Huneidi, W.; Anjum, S.; Mohammed, A.K.; Unnikannan, H.; Saeed, R.; Bajbouj, K.; Abu-Gharbieh, E.; Taneera, J. Copine 3 “CPNE3” is a novel regulator for insulin secretion and glucose uptake in pancreatic β-cells. Sci. Rep. 2021, 11, 20692. [Google Scholar] [CrossRef]
  29. Segerstolpe, Å.; Palasantza, A.; Eliasson, P.; Andersson, E.-M.; Andréasson, A.-C.; Sun, X.; Picelli, S.; Sabirsh, A.; Clausen, M.; Bjursell, M.K.; et al. Single-Cell Transcriptome Profiling of Human Pancreatic Islets in Health and Type 2 Diabetes. Cell Metab. 2016, 24, 593–607. [Google Scholar] [CrossRef] [Green Version]
  30. Zhang, C.; Moriguchi, T.; Kajihara, M.; Esaki, R.; Harada, A.; Shimohata, H.; Oishi, H.; Hamada, M.; Morito, N.; Hasegawa, K. MafA is a key regulator of glucose-stimulated insulin secretion. Mol. Cell Biol. 2005, 25, 4969–4976. [Google Scholar] [CrossRef] [Green Version]
  31. Hang, Y.; Yamamoto, T.; Benninger, R.K.; Brissova, M.; Guo, M.; Bush, W.; Piston, D.W.; Powers, A.C.; Magnuson, M.; Thurmond, D.C. The MafA transcription factor becomes essential to islet β-cells soon after birth. Diabetes 2014, 63, 1994–2005. [Google Scholar] [CrossRef] [PubMed] [Green Version]
  32. Fujimoto, K.; Polonsky, K.S. Pdx1 and other factors that regulate pancreatic β-cell survival. Diabetes Obes. Metab. 2009, 11, 30–37. [Google Scholar] [CrossRef] [PubMed] [Green Version]
  33. Marchetti, P.; Bugliani, M.; De Tata, V.; Suleiman, M.; Marselli, L. Pancreatic beta cell identity in humans and the role of type 2 diabetes. Front. Cell Dev. Biol. 2017, 5, 55. [Google Scholar] [CrossRef] [PubMed] [Green Version]
  34. Bramswig, N.C.; Everett, L.J.; Schug, J.; Dorrell, C.; Liu, C.; Luo, Y.; Streeter, P.R.; Naji, A.; Grompe, M.; Kaestner, K.H. Epigenomic plasticity enables human pancreatic α to β cell reprogramming. J. Clin. Investig. 2013, 123, 1275–1284. [Google Scholar] [CrossRef] [PubMed] [Green Version]
  35. Ottosson-Laakso, E.; Krus, U.; Storm, P.; Prasad, R.B.; Oskolkov, N.; Ahlqvist, E.; Fadista, J.; Hansson, O.; Groop, L.; Vikman, P. Glucose-induced changes in gene expression in human pancreatic islets: Causes or consequences of chronic hyperglycemia. Diabetes 2017, 66, 3013–3028. [Google Scholar] [CrossRef] [PubMed] [Green Version]
  36. Dong, S.S.; Zhu, D.L.; Zhou, X.R.; Rong, Y.; Zeng, M.; Chen, J.B.; Jiang, F.; Tuo, X.M.; Feng, Z.; Yang, T.L.; et al. An Intronic Risk SNP rs12454712 for Central Obesity Acts As an Allele-Specific Enhancer To Regulate BCL2 Expression. Diabetes 2021, 70, 1679–1688. [Google Scholar] [CrossRef] [PubMed]
  37. Claussnitzer, M.; Dankel, S.N.; Kim, K.H.; Quon, G.; Meuleman, W.; Haugen, C.; Glunk, V.; Sousa, I.S.; Beaudry, J.L.; Puviindran, V.; et al. FTO Obesity Variant Circuitry and Adipocyte Browning in Humans. N. Engl. J. Med. 2015, 373, 895–907. [Google Scholar] [CrossRef] [PubMed] [Green Version]
  38. Haefliger, J.A.; Tawadros, T.; Meylan, L.; Gurun, S.L.; Roehrich, M.E.; Martin, D.; Thorens, B.; Waeber, G. The scaffold protein IB1/JIP-1 is a critical mediator of cytokine-induced apoptosis in pancreatic beta cells. J. Cell Sci. 2003, 116, 1463–1469. [Google Scholar] [CrossRef] [Green Version]
  39. Im, J.Y.; Lee, K.W.; Kim, M.H.; Lee, S.H.; Ha, H.Y.; Cho, I.H.; Kim, D.; Yu, M.S.; Kim, J.B.; Lee, J.K.; et al. Repression of phospho-JNK and infarct volume in ischemic brain of JIP1-deficient mice. J. Neurosci. Res. 2003, 74, 326–332. [Google Scholar] [CrossRef]
  40. Abdelli, S.; Puyal, J.; Bielmann, C.; Buchillier, V.; Abderrahmani, A.; Clarke, P.G.; Beckmann, J.S.; Bonny, C. JNK3 is abundant in insulin-secreting cells and protects against cytokine-induced apoptosis. Diabetologia 2009, 52, 1871–1880. [Google Scholar] [CrossRef] [Green Version]
  41. Prause, M.; Christensen, D.P.; Billestrup, N.; Mandrup-Poulsen, T. JNK1 protects against glucolipotoxicity-mediated beta-cell apoptosis. PLoS ONE 2014, 9, e87067. [Google Scholar] [CrossRef] [PubMed] [Green Version]
  42. Eguchi, N.; Vaziri, N.D.; Dafoe, D.C.; Ichii, H. The Role of Oxidative Stress in Pancreatic β Cell Dysfunction in Diabetes. Int. J. Mol. Sci. 2021, 22, 1509. [Google Scholar] [CrossRef] [PubMed]
  43. Pi, J.; Zhang, Q.; Andersen, M.E. Reactive Oxygen Species and Antioxidants in Pancreatic β-Cell Function—Yin and Yang. In Systems Biology of Free Radicals and Antioxidants; Laher, I., Ed.; Springer: Berlin/Heidelberg, Germany, 2014; pp. 3319–3337. [Google Scholar]
  44. Brissova, M.; Shiota, M.; Nicholson, W.E.; Gannon, M.; Knobel, S.M.; Piston, D.W.; Wright, C.V.; Powers, A.C. Reduction in pancreatic transcription factor PDX-1 impairs glucose-stimulated insulin secretion. J. Biol. Chem. 2002, 277, 11225–11232. [Google Scholar] [CrossRef] [PubMed] [Green Version]
  45. Blanchet, E.; Van de Velde, S.; Matsumura, S.; Hao, E.; LeLay, J.; Kaestner, K.; Montminy, M. Feedback inhibition of CREB signaling promotes beta cell dysfunction in insulin resistance. Cell Rep. 2015, 10, 1149–1157. [Google Scholar] [CrossRef] [Green Version]
  46. Nishimura, W.; Takahashi, S.; Yasuda, K. MafA is critical for maintenance of the mature beta cell phenotype in mice. Diabetologia 2015, 58, 566–574. [Google Scholar] [CrossRef] [Green Version]
  47. Thorens, B.; Guillam, M.-T.r.s.; Beermann, F.; Burcelin, R.m.; Jaquet, M. Transgenic reexpression of GLUT1 or GLUT2 in pancreatic β cells rescues GLUT2-null mice from early death and restores normal glucose-stimulated insulin secretion. J. Biol. Chem. 2000, 275, 23751–23758. [Google Scholar] [CrossRef] [Green Version]
  48. Taneera, J.; Mussa, B.; Saber-Ayad, M.; Dhaiban, S.; Aljaibeji, H.; Sulaiman, N. Maturity-onset diabetes of the young: An overview with focus on the middle east. Curr. Mol. Med. 2017, 17, 549–562. [Google Scholar] [CrossRef]
  49. Wang, J.; Gu, W.; Chen, C. Knocking down insulin receptor in pancreatic beta cell lines with lentiviral-small hairpin RNA reduces glucose-stimulated insulin secretion via decreasing the gene expression of insulin, GLUT2 and Pdx1. Int. J. Mol. Sci. 2018, 19, 985. [Google Scholar] [CrossRef] [Green Version]
  50. Regazzi, R.; Wollheim, C.B.; Lang, J.; Theler, J.M.; Rossetto, O.; Montecucco, C.; Sadoul, K.; Weller, U.; Palmer, M.; Thorens, B. VAMP-2 and cellubrevin are expressed in pancreatic beta-cells and are essential for Ca(2+)-but not for GTP gamma S-induced insulin secretion. EMBO J. 1995, 14, 2723–2730. [Google Scholar] [CrossRef]
  51. Iezzi, M.; Kouri, G.; Fukuda, M.; Wollheim, C.B. Synaptotagmin V and IX isoforms control Ca2+ -dependent insulin exocytosis. J. Cell Sci. 2004, 117, 3119–3127. [Google Scholar] [CrossRef] [Green Version]
  52. Tuluc, P.; Theiner, T.; Jacobo-Piqueras, N.; Geisler, S.M. Role of High Voltage-Gated Ca2+ Channel Subunits in Pancreatic β-Cell Insulin Release. From Structure to Function. Cells 2021, 10, 2004. [Google Scholar] [CrossRef] [PubMed]
Figure 1. Expression profile of MAPK8IP1 in human pancreatic islets. (A) RNA-seq expression of MAPK8IP1, KCNJ11, SLC2A1, PDX1, MAFA and GCK in non-diabetic human islets (n = 57) (lower panel). Western blot expression analysis of MAPK8IP1 in human islets obtained from non-diabetic donors (n = 1; obtained from Prodo Lab, Aliso Viejo, CA, USA) (upper panel). (BE) RNA-seq differential expression analysis of MAPK8IP1 in human islets obtained from diabetic/hyperglycemic donors (n = 21) vs. nondiabetic/normoglycemic donors (n = 51) (B), male donors (n = 54) vs. female donors (n = 36) (C), lean donors (BMI < 25; n = 39) vs. obese donors (BMI > 29; n = 20) (D), old donors (≥65; n = 9) vs. young donors (≤40; n = 14) (E). (FO) Co-expression correlations of MAPK8IP1 with HbA1c (F), INS (G), PDX1 (H), KCNJ11 (I), GLUT1 (J), INSR (K), MAFA (L), GCK (M), VAMP2 (n), and SNAP25 (O) using RNA-seq expression data from human pancreatic islets. R and p values are indicated in the respective graphs. (P) MAPK8IP1 expression in human fat tissue (n = 12), pancreatic islets (n = 12), liver (n = 12) and skeletal muscle tissues (n = 12) obtained from the same donors using IGV data. (Q) MAPK8IP1 expression in sorted pancreatic cells, ductal, acinar, or PSC was obtained using IGV data. R: correlation coefficient; p: p-value. * p < 0.05; ns, not significant. Bars above histograms represent SD of the mean values. We assessed the expression using the nonparametric Mann–Whitney test for figures (AE). For figure (FO), we evaluated the correlations using the nonparametric Spearman’s test.
Metabolites 13 00307 g001
Figure 2. Silencing of Mapk8ip1 diminishes insulin secretion in INS-1 cells. Cells were transfected with siRNA against Mapk8ip1 (siMapk8ip1) or the siRNA negative control (siNC). (A) The silencing efficiency of Mapk8ip1 was measured by qRT-PCR 48 h post-transfection. Data were obtained from three independent experiments. (B) Western blot expression analysis of MAPK8IP1 and β-actin (endogenous control) in INS-1 cells transfected with siRNA against Mapk8ip1 or the negative control (upper panel). Fold change in the intensity of the Western blot band of MAPK8IP1 protein relative to the endogenous control β-actin in Mapk8ip1-silenced cells or negative control cells (lower panel). Data were obtained from three independent experiments. (C) Normalized stimulated insulin secretion in response to 2.8 mM glucose (2.8 mM G), 16.7 mM glucose (16.7 mM G), 35 mM KCl, or 10 mM α-KIC in the presence of 2.8 mM glucose in Mapk8ip1-silenced cells or negative control cells for one static hour of incubation. Data were obtained from three independent experiments. (D) Insulin content measurements normalized to protein content in Mapk8ip1-silenced cells compared to negative control cells. Data were obtained from three independent experiments. (E) Evaluation of glucose uptake efficiency in Mapk8ip1-silenced cells compared to control cells. Data were obtained from three independent experiments. * p < 0.05, ** p < 0.01, *** p < 0.001 and ns; not significant. Bars represent mean ± SD. Statistical analyses were performed using Student t-tests.
Metabolites 13 00307 g002
Figure 3. Influence of Mapk8ip1-silencing on cell viability, apoptosis, and ROS production in INS-1 cells. Cells were transfected with siRNA against Mapk8ip1 (siMapk8ip1) or the siRNA negative control (siNC). (A) Percentage of cell viability determined by MTT assay in Mapk8ip1-silenced cells compared to control cells. Data were obtained from three independent experiments. (B) Detection of intracellular ROS levels in Mapk8ip1-silenced INS-1 cells compared to control cells. Data were obtained from three independent experiments. The ROS level in the control cells was set at 100%. Analysis of apoptosis level in Mapk8ip1-silenced INS-1 cells or negative control in the absence (C) or presence (D) of cytokine stimulation as analyzed by flow cytometry. Data were obtained from three independent experiments. * p < 0.05, ns, not significant. Bars above histograms represent SD of the mean values. Statistical analyses were performed using Student t-tests.
Metabolites 13 00307 g003
Figure 4. Impact of Mapk8ip1 silencing on the expression of β-cell function genes. Total mRNA/protein was extracted from Mapk8ip1-silenced cells (siMapk8ip1) or siRNA negative control cells (siNC) after 48 h of transfection and subjected to qRT-PCR or Western blot analysis. (A) qPCR expression analysis of Ins1, Ins2, Glut2, Gck, Pdx1, Insr, Vamp2, Syt5, Snap25, Cacna1a, Cacnb1, MafA, NeuroD1, and Jnk in Mapk8ip1-silenced cells compared to those in control cells. Data were obtained from at least three independent experiments.Western blot analysis of Pro/insulin (B), PDX1 (C), MAFA (D), NEUROD1 (E), GCK (F), GLUT2 (G), INSRβ (H), VAMP2 (I), SNAP25 (J), JNK (K) and pJNK (L) relative to the endogenous control protein β-actin (pJNK levels shown relative to JNK) in Mapk8ip1-silenced cells and control cells (lower panels). Corresponding fold changes in the intensities of the Western blot bands are shown above each blot. Data were obtained from three independent experiments (see Supplementary Figures S2–S4). * p < 0.05, ** p < 0.01, *** p < 0.001, ns; not significant. Bars above histograms represent SD of the mean values. Statistical analyses were performed using Student t-tests.
Metabolites 13 00307 g004
Figure 5. Impact of Pdx1 and MafA silencing on the expression of MAPK8IP1 in INS-1 cells. Cells were transfected with siRNA against Pdx1 (siPdx1) or MafA (siMafA), or the siRNA negative control (siNC). (A) Silencing efficiency of Pdx1 in INS1 cells 48 h post-transfection as measured by qRT-PCR. (B) Silencing efficiency of MafA in INS1 cells 48 h post-transfection as measured by qRT-PCR qPCR. (CE) Western blot analysis of PDX1 (C), MAFA (D) and MAPK8IP1 (E) in Pdx1 or MafA-silenced cells and control cells relative to the endogenous control protein β-actin (lower panels). Corresponding fold changes in the intensities of the Western blot bands are shown above each blot. Data were obtained from three independent experiments (see Supplementary Figures S5–S7). * p < 0.05, ** p < 0.01, *** p < 0.001, ns; not significant. Bars above histograms represent SD of the mean values. Statistical analyses were performed using Student t-tests.
Metabolites 13 00307 g005
Table 1. SYBR green primer sequence.
Gene/SymbolAccession NumbersForward Primers (5′-3′)Reverse Primers (5′-3′)
MafA NM_001399773.1 GAGGAGGAGCGCAAGATCGGAGCAAAAGTTTCGTGCTGTCAA
NeuroD1 NM_019218.3 CCCTAACTGATTGCACCAGCTGCAGGGTAGTGCATGGTAA
Syt5 NM_019350.2 CACCTGACCCCAGATCCTTTGAGTGGTACTGGAAGTCGGA
Snap25 NM_001270576.1
NM_001270575.1
NM_030991.3
GGCGTTTGCTGAATGACAACCAGAGCCTGACACCCTAAGA
Cacna1a NM_012918.5 CTAGCCCTGCCAAGATCGGACGATAAGGCTGTTCTCGG
Cacnb1 NM_017346.2 CTTTACCCCAGCAACCACCCGTCCACACACGAGTCTCCTG
Vamp2 NM_012663.2 TGGTGGACATCATGAGGGTGGCTTGGCTGCACTTGTTTCA
Jnk NM_053829.2 TCCAGTTCTCGTACCCGCTAAGCATGGCGTGACACAGTAA
Hprt1 NM_012583.2 TTGTGTCATCAGCGAAAGTGGCACAGGACTAGAACGTCTGCT
Abbreviations: MafA, V-Maf musculoaponeurotic fibrosarcoma oncogene homolog A; NeuroD, neurogenic differentiation factor 1; Syt5, synaptotagmin 5; Snap25, synaptosome associated protein 25; Cacna1a, calcium voltage-gated channel subunit alpha 1a; Cacnb1, calcium voltage-gated channel auxiliary subunit beta 1; Vamp2, vesicle associated membrane protein 2; Jnk, c-Jun N-terminal kinase; Hprt1, hypoxanthine phosphoribosyltransferase 1.
Table 2. Top MAPK8IP1 variants at ±100 Kb and their associations with T2D. Data obtained from the TIGER data portal.
IDReference AlleleAlternate AlleleSample Sizep-Value
Diagram Diamante
rs7115753AG231,4204.08 × 10−9
Diagram 1000G
rs11038677TC-3.70 × 10⁻⁵
70K for T2D
rs553011963CGTTAGTT66,9400.0013
Table 3. Association of top MAPK8IP1 variants across all datasets and traits included in the Type2 Diabetes Knowledge Portal.
Phenotypep-ValueBetaOdds RatioSample Size
rs7115753
Fasting glucose adj BMI9.76 × 10−51−0.0246 287,195
Fasting glucose2.75 × 10−13−0.0298 263,726
Type 2 diabetes adj BMI1.37 × 10−7 0.9635266,778
Type 2 diabetes 1.62 × 10⁻⁷ 0.96351,436,100
rs7115753
Fasting glucose adj BMI2.45 × 10−24−0.0185 287,195
Fasting glucose2.371 × 10−8−0.0212 277,462
Type 2 diabetes adj BMI3.59 × 10−7 0.9570266,778
Type 2 diabetes 0.00004 0.98131,436,100
Disclaimer/Publisher’s Note: The statements, opinions and data contained in all publications are solely those of the individual author(s) and contributor(s) and not of MDPI and/or the editor(s). MDPI and/or the editor(s) disclaim responsibility for any injury to people or property resulting from any ideas, methods, instructions or products referred to in the content.

