
Relation of Aortic Waveforms with Gut Hormones following Continuous and Interval Exercise among Older Adults with Prediabetes

Abstract
:1. Introduction
2. Methods
2.1. Participants
2.2. Aerobic Fitness and Body Mass
2.3. Metabolic Control
2.4. OGTT
2.5. Pulse Waveform Analysis
2.6. Exercise Training
2.7. Biochemical Analysis
2.8. Statistical Analysis
3. Results
3.1. Participant and Exercise Training Characteristics
3.2. Glucose Tolerance and Insulin
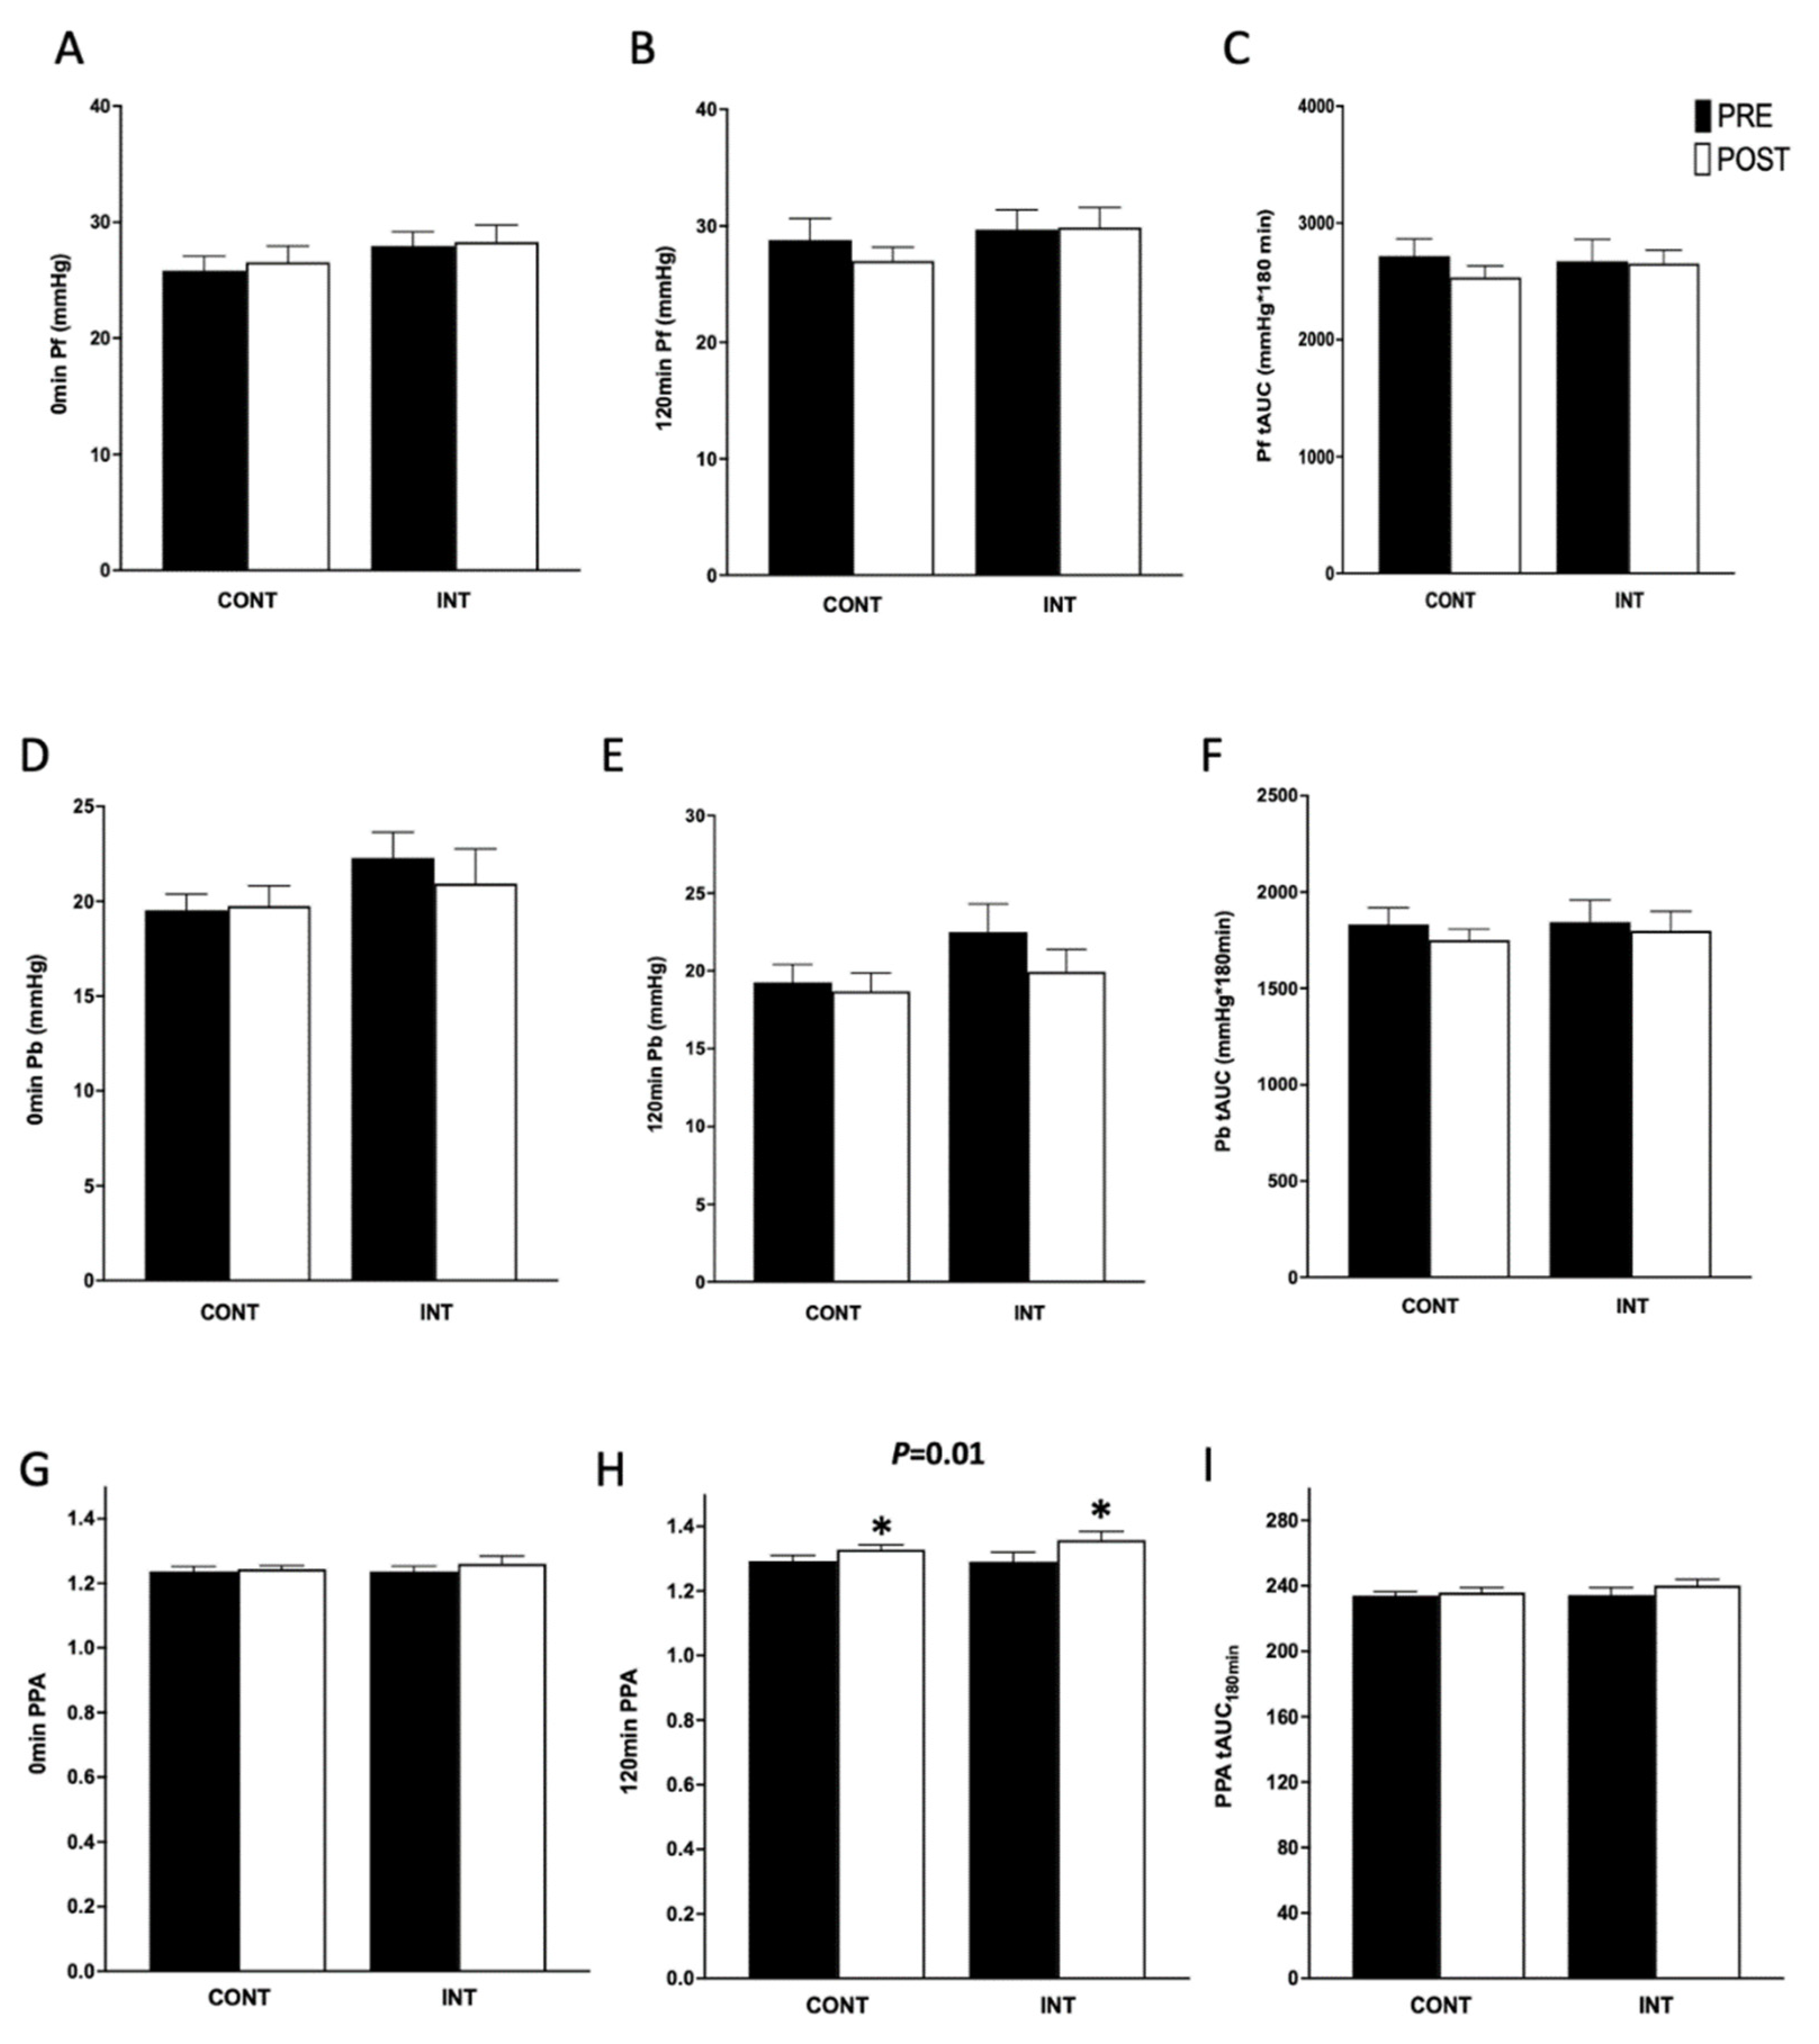
3.3. Hemodynamics
3.4. Gut Hormones
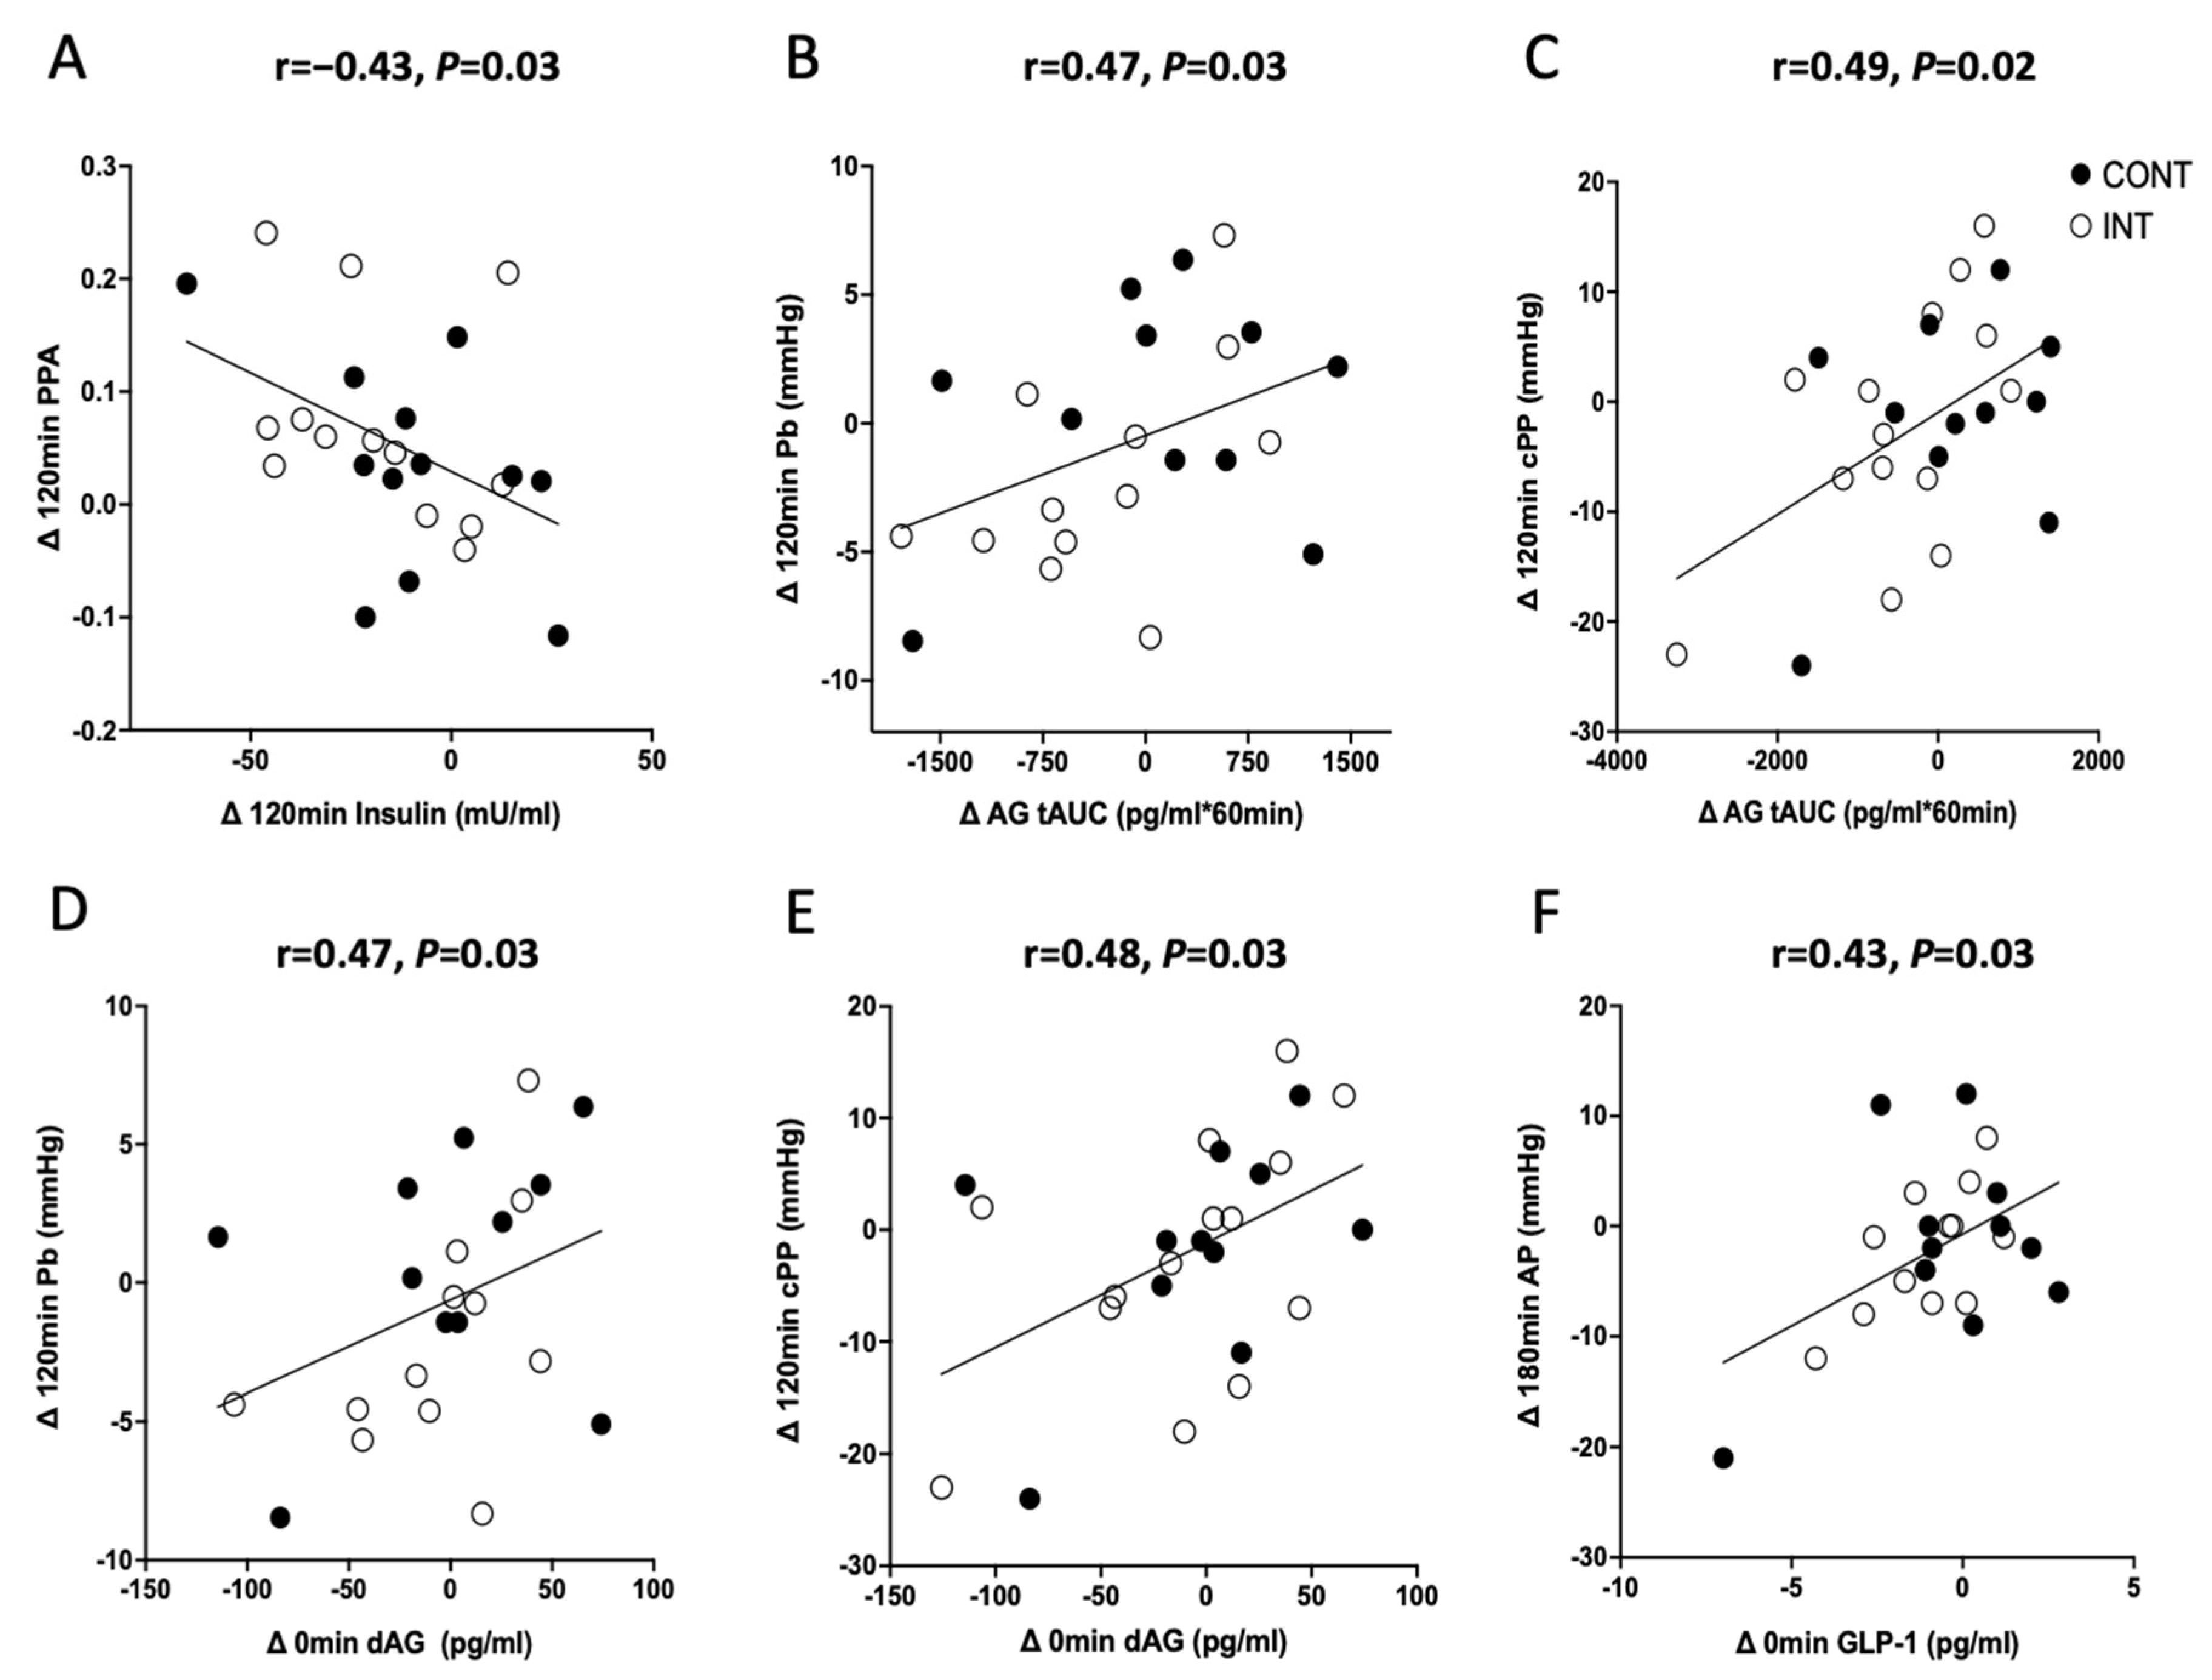
3.5. Correlations
4. Discussion
Author Contributions
Funding
Institutional Review Board Statement
Informed Consent Statement
Data Availability Statement
Acknowledgments
Conflicts of Interest
References
- Palatini, P.; Casiglia, E.; Gąsowski, J.; Głuszek, J.; Jankowski, P.; Narkiewicz, K.; Saladini, F.; Stolarz-Skrzypek, K.; Tikhonoff, V.; Bortel, L.V.; et al. Arterial Stiffness, Central Hemodynamics, and Cardiovascular Risk in Hypertension. Vasc. Health Risk Manag. 2011, 7, 725. [Google Scholar] [CrossRef] [PubMed] [Green Version]
- Chester, R.C.; Gornbein, J.A.; Hundley, W.G.; Srikanthan, P.; Watson, K.E.; Horwich, T. Reflection Magnitude, a Measure of Arterial Stiffness, Predicts Incident Heart Failure in Men But Not Women: Multi-Ethnic Study of Atherosclerosis (MESA). J. Card. Fail. 2017, 23, 353–362. [Google Scholar] [CrossRef] [PubMed]
- Mitchell, G.F.; Hwang, S.-J.; Vasan, R.S.; Larson, M.G.; Pencina, M.J.; Hamburg, N.M.; Vita, J.A.; Levy, D.; Benjamin, E.J. Arterial Stiffness and Cardiovascular Events: The Framingham Heart Study. Circulation 2010, 121, 505–511. [Google Scholar] [CrossRef] [PubMed] [Green Version]
- Townsend, R.R.; Wilkinson, I.B.; Schiffrin, E.L.; Avolio, A.P.; Chirinos, J.A.; Cockcroft, J.R.; Heffernan, K.S.; Lakatta, E.G.; McEniery, C.; Mitchell, G.F.; et al. Recommendations for Improving and Standardizing Vascular Research on Arterial Stiffness. Hypertension 2015, 66, 698–722. [Google Scholar] [CrossRef] [PubMed] [Green Version]
- Stock, J.M.; Chouramanis, N.V.; Chirinos, J.A.; Edwards, D.G. Dynamic and Isometric Handgrip Exercise Increases Wave Reflection in Healthy Young Adults. J. Appl. Physiol. (1985) 2020, 129, 709–717. [Google Scholar] [CrossRef]
- Laurent, S. Surrogate Measures of Arterial Stiffness. Hypertension 2006, 47, 325–326. [Google Scholar] [CrossRef] [Green Version]
- Widmer, R.J.; Lerman, A. Endothelial Dysfunction and Cardiovascular Disease. Glob. Cardiol. Sci. Pract. 2014, 2014, 291–308. [Google Scholar] [CrossRef]
- Cavalot, F.; Petrelli, A.; Traversa, M.; Bonomo, K.; Fiora, E.; Conti, M.; Anfossi, G.; Costa, G.; Trovati, M. Post-prandial Blood Glucose Is a Stronger Predictor of Cardiovascular Events than Fasting Blood Glucose in Type 2 Diabetes Mellitus, Particularly in Women: Lessons from the San Luigi Gonzaga Diabetes Study. J. Clin. Endocrinol. Metab. 2006, 91, 813–819. [Google Scholar] [CrossRef] [Green Version]
- Shirwany, N.A.; Zou, M. Arterial Stiffness: A Brief Review. Acta Pharmacol. Sin. 2010, 31, 1267. [Google Scholar] [CrossRef] [Green Version]
- Papaioannou, T.G.; Protogerou, A.D.; Stergiopulos, N.; Vardoulis, O.; Stefanadis, C.; Safar, M.; Blacher, J. Total Arterial Compliance Estimated by a Novel Method and All-Cause Mortality in the Elderly: The PROTEGER Study. Age (Dordr.) 2014, 36, 9661. [Google Scholar] [CrossRef]
- Westerbacka, J.; Yki-Järvinen, H. Arterial Stiffness and Insulin Resistance. Semin. Vasc. Med. 2002, 2, 157–164. [Google Scholar] [CrossRef]
- Jahn, L.A.; Hartline, L.; Rao, N.; Logan, B.; Kim, J.J.; Aylor, K.; Gan, L.-M.; Westergren, H.U.; Barrett, E.J. Insulin Enhances Endothelial Function Throughout the Arterial Tree in Healthy But Not Metabolic Syndrome Subjects. J. Clin. Endocrinol. Metab. 2016, 101, 1198–1206. [Google Scholar] [CrossRef] [Green Version]
- Westerbacka, J.; Vehkavaara, S.; Bergholm, R.; Wilkinson, I.; Cockcroft, J.; Yki-Järvinen, H. Marked Resistance of the Ability of Insulin to Decrease Arterial Stiffness Characterizes Human Obesity. Diabetes 1999, 48, 821–827. [Google Scholar] [CrossRef]
- Jatic, Z.; Skopljak, A.; Hebibovic, S.; Sukalo, A.; Rustempasic, E.; Valjevac, A. Effects of Different Antihypertensive Drug Combinations on Blood Pressure and Arterial Stiffness. Med. Arch. 2019, 73, 157–162. [Google Scholar] [CrossRef]
- Dotson, B.L.; Heiston, E.M.; Miller, S.L.; Malin, S.K. Insulin Stimulation Reduces Aortic Wave Reflection in Adults with Metabolic Syndrome. Am. J. Physiol. Heart Circ. Physiol. 2021, 320, H2305–H2312. [Google Scholar] [CrossRef]
- Nagaya, N.; Kojima, M.; Uematsu, M.; Yamagishi, M.; Hosoda, H.; Oya, H.; Hayashi, Y.; Kangawa, K. Hemodynamic and Hormonal Effects of Human Ghrelin in Healthy Volunteers. Am. J. Physiol.-Regul. Integr. Comp. Physiol. 2001, 280, R1483–R1487. [Google Scholar] [CrossRef] [Green Version]
- Nagaya, N.; Moriya, J.; Yasumura, Y.; Uematsu, M.; Ono, F.; Shimizu, W.; Ueno, K.; Kitakaze, M.; Miyatake, K.; Kangawa, K. Effects of Ghrelin Administration on Left Ventricular Function, Exercise Capacity, and Muscle Wasting in Patients with Chronic Heart Failure. Circulation 2004, 110, 3674–3679. [Google Scholar] [CrossRef] [Green Version]
- Dixit, V.D.; Schaffer, E.M.; Pyle, R.S.; Collins, G.D.; Sakthivel, S.K.; Palaniappan, R.; Lillard, J.W.; Taub, D.D. Ghrelin Inhibits Leptin- and Activation-Induced Proinflammatory Cytokine Expression by Human Monocytes and T Cells. J. Clin. Investig. 2004, 114, 57–66. [Google Scholar] [CrossRef]
- Tesauro, M.; Schinzari, F.; Iantorno, M.; Rizza, S.; Melina, D.; Lauro, D.; Cardillo, C. Ghrelin Improves Endothelial Function in Patients with Metabolic Syndrome. Circulation 2005, 112, 2986–2992. [Google Scholar] [CrossRef] [Green Version]
- Tan, A.W.K.; Subaran, S.C.; Sauder, M.A.; Chai, W.; Jahn, L.A.; Fowler, D.E.; Patrie, J.T.; Aylor, K.W.; Basu, A.; Liu, Z. GLP-1 and Insulin Recruit Muscle Microvasculature and Dilate Conduit Artery Individually But Not Additively in Healthy Humans. J. Endocr. Soc. 2018, 2, 190–206. [Google Scholar] [CrossRef]
- Asmar, M.; Asmar, A.; Simonsen, L.; Dela, F.; Holst, J.J.; Bülow, J. GIP-Induced Vasodilation in Human Adipose Tissue Involves Capillary Recruitment. Endocr. Connect. 2019, 8, 806–813. [Google Scholar] [CrossRef] [PubMed] [Green Version]
- Asmar, M.; Simonsen, L.; Madsbad, S.; Stallknecht, B.; Holst, J.J.; Bülow, J. Glucose-Dependent Insulinotropic Polypeptide May Enhance Fatty Acid Re-Esterification in Subcutaneous Abdominal Adipose Tissue in Lean Humans. Diabetes 2010, 59, 2160–2163. [Google Scholar] [CrossRef] [PubMed] [Green Version]
- Asmar, M.; Simonsen, L.; Arngrim, N.; Holst, J.J.; Dela, F.; Bülow, J. Glucose-Dependent Insulinotropic Polypeptide Has Impaired Effect on Abdominal, Subcutaneous Adipose Tissue Metabolism in Obese Subjects. Int. J. Obes. (Lond.) 2014, 38, 259–265. [Google Scholar] [CrossRef] [PubMed]
- Heiston, E.M.; Gilbertson, N.M.; Eichner, N.Z.M.; Malin, S.K. A Low-Calorie Diet with or without Exercise Reduces Post-prandial Aortic Waveform in Females with Obesity. Med. Sci. Sports Exerc. 2021, 53, 796–803. [Google Scholar] [CrossRef] [PubMed]
- Gilbertson, N.M.; Eichner, N.Z.M.; Heiston, E.M.; Gaitán, J.M.; Francois, M.E.; Mehaffey, J.H.; Hassinger, T.E.; Hallowell, P.T.; Weltman, A.; Malin, S.K. A Low-Calorie Diet with or without Interval Exercise Training Improves Adiposopathy in Obese Women. Appl. Physiol. Nutr. Metab. 2019, 44, 1057–1064. [Google Scholar] [CrossRef]
- Gaesser, G.A.; Angadi, S.S.; Sawyer, B.J. Exercise and Diet, Independent of Weight Loss, Improve Cardiometabolic Risk Profile in Overweight and Obese Individuals. Phys. Sportsmed. 2011, 39, 87–97. [Google Scholar] [CrossRef]
- Stock, J.M.; Chirinos, J.A.; Edwards, D.G. Lower-Body Dynamic Exercise Reduces Wave Reflection in Healthy Young Adults. Exp. Physiol. 2021, 106, 1720–1730. [Google Scholar] [CrossRef]
- Hanssen, H.; Nussbaumer, M.; Moor, C.; Cordes, M.; Schindler, C.; Schmidt-Trucksäss, A. Acute Effects of Interval versus Continuous Endurance Training on Pulse Wave Reflection in Healthy Young Men. Atherosclerosis 2015, 238, 399–406. [Google Scholar] [CrossRef]
- Munir, S.; Jiang, B.; Guilcher, A.; Brett, S.; Redwood, S.; Marber, M.; Chowienczyk, P. Exercise Reduces Arterial Pressure Augmentation through Vasodilation of Muscular Arteries in Humans. Am. J. Physiol.-Heart Circ. Physiol. 2008, 294, H1645–H1650. [Google Scholar] [CrossRef] [Green Version]
- Goto, C.; Nishioka, K.; Umemura, T.; Jitsuiki, D.; Sakagutchi, A.; Kawamura, M.; Chayama, K.; Yoshizumi, M.; Higashi, Y. Acute Moderate-Intensity Exercise Induces Vasodilation through an Increase in Nitric Oxide Bioavailiability in Humans*. Am. J. Hypertens. 2007, 20, 825–830. [Google Scholar] [CrossRef]
- Eichner, N.Z.M.; Gaitán, J.M.; Gilbertson, N.M.; Khurshid, M.; Weltman, A.; Malin, S.K. Post-prandial Augmentation Index Is Reduced in Adults with Prediabetes Following Continuous and Interval Exercise Training. Exp. Physiol. 2019, 104, 264–271. [Google Scholar] [CrossRef]
- Benetos, A.; Thomas, F.; Joly, L.; Blacher, J.; Pannier, B.; Labat, C.; Salvi, P.; Smulyan, H.; Safar, M.E. Pulse Pressure Amplification a Mechanical Biomarker of Cardiovascular Risk. J. Am. Coll. Cardiol. 2010, 55, 1032–1037. [Google Scholar] [CrossRef] [Green Version]
- Heiston, E.M.; Eichner, N.Z.M.; Gilbertson, N.M.; Gaitán, J.M.; Kranz, S.; Weltman, A.; Malin, S.K. Two Weeks of Exercise Training Intensity on Appetite Regulation in Obese Adults with Prediabetes. J. Appl. Physiol. (1985) 2019, 126, 746–754. [Google Scholar] [CrossRef]
- Malin, S.K.; Francois, M.E.; Eichner, N.Z.M.; Gilbertson, N.M.; Heiston, E.M.; Fabris, C.; Breton, M. Impact of Short-Term Exercise Training Intensity on β-Cell Function in Older Obese Adults with Prediabetes. J. Appl. Physiol. (1985) 2018, 125, 1979–1986. [Google Scholar] [CrossRef] [Green Version]
- John, A.T.; Chowdhury, M.; Islam, M.R.; Mir, I.A.; Hasan, M.Z.; Chong, C.Y.; Humayra, S.; Higashi, Y. Effectiveness of High-Intensity Interval Training and Continuous Moderate-Intensity Training on Blood Pressure in Physically Inactive Pre-Hypertensive Young Adults. J. Cardiovasc. Dev. Dis. 2022, 9, 246. [Google Scholar] [CrossRef]
- Malin, S.K.; Gilbertson, N.M.; Eichner, N.Z.M.; Heiston, E.; Miller, S.; Weltman, A. Impact of Short-Term Continuous and Interval Exercise Training on Endothelial Function and Glucose Metabolism in Prediabetes. J. Diabetes Res. 2019, 2019, 4912174. [Google Scholar] [CrossRef]
- Mikus, C.R.; Fairfax, S.T.; Libla, J.L.; Boyle, L.J.; Vianna, L.C.; Oberlin, D.J.; Uptergrove, G.M.; Deo, S.H.; Kim, A.; Kanaley, J.A.; et al. Seven Days of Aerobic Exercise Training Improves Conduit Artery Blood Flow Following Glucose Ingestion in Patients with Type 2 Diabetes. J. Appl. Physiol. 2011, 111, 657–664. [Google Scholar] [CrossRef]
- Shenouda, N.; Gillen, J.B.; Gibala, M.J.; MacDonald, M.J. Changes in Brachial Artery Endothelial Function and Resting Diameter with Moderate-Intensity Continuous but Not Sprint Interval Training in Sedentary Men. J. Appl. Physiol. 2017, 123, 773–780. [Google Scholar] [CrossRef] [Green Version]
- Tai, Y.L.; Gerhart, H.; Mayo, X.; Kingsley, J.D. Acute Resistance Exercise Using Free Weights on Aortic Wave Reflection Characteristics. Clin. Physiol. Funct. Imaging 2018, 38, 145–150. [Google Scholar] [CrossRef]
- Marshall, E.M.; Parks, J.C.; Singer, T.J.; Tai, Y.L.; DeBord, A.R.; Humm, S.M.; Kingsley, J.D. Vascular Responses to High-Intensity Battling Rope Exercise between the Sexes. J. Sports Sci. Med. 2021, 20, 349–356. [Google Scholar] [CrossRef]
- Patik, J.C.; Stock, J.M.; Shenouda, N.; Chouramanis, N.V.; Mehrer, J.D.; Chirinos, J.A.; Edwards, D.G. Pulsatile Load and Wasted Pressure Effort Are Reduced Following an Acute Bout of Aerobic Exercise. J. Appl. Physiol. (1985) 2021, 131, 184–191. [Google Scholar] [CrossRef] [PubMed]
- Marsh, C.E.; Thomas, H.J.; Naylor, L.H.; Dembo, L.G.; Scurrah, K.J.; Green, D.J. Left Ventricular Adaptation to Exercise Training via Magnetic Resonance Imaging: Studies of Twin Responses to Understand Exercise THerapy. Med. Sci. Sports Exerc. 2022, 54, 1095–1104. [Google Scholar] [CrossRef] [PubMed]
- Pearson, J.T.; Shirai, M.; Sukumaran, V.; Du, C.-K.; Tsuchimochi, H.; Sonobe, T.; Waddingham, M.T.; Katare, R.; Schwenke, D.O. Ghrelin and Vascular Protection. Vasc. Biol. 2019, 1, H97–H102. [Google Scholar] [CrossRef] [PubMed] [Green Version]
- Broom, D.R.; Stensel, D.J.; Bishop, N.C.; Burns, S.F.; Miyashita, M. Exercise-Induced Suppression of Acylated Ghrelin in Humans. J. Appl. Physiol. 2007, 102, 2165–2171. [Google Scholar] [CrossRef] [PubMed]
- Subaran, S.C.; Sauder, M.A.; Chai, W.; Jahn, L.A.; Fowler, D.E.; Aylor, K.W.; Basu, A.; Liu, Z. GLP-1 at Physiological Concentrations Recruits Skeletal and Cardiac Muscle Microvasculature in Healthy Humans. Clin. Sci. 2014, 127, 163–170. [Google Scholar] [CrossRef] [Green Version]
- Leidy, H.J.; Gardner, J.K.; Frye, B.R.; Snook, M.L.; Schuchert, M.K.; Richard, E.L.; Williams, N.I. Circulating Ghrelin Is Sensitive to Changes in Body Weight during a Diet and Exercise Program in Normal-Weight Young Women. J. Clin. Endocrinol. Metab. 2004, 89, 2659–2664. [Google Scholar] [CrossRef] [Green Version]
- Mani, B.K.; Castorena, C.M.; Osborne-Lawrence, S.; Vijayaraghavan, P.; Metzger, N.P.; Elmquist, J.K.; Zigman, J.M. Ghrelin Mediates Exercise Endurance and the Feeding Response Post-Exercise. Mol. Metab. 2018, 9, 114–130. [Google Scholar] [CrossRef]
- Åkerström, T.; Stolpe, M.N.; Widmer, R.; Dejgaard, T.F.; Højberg, J.M.; Møller, K.; Hansen, J.S.; Trinh, B.; Holst, J.J.; Thomsen, C.; et al. Endurance Training Improves GLP-1 Sensitivity and Glucose Tolerance in Overweight Women. J. Endocr. Soc. 2022, 6, bvac111. [Google Scholar] [CrossRef]
- Muniyappa, R.; Montagnani, M.; Koh, K.K.; Quon, M.J. Cardiovascular Actions of Insulin. Endocr. Rev. 2007, 28, 463–491. [Google Scholar] [CrossRef]
- Vilsbøll, T.; Holst, J.J. Incretins, Insulin Secretion and Type 2 Diabetes Mellitus. Diabetologia 2004, 47, 357–366. [Google Scholar] [CrossRef]
- McLaughlin, T.; Abbasi, F.; Lamendola, C.; Frayo, R.S.; Cummings, D.E. Plasma Ghrelin Concentrations Are Decreased in Insulin-Resistant Obese Adults Relative to Equally Obese Insulin-Sensitive Controls. J. Clin. Endocrinol. Metab. 2004, 89, 1630–1635. [Google Scholar] [CrossRef]
- Broglio, F.; Arvat, E.; Benso, A.; Gottero, C.; Muccioli, G.; Papotti, M.; van der Lely, A.J.; Deghenghi, R.; Ghigo, E. Ghrelin, a Natural GH Secretagogue Produced by the Stomach, Induces Hyperglycemia and Reduces Insulin Secretion in Humans. J. Clin. Endocrinol. Metab. 2001, 86, 5083–5086. [Google Scholar] [CrossRef]
- Vestergaard, E.T.; Gormsen, L.C.; Jessen, N.; Lund, S.; Hansen, T.K.; Moller, N.; Jorgensen, J.O.L. Ghrelin Infusion in Humans Induces Acute Insulin Resistance and Lipolysis Independent of Growth Hormone Signaling. Diabetes 2008, 57, 3205–3210. [Google Scholar] [CrossRef] [Green Version]
- McCowen, K.C.; Maykel, J.A.; Bistrian, B.R.; Ling, P.R. Circulating Ghrelin Concentrations Are Lowered by Intravenous Glucose or Hyperinsulinemic Euglycemic Conditions in Rodents. J. Endocrinol. 2002, 175, R7–R11. [Google Scholar] [CrossRef] [Green Version]
- Baldanzi, G.; Filigheddu, N.; Cutrupi, S.; Catapano, F.; Bonissoni, S.; Fubini, A.; Malan, D.; Baj, G.; Granata, R.; Broglio, F.; et al. Ghrelin and Des-Acyl Ghrelin Inhibit Cell Death in Cardiomyocytes and Endothelial Cells through ERK1/2 and PI 3-Kinase/AKT. J. Cell Biol. 2002, 159, 1029–1037. [Google Scholar] [CrossRef] [Green Version]
- Nijdam, M.-E.; Plantinga, Y.; Hulsen, H.T.; Bos, W.J.W.; Grobbee, D.E.; van der Schouw, Y.T.; Bots, M.L. Pulse Pressure Amplification and Risk of Cardiovascular Disease. Am. J. Hypertens. 2008, 21, 388–392. [Google Scholar] [CrossRef] [Green Version]
- Love, K.M.; Liu, J.; Regensteiner, J.G.; Reusch, J.E.B.; Liu, Z. GLP-1 and Insulin Regulation of Skeletal and Cardiac Muscle Microvascular Perfusion in Type 2 Diabetes. J. Diabetes 2020, 12, 488–498. [Google Scholar] [CrossRef] [Green Version]
- Remchak, M.-M.E.; Heiston, E.M.; Ballantyne, A.; Dotson, B.L.; Malin, S.K. Aortic. Waveform Responses to Insulin in Late versus Early Chronotype with Metabolic Syndrome. Physiol. Rep. 2022, 10, e15473. [Google Scholar] [CrossRef]
- Foster-Schubert, K.E.; Overduin, J.; Prudom, C.E.; Liu, J.; Callahan, H.S.; Gaylinn, B.D.; Thorner, M.O.; Cummings, D.E. Acyl and Total Ghrelin Are Suppressed Strongly by Ingested Proteins, Weakly by Lipids, and Biphasically by Carbohydrates. J. Clin. Endocrinol. Metab. 2008, 93, 1971–1979. [Google Scholar] [CrossRef] [Green Version]
- Sun, L.; Goh, H.J.; Govindharajulu, P.; Leow, M.K.-S.; Henry, C.J. Post-prandial Glucose, Insulin and Incretin Responses Differ by Test Meal Macronutrient Ingestion Sequence (PATTERN Study). Clin. Nutr. 2020, 39, 950–957. [Google Scholar] [CrossRef]
- Brown, M.A.; Green, B.P.; James, L.J.; Stevenson, E.J.; Rumbold, P.L.S. The Effect of a Dairy-Based Recovery Beverage on Post-Exercise Appetite and Energy Intake in Active Females. Nutrients 2016, 8, 355. [Google Scholar] [CrossRef] [PubMed] [Green Version]
- Yau, A.M.W.; McLaughlin, J.; Gilmore, W.; Maughan, R.J.; Evans, G.H. The Acute Effects of Simple Sugar Ingestion on Appetite, Gut-Derived Hormone Response, and Metabolic Markers in Men. Nutrients 2017, 9, 135. [Google Scholar] [CrossRef] [PubMed] [Green Version]
- Koopman, A.D.M.; Rutters, F.; Rauh, S.P.; Nijpels, G.; Holst, J.J.; Beulens, J.W.; Alssema, M.; Dekker, J.M. Incretin Responses to Oral Glucose and Mixed Meal Tests and Changes in Fasting Glucose Levels during 7 Years of Follow-up: The Hoorn Meal Study. PLoS ONE 2018, 13, e0191114. [Google Scholar] [CrossRef] [PubMed] [Green Version]
- Codella, R.; Benedini, S.; Paini, S.; Caumo, A.; Adamo, M.; Terruzzi, I.; Ferrulli, A.; Macrì, C.; Andreoni, L.; Sterlicchio, M.; et al. Effect of Sugar versus Mixed Breakfast on Metabolic and Neurofunctional Responses in Healthy Individuals. J. Diabetes Res. 2017, 2017, e9634585. [Google Scholar] [CrossRef] [Green Version]
- Gjesing, A.P.; Ekstrøm, C.T.; Eiberg, H.; Urhammer, S.A.; Holst, J.J.; Pedersen, O.; Hansen, T. Fasting and Oral Glucose-Stimulated Levels of Glucose-Dependent Insulinotropic Polypeptide (GIP) and Glucagon-like Peptide-1 (GLP-1) Are Highly Familial Traits. Diabetologia 2012, 55, 1338–1345. [Google Scholar] [CrossRef]
- Adam, T.C.M.; Westerterp-Plantenga, M.S. Activity-Induced GLP-1 Release in Lean and Obese Subjects. Physiol. Behav. 2004, 83, 459–466. [Google Scholar] [CrossRef]
- Mackelvie, K.J.; Meneilly, G.S.; Elahi, D.; Wong, A.C.K.; Barr, S.I.; Chanoine, J.-P. Regulation of Appetite in Lean and Obese Adolescents after Exercise: Role of Acylated and Desacyl Ghrelin. J. Clin. Endocrinol. Metab. 2007, 92, 648–654. [Google Scholar] [CrossRef]


| CONT | INT | ANOVA p Value | ||||
|---|---|---|---|---|---|---|
| Pre | Post | Pre | Post | Test | G × T | |
| n (female) | 14 (11) | 14 (11) | ||||
| Non-Hispanic white | 12 | 13 | ||||
| Non-Hispanic black | 1 | 1 | ||||
| Hispanic | 1 | 0 | ||||
| Age, yr | 62.1 ± 2.2 | 60.4 ± 2.0 | ||||
| Weight, kg | 94.3 ± 4.7 | 94.0 ± 4.7 | 88.7 ± 3.6 | 87.9 ± 3.7 | <0.01 | 0.07 |
| BMI, kg/m2 | 34.5 ± 1.9 | 34.4 ±1.9 | 32.1 ±1.3 | 31.8 ± 1.3 | <0.01 | 0.12 |
| VO2peak, mL⋅kg−1⋅min−1 | 20.1 ± 1.2 | 20.6 ± 1.5 | 20.3 ± 1.1 | 22.1 ± 1.1 | 0.01 | 0.13 |
| Glucose | ||||||
| Fasting, mg/dL | 105.2 ± 2.5 | 103.3 ± 3.3 | 101.7 ± 1.7 | 102.7 ± 2.2 | 0.74 | 0.36 |
| 120 min, mg/dL | 145.3 ± 8.7 | 132.9 ± 8.3 | 146.7 ± 11.1 | 128.9 ± 10.1 | 0.02 | 0.68 |
| tAUC, mg/dL × 180 min | 25,804.3 ± 1379.6 | 23,830.7 ± 1303.4 | 25,184.6 ± 1469.1 | 23,664.4 ± 1285.4 | 0.03 | 0.83 |
| CONT | INT | ANOVA p Value | ||||
|---|---|---|---|---|---|---|
| Pre | Post | Pre | Post | Test | G × T | |
| AG | ||||||
| Fasting, pg/mL | 66.1 ± 12.5 | 65.1 ± 10.0 | 83.3 ± 15.9 | 66.4 ± 8.9 | 0.32 | 0.41 |
| tAUC × 60 min, pg/mL | 1229.1 ± 206.6 | 1130.3 ± 135.4 | 1192.2 ± 167.4 | 1005.6 ± 127.3 | 0.20 | 0.94 |
| dAG | ||||||
| Fasting, pg/mL | 49.5 ± 8.4 | 52.5 ± 5.9 | 71.6 ± 13.5 | 64.8 ± 14.5 | 0.66 | 0.55 |
| tAUC × 60 min, pg/mL | 1049.5 ± 166.3 | 1186.3 ± 170.8 | 1615.0 ± 301.1 | 1481.0 ± 345.9 | 0.72 | 0.54 |
| GIP | ||||||
| Fasting, pg/mL | 62.9 ± 11.2 | 73.0 ± 15.1 | 59.5 ± 5.3 | 46.0 ± 7.0 | 0.73 | 0.03 |
| tAUC × 60 min, pg/mL | 8419.4 ± 1222.1 | 8666.7 ± 1175.0 | 10340.3 ± 603.6 | 10010.6 ± 1006.8 | 0.93 | 0.41 |
| GLP-1 | ||||||
| Fasting, pg/mL | 5.9 ± 1.9 | 7.9 ± 2.3 | 6.3 ± 1.4 | 5.2 ± 1.1 | 0.38 | 0.12 |
| tAUC × 60 min, pg/mL | 337.6 ± 90.3 | 413.2 ± 97.0 | 378.8 ± 48.7 | 368.3 ± 44.8 | 0.73 | 0.26 |
| Insulin | ||||||
| Fasting, μU/mL | 13.1 ± 2.5 | 12.3 ± 2.1 | 12.2 ± 2.3 | 12.1 ± 2.5 | 0.65 | 0.57 |
| 120 min, μU/mL | 101.0 ± 16.8 | 80.1 ± 11.6 | 93.0 ± 18.5 | 76.6 ± 15.9 | <0.01 | 0.95 |
| tAUC × 180 min, μU/mL | 14,232.1 ± 2143.5 | 12,051.5 ± 1829.2 | 14,482.1 ± 2027.2 | 12,330.4 ± 1770.1 | <0.01 | 0.98 |
| CONT | INT | ANOVA p Value | ||||
|---|---|---|---|---|---|---|
| Pre | Post | Pre | Post | Test | G × T | |
| bSBP | ||||||
| Fasting, mmHg | 131.1 ± 3.2 | 133.9 ± 3.4 | 140.2 ± 3.7 | 143.3 ± 5.0 | 0.66 | 0.58 |
| 120 min, mmHg | 135.9 ± 4.2 | 135.7 ± 3.8 | 143.4 ± 5.1 | 145.0 ± 4.6 | 0.57 | 0.88 |
| tAUC, mmHg × 180 min | 24,681.4 ± 614.5 | 23,196.4 ± 844.6 | 25,412.3 ± 620.3 | 25,772.1 ± 654.3 | 0.34 | 0.02 |
| cSBP | ||||||
| Fasting, mmHg | 124.9 ± 3.3 | 124.9 ± 3.1 | 134.9 ± 3.9 | 132.9 ± 4.9 | 0.14 | 0.09 |
| 120 min, mmHg | 125.3 ± 3.6 | 123.0 ± 3.4 | 131.5 ± 5.0 | 130.4 ± 4.6 | 0.96 | 0.82 |
| tAUC, mmHg × 180 min | 22,866.9 ± 546.6 | 22,107.5 ± 479.5 | 23,225.0 ± 562.0 | 23,185.4 ± 620.3 | 0.45 | 0.32 |
| bDBP | ||||||
| Fasting, mmHg | 79.6 ± 3.1 | 81.1 ± 2.9 | 85.3 ± 3.5 | 83.7 ± 3.0 | 0.92 | 0.53 |
| 120 min, mmHg | 79.0 ± 2.3 | 78.4 ± 2.4 | 80.0 ± 3.1 | 81.6 ± 2.9 | 0.45 | 0.19 |
| tAUC, mmHg × 180 min | 14,145.0 ± 392.9 | 13,305.0 ± 60.1 | 14,261.5 ± 351.0 | 14,481.4 ± 394.7 | 0.46 | 0.04 |
| cDBP | ||||||
| Fasting, mmHg | 80.9 ± 3.1 | 82.4 ± 2.9 | 84.5 ± 3.2 | 85.1 ± 3.0 | 0.98 | 0.55 |
| 120 min, mmHg | 80.1 ± 2.2 | 74.4 ± 2.4 | 81.1 ± 3.0 | 83.6 ± 2.9 | 0.33 | 0.19 |
| tAUC, mmHg × 180 min | 14,449.3 ± 394.8 | 14,287.5 ± 414.0 | 14,513.1 ± 343.5 | 14,755.7 ± 402.4 | 0.89 | 0.41 |
| bPP | ||||||
| Fasting, mmHg | 54.3 ± 2.7 | 52.8 ± 2.9 | 62.4 ± 2.5 | 59.6 ± 3.6 | 0.23 | 0.80 |
| 120 min, mmHg | 56.9 ± 3.4 | 57.3 ± 3.2 | 63.4 ± 4.1 | 63.4 ± 3.2 | 0.98 | 0.99 |
| tAUC, mmHg × 180 min | 10,620.0 ± 467.1 | 10,210.0 ± 401.3 | 11,173.8 ± 565.9 | 11,290.7 ± 483.7 | 0.58 | 0.10 |
| cPP | ||||||
| Fasting, mmHg | 44.0 ± 2.4 | 42.6 ± 2.5 | 50.6 ± 2.2 | 47.8 ± 3.4 | 0.16 | 0.98 |
| 120 min, mmHg | 44.1 ± 2.8 | 43.2 ± 2.5 | 49.6 ± 3.5 | 47.3 ± 2.9 | 0.75 | 0.37 |
| tAUC, mmHg × 180 min | 8247.7 ± 423.8 | 7820.0 ± 321.6 | 8651.5 ± 473.6 | 8520.0 ± 414.7 | 0.35 | 0.34 |
| AIx | ||||||
| Fasting, % | 28.4 ± 2.3 | 28.8 ± 2.5 | 28.5 ± 3.3 | 25.9 ± 3.0 | 0.56 | 0.55 |
| 120 min, % | 24.7 ± 2.1 | 18.4 ± 1.9 | 23.6 ± 3.2 | 17.0 ± 2.9 | <0.01 | 0.66 |
| tAUC, % × 180 min | 4753.8 ± 278.1 | 3730.7 ± 280.3 | 4097.1 ± 386.5 | 3398.6 ± 419.5 | <0.01 | 0.72 |
| AP | ||||||
| Fasting, mmHg | 15.4 ± 1.1 | 15.6 ± 1.4 | 19.1 ± 2.2 | 16.7 ± 2.2 | 0.26 | 0.35 |
| 120 min, mmHg | 13.6 ± 1.3 | 10.8 ± 1.1 | 16.5 ± 1.8 | 10.6 ± 2.1 | 0.02 | 0.52 |
| tAUC, mmHg × 180 min | 2809.3 ± 209.8 | 2222.5 ± 162.8 | 2765.0 ± 242.0 | 2190.0 ± 256.5 | <0.01 | 0.79 |
| HR | ||||||
| Fasting, beats min−1 | 60.0 ± 2.4 | 60.0 ± 2.9 | 58.7 ± 3.0 | 59.8 ± 2.2 | 0.66 | 0.22 |
| 120 min, beats min−1 | 62.9 ± 1.9 | 61.9 ± 2.2 | 61.1 ± 2.4 | 62.2 ± 1.9 | 0.94 | 0.35 |
| tAUC, mmHg × 180 min | 11,259.2 ± 348.0 | 11,357.5 ± 432.5 | 11,113.8 ± 429 | 11,112.5 ± 325.2 | 0.73 | 0.85 |
Disclaimer/Publisher’s Note: The statements, opinions and data contained in all publications are solely those of the individual author(s) and contributor(s) and not of MDPI and/or the editor(s). MDPI and/or the editor(s) disclaim responsibility for any injury to people or property resulting from any ideas, methods, instructions or products referred to in the content. |
© 2023 by the authors. Licensee MDPI, Basel, Switzerland. This article is an open access article distributed under the terms and conditions of the Creative Commons Attribution (CC BY) license (https://creativecommons.org/licenses/by/4.0/).
Share and Cite
Battillo, D.J.; Malin, S.K. Relation of Aortic Waveforms with Gut Hormones following Continuous and Interval Exercise among Older Adults with Prediabetes. Metabolites 2023, 13, 137. https://doi.org/10.3390/metabo13020137
Battillo DJ, Malin SK. Relation of Aortic Waveforms with Gut Hormones following Continuous and Interval Exercise among Older Adults with Prediabetes. Metabolites. 2023; 13(2):137. https://doi.org/10.3390/metabo13020137
Chicago/Turabian StyleBattillo, Daniel J., and Steven K. Malin. 2023. "Relation of Aortic Waveforms with Gut Hormones following Continuous and Interval Exercise among Older Adults with Prediabetes" Metabolites 13, no. 2: 137. https://doi.org/10.3390/metabo13020137