
Mathematical Modelling of Material Transfer to High-Density Lipoprotein (HDL) upon Triglyceride Lipolysis by Lipoprotein Lipase: Relevance to Cardioprotective Role of HDL

 , and
, and
Abstract
:
1. Introduction
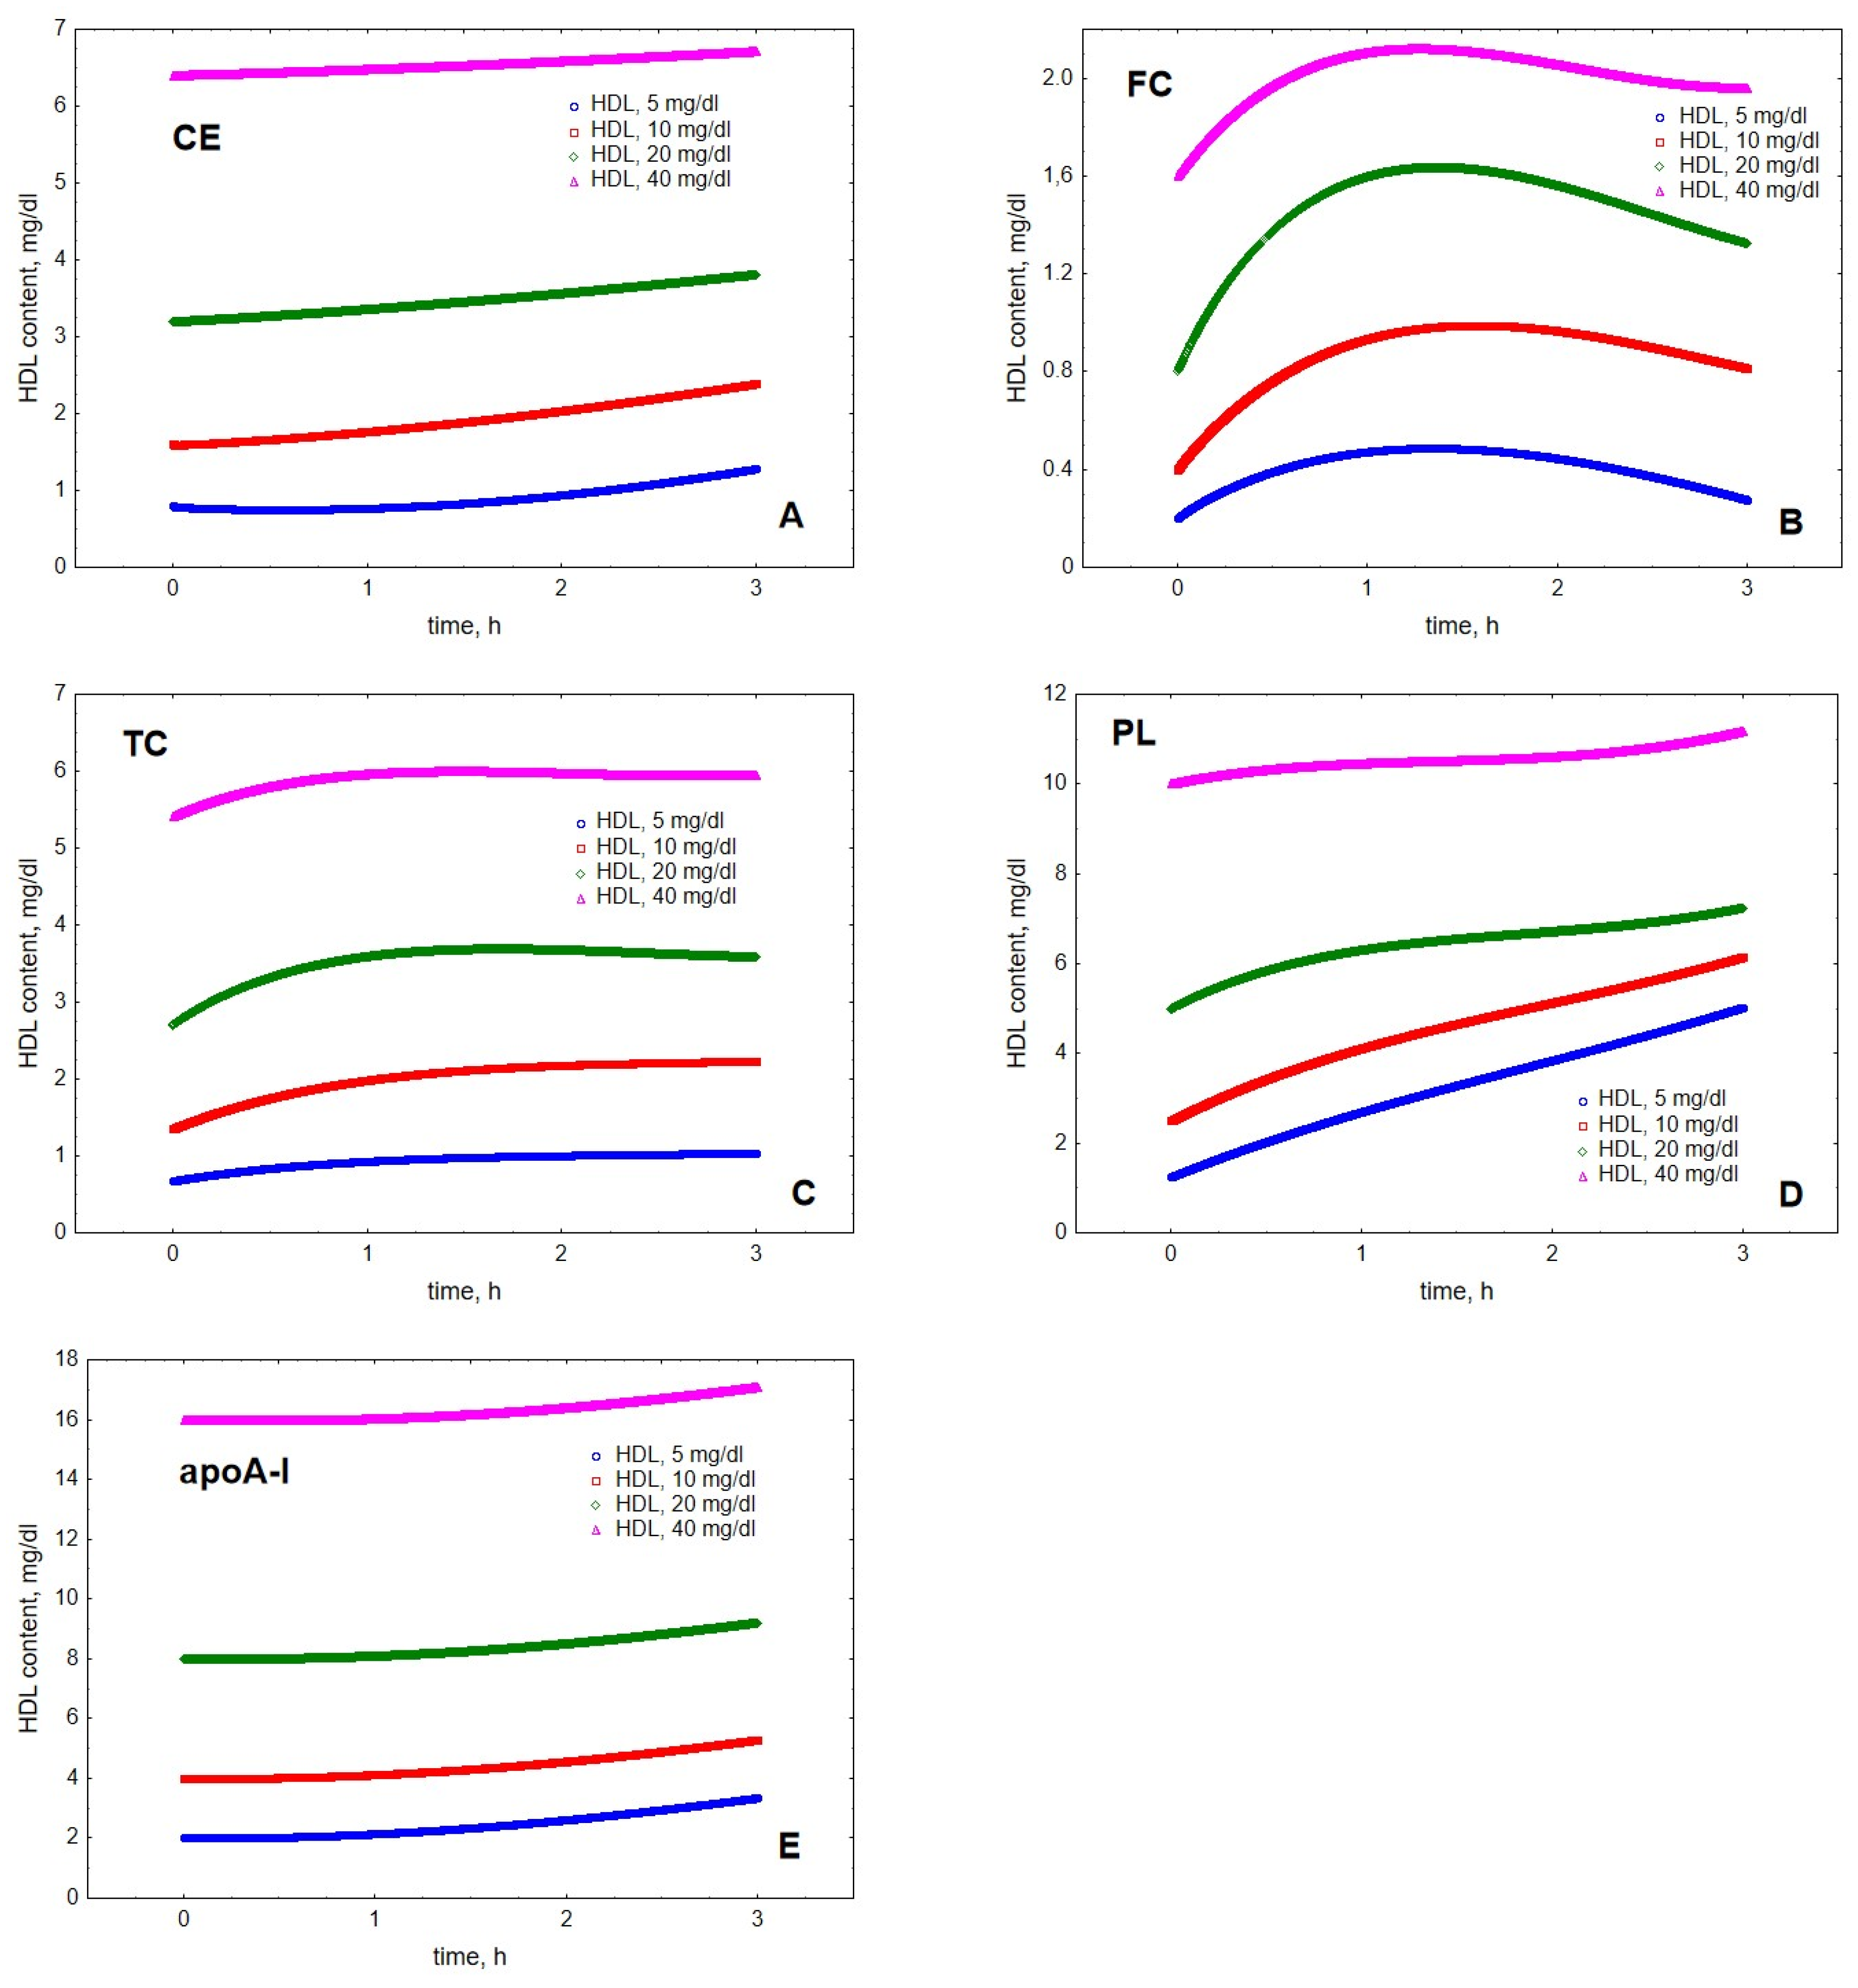
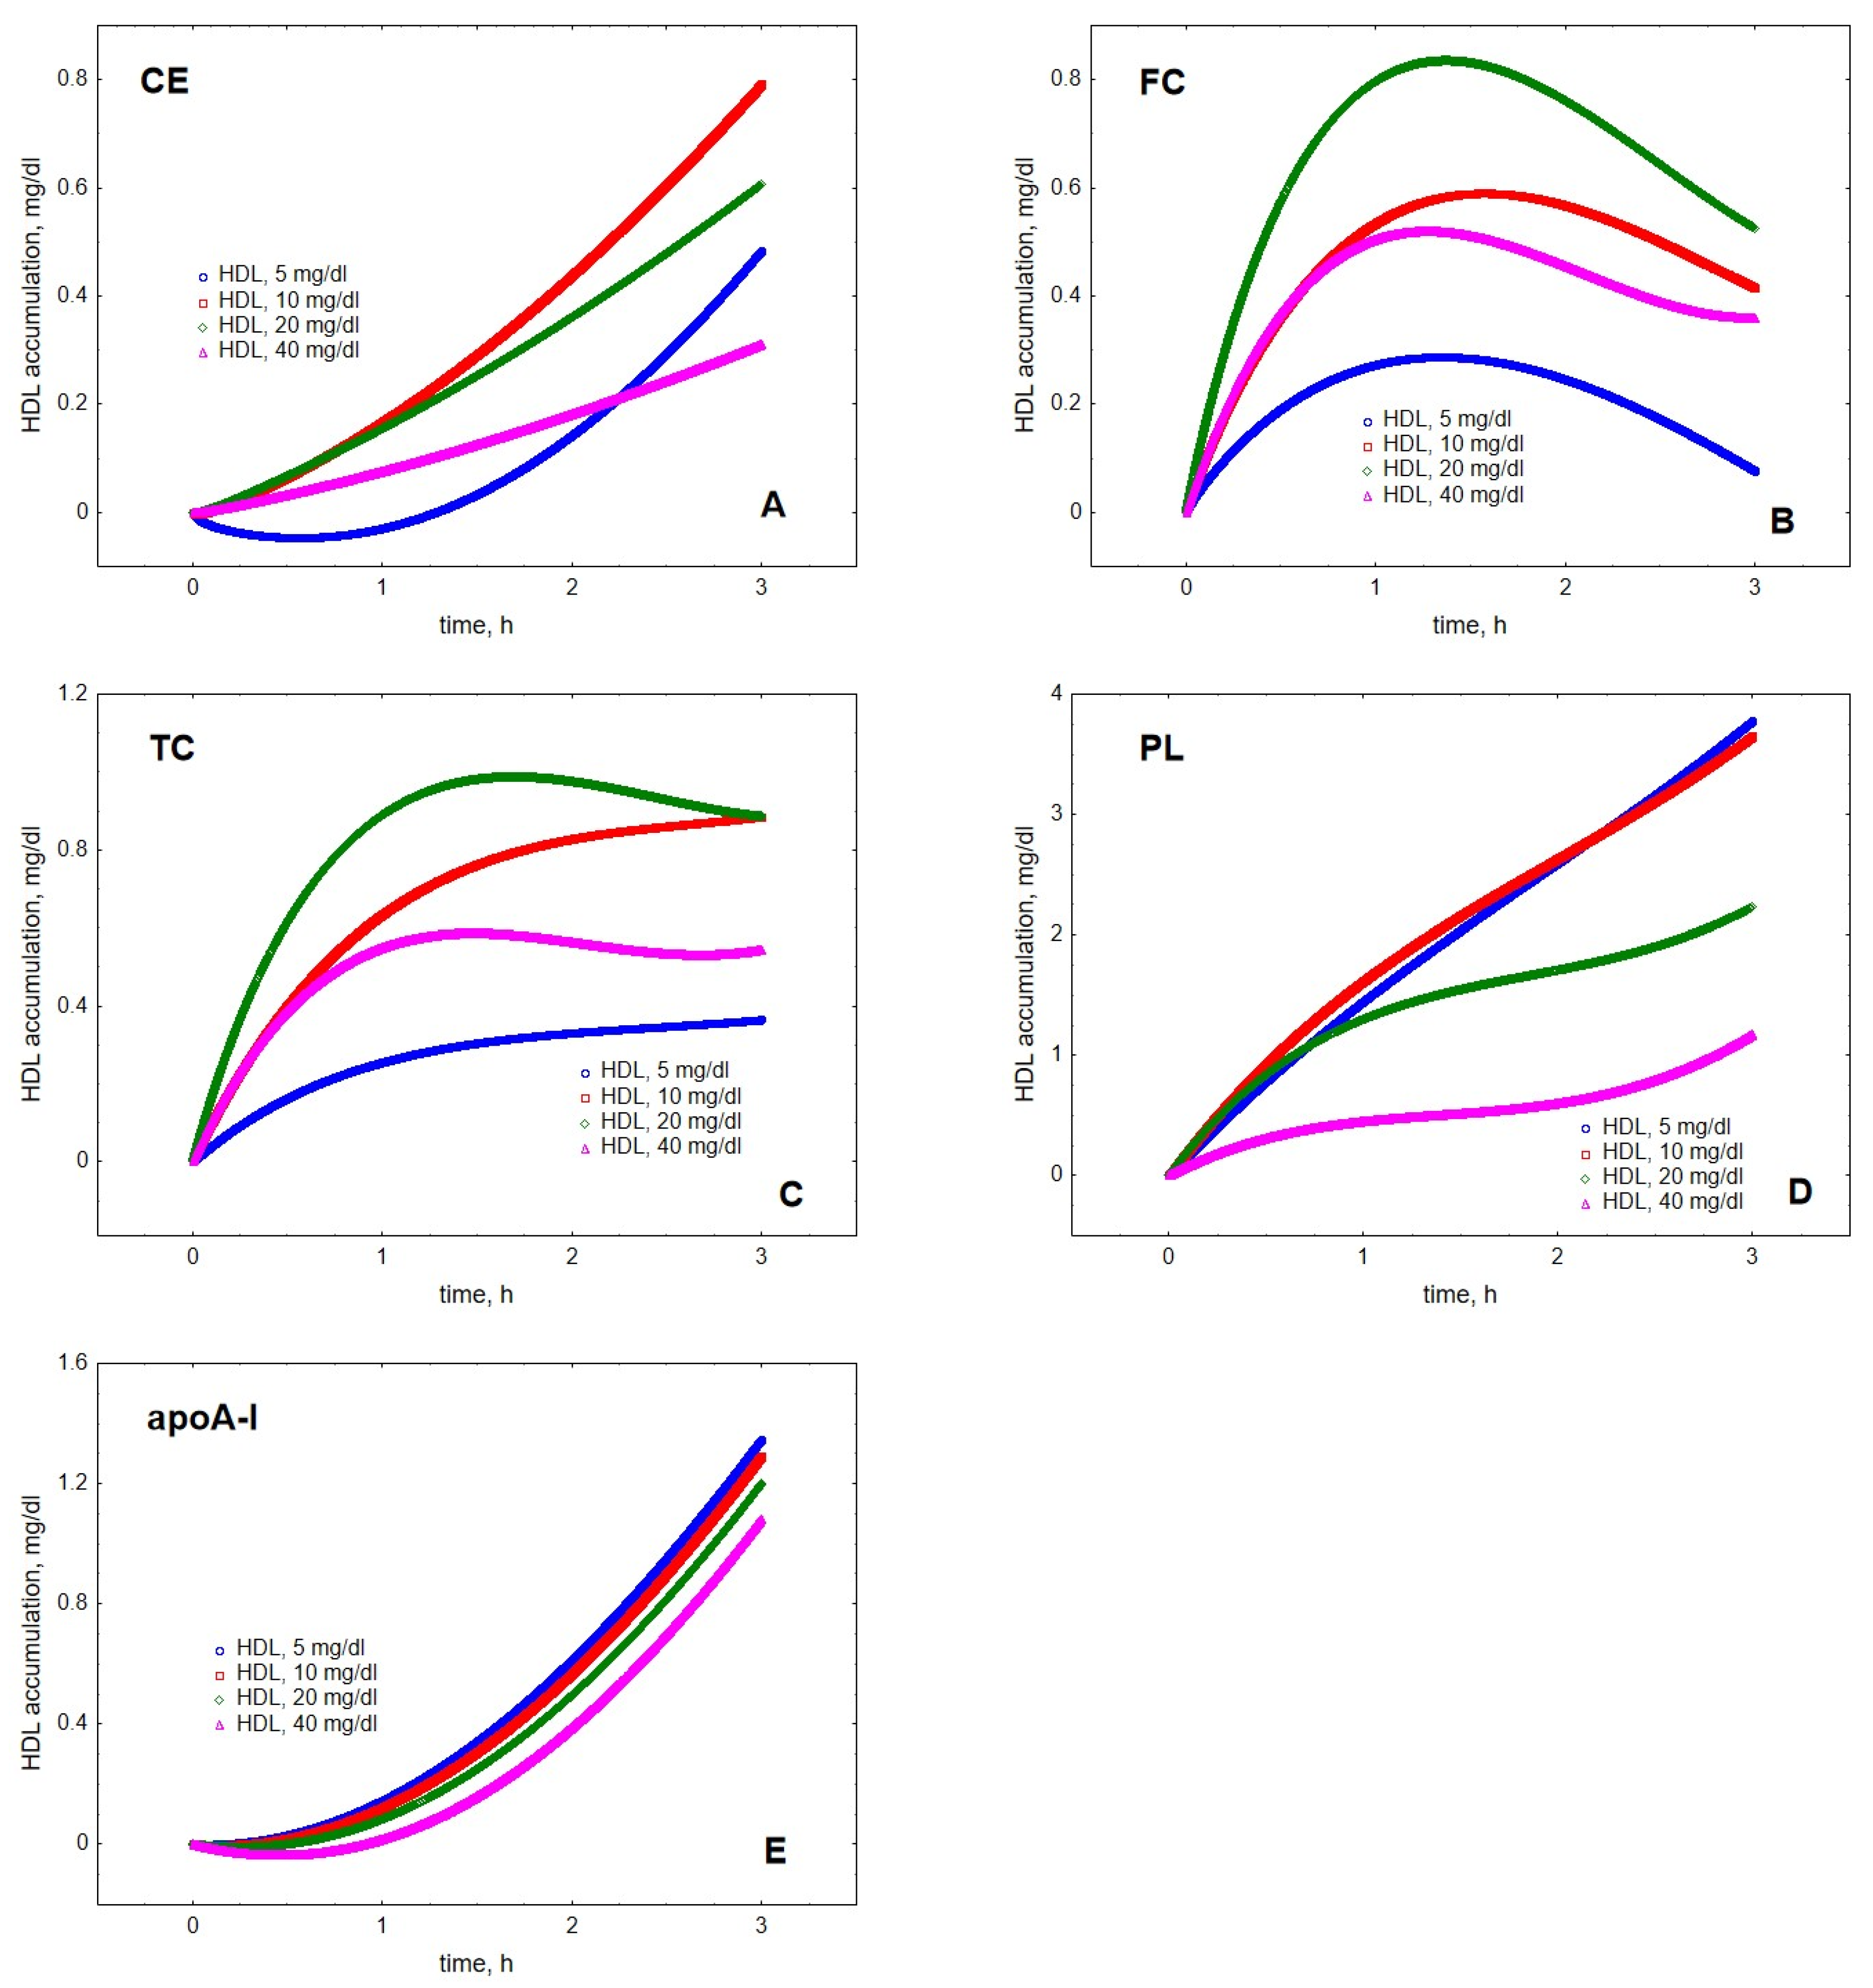
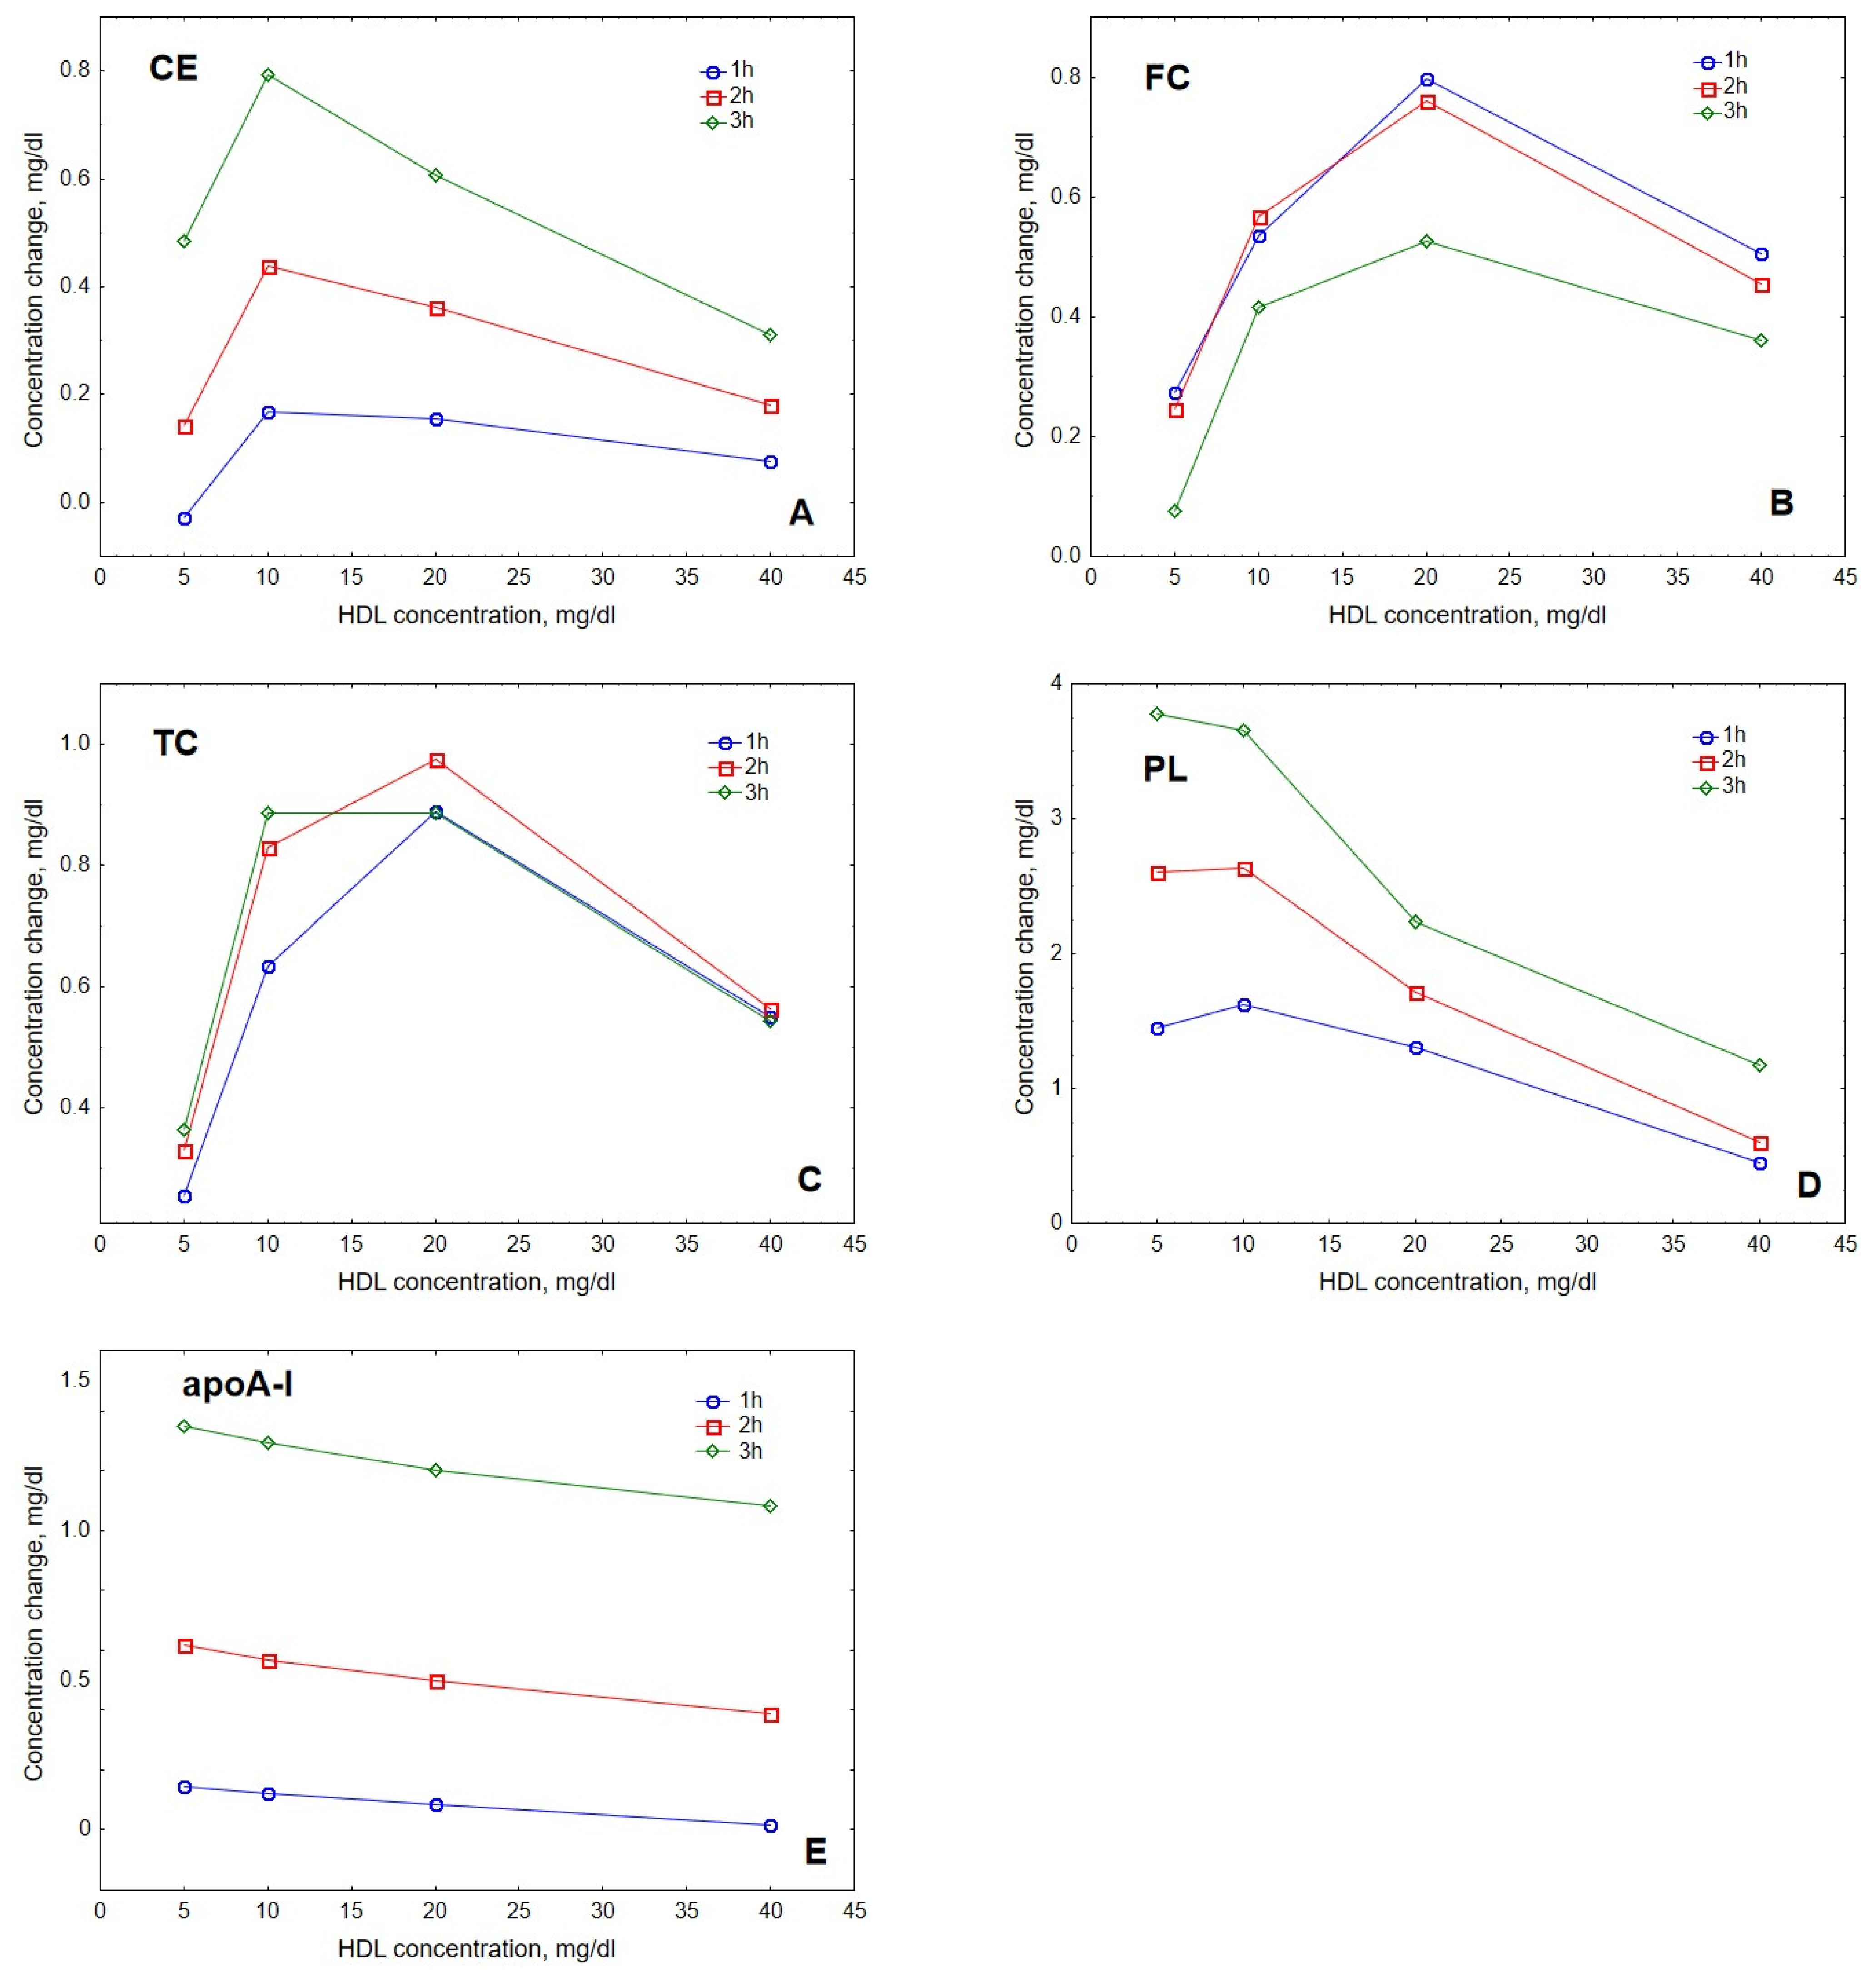
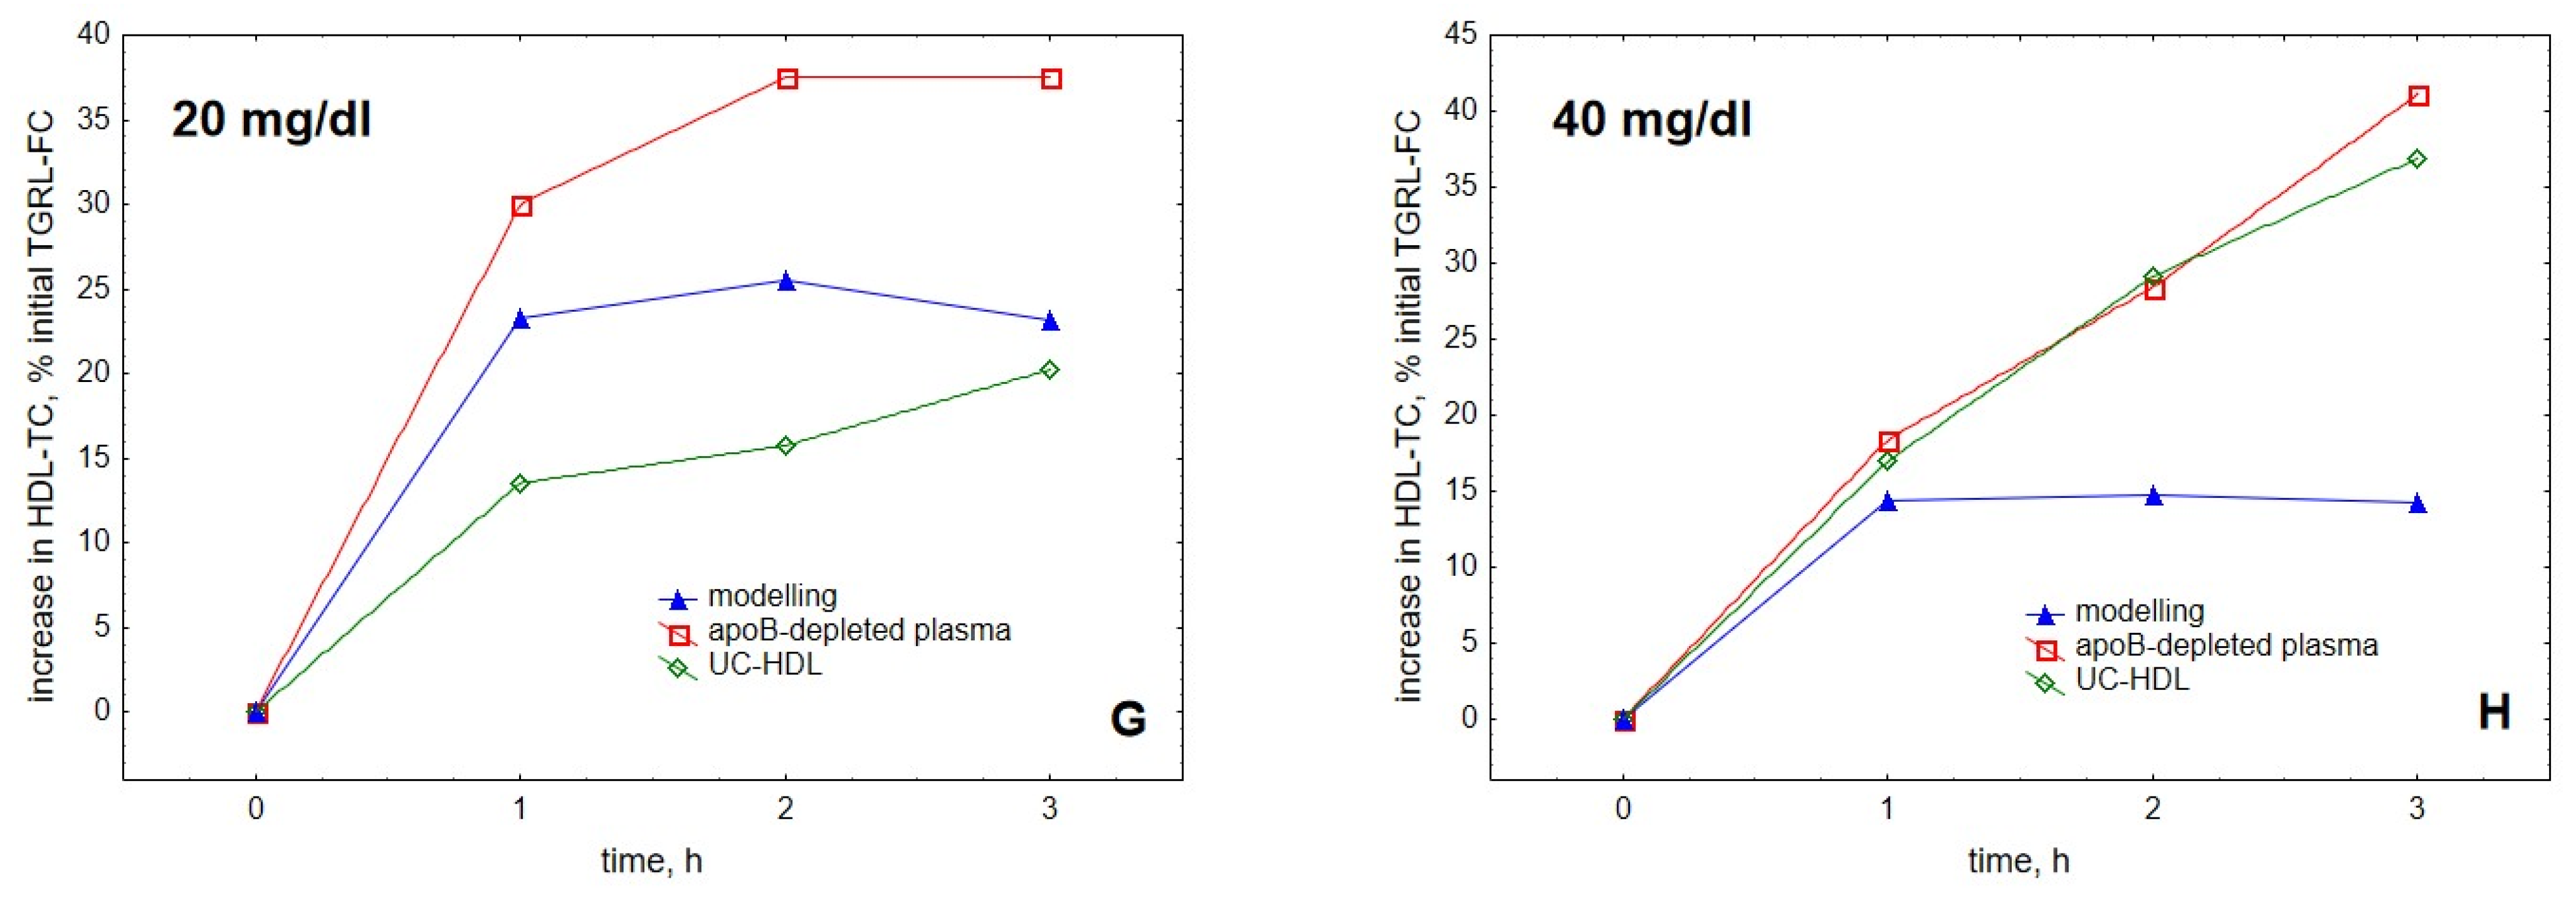
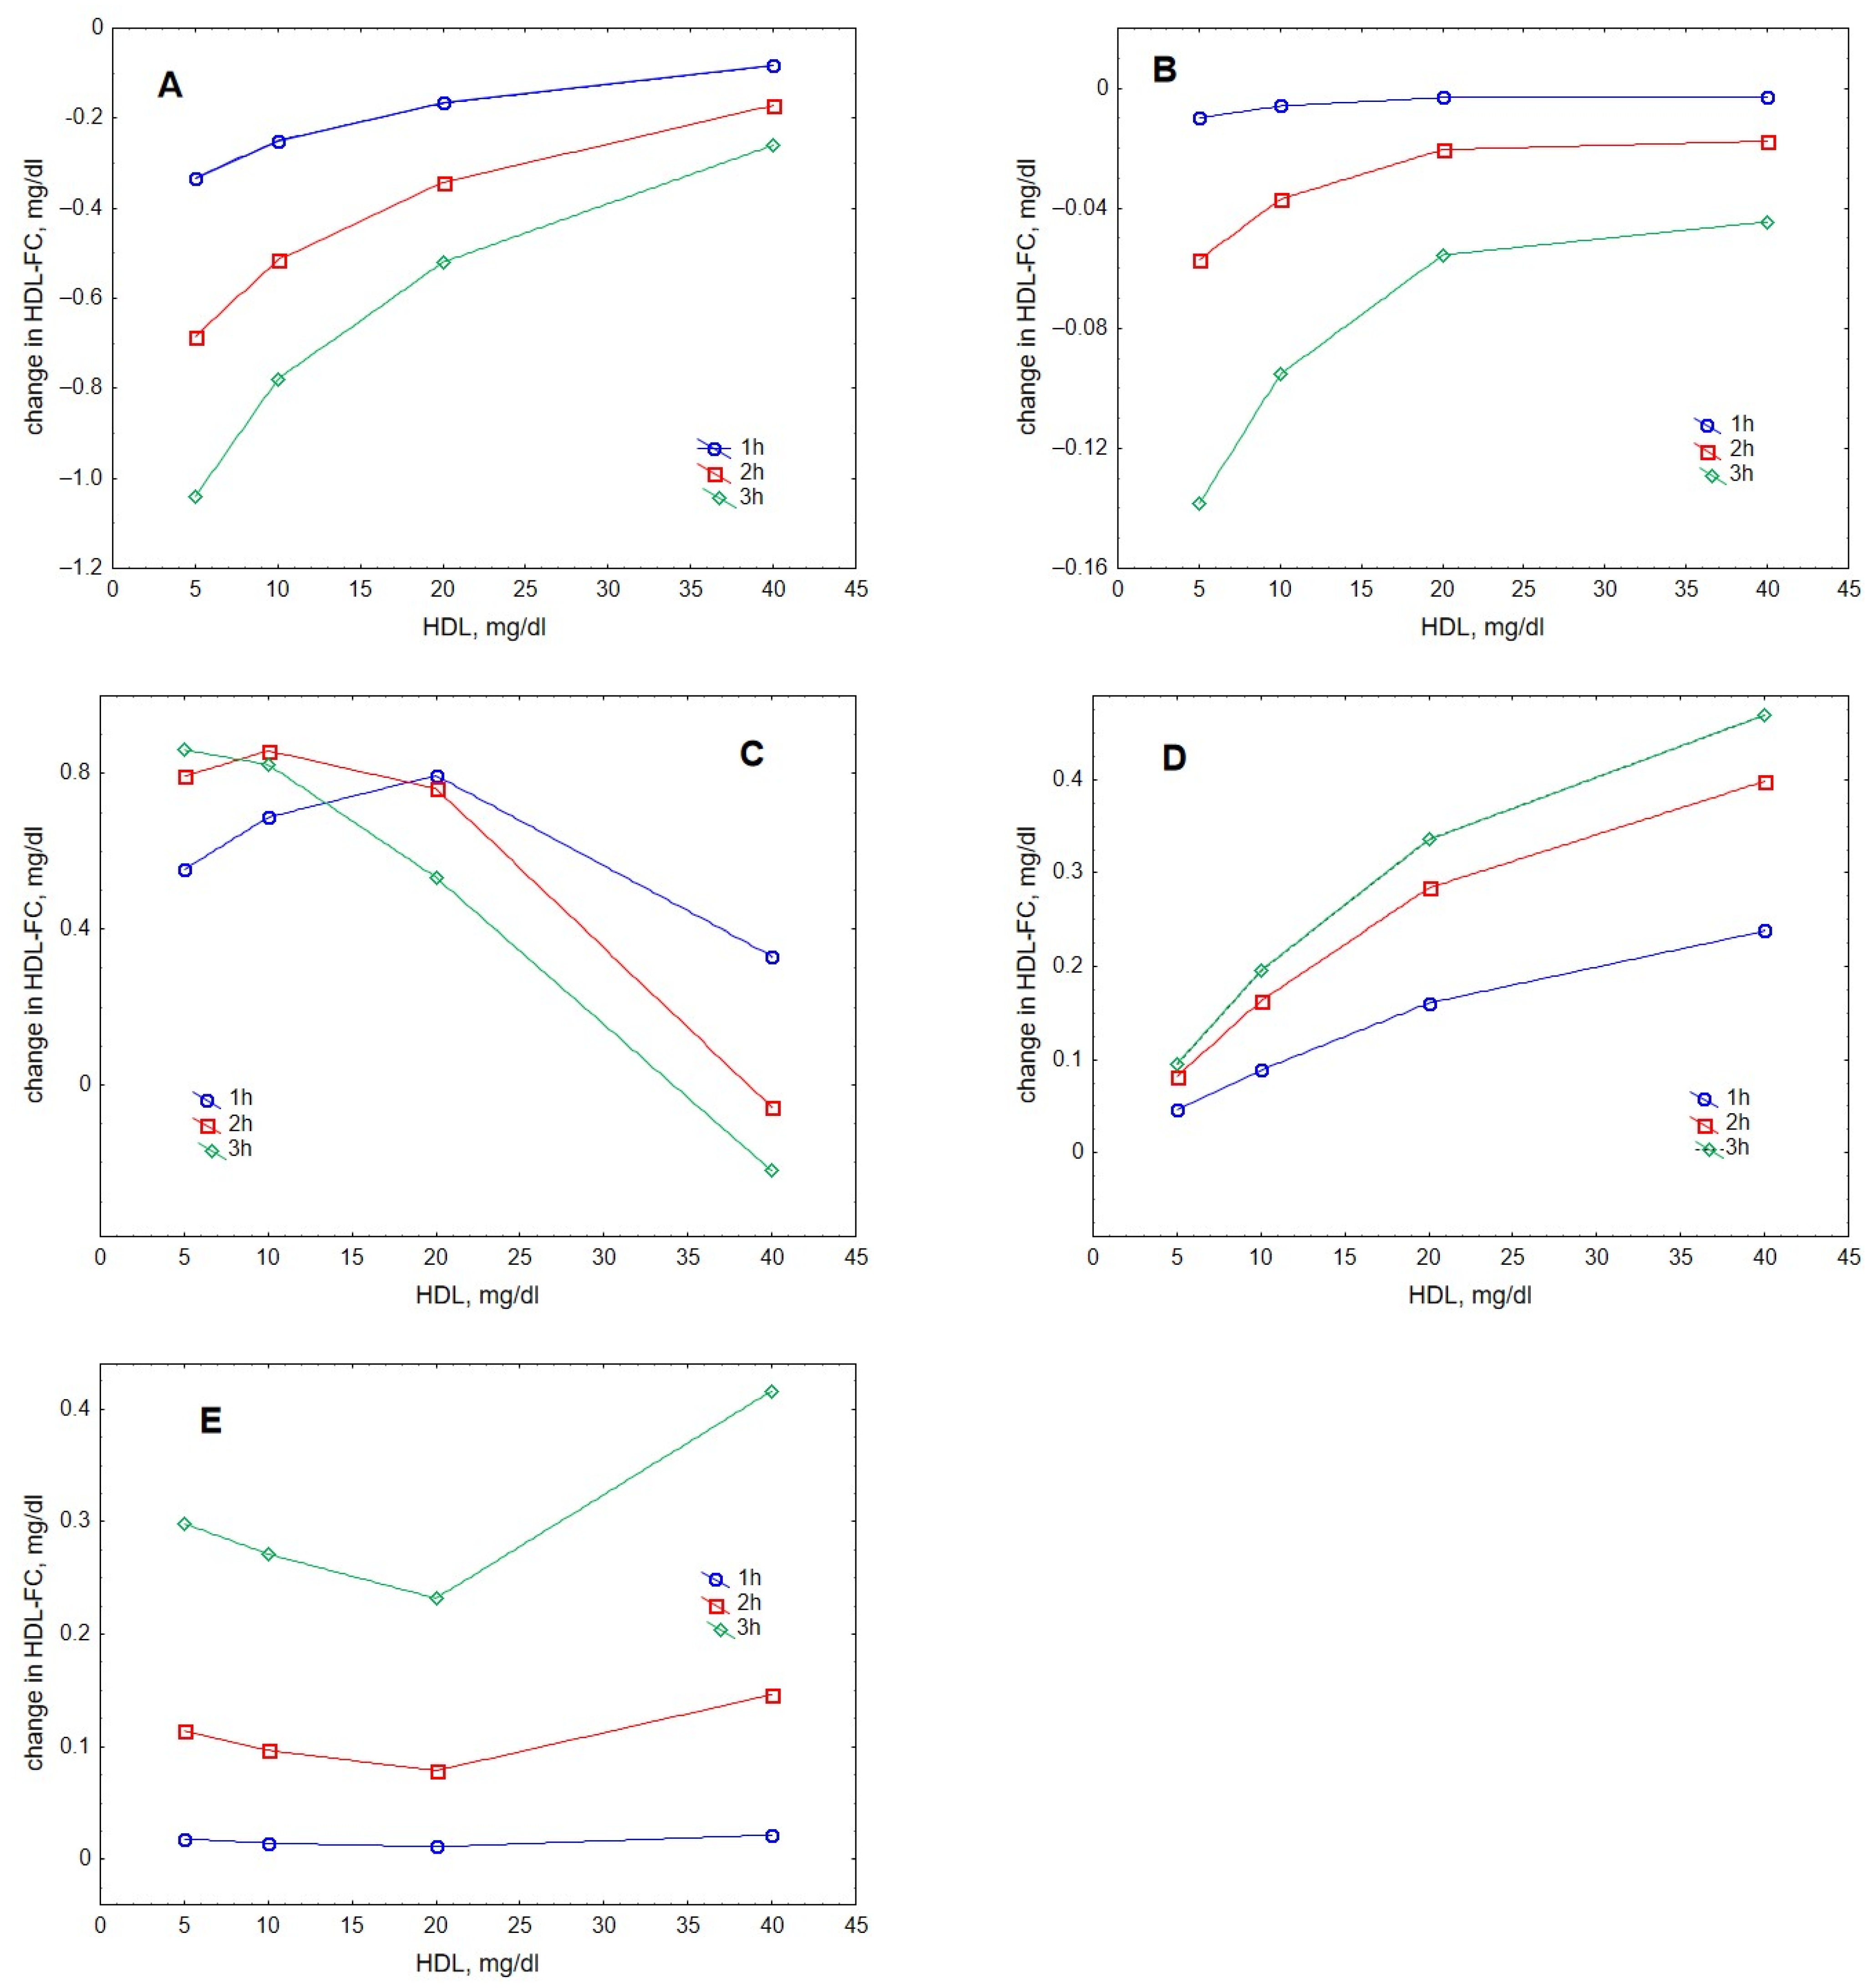
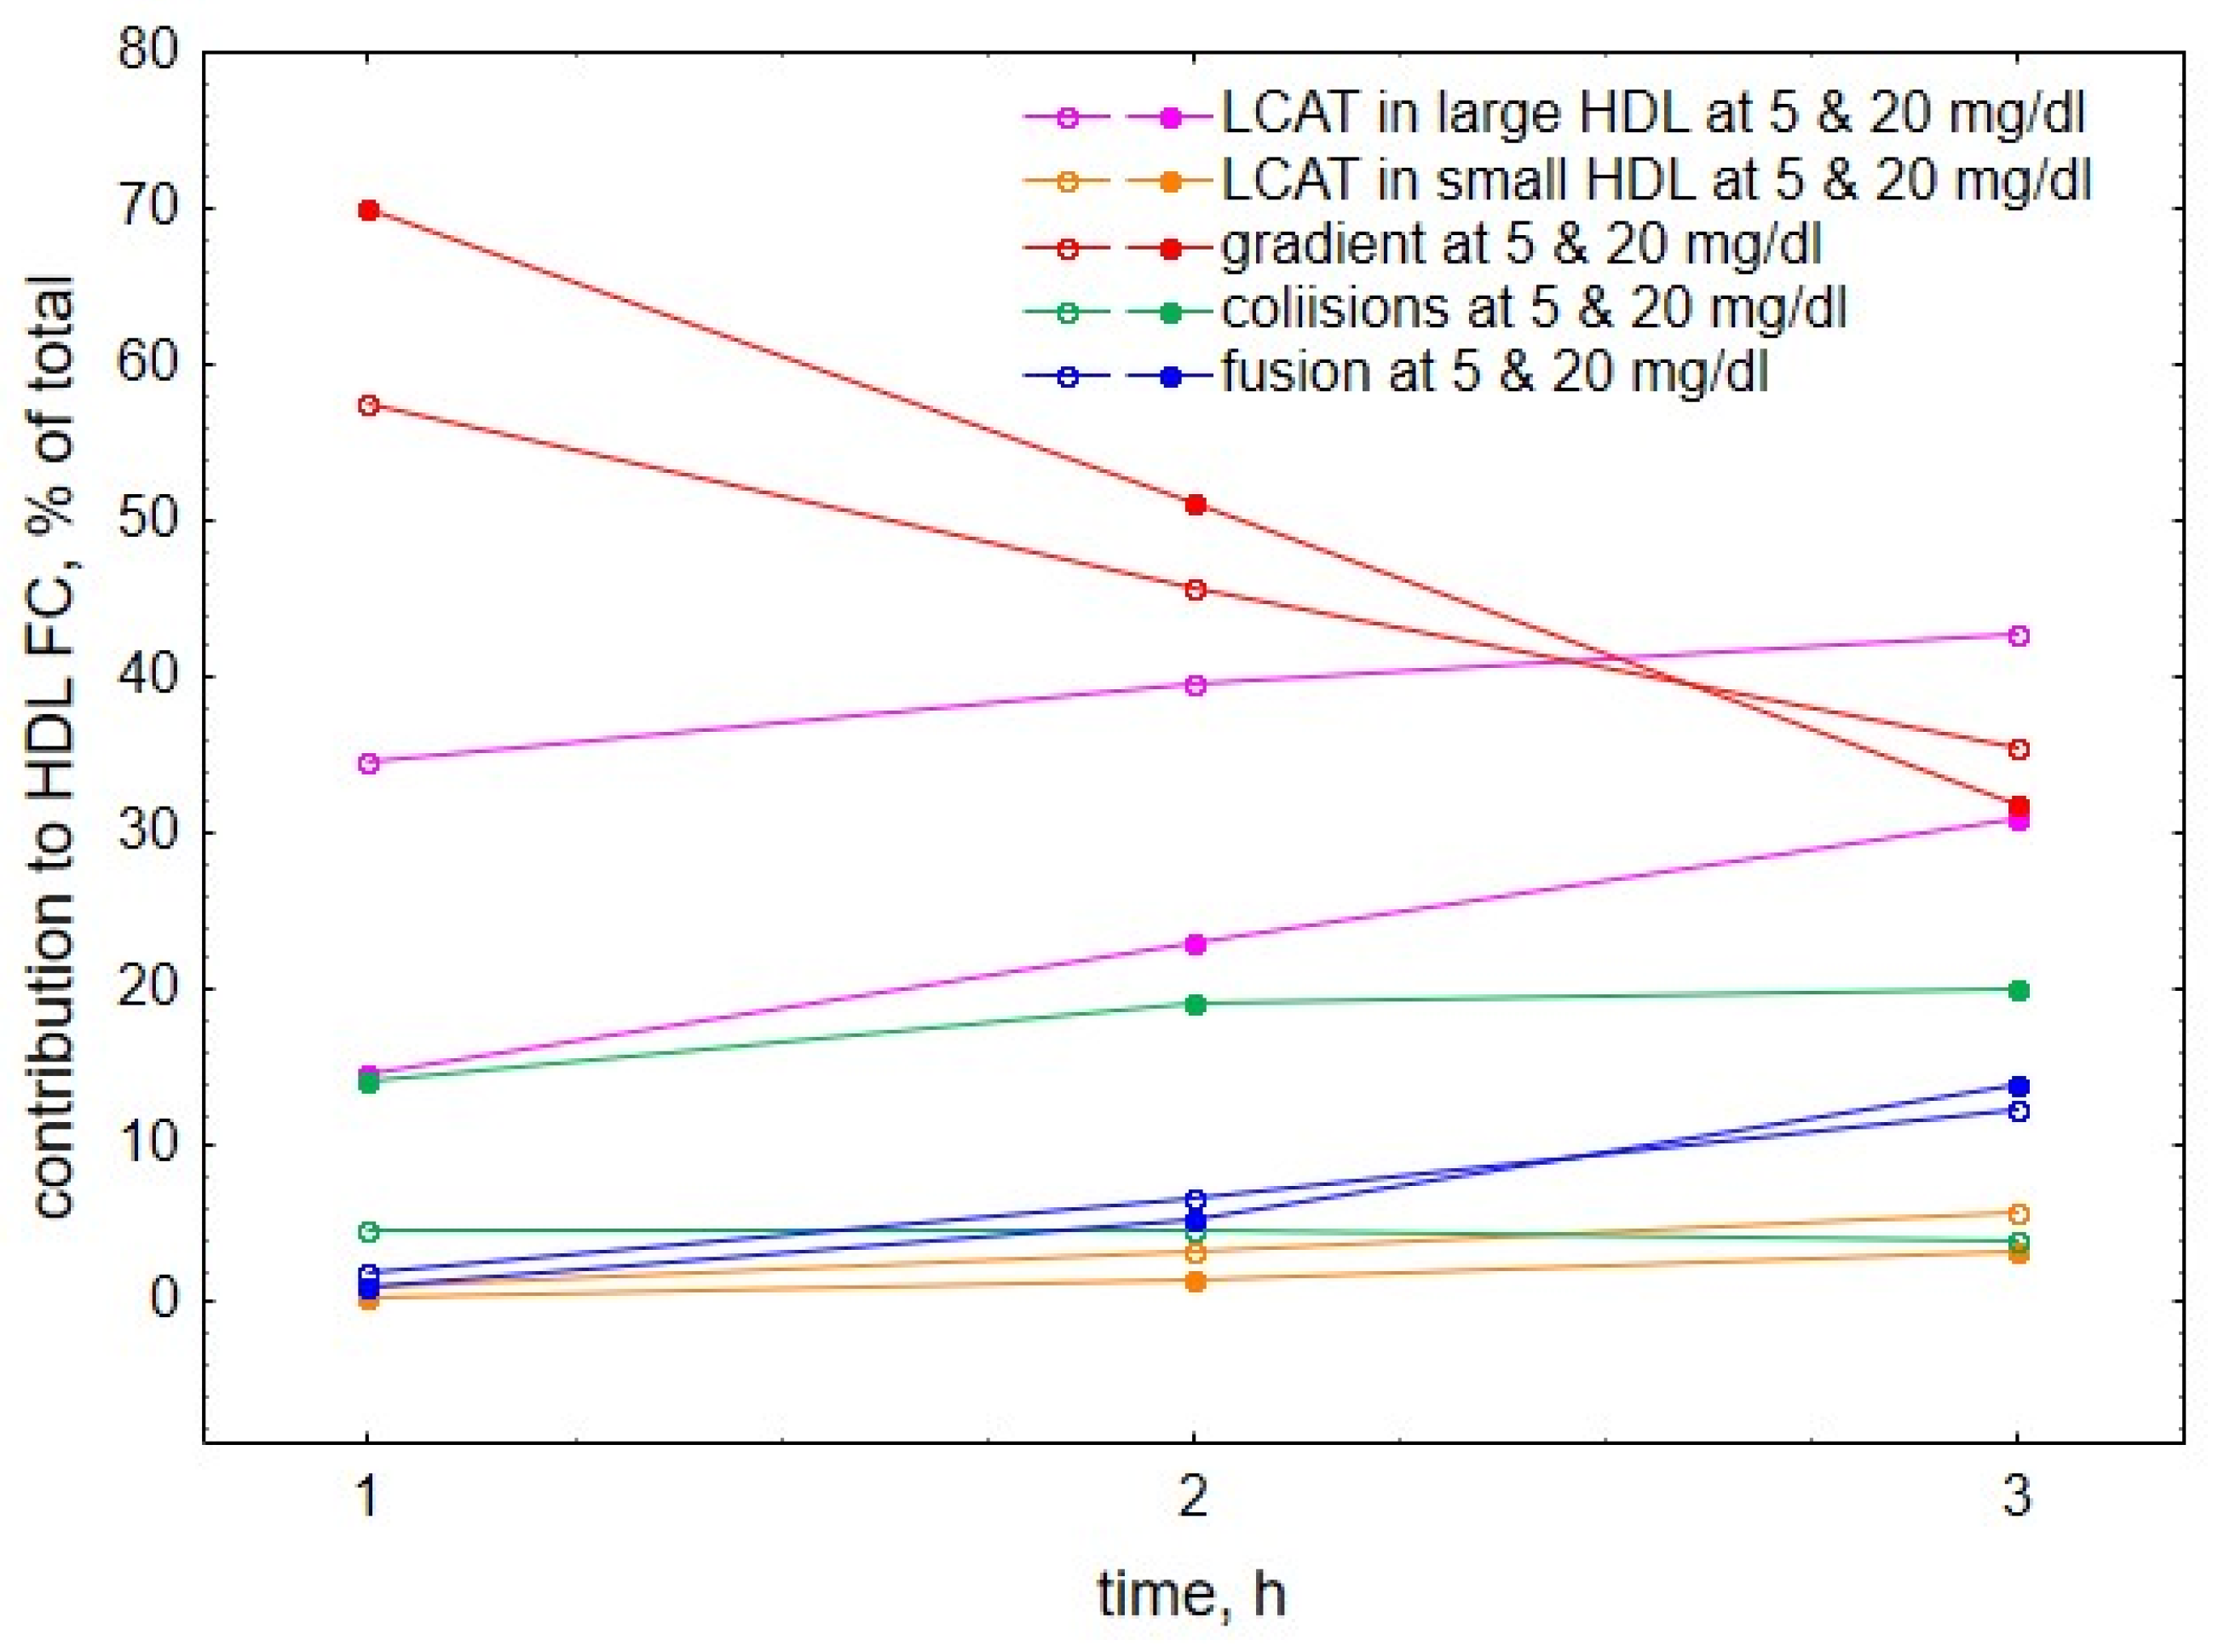
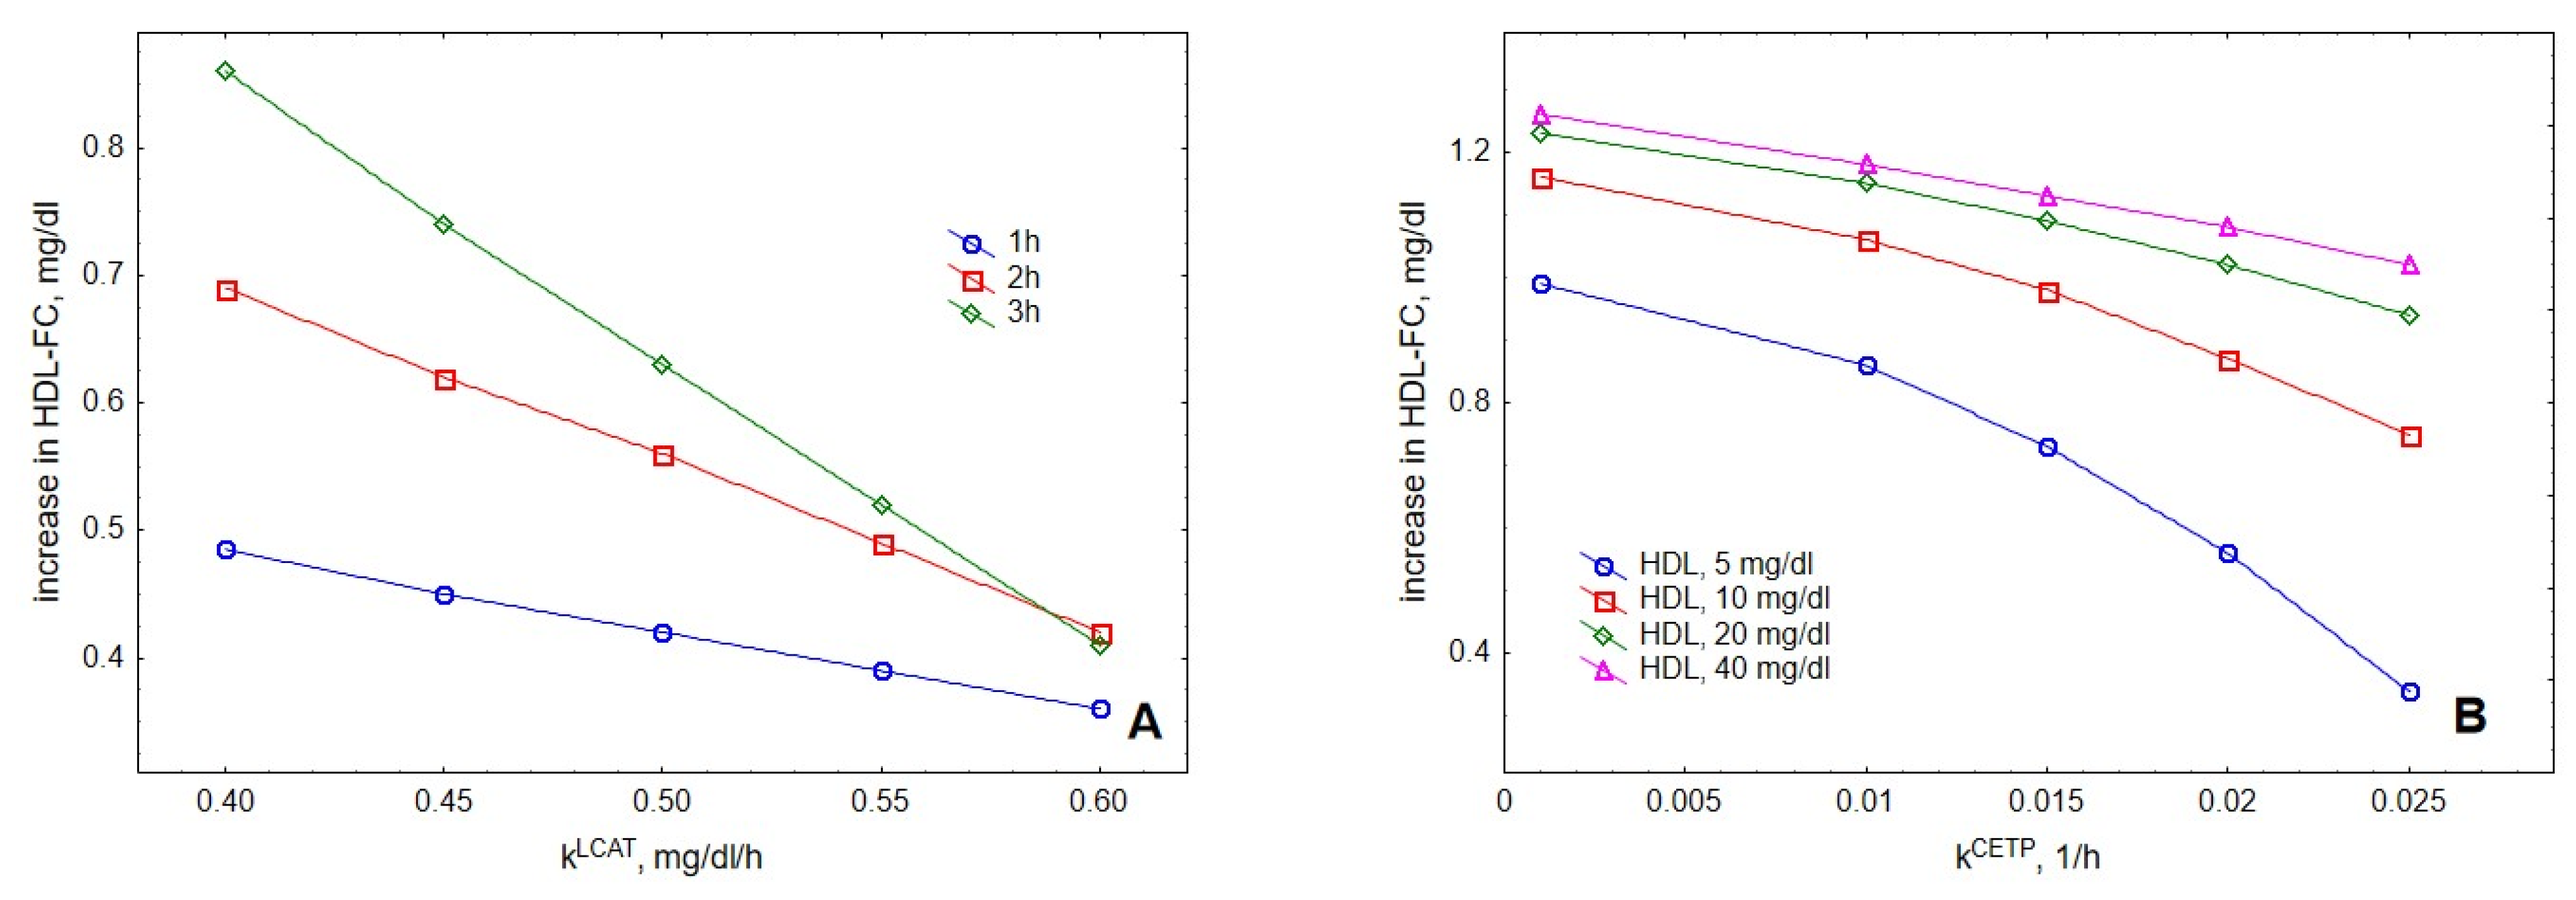
2. Results
3. Discussion
4. Methods
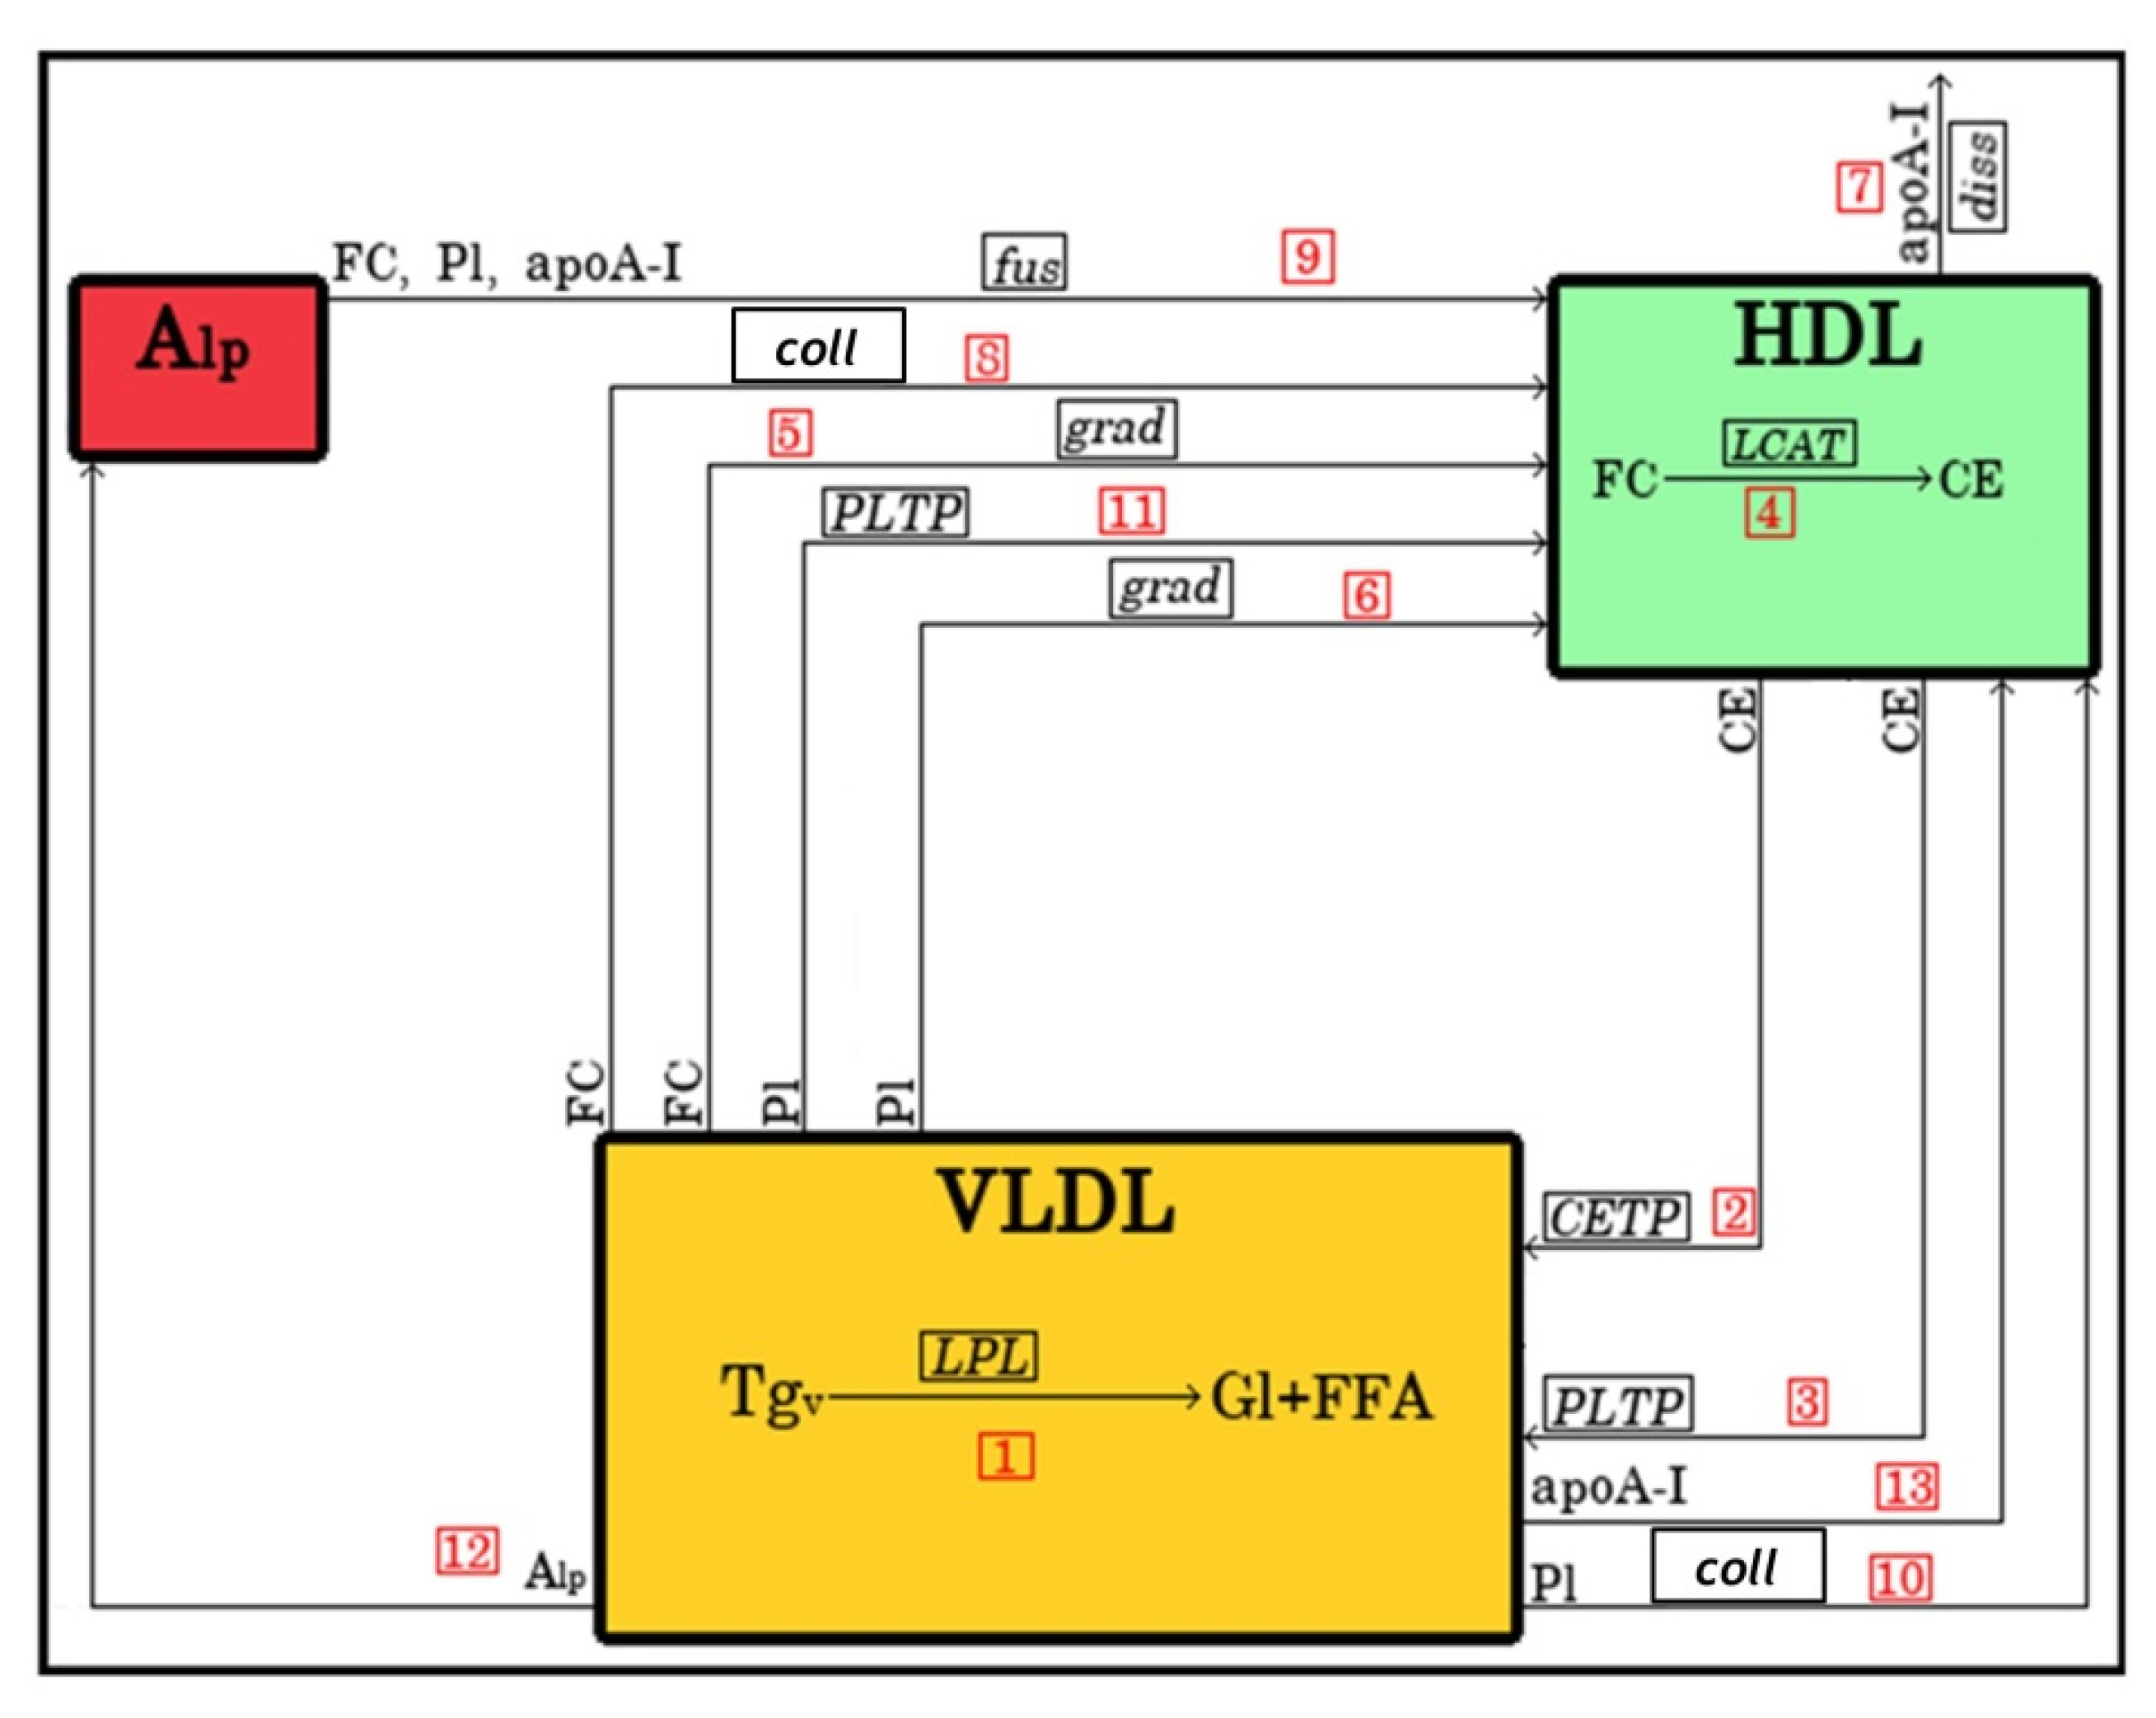
4.1. Model Structure
4.1.1. Lipoprotein Representation
4.1.2. Metabolic Processes
4.2. Mathematical Description of the Model
4.3. Variational Analysis
Supplementary Materials
Author Contributions
Funding
Institutional Review Board Statement
Informed Consent Statement
Data Availability Statement
Conflicts of Interest
References
- Kontush, A.; Chapman, M.J. High-Density Lipoproteins: Structure, Metabolism, Function and Therapeutics; Wiley & Sons: New York, NY, USA, 2012; pp. 1–648. [Google Scholar]
- Hegele, R.A. Plasma lipoproteins: Genetic influences and clinical implications. Nat. Rev. Genet. 2009, 10, 109–121. [Google Scholar] [CrossRef] [PubMed]
- Kontush, A.; Lindahl, M.; Lhomme, M.; Calabresi, L.; Chapman, M.J.; Davidson, W.S. Structure of HDL: Particle subclasses and molecular components. Handb. Exp. Pharmacol. 2015, 224, 3–51. [Google Scholar] [PubMed] [Green Version]
- Green, P.H.; Glickman, R.M. Intestinal lipoprotein metabolism. J. Lipid Res. 1981, 22, 1153–1173. [Google Scholar] [CrossRef]
- Field, F.J.; Mathur, S.N. Intestinal lipoprotein synthesis and secretion. Prog. Lipid Res. 1995, 34, 185–198. [Google Scholar] [CrossRef]
- Boren, J.; Chapman, M.J.; Krauss, R.M.; Packard, C.J.; Bentzon, J.F.; Binder, C.J.; Daemen, M.J.; Demer, L.L.; Hegele, R.A.; Nicholls, S.J.; et al. Low-density lipoproteins cause atherosclerotic cardiovascular disease: Pathophysiological, genetic, and therapeutic insights: A consensus statement from the European Atherosclerosis Society Consensus Panel. Eur. Heart J. 2020, 41, 2313–2330. [Google Scholar] [CrossRef]
- Ginsberg, H.N.; Packard, C.J.; Chapman, M.J.; Boren, J.; Aguilar-Salinas, C.A.; Averna, M.; Ference, B.A.; Gaudet, D.; Hegele, R.A.; Kersten, S.; et al. Triglyceride-rich lipoproteins and their remnants: Metabolic insights, role in atherosclerotic cardiovascular disease, and emerging therapeutic strategies-a consensus statement from the European Atherosclerosis Society. Eur. Heart J. 2021, 42, 4791–4806. [Google Scholar] [CrossRef] [PubMed]
- Toth, P.P.; Barter, P.J.; Rosenson, R.S.; Boden, W.E.; Chapman, M.J.; Cuchel, M.; D’Agostino, R.B., Jr.; Davidson, M.H.; Davidson, W.S.; Heinecke, J.W.; et al. High-density lipoproteins: A consensus statement from the National Lipid Association. J. Clin. Lipidol. 2013, 7, 484–525. [Google Scholar] [CrossRef]
- Kingwell, B.A.; Chapman, M.J.; Kontush, A.; Miller, N.E. HDL-targeted therapies: Progress, failures and future. Nat. Rev. Drug Discov. 2014, 13, 445–464. [Google Scholar] [CrossRef]
- Ko, D.T.; Alter, D.A.; Guo, H.; Koh, M.; Lau, G.; Austin, P.C.; Booth, G.L.; Hogg, W.; Jackevicius, C.A.; Lee, D.S.; et al. High-Density Lipoprotein Cholesterol and Cause-Specific Mortality in Individuals Without Previous Cardiovascular Conditions: The Canheart Study. J. Am. Coll. Cardiol. 2016, 68, 2073–2083. [Google Scholar] [CrossRef] [Green Version]
- Hirata, A.; Okamura, T.; Sugiyama, D.; Kuwabara, K.; Kadota, A.; Fujiyoshi, A.; Miura, K.; Okuda, N.; Ohkubo, T.; Okayama, A.; et al. The Relationship between Very High Levels of Serum High-Density Lipoprotein Cholesterol and Cause-Specific Mortality in a 20-Year Follow-Up Study of Japanese General Population. J. Atheroscler. Thromb. 2016, 23, 800–809. [Google Scholar] [CrossRef] [Green Version]
- Madsen, C.M.; Varbo, A.; Nordestgaard, B.G. Extreme high high-density lipoprotein cholesterol is paradoxically associated with high mortality in men and women: Two prospective cohort studies. Eur. Heart J. 2017, 38, 2478–2486. [Google Scholar] [CrossRef] [PubMed] [Green Version]
- Rader, D.J.; deGoma, E.M. Future of cholesteryl ester transfer protein inhibitors. Annu. Rev. Med. 2014, 65, 385–403. [Google Scholar] [CrossRef] [PubMed]
- Choi, H.Y.; Hafiane, A.; Schwertani, A.; Genest, J. High-Density Lipoproteins: Biology, Epidemiology, and Clinical Management. Can. J. Cardiol. 2017, 33, 325–333. [Google Scholar] [CrossRef] [PubMed]
- Chapman, M.J.; Le Goff, W.; Guerin, M.; Kontush, A. Cholesteryl ester transfer protein: At the heart of the action of lipid-modulating therapy with statins, fibrates, niacin, and cholesteryl ester transfer protein inhibitors. Eur. Heart J. 2010, 31, 149–164. [Google Scholar] [CrossRef] [Green Version]
- Nikkila, E.A.; Taskinen, M.R.; Sane, T. Plasma high-density lipoprotein concentration and subfraction distribution in relation to triglyceride metabolism. Am. Heart J. 1987, 113, 543–548. [Google Scholar] [CrossRef]
- Eisenberg, S. High density lipoprotein metabolism. J. Lipid Res. 1984, 25, 1017–1058. [Google Scholar] [CrossRef]
- Bartelt, A.; John, C.; Schaltenberg, N.; Berbee, J.F.P.; Worthmann, A.; Cherradi, M.L.; Schlein, C.; Piepenburg, J.; Boon, M.R.; Rinninger, F.; et al. Thermogenic adipocytes promote HDL turnover and reverse cholesterol transport. Nat. Commun. 2017, 8, 15010. [Google Scholar] [CrossRef]
- Karpe, F.; Bard, J.M.; Steiner, G.; Carlson, L.A.; Fruchart, J.C.; Hamsten, A. HDLs and alimentary lipemia. Studies in men with previous myocardial infarction at a young age. Arterioscler. Thromb. 1993, 13, 11–22. [Google Scholar] [CrossRef] [Green Version]
- Magill, P.; Rao, S.N.; Miller, N.E.; Nicoll, A.; Brunzell, J.; St Hilaire, J.; Lewis, B. Relationships between the metabolism of high-density and very-low-density lipoproteins in man: Studies of apolipoprotein kinetics and adipose tissue lipoprotein lipase activity. Eur. J. Clin. Investig. 1982, 12, 113–120. [Google Scholar] [CrossRef]
- Taskinen, M.R.; Kuusi, T. High density lipoproteins in postprandial lipemia. Relation to sex and lipoprotein lipase activity. Atherosclerosis 1986, 59, 121–130. [Google Scholar] [CrossRef]
- Tall, A.R.; Small, D.M. Solubilisation of phospholipid membranes by human plasma high density lipoproteins. Nature 1977, 265, 163–164. [Google Scholar] [CrossRef] [PubMed]
- Pownall, H.J.; Ehnholm, C. The unique role of apolipoprotein A-I in HDL remodeling and metabolism. Curr. Opin. Lipidol. 2006, 17, 209–213. [Google Scholar] [CrossRef] [PubMed]
- Huang, R.; Silva, R.A.; Jerome, W.G.; Kontush, A.; Chapman, M.J.; Curtiss, L.K.; Hodges, T.J.; Davidson, W.S. Apolipoprotein A-I structural organization in high-density lipoproteins isolated from human plasma. Nat. Struct. Mol. Biol. 2011, 18, 416–422. [Google Scholar] [CrossRef] [PubMed] [Green Version]
- Feng, M.; Darabi, M.; Tubeuf, E.; Canicio, A.; Lhomme, M.; Frisdal, E.; Lanfranchi-Lebreton, S.; Matheron, L.; Rached, F.; Ponnaiah, M.; et al. Free cholesterol transfer to high-density lipoprotein (HDL) upon triglyceride lipolysis underlies the U-shape relationship between HDL-cholesterol and cardiovascular disease. Eur. J. Prev. Cardiol. 2020, 27, 1606–1616. [Google Scholar] [CrossRef]
- Kontush, A. HDL and Reverse Remnant-Cholesterol Transport (RRT): Relevance to Cardiovascular Disease. Trends Mol. Med. 2020, 26, 1086–1100. [Google Scholar] [CrossRef]
- Atha, D.H.; Ingham, K.C. Mechanism of precipitation of proteins by polyethylene glycols. Analysis in terms of excluded volume. J. Biol. Chem. 1981, 256, 12108–12117. [Google Scholar] [CrossRef]
- Sankaranarayanan, S.; de la Llera-Moya, M.; Drazul-Schrader, D.; Phillips, M.C.; Kellner-Weibel, G.; Rothblat, G.H. Serum albumin acts as a shuttle to enhance cholesterol efflux from cells. J. Lipid Res. 2013, 54, 671–676. [Google Scholar] [CrossRef] [Green Version]
- Darabi, M.; Kontush, A. High-density lipoproteins (HDL): Novel function and therapeutic applications. Biochim. Biophys. Acta Mol. Cell Biol. Lipids 2021, 1867, 159058. [Google Scholar] [CrossRef]
- Sakurai, T.; Sakurai, A.; Vaisman, B.L.; Nishida, T.; Neufeld, E.B.; Demosky, S.J., Jr.; Sampson, M.L.; Shamburek, R.D.; Freeman, L.A.; Remaley, A.T. Development of a novel fluorescent activity assay for lecithin:cholesterol acyltransferase. Ann. Clin. Biochem. 2017, 55, 414–421. [Google Scholar] [CrossRef]
- Bisgaier, C.L.; Minton, L.L.; Essenburg, A.D.; White, A.; Homan, R. Use of fluorescent cholesteryl ester microemulsions in cholesteryl ester transfer protein assays. J. Lipid Res. 1993, 34, 1625–1634. [Google Scholar] [CrossRef]
- Schwartz, C.C.; VandenBroek, J.M.; Cooper, P.S. Lipoprotein cholesteryl ester production, transfer, and output in vivo in humans. J. Lipid Res. 2004, 45, 1594–1607. [Google Scholar] [CrossRef] [PubMed] [Green Version]
- Chung, B.H.; Tallis, G.; Yalamoori, V.; Anantharamaiah, G.M.; Segrest, J.P. Liposome-like particles isolated from human atherosclerotic plaques are structurally and compositionally similar to surface remnants of triglyceride-rich lipoproteins. Arterioscler. Thromb. 1994, 14, 622–635. [Google Scholar] [CrossRef] [PubMed] [Green Version]
- Camont, L.; Chapman, M.J.; Kontush, A. Biological activities of HDL subpopulations and their relevance to cardiovascular disease. Trends Mol. Med. 2011, 17, 594–603. [Google Scholar] [CrossRef] [PubMed]
- Chapman, M.J.; Goldstein, S.; Lagrange, D.; Laplaud, P.M. A density gradient ultracentrifugal procedure for the isolation of the major lipoprotein classes from human serum. J. Lipid Res. 1981, 22, 339–358. [Google Scholar] [CrossRef]
- Kontush, A.; Chantepie, S.; Chapman, M.J. Small, dense HDL particles exert potent protection of atherogenic LDL against oxidative stress. Arterioscler. Thromb. Vasc. Biol. 2003, 23, 1881–1888. [Google Scholar] [CrossRef] [Green Version]
- McLean, L.R.; Phillips, M.C. Mechanism of cholesterol and phosphatidylcholine exchange or transfer between unilamellar vesicles. Biochemistry 1981, 20, 2893–2900. [Google Scholar] [CrossRef]
- Lund-Katz, S.; Hammerschlag, B.; Phillips, M.C. Kinetics and mechanism of free cholesterol exchange between human serum high- and low-density lipoproteins. Biochemistry 1982, 21, 1969–2964. [Google Scholar] [CrossRef]
- Epps, D.E.; Harris, J.S.; Greenlee, K.A.; Fisher, J.F.; Marschke, C.K.; Castle, C.K.; Ulrich, R.G.; Moll, T.S.; Melchior, G.W.; Kézdy, F.J. Method for measuring the activities of cholesteryl ester transfer protein (lipid transfer protein). Chem. Phys. Lipids 1995, 77, 51–63. [Google Scholar] [CrossRef]
- Moate, P.J.; Boston, R.C.; Jenkins, T.C.; Lean, I.J. Kinetics of ruminal lipolysis of triacylglycerol and biohydrogenation of long-chain fatty acids: New insights from old data. J. Dairy Sci. 2008, 91, 731–742. [Google Scholar] [CrossRef] [Green Version]
- Zannis, V.I.; Chroni, A.; Krieger, M. Role of apoA-I, ABCA1, LCAT, and SR-BI in the biogenesis of HDL. J. Mol. Med. 2006, 84, 276–294. [Google Scholar] [CrossRef]
- Cobbold, C.A.; Sherratt, J.A.; Maxwell, S.R. Lipoprotein oxidation and its significance for atherosclerosis: A mathematical approach. Bull. Math. Biol. 2002, 64, 65–95. [Google Scholar] [CrossRef] [PubMed] [Green Version]
- Duong, P.T.; Weibel, G.L.; Lund-Katz, S.; Rothblat, G.H.; Phillips, M.C. Characterization and properties of pre beta-HDL particles formed by ABCA1-mediated cellular lipid efflux to apoA-I. J. Lipid Res. 2008, 49, 1006–1014. [Google Scholar] [CrossRef] [PubMed] [Green Version]
- Gambert, P. Role of lipid transfers in intravascular lipoprotein metabolism in human. C R Seances Soc. Biol. Fil. 1995, 189, 883–888. [Google Scholar] [PubMed]
- Shen, B.W.; Scanu, A.M.; Kezdy, F.J. Structure of human serum lipoproteins inferred from compositional analysis. Proc. Natl. Acad. Sci. USA 1977, 74, 837–841. [Google Scholar] [CrossRef] [PubMed] [Green Version]
- Lu, J.; Hubner, K.; Nanjee, M.N.; Brinton, E.A.; Mazer, N.A. An in-silico model of lipoprotein metabolism and kinetics for the evaluation of targets and biomarkers in the reverse cholesterol transport pathway. PLoS Comput. Biol. 2014, 10, e1003509. [Google Scholar] [CrossRef] [Green Version]
- Paalvast, Y.; Kuivenhoven, J.A.; Groen, A.K. Agent-Based Modeling Predicts HDL-independent Pathway of Removal of Excess Surface Lipids from Very Low Density Lipoprotein. Atherosclerosis 2018, 275, e22. [Google Scholar] [CrossRef]
- Lippiello, P.M.; Waite, M. Kinetics and mechanism of phosphatidylcholine and cholesterol exchange between chylomicrons and high-density lipoproteins. Biochem. J. 1983, 215, 279–286. [Google Scholar] [CrossRef] [Green Version]
- Sparks, D.L.; Anantharamaiah, G.M.; Segrest, J.P.; Phillips, M.C. Effect of the cholesterol content of reconstituted LpA-I on lecithin:cholesterol acyltransferase activity. J. Biol. Chem. 1995, 270, 5151–5157. [Google Scholar] [CrossRef] [Green Version]
- Dergunov, A.D.; Shabrova, E.V.; Dobretsov, G.E. Cholesteryl ester diffusion, location and self-association constraints determine CETP activity with discoidal HDL: Excimer probe study. Arch. Biochem. Biophys. 2014, 564, 211–218. [Google Scholar] [CrossRef]
- Hansel, B.; Giral, P.; Nobecourt, E.; Chantepie, S.; Bruckert, E.; Chapman, M.J.; Kontush, A. Metabolic syndrome is associated with elevated oxidative stress and dysfunctional dense high-density lipoprotein particles displaying impaired antioxidative activity. J. Clin. Endocrinol. Metab. 2004, 89, 4963–4971. [Google Scholar] [CrossRef]
- Kontush, A.; de Faria, E.C.; Chantepie, S.; Chapman, M.J. A normotriglyceridemic, low HDL-cholesterol phenotype is characterised by elevated oxidative stress and HDL particles with attenuated antioxidative activity. Atherosclerosis 2005, 182, 277–285. [Google Scholar] [CrossRef] [PubMed]
- Nobecourt, E.; Jacqueminet, S.; Hansel, B.; Chantepie, S.; Grimaldi, A.; Chapman, M.J.; Kontush, A. Defective antioxidative activity of small, dense HDL particles in type 2 diabetes: Relationship to elevated oxidative stress and hyperglycemia. Diabetologia 2005, 48, 529–538. [Google Scholar] [CrossRef] [PubMed]
- De Souza, J.A.; Vindis, C.; Hansel, B.; Negre-Salvayre, A.; Therond, P.; Serrano Jr, C.V.; Chantepie, S.; Salvayre, R.; Bruckert, E.; Chapman, M.J.; et al. Metabolic syndrome features small, apolipoprotein A-I-poor, triglyceride-rich HDL3 particles with defective anti-apoptotic activity. Atherosclerosis 2008, 197, 84. [Google Scholar] [CrossRef] [PubMed]
- Chantepie, S.; Bochem, A.E.; Chapman, M.J.; Hovingh, G.K.; Kontush, A. High-density lipoprotein (HDL) particle subpopulations in heterozygous cholesteryl ester transfer protein (CETP) deficiency: Maintenance of antioxidative activity. PLoS ONE 2012, 7, e49336. [Google Scholar] [CrossRef] [Green Version]


| Symbol | Description |
|---|---|
| Alp | lipid-poor apoA-I |
| Aα | apoA-I in HDLα |
| CEα | CE in HDLα |
| FCα | FC in HDLα |
| Plα | PL in HDLα |
| Tgα | TG in HDLα |
| TCα | TC in HDLα |
| AV | apoA-I in VLDL |
| CEV | CE in VLDL |
| FCV | FC in VLDL |
| PlV | PL in VLDL |
| TgV | TG in VLDL |
| Dg | diglyceride |
| Mg | monoglyceride |
| FFA | free fatty acid |
| Gl | glycerol |
| No. | Reaction | Description | Reaction Rate |
|---|---|---|---|
| 1 | Decomposition of VLDL-TG by LPL during lipolysis | ||
| 2 | CE transfer from HDL to VLDL mediated by CETP | ||
| 3 | CE transfer from HDL to VLDL mediated by PLTP | ||
| 4 | Conversion of FC to CE in HDL by LCAT | ||
| 5 | Transfer of FC from VLDL to HDL under the action of concentration gradient | ||
| 6 | Transfer of PL from VLDL to HDL under the action of concentration gradient | ||
| 7 | Dissociation of apoA-I from HDL | ||
| 8 | FC transfer from VLDL to HDL during lipoprotein collision | ||
| 9 | Fusion of Alp with HDL | ||
| 10 | PL transfer from VLDL to HDL during lipoprotein collision | ||
| 11 | PL transfer from VLDL to HDL mediated by PLTP | ||
| 12 | Transfer from VLDL to HDL of Alp released during lipolysis | ||
| 13 | Transfer from VLDL to HDL of apoA-I released during lipolysis |
| Symbol | Description | Value |
|---|---|---|
| mTg | Molar mass of TG | 850 g/mol |
| mCE | Molar mass of CE | 649 g/mol |
| mFC | Molar mass of FC | 387 g/mol |
| mPl | Molar mass of PL | 775 g/mol |
| mA | Molar mass of apoA-I | 28,500 g/mol |
| mAlp | Molar mass of lipid-poor apoA-I | 69,180 g/mol |
| SV | Surface area of VLDL | 9498 nm2 |
| ScV | Surface area of VLDL core | 8154 nm2 |
| Symbol | Description | Unit |
|---|---|---|
| Maximal reaction rate of TG lipolysis by LPL | ||
| mg/dL | ||
| Rate constant of CE transfer from HDL to VLDL by CETP | 1/h | |
| Maximal reaction rate of FC conversion to CE by LCAT | ||
| mg/dL | ||
| Fusion rate constant | 1/h | |
| Rate constant of CE transfer from HDL to VLDL by PLTP | 1/h | |
| Rate constant of FC transfer from VLDL to HDL under the action of concentration gradient | 1/h | |
| Rate constant of FC transfer from VLDL to HDL upon their collision | ||
| Dissociation rate constant | 1/h | |
| Rate constant of PL transfer from VLDL to HDL under the action of concentration gradient | 1/h | |
| Rate constant of PL transfer from VLDL to HDL upon their collision | ||
| Rate constant of PL transfer from HDL to VLDL by PLTP | 1/h |
| [HDLα], mg/dL | [TgV], mg/dL | [CEα], mg/dL | [FCα], mg/dL | [Alp], mg/dL | [Aα], mg/dL | [Plα], mg/dL | [Tgα], mg/dL |
|---|---|---|---|---|---|---|---|
| 5 | 30 | 0.8 | 0.2 | 0 | 2 | 1.25 | 0.225 |
| 10 | 30 | 1.6 | 0,4 | 0 | 4 | 2.5 | 0.45 |
| 20 | 30 | 3.2 | 0.8 | 0 | 8 | 5 | 0.9 |
| 40 | 30 | 6.4 | 1.6 | 0 | 16 | 10 | 1.8 |
| 12 | |
| 9.43 | |
| 0.020 | |
| 0.46 | |
| 0.00174 | |
| 1.0 | |
| 0.002 | |
| 0.5 | |
| 0.1 | |
| 0.03 | |
| 1.0 | |
| 0.03 | |
| 0.2 |
Publisher’s Note: MDPI stays neutral with regard to jurisdictional claims in published maps and institutional affiliations. |
© 2022 by the authors. Licensee MDPI, Basel, Switzerland. This article is an open access article distributed under the terms and conditions of the Creative Commons Attribution (CC BY) license (https://creativecommons.org/licenses/by/4.0/).
Share and Cite
Schekatolina, S.; Lahovska, V.; Bekshaev, A.; Kontush, S.; Le Goff, W.; Kontush, A. Mathematical Modelling of Material Transfer to High-Density Lipoprotein (HDL) upon Triglyceride Lipolysis by Lipoprotein Lipase: Relevance to Cardioprotective Role of HDL. Metabolites 2022, 12, 623. https://doi.org/10.3390/metabo12070623
Schekatolina S, Lahovska V, Bekshaev A, Kontush S, Le Goff W, Kontush A. Mathematical Modelling of Material Transfer to High-Density Lipoprotein (HDL) upon Triglyceride Lipolysis by Lipoprotein Lipase: Relevance to Cardioprotective Role of HDL. Metabolites. 2022; 12(7):623. https://doi.org/10.3390/metabo12070623
Chicago/Turabian StyleSchekatolina, Svetlana, Viktoriia Lahovska, Aleksandr Bekshaev, Sergey Kontush, Wilfried Le Goff, and Anatol Kontush. 2022. "Mathematical Modelling of Material Transfer to High-Density Lipoprotein (HDL) upon Triglyceride Lipolysis by Lipoprotein Lipase: Relevance to Cardioprotective Role of HDL" Metabolites 12, no. 7: 623. https://doi.org/10.3390/metabo12070623