
Progressive, Qualitative, and Quantitative Alterations in HDL Lipidome from Healthy Subjects to Patients with Prediabetes and Type 2 Diabetes

 , ,
, ,
Abstract
:
1. Introduction
2. Results
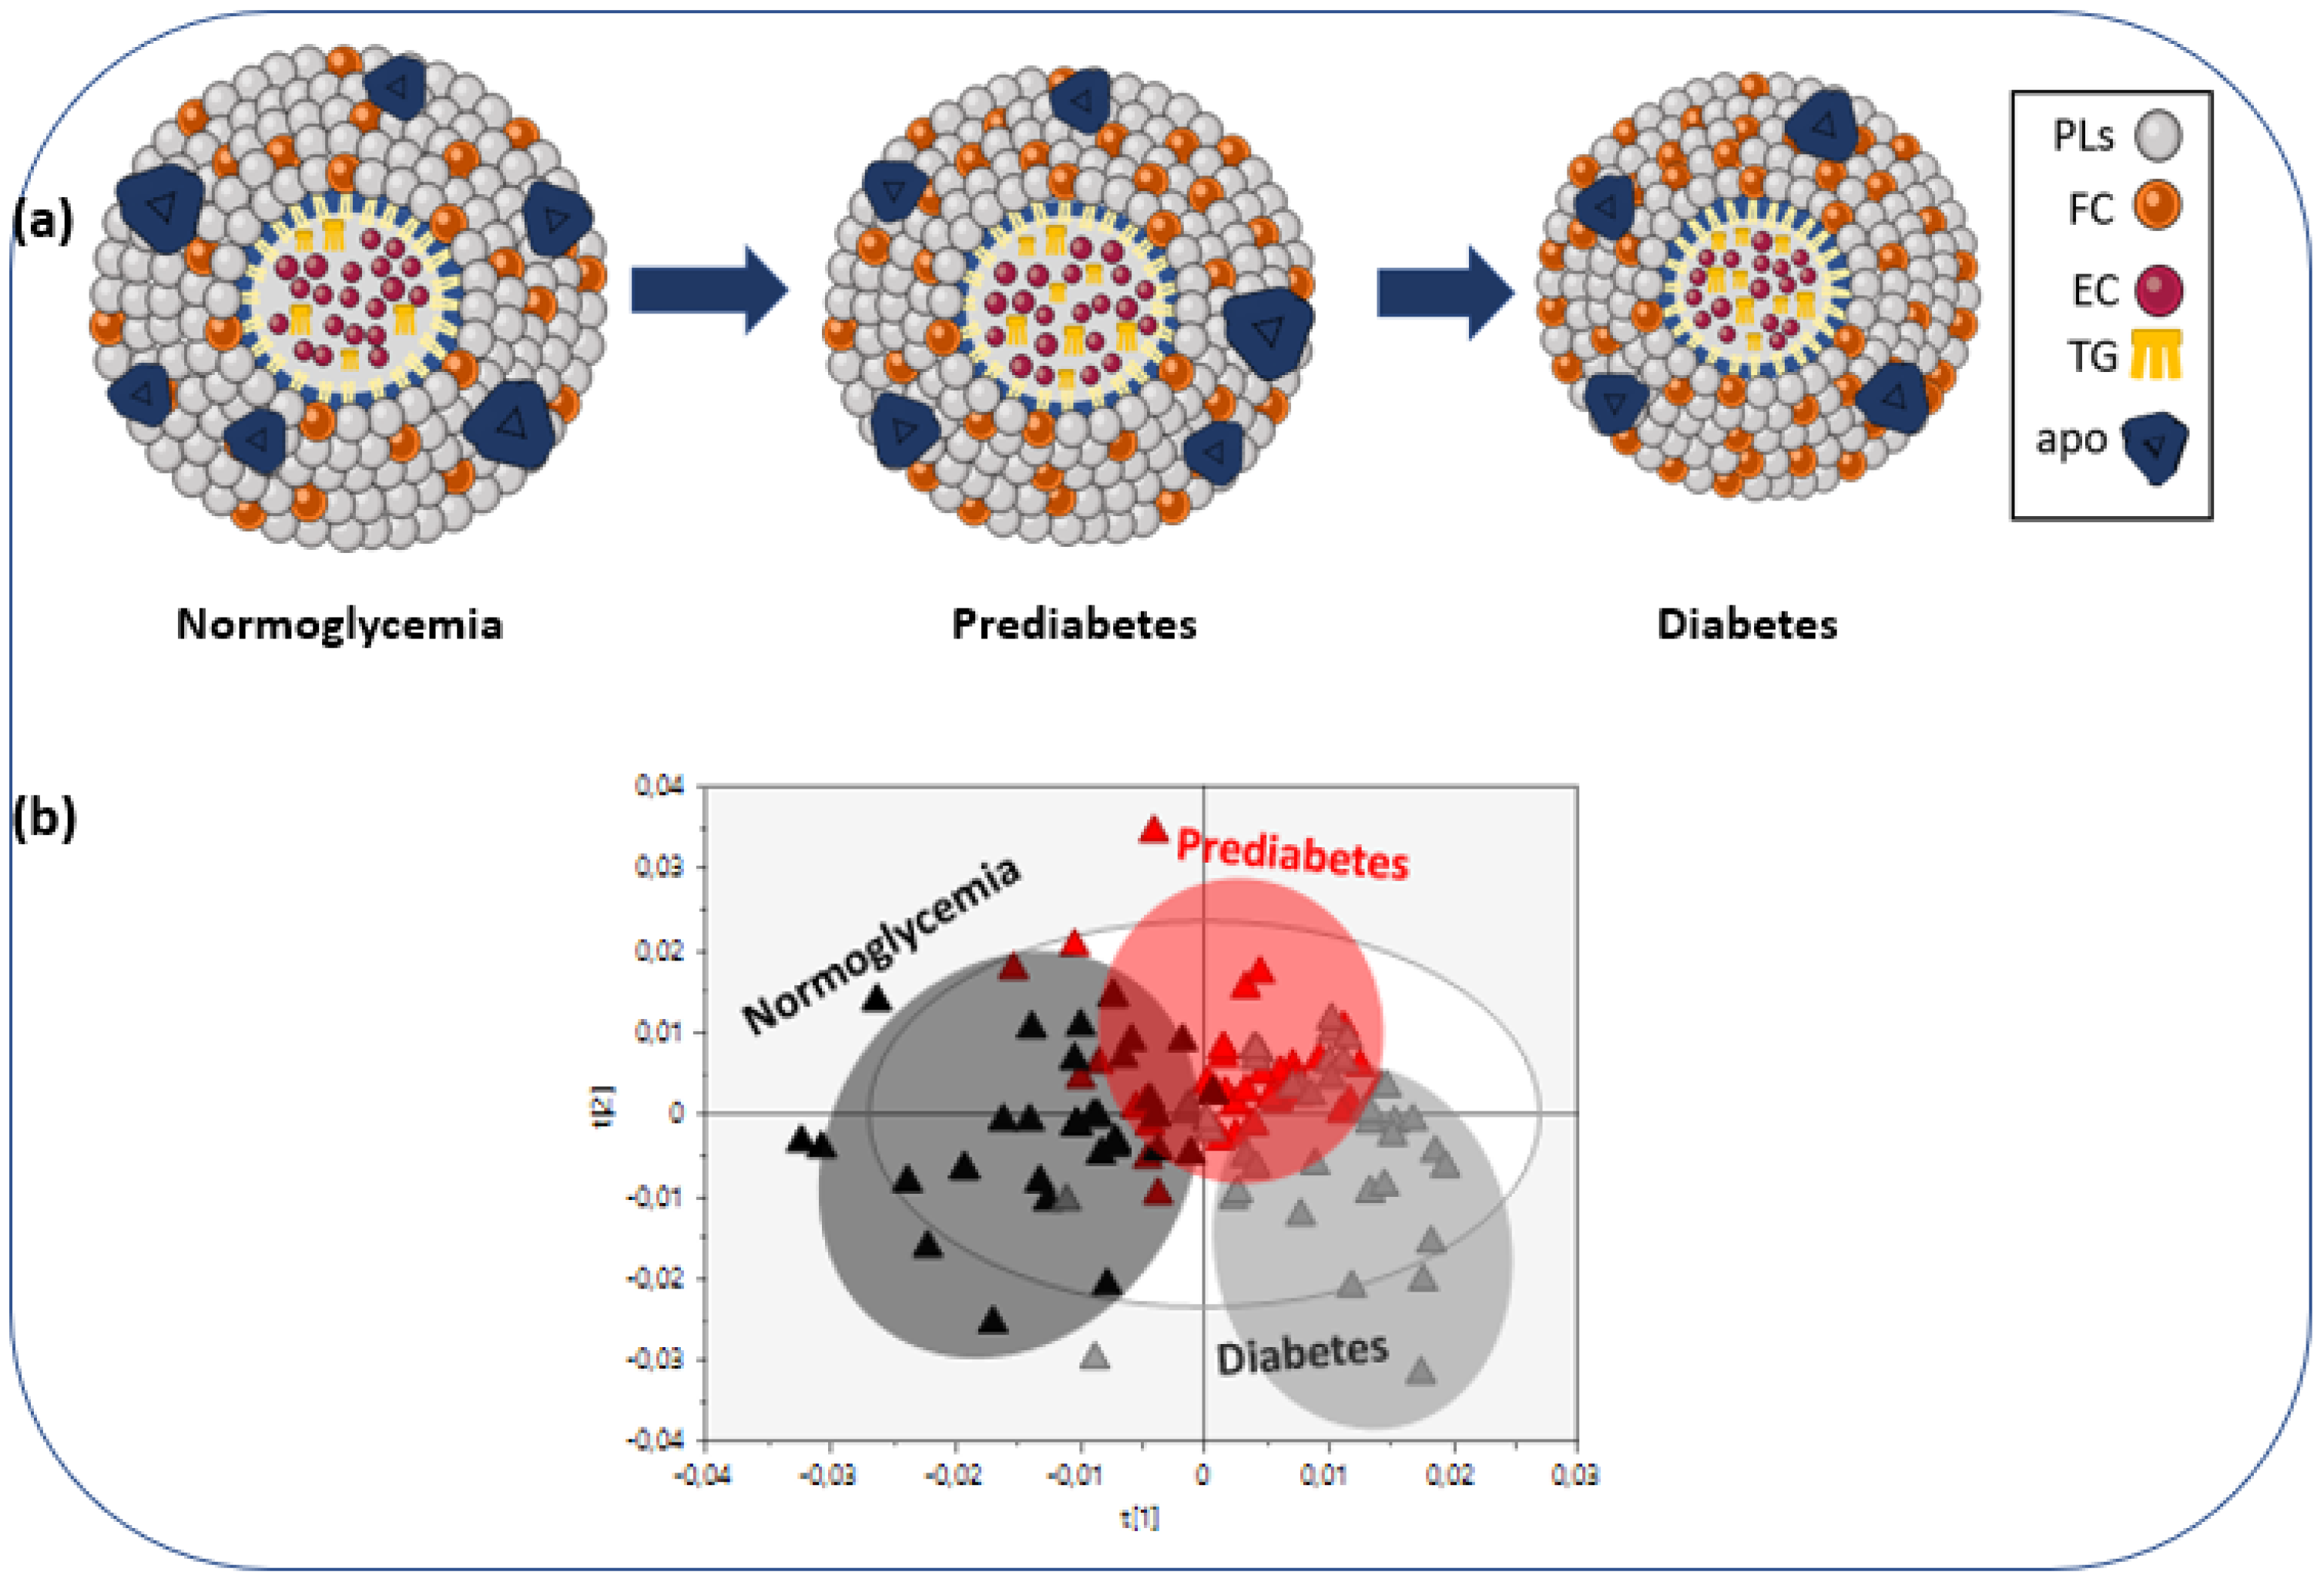
3. Discussion
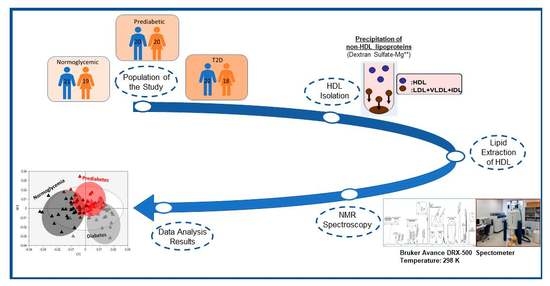
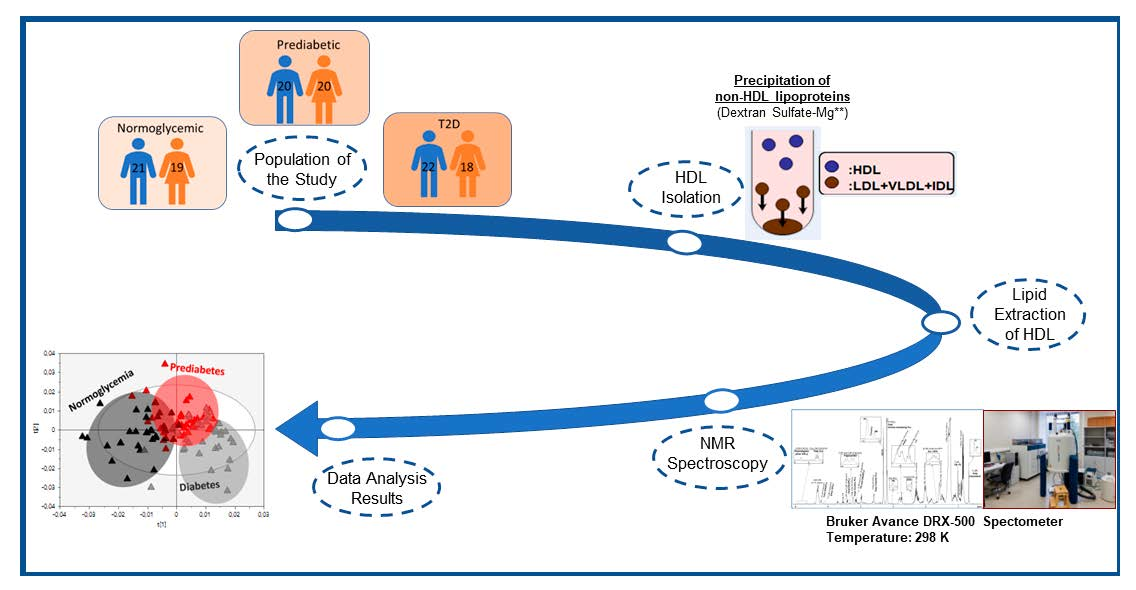
4. Materials and Methods
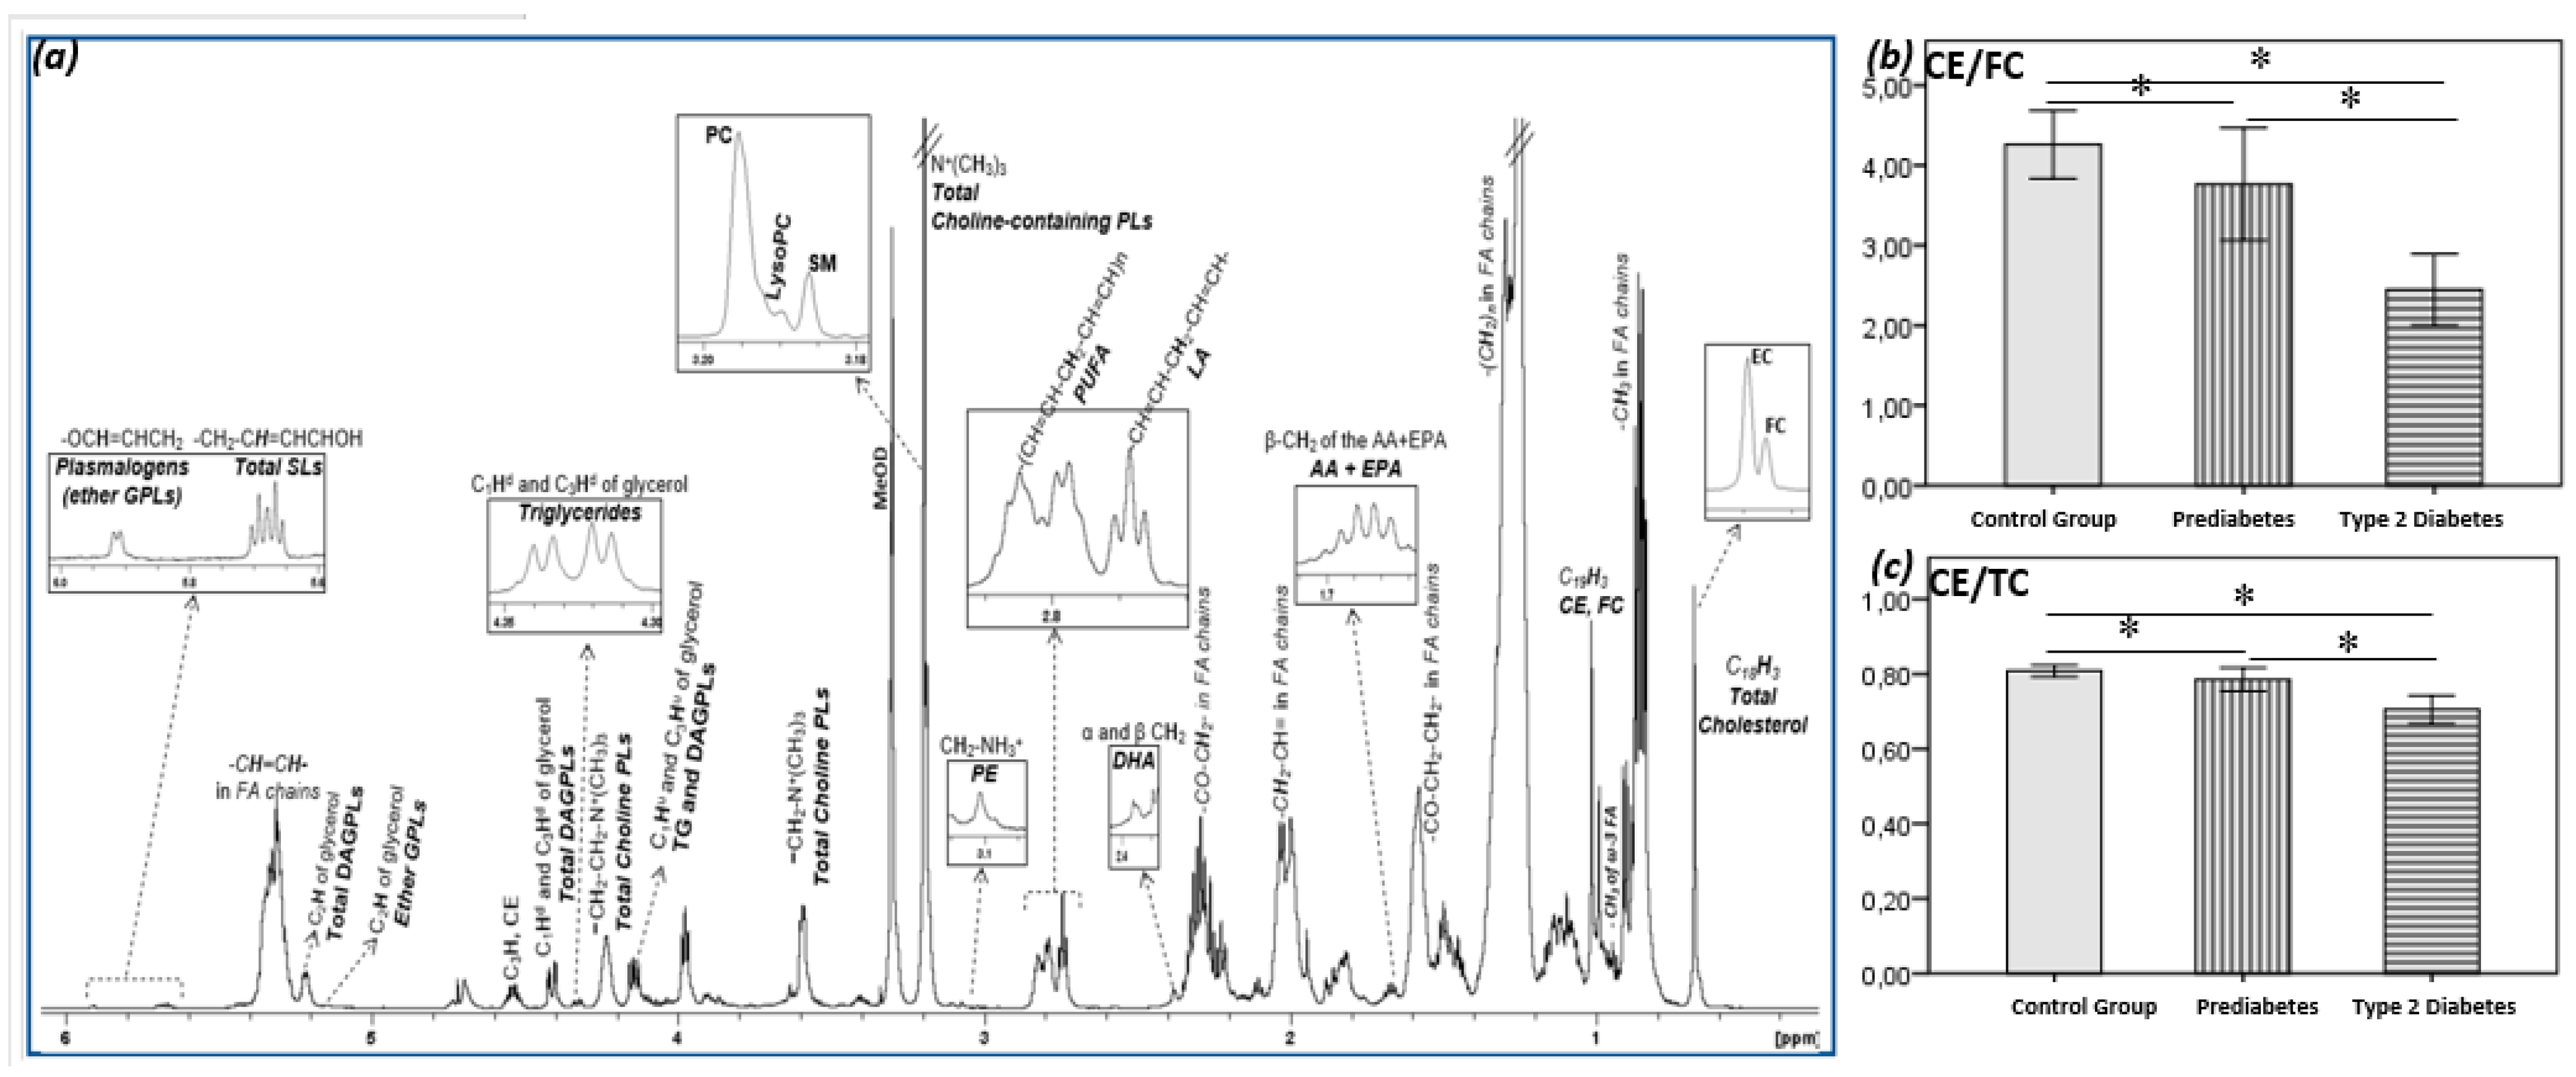
4.1. HDL Lipidome Analysis by NMR Spectroscopy
4.2. Statistical Analysis of Data
5. Conclusions
Supplementary Materials
Author Contributions
Funding
Institutional Review Board Statement
Informed Consent Statement
Data Availability Statement
Conflicts of Interest
Abbreviations
| CE | Cholesterol esters |
| FC | Free cholesterol |
| LysoPC | Lysophosphatidylcholine |
| MUFA | Monounsaturated fatty acids |
| PC | Phosphatidylcholine |
| PE | Phosphatidylethanolamine |
| PI | Phosphatidylinositol |
| Pls | Phospholipids |
| PS | Phosphatidylserine |
| PUFA | Polyunsaturated fatty acids |
| SFA | Saturated fatty acids |
| SM | Sphingomyelin |
| TC | Total cholesterol |
| TG | Triglycerides |
| UFA | Unsaturated fatty acids |
References
- Grundy, S.M. Pre-diabetes, metabolic syndrome, and cardiovascular risk. J. Am. Coll. Cardiol. 2012, 59, 635–643. [Google Scholar] [CrossRef] [PubMed] [Green Version]
- Tabak, A.G.; Herder, C.; Rathmann, W.; Brunner, E.J.; Kivimaki, M. Prediabetes: A high-risk state for diabetes development. Lancet 2012, 379, 2279–2290. [Google Scholar] [CrossRef] [Green Version]
- Barr, E.L.; Zimmet, P.Z.; Welborn, T.A.; Jolley, D.; Magliano, D.J.; Dunstan, D.W.; Cameron, A.J.; Dwyer, T.; Taylor, H.R.; Tonkin, A.M.; et al. Risk of cardiovascular and all-cause mortality in individuals with diabetes mellitus, impaired fasting glucose, and impaired glucose tolerance: The Australian Diabetes, Obesity, and Lifestyle Study (AusDiab). Circulation 2007, 116, 151–157. [Google Scholar] [CrossRef] [PubMed] [Green Version]
- Melsom, T.; Mathisen, U.D.; Ingebretsen, O.C.; Jenssen, T.G.; Njolstad, I.; Solbu, M.D.; Toft, I.; Eriksen, B.O. Impaired fasting glucose is associated with renal hyperfiltration in the general population. Diabetes Care 2011, 34, 1546–1551. [Google Scholar] [CrossRef] [PubMed] [Green Version]
- Ziegler, D.; Rathmann, W.; Dickhaus, T.; Meisinger, C.; Mielck, A.; Group, K.S. Prevalence of polyneuropathy in pre-diabetes and diabetes is associated with abdominal obesity and macroangiopathy: The MONICA/KORA Augsburg Surveys S2 and S3. Diabetes Care 2008, 31, 464–469. [Google Scholar] [CrossRef] [Green Version]
- Ferrannini, E.; Gastaldelli, A.; Iozzo, P. Pathophysiology of prediabetes. Med. Clin. North Am. 2011, 95, 327–339. [Google Scholar] [CrossRef] [Green Version]
- Dugani, S.B.; Akinkuolie, A.O.; Paynter, N.; Glynn, R.J.; Ridker, P.M.; Mora, S. Association of Lipoproteins, Insulin Resistance, and Rosuvastatin with Incident Type 2 Diabetes Mellitus: Secondary Analysis of a Randomized Clinical Trial. JAMA Cardiol. 2016, 1, 136–145. [Google Scholar] [CrossRef] [Green Version]
- Mooradian, A.D. Dyslipidemia in type 2 diabetes mellitus. Nat. Clin. Pract. Endocrinol. Metab. 2009, 5, 150–159. [Google Scholar] [CrossRef]
- Niisuke, K.; Horvath, K.V.; Asztalos, B.F. Where next with HDL assays? Curr. Opin. Lipidol. 2018, 29, 293–298. [Google Scholar] [CrossRef]
- Karathanasis, S.K.; Freeman, L.A.; Gordon, S.M.; Remaley, A.T. The Changing Face of HDL and the Best Way to Measure It. Clin. Chem. 2017, 63, 196–210. [Google Scholar] [CrossRef] [Green Version]
- Manandhar, B.; Cochran, B.J.; Rye, K.A. Role of High-Density Lipoproteins in Cholesterol Homeostasis and Glycemic Control. J. Am. Heart Assoc. 2020, 9, e013531. [Google Scholar] [CrossRef]
- Von Eckardstein, A.; Widmann, C. High-density lipoprotein, beta cells, and diabetes. Cardiovasc. Res. 2014, 103, 384–394. [Google Scholar] [CrossRef] [PubMed] [Green Version]
- Lydic, T.A.; Goo, Y.H. Lipidomics unveils the complexity of the lipidome in metabolic diseases. Clin. Transl. Med. 2018, 7, 4. [Google Scholar] [CrossRef] [PubMed]
- Kostara, C.E.; Ferrannini, E.; Bairaktari, E.T.; Papathanasiou, A.; Elisaf, M.; Tsimihodimos, V. Early Signs of Atherogenic Features in the HDL Lipidomes of Normolipidemic Patients Newly Diagnosed with Type 2 Diabetes. Int. J. Mol. Sci. 2020, 21, 8835. [Google Scholar] [CrossRef] [PubMed]
- Bonilha, I.; Zimetti, F.; Zanotti, I.; Papotti, B.; Sposito, A.C. Dysfunctional High-Density Lipoproteins in Type 2 Diabetes Mellitus: Molecular Mechanisms and Therapeutic Implications. J. Clin. Med. 2021, 10, 2233. [Google Scholar] [CrossRef]
- Cardner, M.; Yalcinkaya, M.; Goetze, S.; Luca, E.; Balaz, M.; Hunjadi, M.; Hartung, J.; Shemet, A.; Krankel, N.; Radosavljevic, S.; et al. Structure-function relationships of HDL in diabetes and coronary heart disease. JCI Insight 2020, 5, e131491. [Google Scholar] [CrossRef] [Green Version]
- Meikle, P.J.; Wong, G.; Barlow, C.K.; Weir, J.M.; Greeve, M.A.; MacIntosh, G.L.; Almasy, L.; Comuzzie, A.G.; Mahaney, M.C.; Kowalczyk, A.; et al. Plasma lipid profiling shows similar associations with prediabetes and type 2 diabetes. PLoS ONE 2013, 8, e74341. [Google Scholar] [CrossRef] [Green Version]
- Wang, J.; Stancakova, A.; Soininen, P.; Kangas, A.J.; Paananen, J.; Kuusisto, J.; Ala-Korpela, M.; Laakso, M. Lipoprotein subclass profiles in individuals with varying degrees of glucose tolerance: A population-based study of 9399 Finnish men. J. Intern. Med. 2012, 272, 562–572. [Google Scholar] [CrossRef]
- Puig-Jove, C.; Castelblanco, E.; Falguera, M.; Hernandez, M.; Soldevila, B.; Julian, M.T.; Teis, A.; Julve, J.; Barranco-Altirriba, M.; Franch-Nadal, J.; et al. Advanced lipoprotein profile in individuals with normal and impaired glucose metabolism. Rev. Esp. Cardiol. 2022, 75, 22–30. [Google Scholar] [CrossRef]
- Howard, B.V.; Howard, W.J. Dyslipidemia in non-insulin-dependent diabetes mellitus. Endocr. Rev. 1994, 15, 263–274. [Google Scholar] [CrossRef]
- Taskinen, M.R. Hyperlipidaemia in diabetes. Bailliere’s Clin. Endocrinol. Metab. 1990, 4, 743–775. [Google Scholar] [CrossRef]
- Sparks, D.L.; Davidson, W.S.; Lund-Katz, S.; Phillips, M.C. Effects of the neutral lipid content of high density lipoprotein on apolipoprotein A-I structure and particle stability. J. Biol. Chem. 1995, 270, 26910–26917. [Google Scholar] [CrossRef] [PubMed] [Green Version]
- Curtiss, L.K.; Bonnet, D.J.; Rye, K.A. The conformation of apolipoprotein A-I in high-density lipoproteins is influenced by core lipid composition and particle size: A surface plasmon resonance study. Biochemistry 2000, 39, 5712–5721. [Google Scholar] [CrossRef]
- Igau, B.; Castro, G.; Clavey, V.; Slomianny, C.; Bresson, R.; Drouin, P.; Fruchart, J.C.; Fievet, C. In vivo glucosylated LpA-I subfraction. Evidence for structural and functional alterations. Arterioscler. Thromb. Vasc. Biol. 1997, 17, 2830–2836. [Google Scholar] [CrossRef]
- Farbstein, D.; Levy, A.P. HDL dysfunction in diabetes: Causes and possible treatments. Expert Rev. Cardiovasc. Ther. 2012, 10, 353–361. [Google Scholar] [CrossRef] [PubMed] [Green Version]
- Dullaart, R.P.; Riemens, S.C.; Scheek, L.M.; Van Tol, A. Insulin decreases plasma cholesteryl ester transfer but not cholesterol esterification in healthy subjects as well as in normotriglyceridaemic patients with type 2 diabetes. Eur. J. Clin. Investig. 1999, 29, 663–671. [Google Scholar] [CrossRef] [PubMed] [Green Version]
- Riemens, S.; van Tol, A.; Sluiter, W.; Dullaart, R. Elevated plasma cholesteryl ester transfer in NIDDM: Relationships with apolipoprotein B-containing lipoproteins and phospholipid transfer protein. Atherosclerosis 1998, 140, 71–79. [Google Scholar] [CrossRef]
- Lamarche, B.; Rashid, S.; Lewis, G.F. HDL metabolism in hypertriglyceridemic states: An overview. Clin. Chim. Acta; Int. J. Clin. Chem. 1999, 286, 145–161. [Google Scholar] [CrossRef]
- Lewis, G.F.; Murdoch, S.; Uffelman, K.; Naples, M.; Szeto, L.; Albers, A.; Adeli, K.; Brunzell, J.D. Hepatic lipase mRNA, protein, and plasma enzyme activity is increased in the insulin-resistant, fructose-fed Syrian golden hamster and is partially normalized by the insulin sensitizer rosiglitazone. Diabetes 2004, 53, 2893–2900. [Google Scholar] [CrossRef] [Green Version]
- Hui, N.; Barter, P.J.; Ong, K.L.; Rye, K.A. Altered HDL metabolism in metabolic disorders: Insights into the therapeutic potential of HDL. Clin. Sci. 2019, 133, 2221–2235. [Google Scholar] [CrossRef]
- Denimal, D.; Monier, S.; Brindisi, M.C.; Petit, J.M.; Bouillet, B.; Nguyen, A.; Demizieux, L.; Simoneau, I.; Pais de Barros, J.P.; Verges, B.; et al. Impairment of the Ability of HDL From Patients with Metabolic Syndrome but Without Diabetes Mellitus to Activate eNOS: Correction by S1P Enrichment. Arterioscler. Thromb. Vasc. Biol. 2017, 37, 804–811. [Google Scholar] [CrossRef] [PubMed] [Green Version]
- Kruit, J.K.; Brunham, L.R.; Verchere, C.B.; Hayden, M.R. HDL and LDL cholesterol significantly influence beta-cell function in type 2 diabetes mellitus. Curr. Opin. Lipidol. 2010, 21, 178–185. [Google Scholar] [CrossRef] [PubMed]
- Von Eckardstein, A.; Sibler, R.A. Possible contributions of lipoproteins and cholesterol to the pathogenesis of diabetes mellitus type 2. Curr. Opin. Lipidol. 2011, 22, 26–32. [Google Scholar] [CrossRef]
- Drew, B.G.; Rye, K.A.; Duffy, S.J.; Barter, P.; Kingwell, B.A. The emerging role of HDL in glucose metabolism. Nat. Rev. Endocrinol. 2012, 8, 237–245. [Google Scholar] [CrossRef]
- Dalla-Riva, J.; Stenkula, K.G.; Petrlova, J.; Lagerstedt, J.O. Discoidal HDL and apoA-I-derived peptides improve glucose uptake in skeletal muscle. J. Lipid Res. 2013, 54, 1275–1282. [Google Scholar] [CrossRef] [PubMed] [Green Version]
- Calabresi, L.; Franceschini, G. Lecithin: Cholesterol acyltransferase, high-density lipoproteins, and atheroprotection in humans. Trends Cardiovasc. Med. 2010, 20, 50–53. [Google Scholar] [CrossRef] [PubMed]
- Awadallah, S.; Madkour, M.; Hamidi, R.A.; Alwafa, E.A.; Hattab, M.; Zakkour, B.; Al-Matroushi, A.; Ahmed, E.; Al-Kitbi, M. Plasma levels of Apolipoprotein A1 and Lecithin:Cholesterol Acyltransferase in type 2 diabetes mellitus: Correlations with haptoglobin phenotypes. Diabetes Metab. Syndr. 2017, 11 (Suppl. 2), S543–S546. [Google Scholar] [CrossRef] [PubMed]
- Fournier, N.; Myara, I.; Atger, V.; Moatti, N. Reactivity of lecithin-cholesterol acyl transferase (LCAT) towards glycated high-density lipoproteins (HDL). Clin. Chim. Acta; Int. J. Clin. Chem. 1995, 234, 47–61. [Google Scholar] [CrossRef]
- Bhatnagar, D.; Durrington, P.N.; Kumar, S.; Mackness, M.I.; Boulton, A.J. Plasma lipoprotein composition and cholesteryl ester transfer from high density lipoproteins to very low density and low density lipoproteins in patients with non-insulin-dependent diabetes mellitus. Diabet. Med. A J. Br. Diabet. Assoc. 1996, 13, 139–144. [Google Scholar] [CrossRef]
- Durlach, V.; Attia, N.; Zahouani, A.; Leutenegger, M.; Girard-Globa, A. Postprandial cholesteryl ester transfer and high density lipoprotein composition in normotriglyceridemic non-insulin-dependent diabetic patients. Atherosclerosis 1996, 120, 155–165. [Google Scholar] [CrossRef]
- Jones, R.J.; Owens, D.; Brennan, C.; Collins, P.B.; Johnson, A.H.; Tomkin, G.H. Increased esterification of cholesterol and transfer of cholesteryl ester to apo B-containing lipoproteins in Type 2 diabetes: Relationship to serum lipoproteins A-I and A-II. Atherosclerosis 1996, 119, 151–157. [Google Scholar] [CrossRef]
- Murakami, T.; Michelagnoli, S.; Longhi, R.; Gianfranceschi, G.; Pazzucconi, F.; Calabresi, L.; Sirtori, C.R.; Franceschini, G. Triglycerides are major determinants of cholesterol esterification/transfer and HDL remodeling in human plasma. Arterioscler. Thromb. Vasc. Biol. 1995, 15, 1819–1828. [Google Scholar] [CrossRef] [PubMed]
- Verges, B. Pathophysiology of diabetic dyslipidaemia: Where are we? Diabetologia 2015, 58, 886–899. [Google Scholar] [CrossRef] [PubMed] [Green Version]
- Kontush, A.; Lhomme, M.; Chapman, M.J. Unraveling the complexities of the HDL lipidome. J. Lipid Res. 2013, 54, 2950–2963. [Google Scholar] [CrossRef] [Green Version]
- Kontush, A.; Therond, P.; Zerrad, A.; Couturier, M.; Negre-Salvayre, A.; de Souza, J.A.; Chantepie, S.; Chapman, M.J. Preferential sphingosine-1-phosphate enrichment and sphingomyelin depletion are key features of small dense HDL3 particles: Relevance to antiapoptotic and antioxidative activities. Arterioscler. Thromb. Vasc. Biol. 2007, 27, 1843–1849. [Google Scholar] [CrossRef] [Green Version]
- Yancey, P.G.; Kawashiri, M.A.; Moore, R.; Glick, J.M.; Williams, D.L.; Connelly, M.A.; Rader, D.J.; Rothblat, G.H. In vivo modulation of HDL phospholipid has opposing effects on SR-BI- and ABCA1-mediated cholesterol efflux. J. Lipid Res. 2004, 45, 337–346. [Google Scholar] [CrossRef] [Green Version]
- Yancey, P.G.; de la Llera-Moya, M.; Swarnakar, S.; Monzo, P.; Klein, S.M.; Connelly, M.A.; Johnson, W.J.; Williams, D.L.; Rothblat, G.H. High density lipoprotein phospholipid composition is a major determinant of the bi-directional flux and net movement of cellular free cholesterol mediated by scavenger receptor BI. J. Biol. Chem. 2000, 275, 36596–36604. [Google Scholar] [CrossRef] [Green Version]
- Schwendeman, A.; Sviridov, D.O.; Yuan, W.; Guo, Y.; Morin, E.E.; Yuan, Y.; Stonik, J.; Freeman, L.; Ossoli, A.; Thacker, S.; et al. The effect of phospholipid composition of reconstituted HDL on its cholesterol efflux and anti-inflammatory properties. J. Lipid Res. 2015, 56, 1727–1737. [Google Scholar] [CrossRef] [Green Version]
- Denimal, D.; Benanaya, S.; Monier, S.; Simoneau, I.; Pais de Barros, J.P.; Le Goff, W.; Bouillet, B.; Verges, B.; Duvillard, L. Normal HDL cholesterol efflux and anti-inflammatory capacities in type 2 diabetes despite lipidomic abnormalities. J. Clin. Endocrinol. Metab. 2022, dgac339. [Google Scholar] [CrossRef]
- Baker, P.W.; Rye, K.A.; Gamble, J.R.; Vadas, M.A.; Barter, P.J. Phospholipid composition of reconstituted high density lipoproteins influences their ability to inhibit endothelial cell adhesion molecule expression. J. Lipid Res. 2000, 41, 1261–1267. [Google Scholar] [CrossRef]
- Schmitz, G.; Ruebsaamen, K. Metabolism and atherogenic disease association of lysophosphatidylcholine. Atherosclerosis 2010, 208, 10–18. [Google Scholar] [CrossRef] [PubMed]
- Stahlman, M.; Fagerberg, B.; Adiels, M.; Ekroos, K.; Chapman, J.M.; Kontush, A.; Boren, J. Dyslipidemia, but not hyperglycemia and insulin resistance, is associated with marked alterations in the HDL lipidome in type 2 diabetic subjects in the DIWA cohort: Impact on small HDL particles. Biochim. Biophys. Acta 2013, 1831, 1609–1617. [Google Scholar] [CrossRef] [PubMed]
- Mandal, N.; Grambergs, R.; Mondal, K.; Basu, S.K.; Tahia, F.; Dagogo-Jack, S. Role of ceramides in the pathogenesis of diabetes mellitus and its complications. J. Diabetes Its Complicat. 2021, 35, 107734. [Google Scholar] [CrossRef]
- Brinck, J.W.; Thomas, A.; Lauer, E.; Jornayvaz, F.R.; Brulhart-Meynet, M.C.; Prost, J.C.; Pataky, Z.; Lofgren, P.; Hoffstedt, J.; Eriksson, M.; et al. Diabetes Mellitus Is Associated with Reduced High-Density Lipoprotein Sphingosine-1-Phosphate Content and Impaired High-Density Lipoprotein Cardiac Cell Protection. Arterioscler. Thromb. Vasc. Biol. 2016, 36, 817–824. [Google Scholar] [CrossRef] [PubMed] [Green Version]
- Davidson, W.S.; Gillotte, K.L.; Lund-Katz, S.; Johnson, W.J.; Rothblat, G.H.; Phillips, M.C. The effect of high density lipoprotein phospholipid acyl chain composition on the efflux of cellular free cholesterol. J. Biol. Chem. 1995, 270, 5882–5890. [Google Scholar] [CrossRef] [PubMed] [Green Version]
- Harvey, K.A.; Walker, C.L.; Pavlina, T.M.; Xu, Z.; Zaloga, G.P.; Siddiqui, R.A. Long-chain saturated fatty acids induce pro-inflammatory responses and impact endothelial cell growth. Clin. Nutr. 2010, 29, 492–500. [Google Scholar] [CrossRef]
- Marin, C.; Ramirez, R.; Delgado-Lista, J.; Yubero-Serrano, E.M.; Perez-Martinez, P.; Carracedo, J.; Garcia-Rios, A.; Rodriguez, F.; Gutierrez-Mariscal, F.M.; Gomez, P.; et al. Mediterranean diet reduces endothelial damage and improves the regenerative capacity of endothelium. Am. J. Clin. Nutr. 2011, 93, 267–274. [Google Scholar] [CrossRef]
- Nicholls, S.J.; Lundman, P.; Harmer, J.A.; Cutri, B.; Griffiths, K.A.; Rye, K.A.; Barter, P.J.; Celermajer, D.S. Consumption of saturated fat impairs the anti-inflammatory properties of high-density lipoproteins and endothelial function. J. Am. Coll. Cardiol. 2006, 48, 715–720. [Google Scholar] [CrossRef]
- Das, U.N. A defect in Delta6 and Delta5 desaturases may be a factor in the initiation and progression of insulin resistance, the metabolic syndrome and ischemic heart disease in South Asians. Lipids Health Dis. 2010, 9, 130. [Google Scholar] [CrossRef] [Green Version]
- Kroger, J.; Schulze, M.B. Recent insights into the relation of Delta5 desaturase and Delta6 desaturase activity to the development of type 2 diabetes. Curr. Opin. Lipidol. 2012, 23, 4–10. [Google Scholar] [CrossRef]
- American Diabetes, A. 2. Classification and Diagnosis of Diabetes: Standards of Medical Care in Diabetes-2018. Diabetes Care 2018, 41, S13–S27. [Google Scholar] [CrossRef] [PubMed] [Green Version]
- Bligh, E.G.; Dyer, W.J. A rapid method of total lipid extraction and purification. Can. J. Biochem. Physiol. 1959, 37, 911–917. [Google Scholar] [CrossRef] [PubMed]
- Kostara, C.E.; Bairaktari, T.E. Lipid profiling in health and disease. In Methodologies for Metabolomics: Experimental Strategies and Techniques; Lutz, N., Sweedler, J., Wevers, R.A., Eds.; Cambridge University Press: Cambridge, UK, 2012; pp. 317–332. [Google Scholar]
- Kostara, C.E.; Karakitsou, S.K.; Florentin, M.; Bairaktari, E.T.; Tsimihodimos, V. Progressive, qualitative and quantitative alterations in HDL lipidome from healthy subjects to patients with Prediabetes and Type 2 Diabetes. Dryad. Data Set ProMED-Mail Website 2022. [Google Scholar] [CrossRef]


| Normoglycemic Group | Patients with Prediabetes | Patients with T2D | |
|---|---|---|---|
| n | 40 | 40 | 40 |
| Demographic | |||
| Age (years) | 55.7 ± 9.6 | 57.1 ± 7.7 | 57.2 ± 9.8 |
| Gender (males/females) | 21/19 | 20/20 | 22/18 |
| Biochemical | |||
| Total cholesterol (mg/dL) | 184 ± 26 | 178 ± 23 | 184 ± 40 |
| Triglycerides (mg/dL) | 100 ± 34 | 113 ± 43 | 109 ± 37 |
| HDL-cholesterol (mg/dL) | 49 ± 11 | 51 ± 9 | 47 ± 8 |
| LDL-cholesterol (mg/dL) | 115 ± 21 | 104 ± 24 | 116 ± 35 |
| non-HDL-cholesterol(mg/dL) | 135 ± 24 | 127 ± 24 | 137 ± 37 |
| apoAI (mg/dL) | 139 ± 23 | 160 ± 21 | 136 ± 23 |
| apoB (mg/dL) | 79 ± 18 | 78 ± 20 | 87 ± 20 |
| Glucose (mg/dL) | 90 ± 7 | 106 ± 8 * | 157 ± 24 *# |
| HbA1c (%) | 4.9 ± 0.7 | 5.9 ± 0.4 * | 7.3 ± 0.7 *# |
| Normoglycemic Group | Patients with Prediabetes | Patients with T2D | |||||||
|---|---|---|---|---|---|---|---|---|---|
| Mean ± SD | Mean ± SD | vs. Normoglycemic | Mean ± SD | vs. Normoglycemic | vs. Prediabetes | ||||
| % Change | p Value | % Change | p Value | % Change | p Value | ||||
| Cholesterol, Total | 40.22 ± 1.98 | 41.38 ± 2.49 | +2.88 | <0.05 | 41.74 ± 2.42 | +3.78 | <0.01 | +0.87 | NS |
| Free | 7.70 ± 0.79 | 8.93 ± 1.75 | +15.97 | <0.01 | 12.33 ± 1.93 | +60.13 | <0.001 | +38.07 | <0.001 |
| Esterified | 32.52 ± 1.57 | 32.45 ± 1.21 | −0.22 | NS | 29.41 ± 1.96 | −9.56 | <0.001 | −9.37 | <0.001 |
| Triglycerides (TG) | 4.28 ± 0.71 | 5.42 ± 0.85 | +27.17 | <0.001 | 5.83 ± 1.37 | +36.53 | <0.001 | +7.37 | NS |
| Phospholipids (PLs), total | 55.50 ± 2.10 | 53.20 ± 2.16 | −4.14 | <0.001 | 52.43 ± 3.15 | −5.53 | <0.001 | −1.45 | NS |
| Core lipids, total | 36.79 ± 1.77 | 37.88 ± 0.97 | +2.96 | <0.05 | 35.24 ± 2.71 | −4.21 | <0.01 | −6.97 | <0.001 |
| Surface lipids, total | 63.21 ± 1.77 | 62.12 ± 0.97 | −1.72 | <0.05 | 64.76 ± 2.71 | +2.45 | <0.001 | +4.25 | <0.001 |
| TC/PLs | 0.73 ± 0.06 | 0.78 ± 0.08 | +6.85 | <0.01 | 0.80 ± 0.11 | +9.59 | <0.001 | +2.56 | NS |
| CE/TG | 7.81 ± 1.38 | 6.12 ± 0.94 | −21.64 | <0.001 | 5.34 ± 1.43 | −31.63 | <0.001 | −12.75 | <0.01 |
 | |||||||||
| Normoglycemic Group | Patients with Prediabetes | Patients with T2D | |||||||
|---|---|---|---|---|---|---|---|---|---|
| Mean ± SD | Mean ± SD | vs. Normoglycemic | Mean ± SD | vs. Normoglycemic | vs. Prediabetes | ||||
| % Change | p Value | % Change | p Value | % Change | p Value | ||||
| Glycerophospholipids (GPLs), total | 43.67 ± 2.55 | 41.07 ± 2.38 | −5.95 | <0.001 | 40.71 ± 2.93 | −6.78 | <0.001 | −0.88 | NS |
| Phosphatidylcholine (PC) | 32.70 ± 2.27 | 32.18 ± 2.98 | −1.59 | NS | 31.03 ± 2.80 | −5.11 | <0.01 | −3.57 | NS |
| Lysophosphatidylcholine (LysoPC) | 2.69 ± 0.54 | 4.36 ± 0.64 | +62.08 | <0.001 | 4.06 ± 0.91 | +50.93 | <0.001 | −6.88 | NS |
| Phosphatidylethanolamine (PE) | 1.05 ± 0.25 | 0.70 ± 0.28 | −33.33 | <0.001 | 0.73 ± 0.20 | −30.48 | <0.001 | −4.28 | NS |
| Phosphatidylinositol (PI) | 1.78 ± 0.53 | 1.11 ± 0.33 | −37.64 | <0.001 | 2.34 ± 0.74 | +31.46 | <0.001 | +110.81 | <0.001 |
| Rest GPLs a | 5.45 ± 1.55 | 2.72 ± 1.21 | −51.18 | <0.001 | 2.55 ± 0.77 | −49.16 | <0.001 | +4.14 | NS |
| Ether glycerolipids (ether GLs), total | 5.40 ± 0.88 | 4.92 ± 0.63 | −8.89 | <0.05 | 4.29 ± 0.95 | −20.56 | <0.001 | −12.80 | <0.01 |
| Plasmalogens | 1.60 ± 0.32 | 1.72 ± 0.59 | +7.50 | NS | 1.52 ± 0.25 | −5.00 | NS | −11.63 | <0.05 |
| Rest ether GLs b | 3.80 ± 0.85 | 3.20 ± 0.74 | −15.79 | <0.01 | 2.77 ± 0.90 | −27.11 | <0.001 | −13.44 | <0.05 |
| Sphingolipids (SLs), total | 6.43 ± 0.95 | 7.21 ± 1.02 | +12.13 | <0.001 | 7.43 ± 0.93 | +15.55 | <0.001 | +3.05 | NS |
| Sphingomyelin (SM) | 6.11 ± 0.90 | 5.51 ± 1.08 | −9.82 | <0.01 | 5.48 ± 0.80 | −10.31 | <0.01 | −0.54 | NS |
| Rest SLs c | 0.32 ± 0.11 | 1.70 ± 0.77 | +413.25 | <0.001 | 1.95 ± 0.90 | +509.38 | <0.001 | +14.71 | NS |
| PC/SM | 4.75 ± 0.54 | 5.37 ± 1.23 | +13.05 | <0.01 | 4.60 ± 0.89 | −3.16 | NS | −14.34 | <0.001 |
 | |||||||||
| Normoglycemic Group | Patients with Prediabetes | Patients with T2D | |||||||
|---|---|---|---|---|---|---|---|---|---|
| Mean ± SD | Mean ± SD | vs. Normoglycemic | Mean ± SD | vs. Normoglycemic | vs Prediabetes | ||||
| % Change | p Value | % Change | p Value | % Change | p Value | ||||
| % Saturated | 37.07 ± 3.11 | 41.87 ± 1.81 | +12.95 | <0.001 | 47.23 ± 6.78 | +27.41 | <0.001 | +12.80 | <0.001 |
| % Unsaturated | 62.93 ± 3.11 | 58.13 ± 1.81 | −7.63 | <0.001 | 52.77 ± 6.77 | −16.14 | <0.001 | −9.22 | <0.001 |
| % Monounsaturated | 10.67 ± 3.68 | 6.35 ± 2.45 | −40.49 | <0.001 | 5.40 ± 2.30 | −49.39 | <0.001 | −14.96 | NS |
| % Polyunsaturated | 52.26 ± 2.78 | 51.78 ± 3.36 | −0.92 | NS | 47.37 ± 5.73 | −9.36 | <0.001 | −8.52 | <0.001 |
| 19.39 ± 2.24 | 18.73 ± 1.49 | −3.40 | NS | 16.65 ± 2.04 | −14.13 | <0.001 | −11.11 | <0.001 |
| 12.26 ± 1.68 | 10.71 ± 1.63 | −12.64 | <0.001 | 10.14 ± 1.75 | −17.29 | <0.001 | −5.32 | NS |
| 4.17 ± 0.68 | 2.47 ± 0.41 | −40.77 | <0.001 | 3.29 ± 0.82 | −21.10 | <0.001 | +33.20 | <0.001 |
| Saturated/unsaturated | 0.59 ± 0.09 | 0.72 ± 0.05 | +22.03 | <0.01 | 0.93 ± 0.26 | +57.63 | <0.001 | +29.17 | <0.001 |
| Saturated/polyunsaturated | 0.71 ± 0.08 | 0.81 ± 0.09 | +14.08 | <0.05 | 1.03 ± 0.28 | +45.07 | <0.001 | +27.16 | <0.001 |
 | |||||||||
Publisher’s Note: MDPI stays neutral with regard to jurisdictional claims in published maps and institutional affiliations. |
© 2022 by the authors. Licensee MDPI, Basel, Switzerland. This article is an open access article distributed under the terms and conditions of the Creative Commons Attribution (CC BY) license (https://creativecommons.org/licenses/by/4.0/).
Share and Cite
Kostara, C.E.; Karakitsou, K.S.; Florentin, M.; Bairaktari, E.T.; Tsimihodimos, V. Progressive, Qualitative, and Quantitative Alterations in HDL Lipidome from Healthy Subjects to Patients with Prediabetes and Type 2 Diabetes. Metabolites 2022, 12, 683. https://doi.org/10.3390/metabo12080683
Kostara CE, Karakitsou KS, Florentin M, Bairaktari ET, Tsimihodimos V. Progressive, Qualitative, and Quantitative Alterations in HDL Lipidome from Healthy Subjects to Patients with Prediabetes and Type 2 Diabetes. Metabolites. 2022; 12(8):683. https://doi.org/10.3390/metabo12080683
Chicago/Turabian StyleKostara, Christina E., Kiriaki S. Karakitsou, Matilda Florentin, Eleni T. Bairaktari, and Vasilis Tsimihodimos. 2022. "Progressive, Qualitative, and Quantitative Alterations in HDL Lipidome from Healthy Subjects to Patients with Prediabetes and Type 2 Diabetes" Metabolites 12, no. 8: 683. https://doi.org/10.3390/metabo12080683