
Sex-Specific Metabolic Effects of Dietary Folate Withdrawal in Wild-Type and Aldh1l1 Knockout Mice

 ,
,  , , ,
, , ,
Abstract
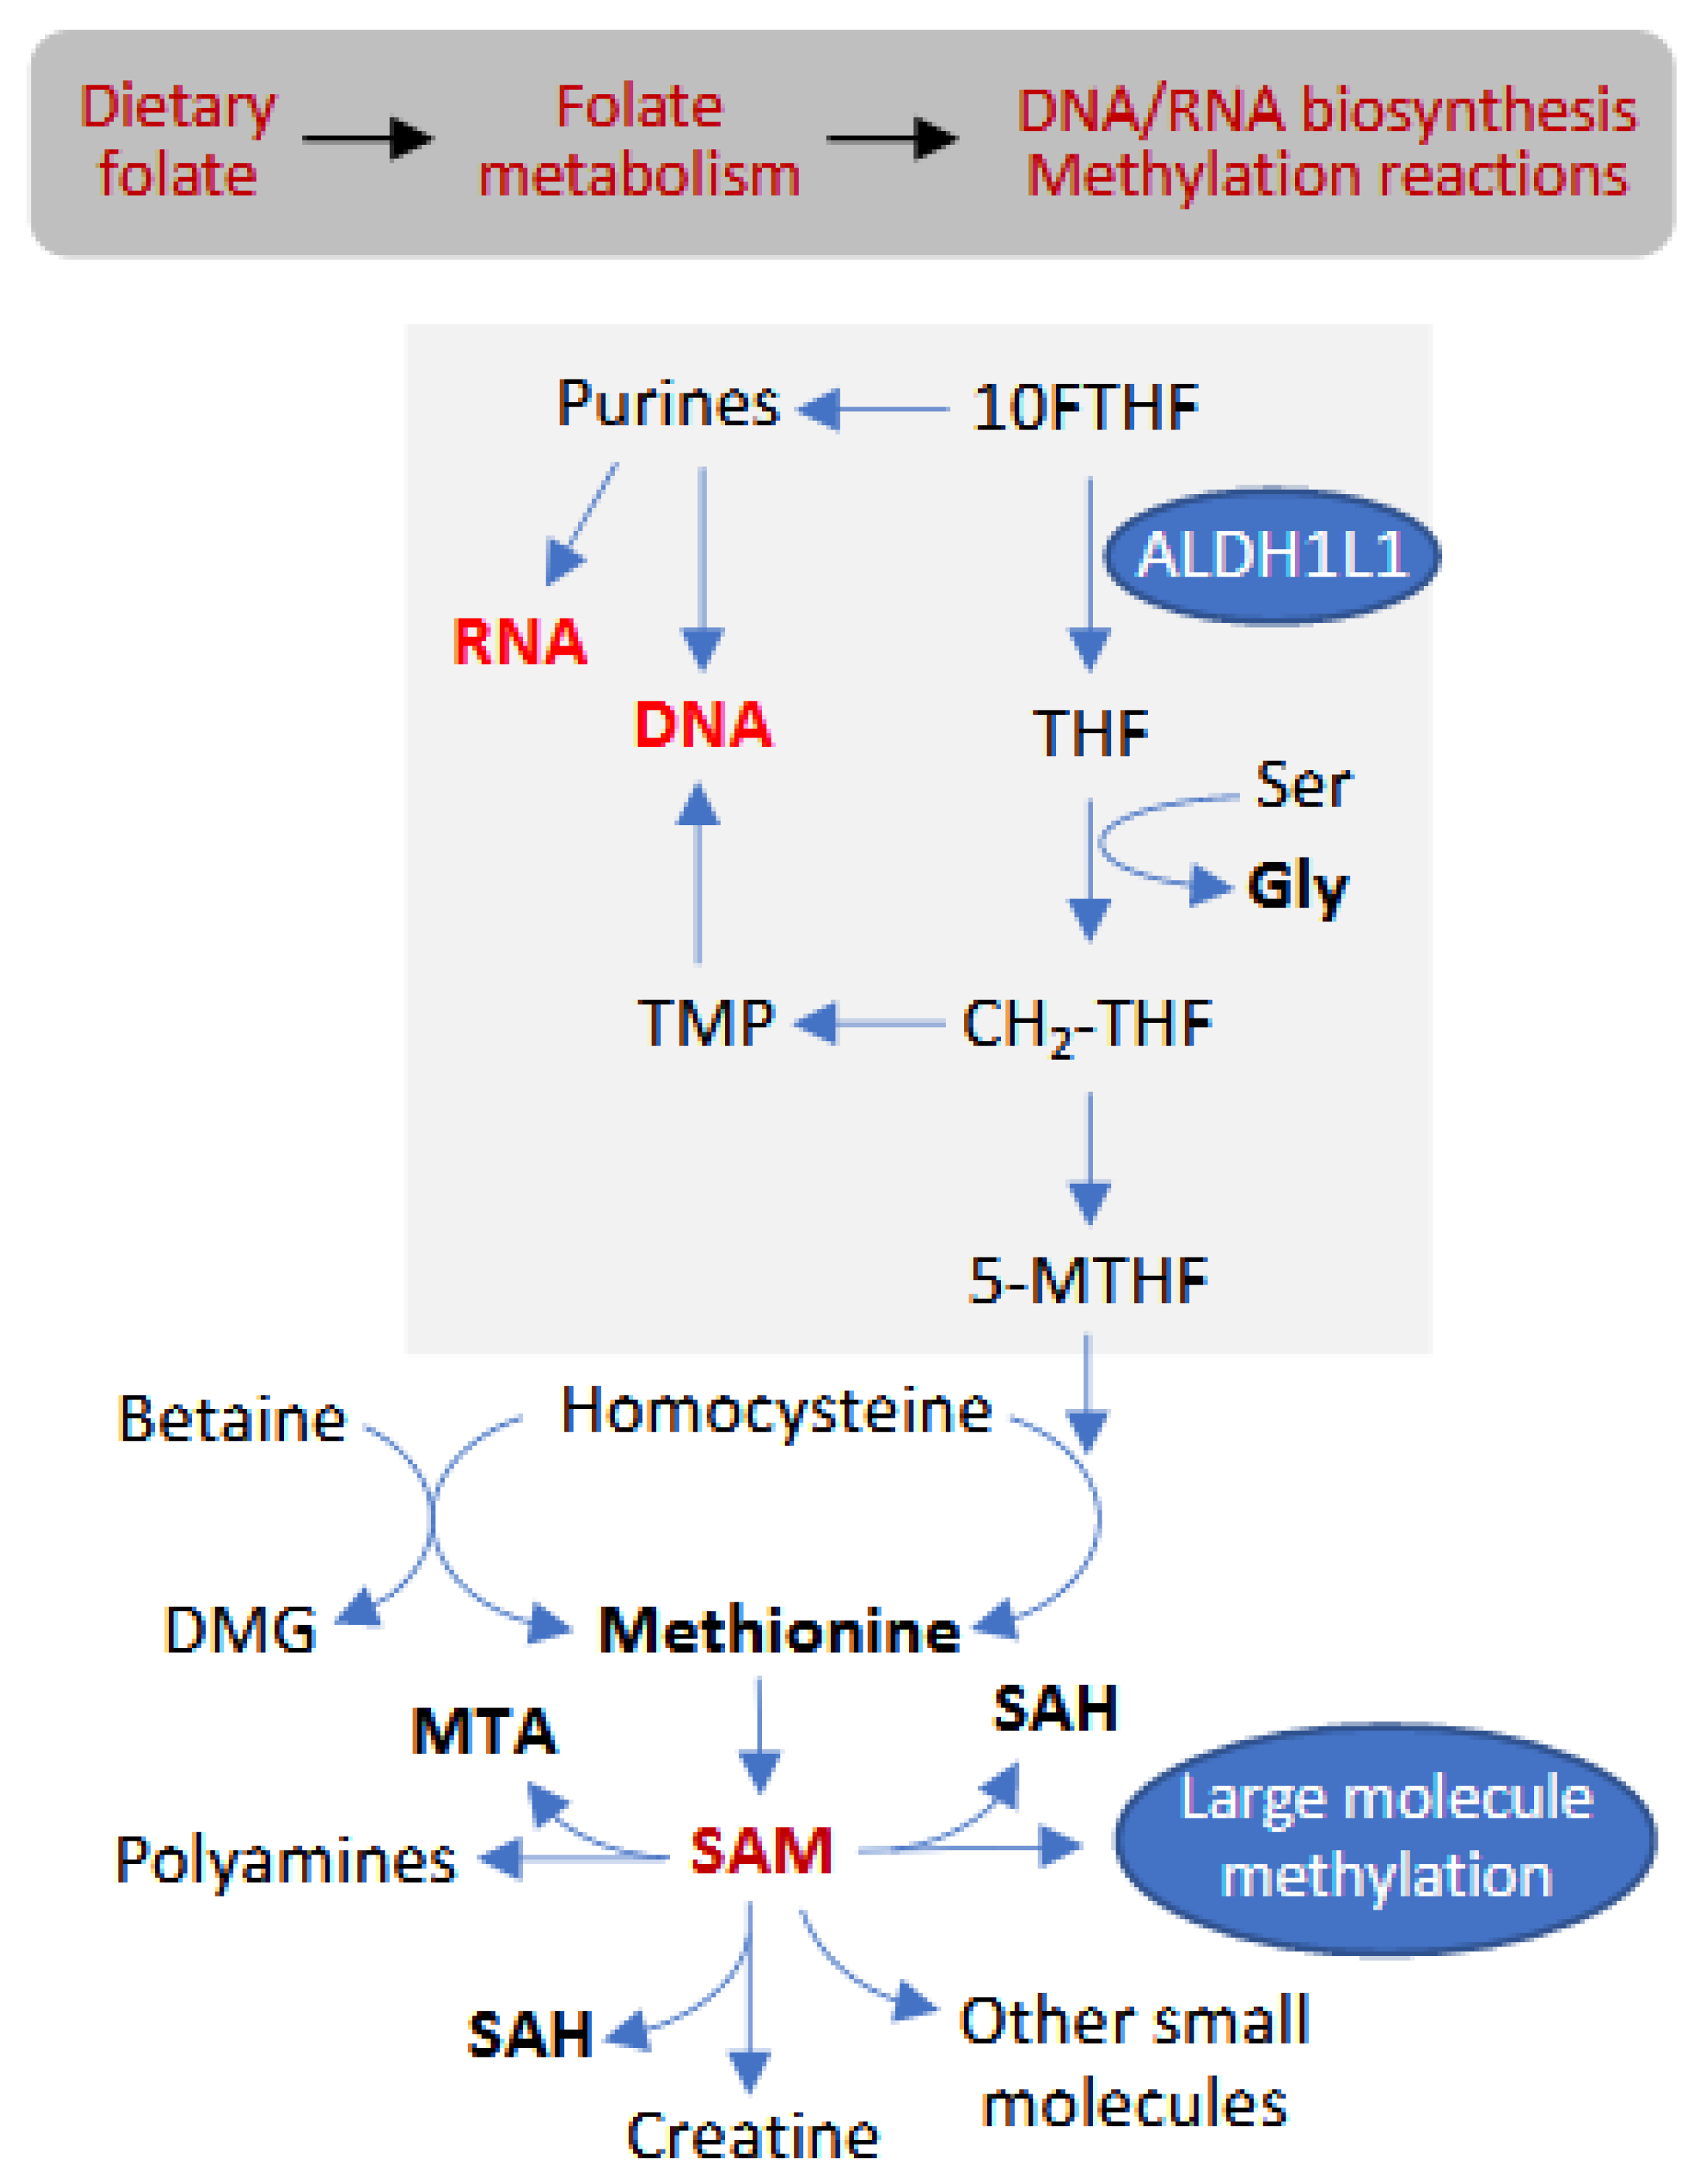
:1. Introduction
2. Materials and Methods
2.1. Animal Experiments
2.2. Generation of Aldh1l1 Knockout Mice
2.3. Genotyping
2.4. Administration of Diets
2.5. Histology
2.6. Blood Analysis
2.7. Plasma Sample Preparation
2.8. Liver Sample Preparation
2.9. UHPLC–High-Resolution Mass Spectrometry (UHPLC–HR-MS) Data Acquisition and Data Preprocessing
2.10. Multivariate and Univariate Statistical Analysis of Untargeted UHPLC–HR-MS Data
2.11. Identification and Annotation of Signals
2.12. Pathway Analysis of Untargeted Metabolomics Data
3. Results and Discussion
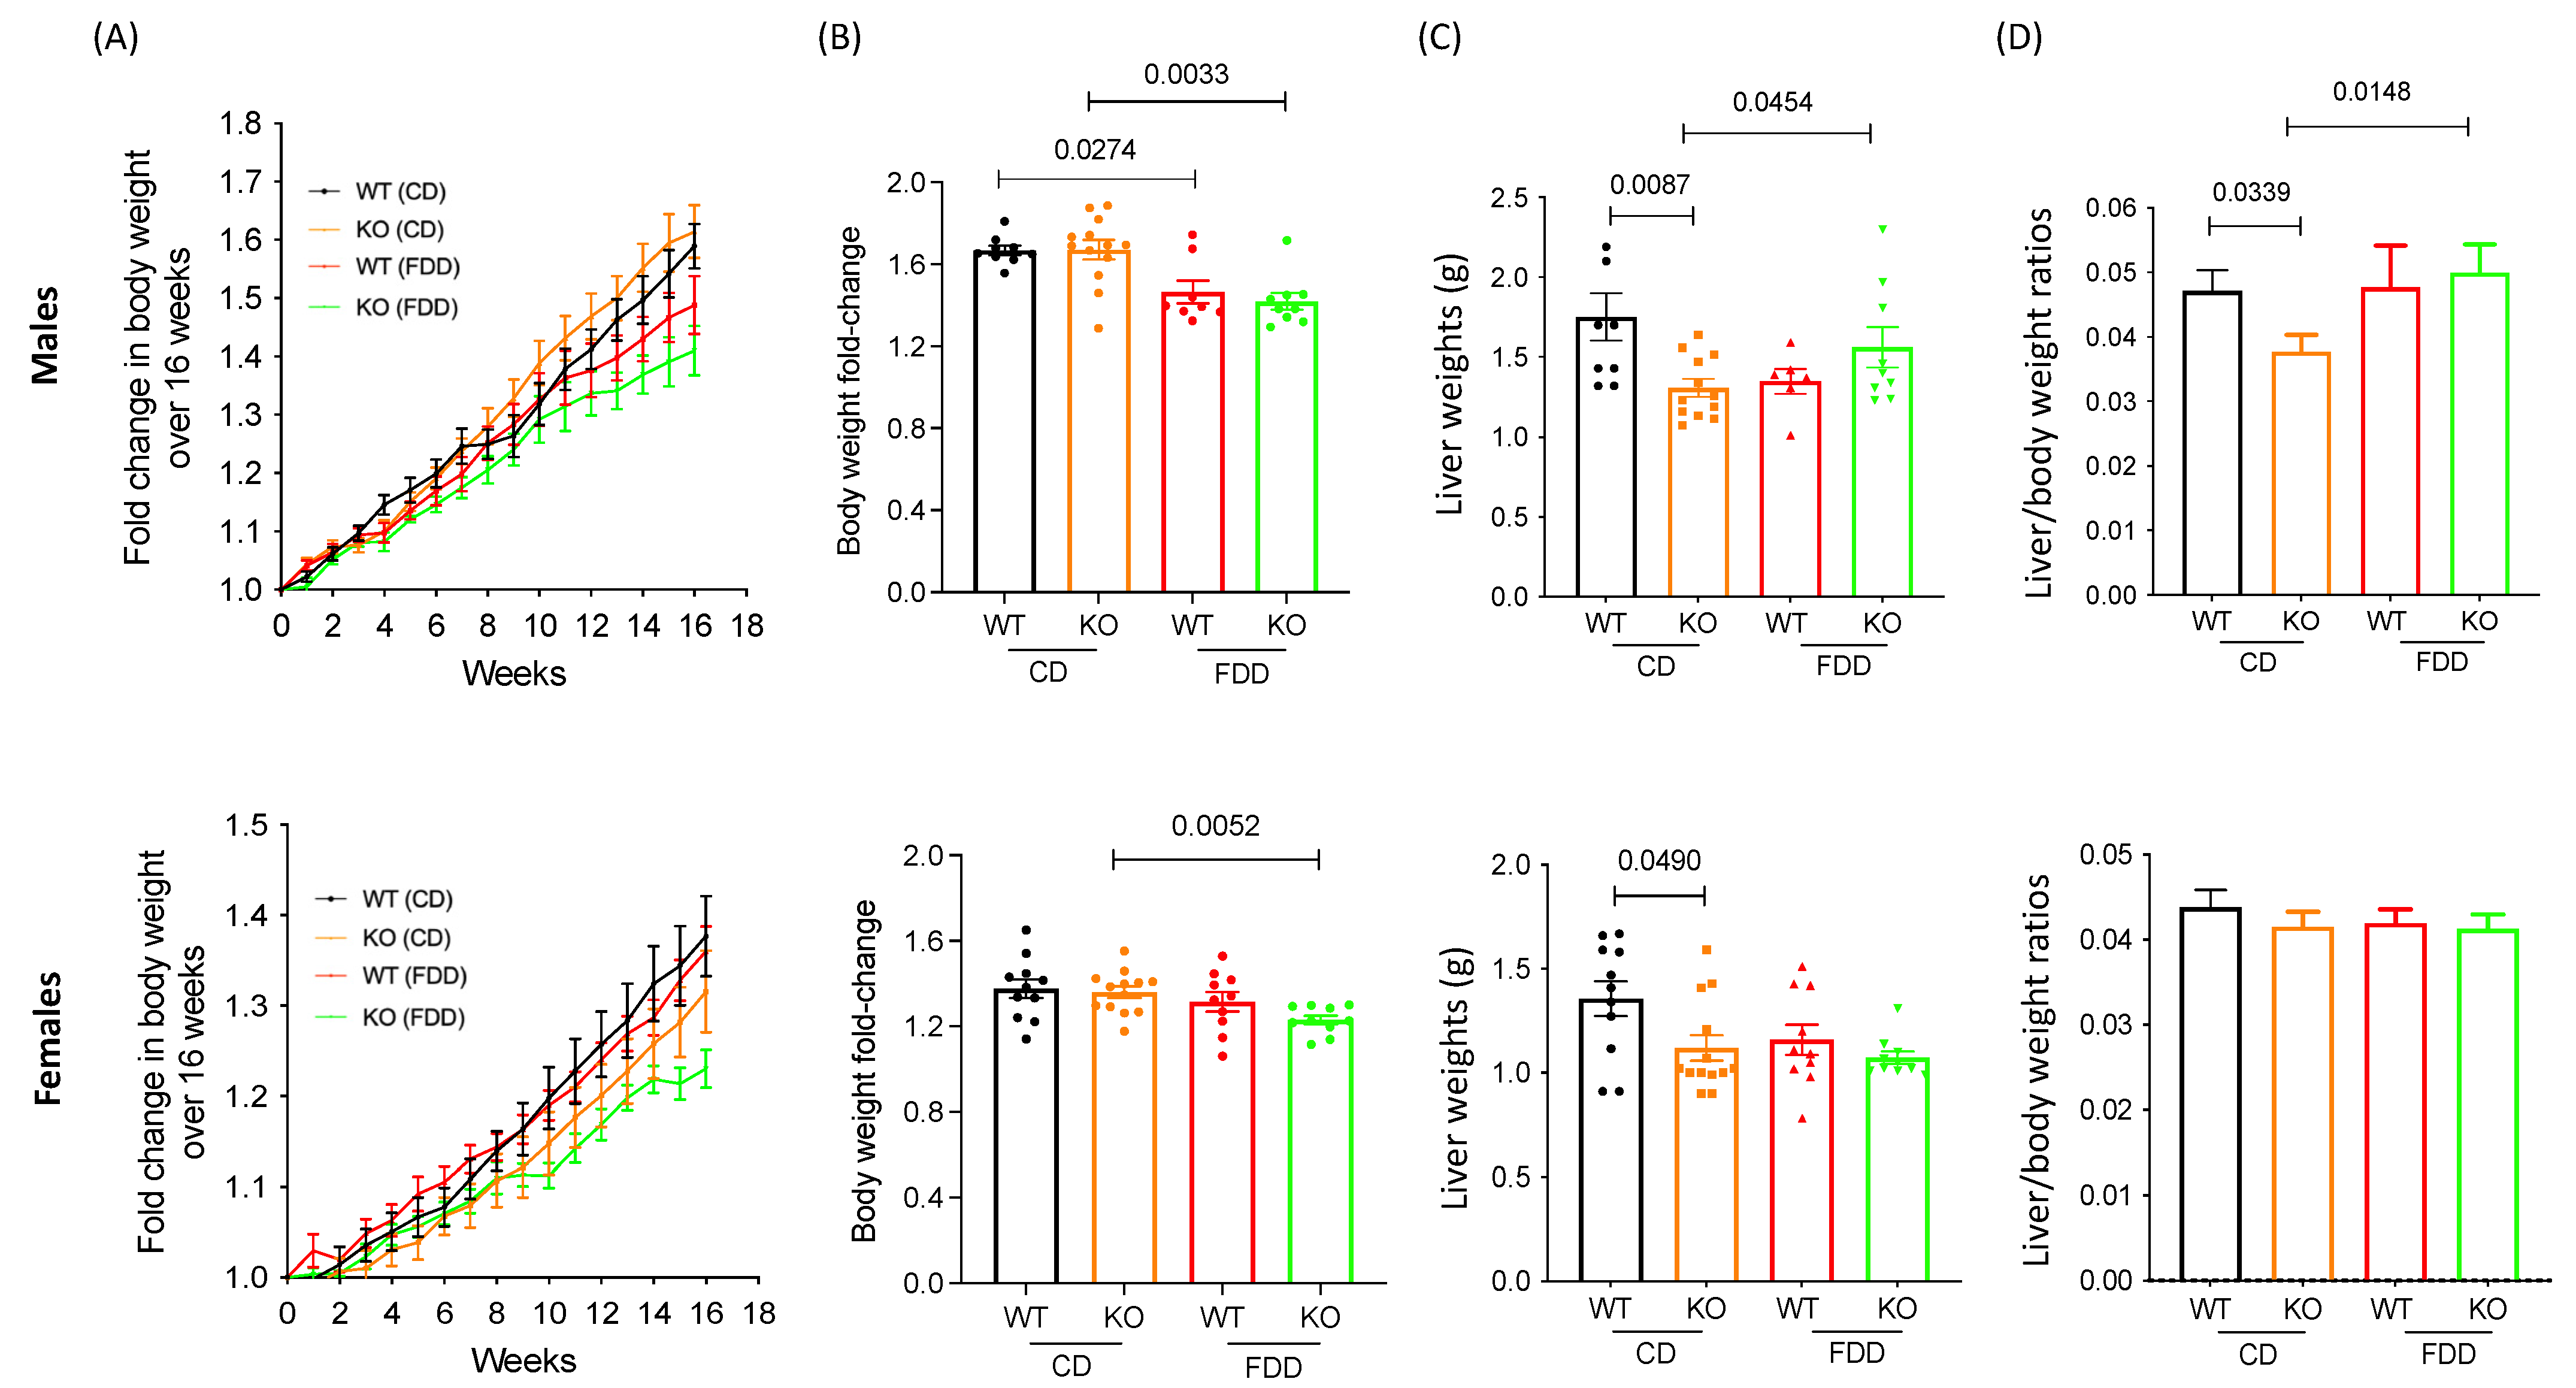
3.1. Alterations in Dietary Folic Acid Leads to Changes in Body Weight in Mice
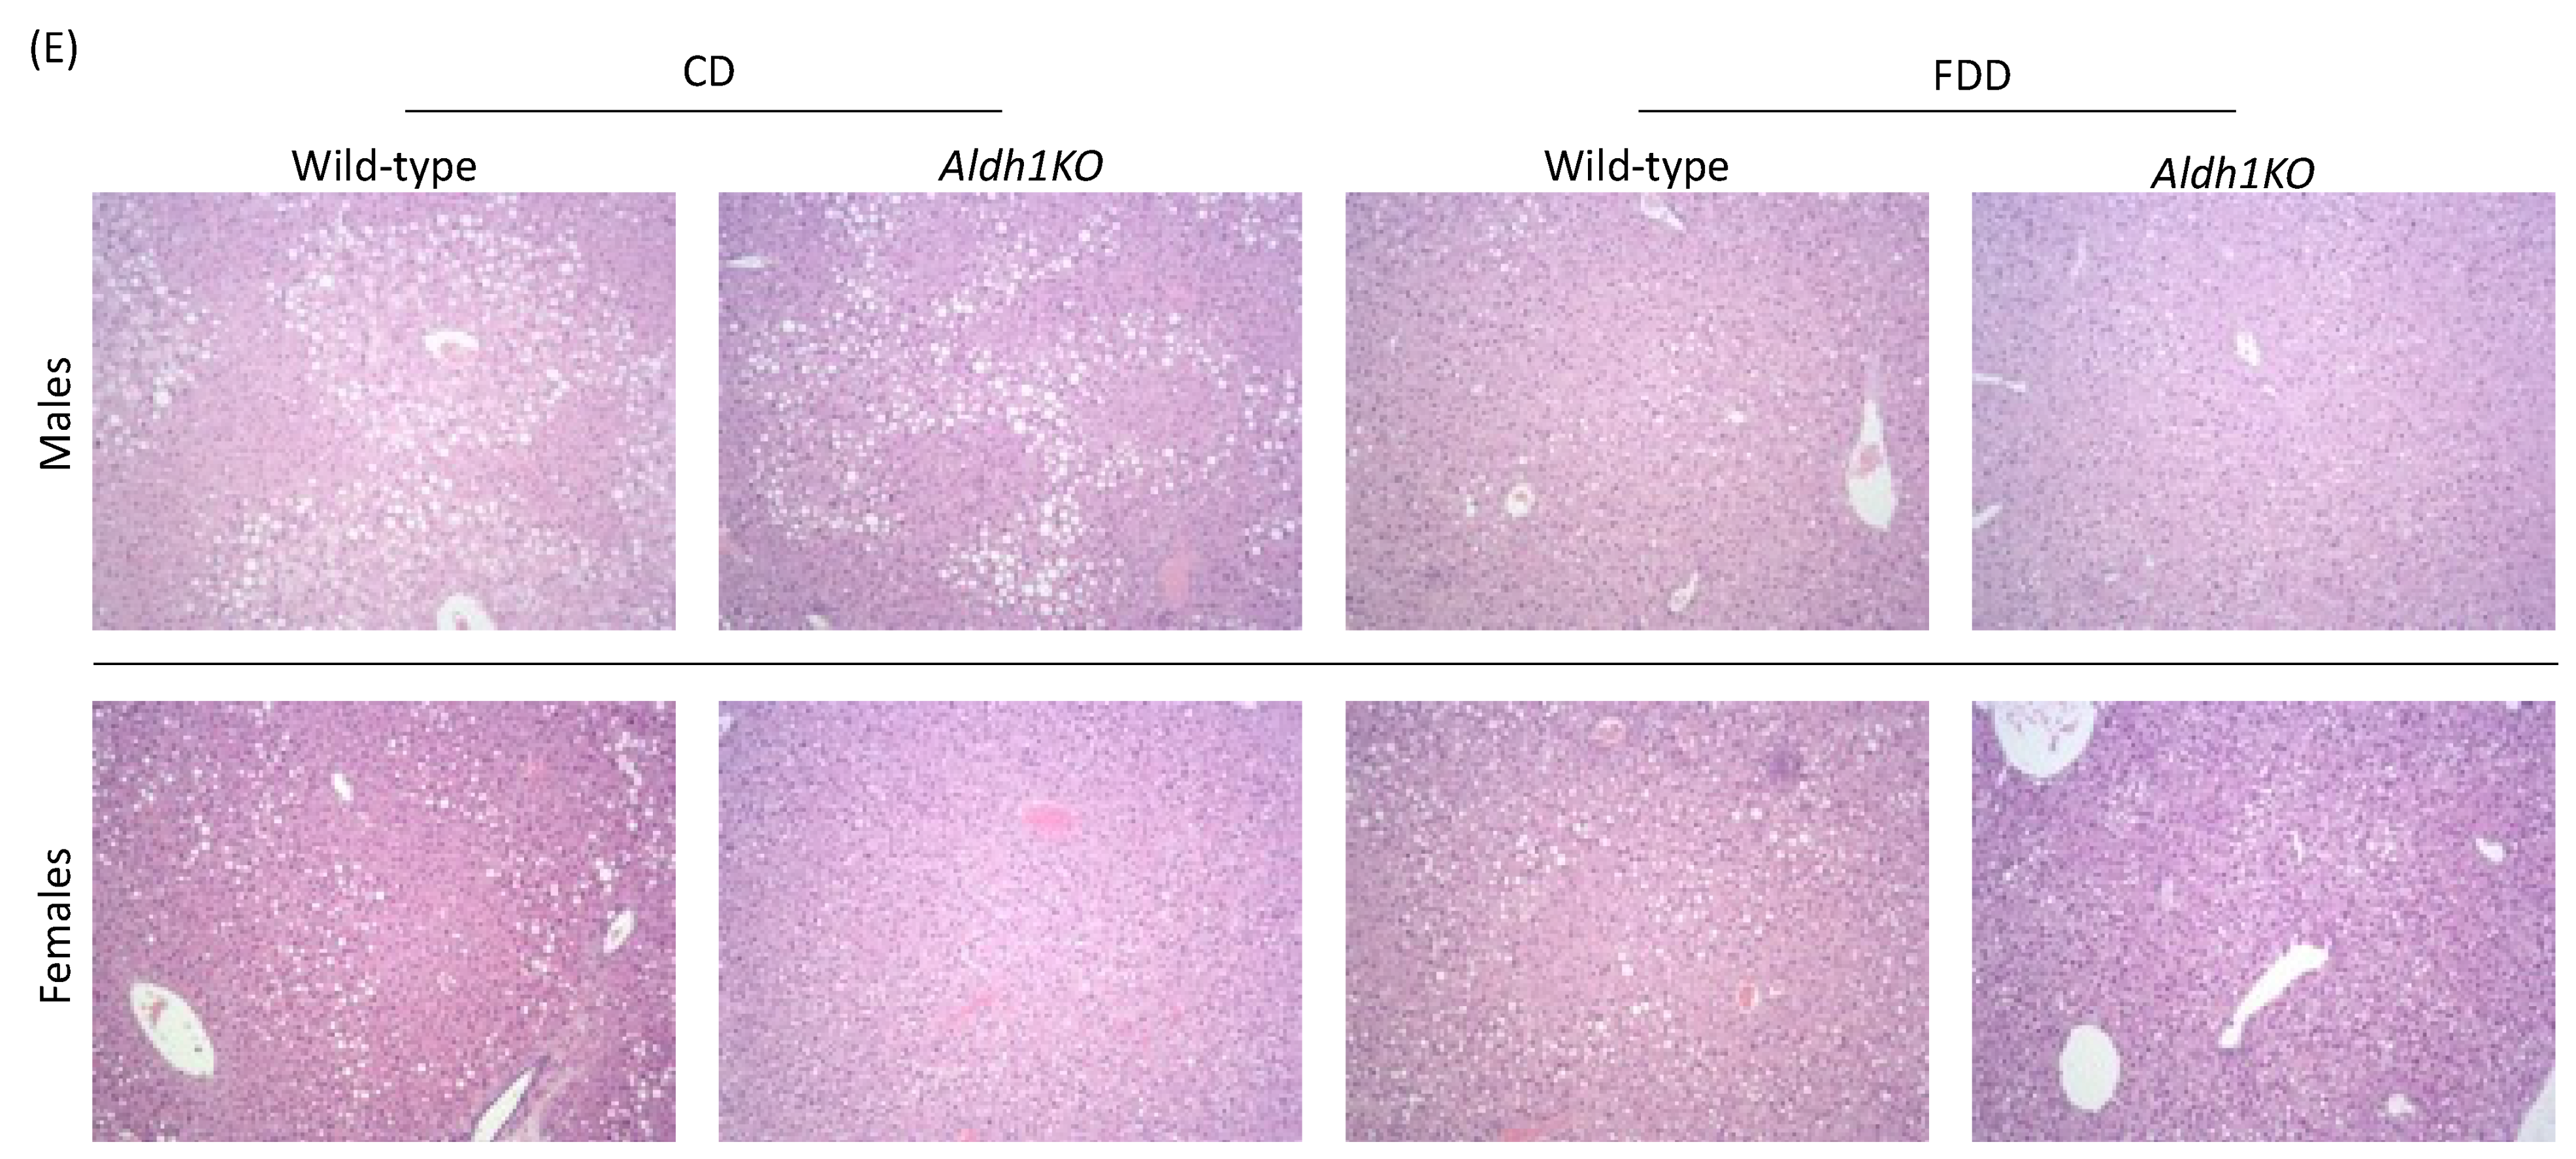
3.2. Folate-Deficient Diet Affects Liver Histology in a Sex-Specific Manner
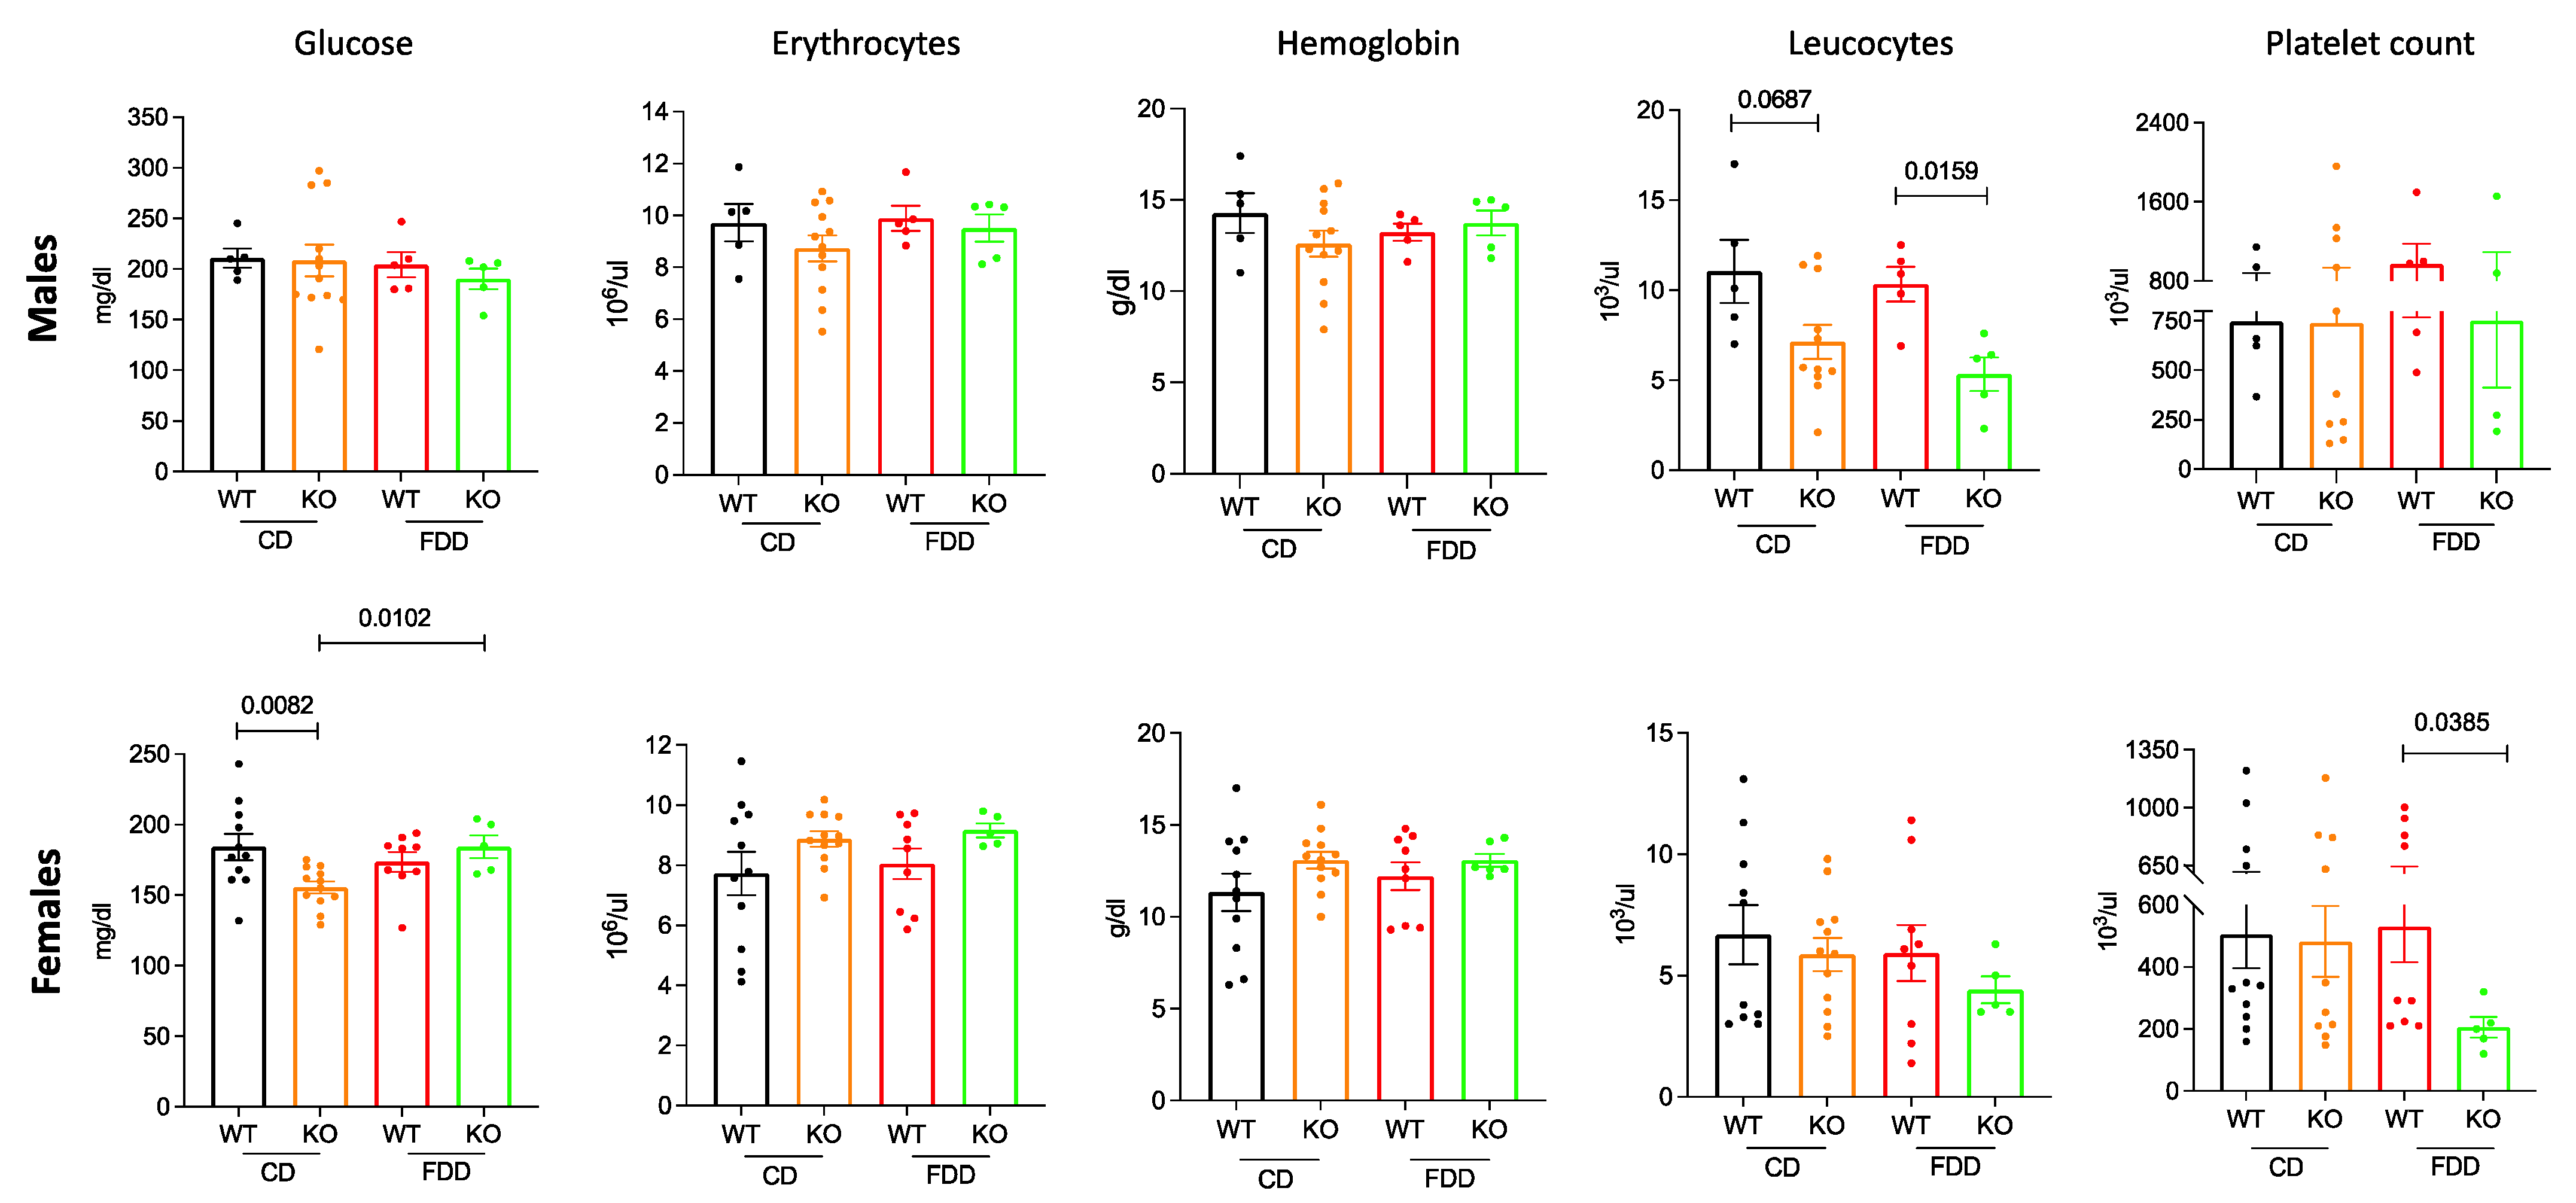
3.3. Folate-Deficient Diet Leads to Hematological Changes in Aldh1l1−/− Mice
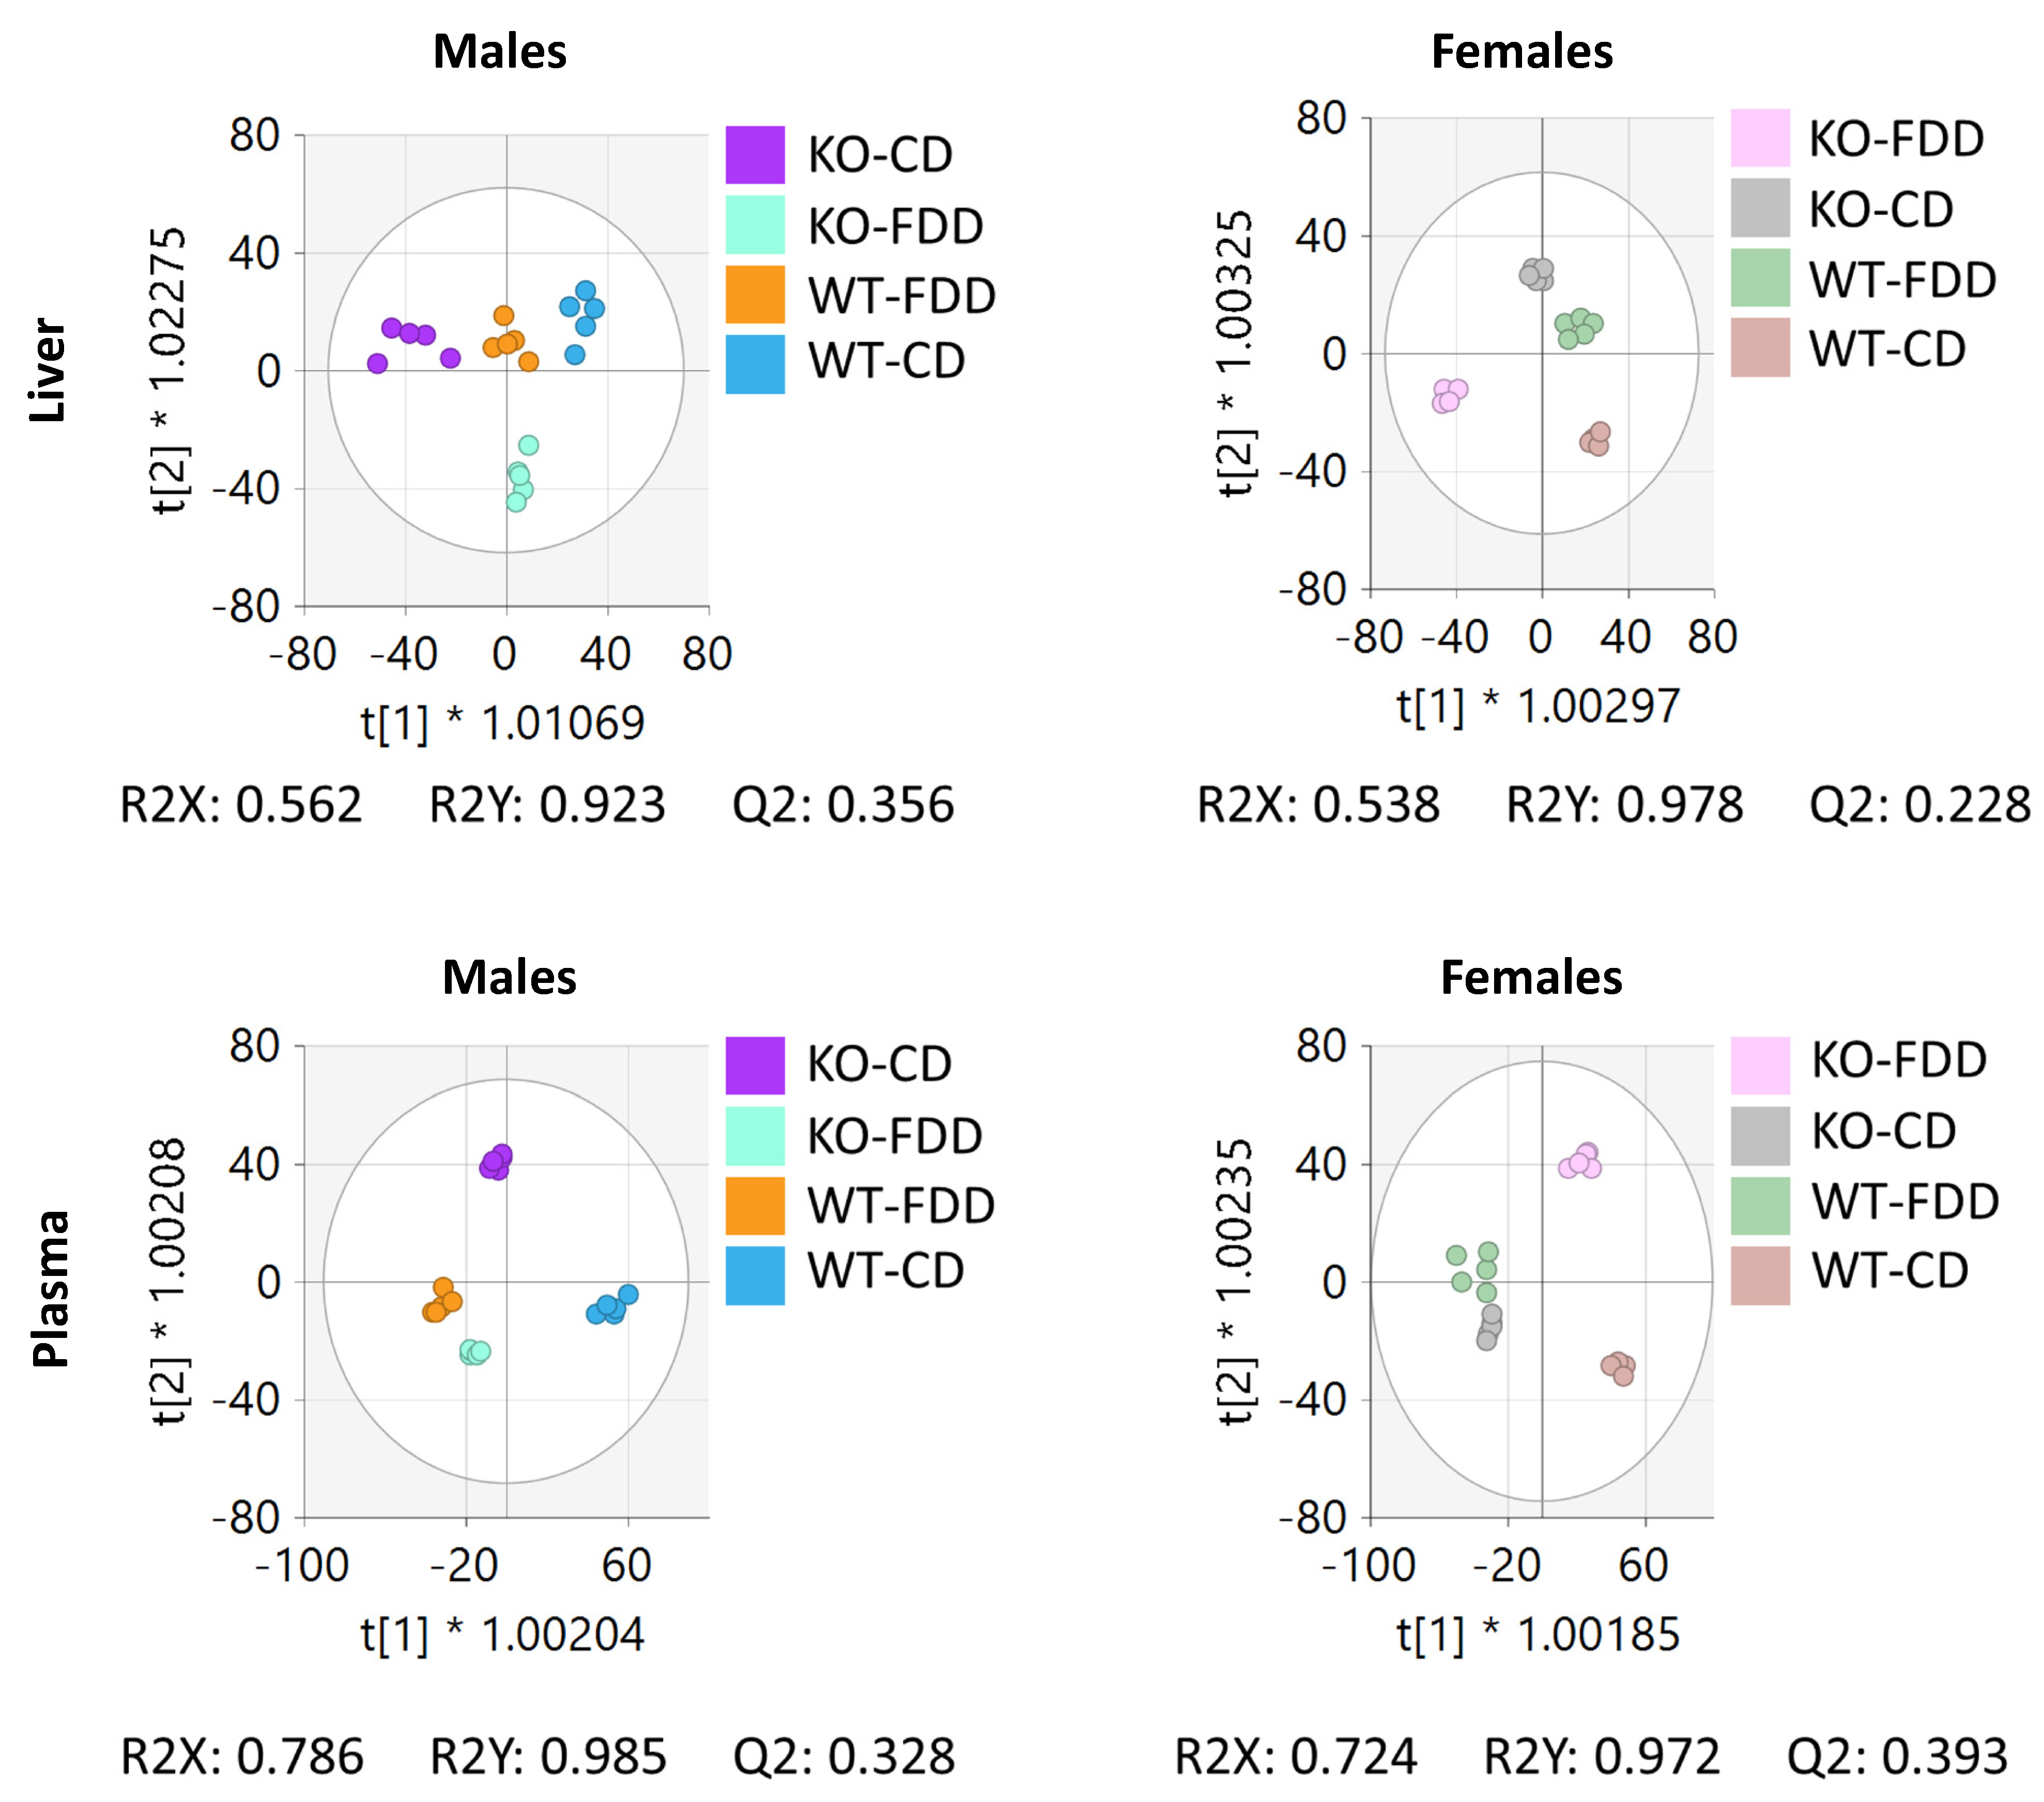
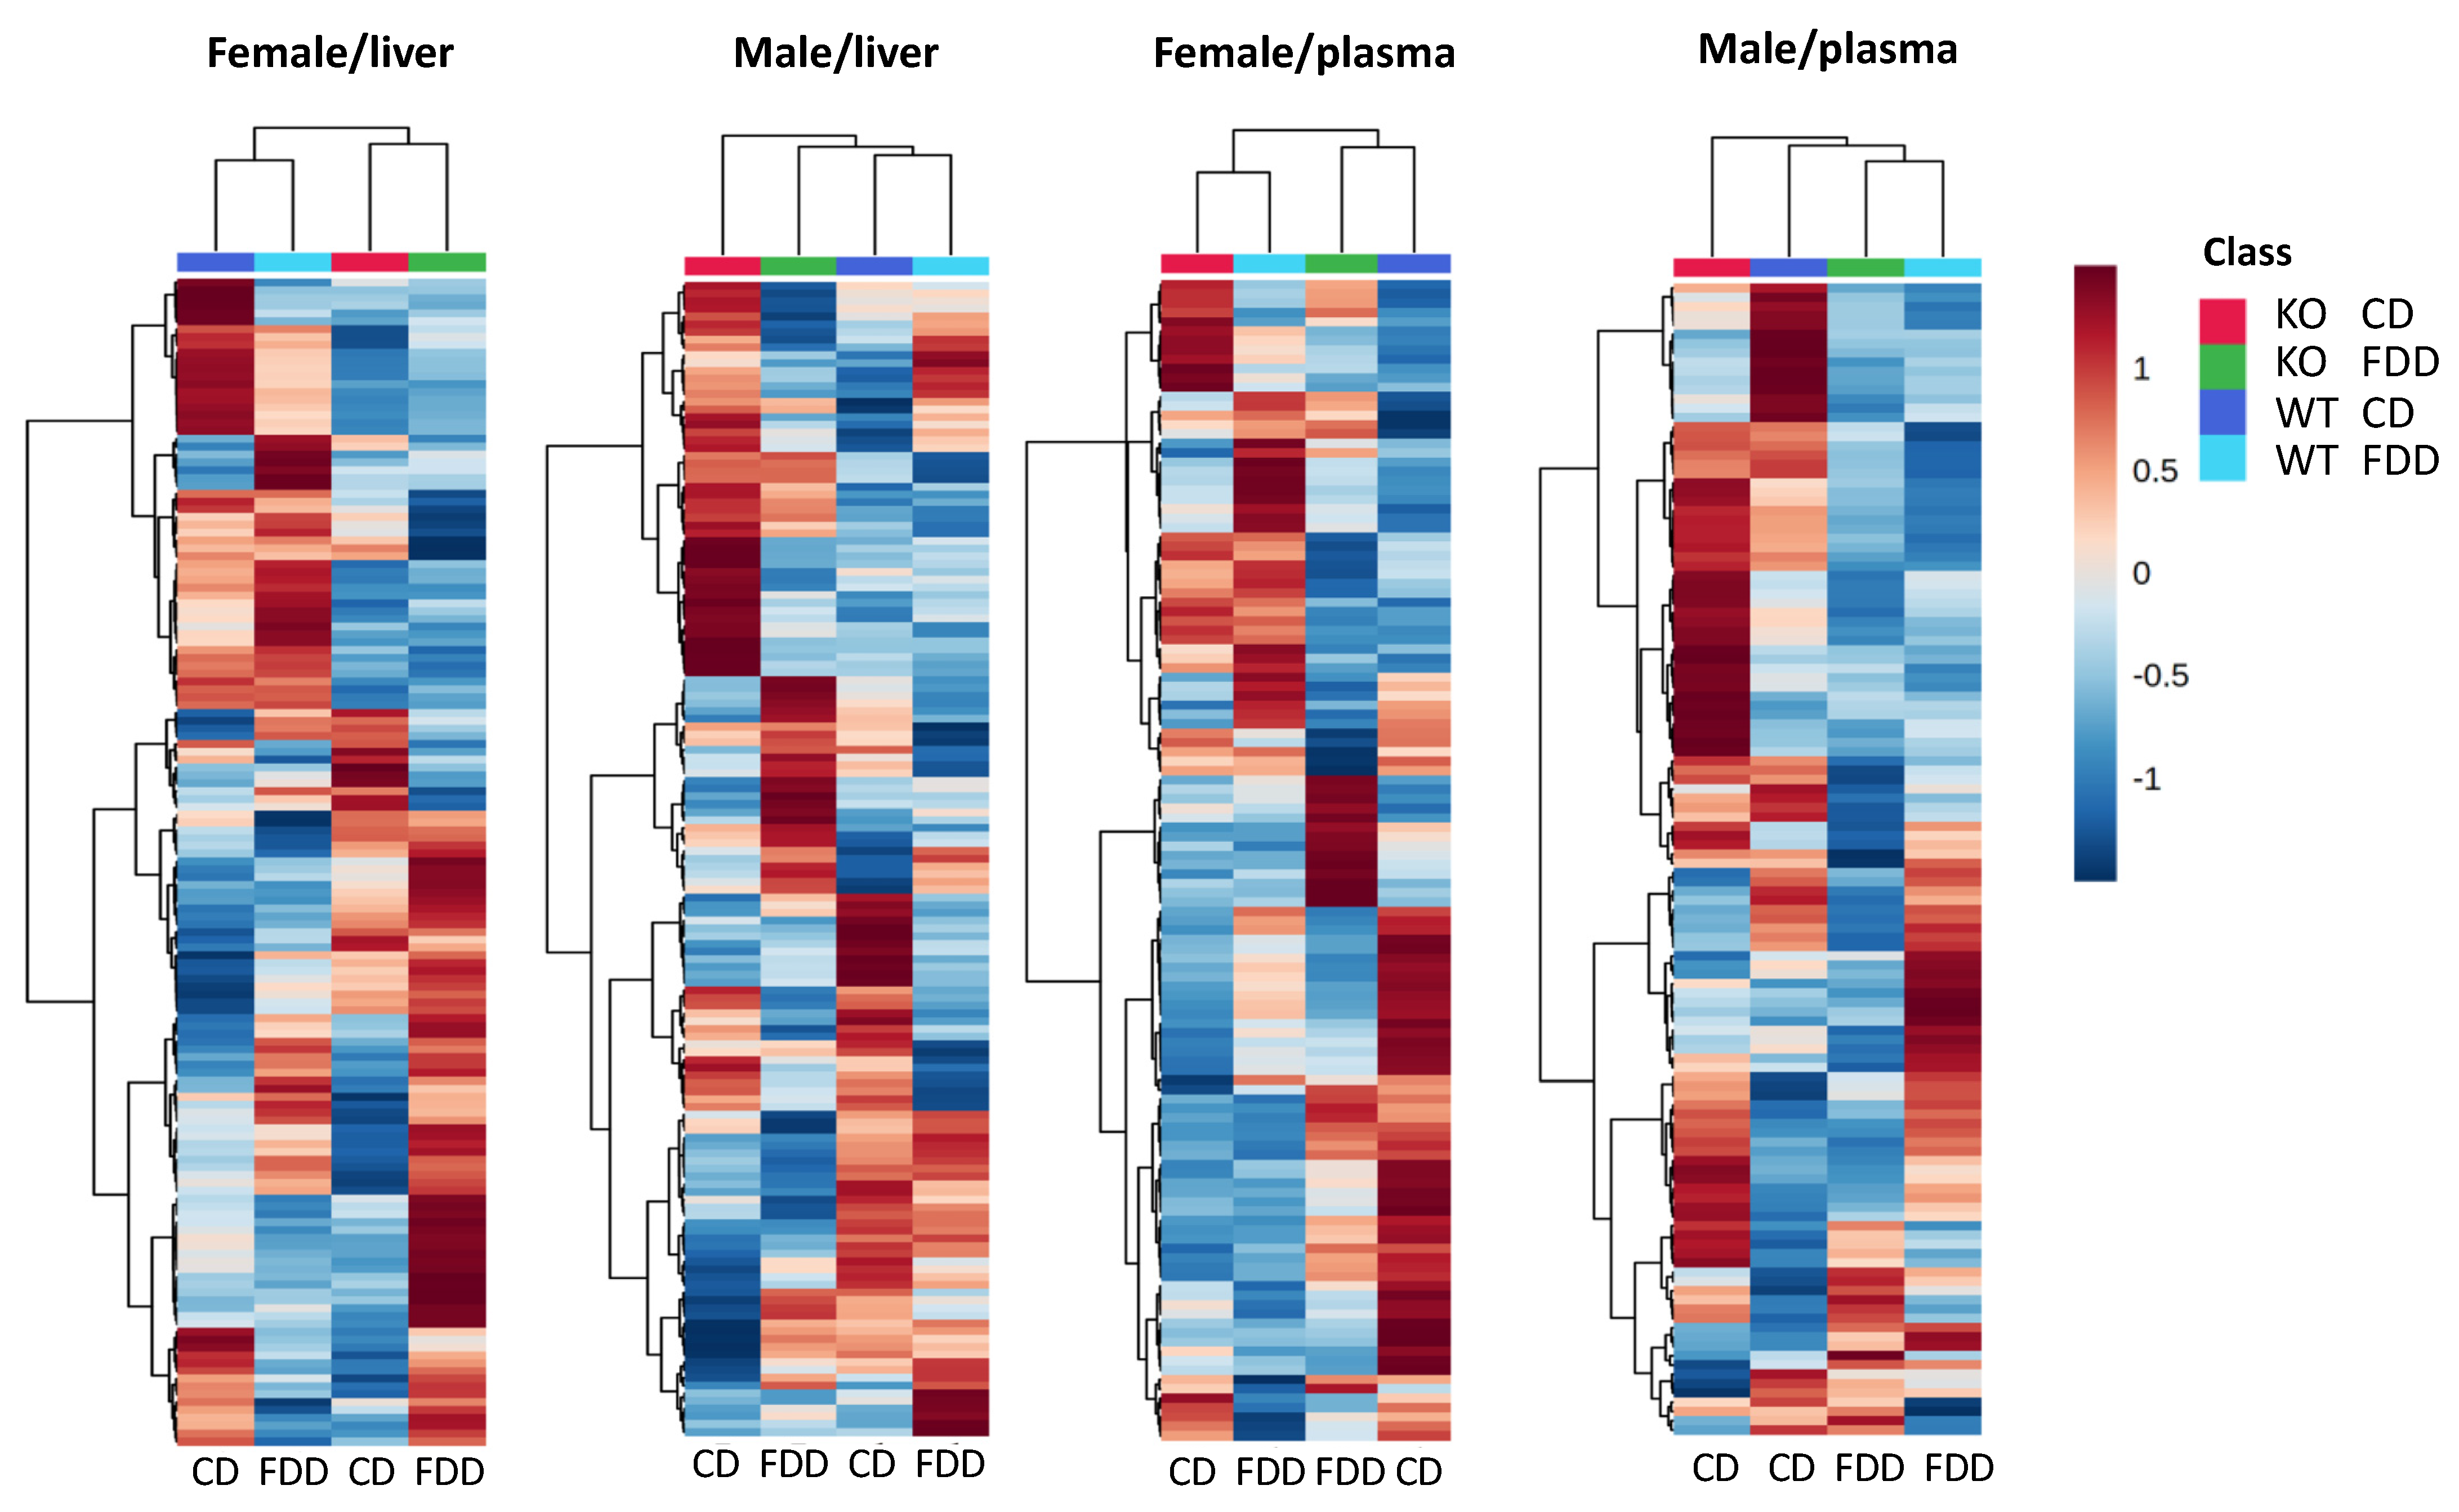
3.4. Overall Metabolomic Analysis
3.5. Metabolic Pathway Perturbations Due to Aldh1l1 KO and Dietary Folate Restriction
3.6. Overall Effect of the Genotype and Diet
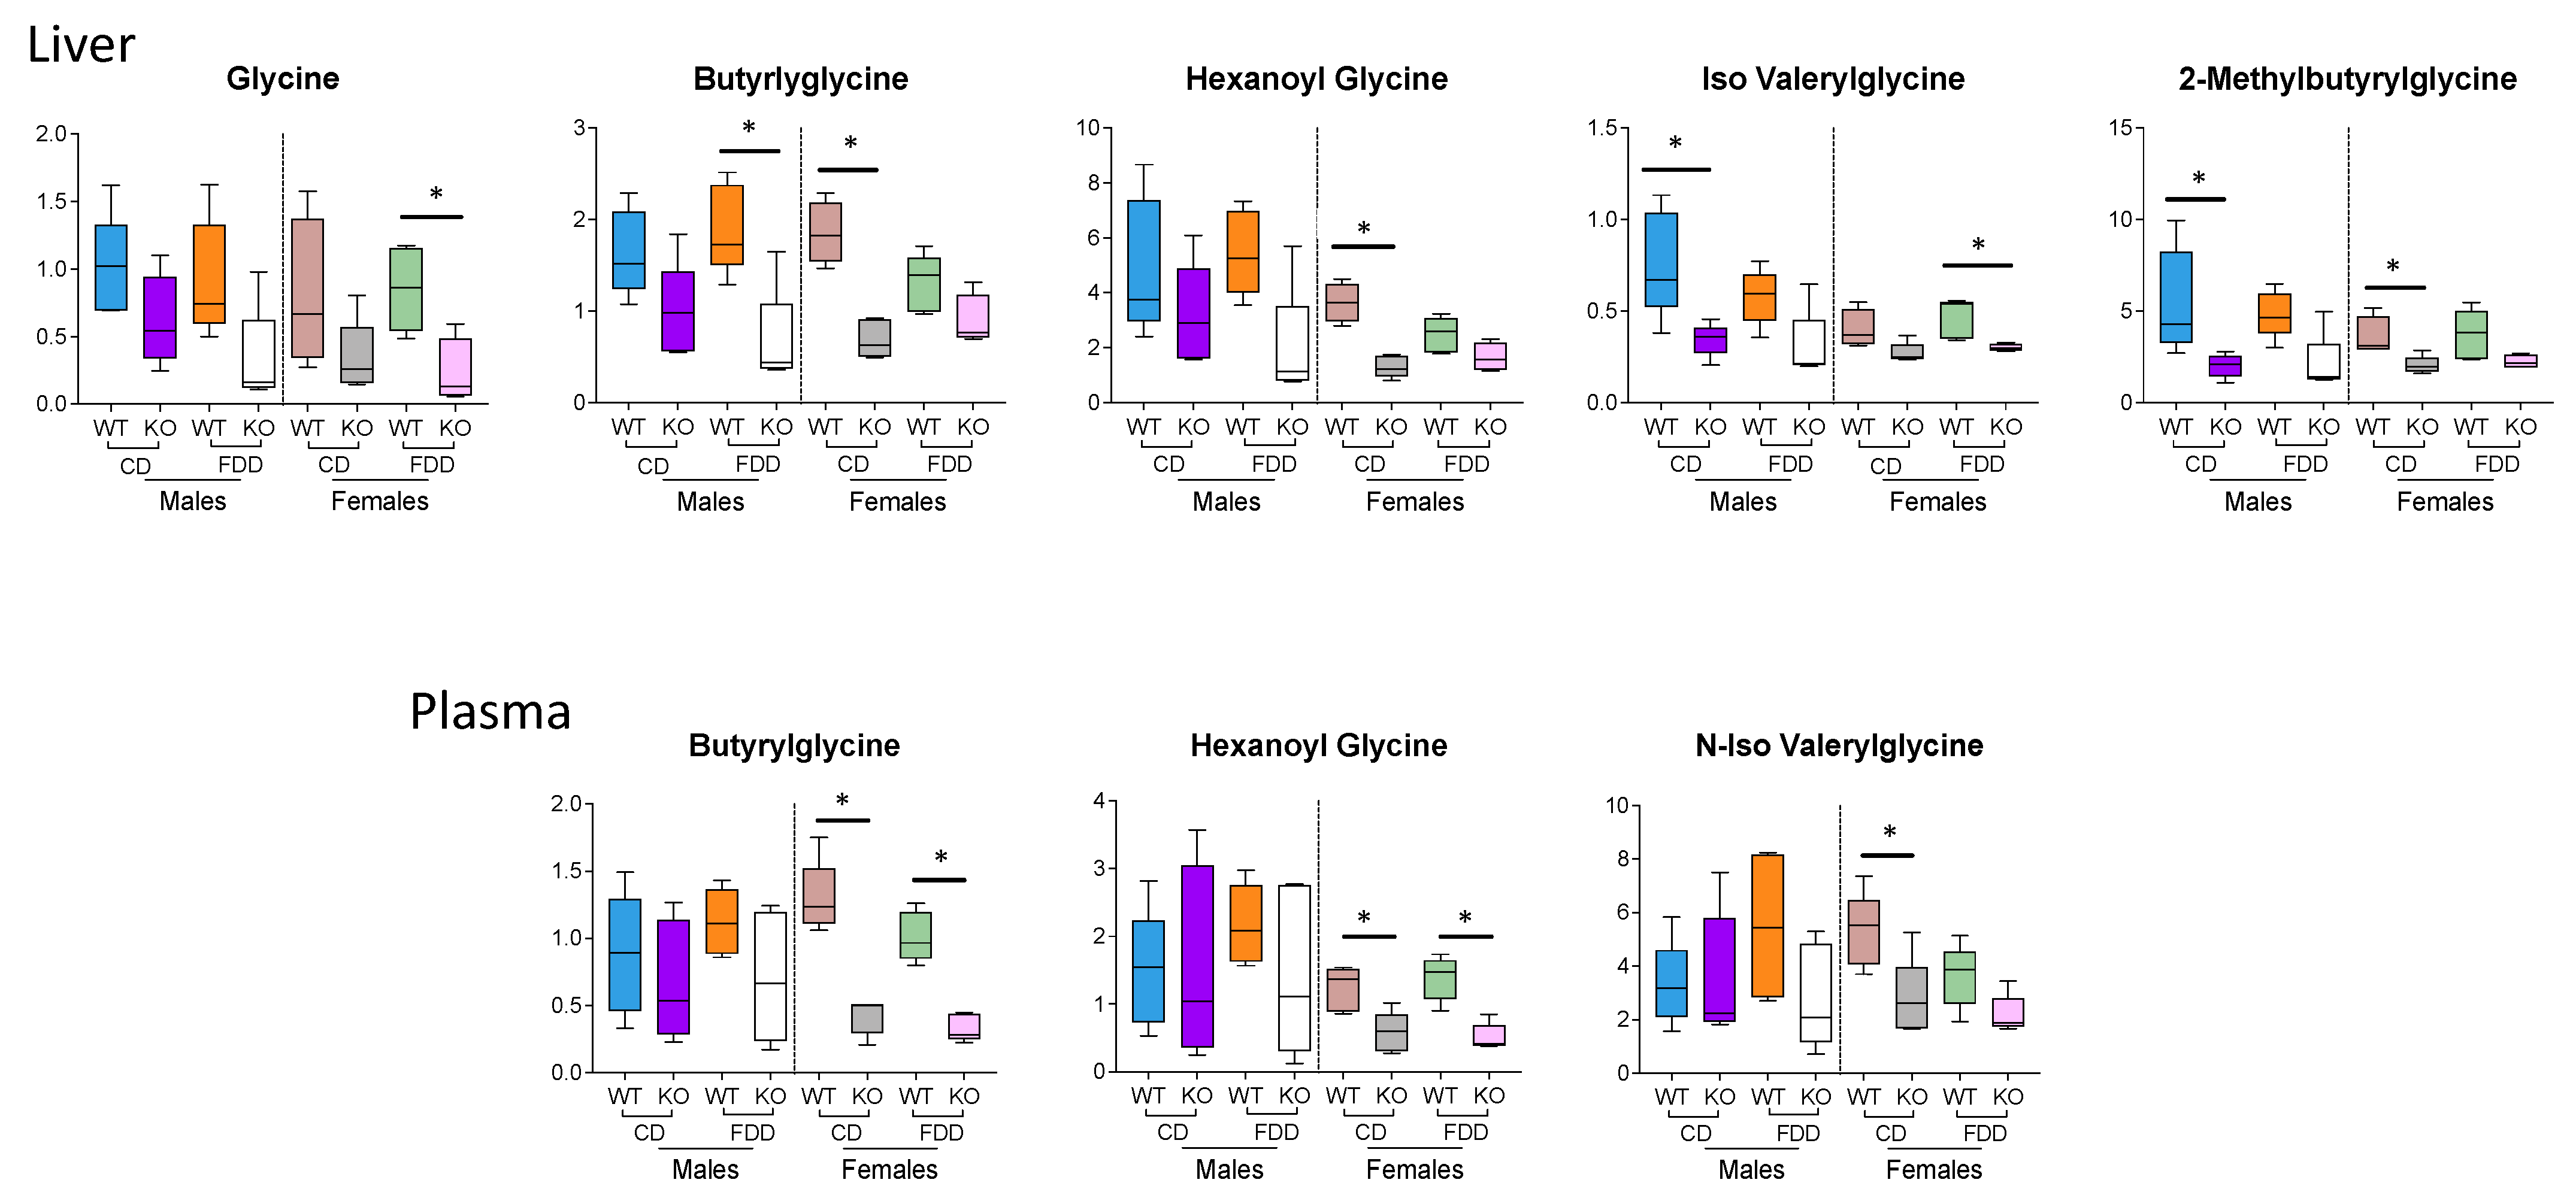
3.7. Glycine and Glycine Conjugates
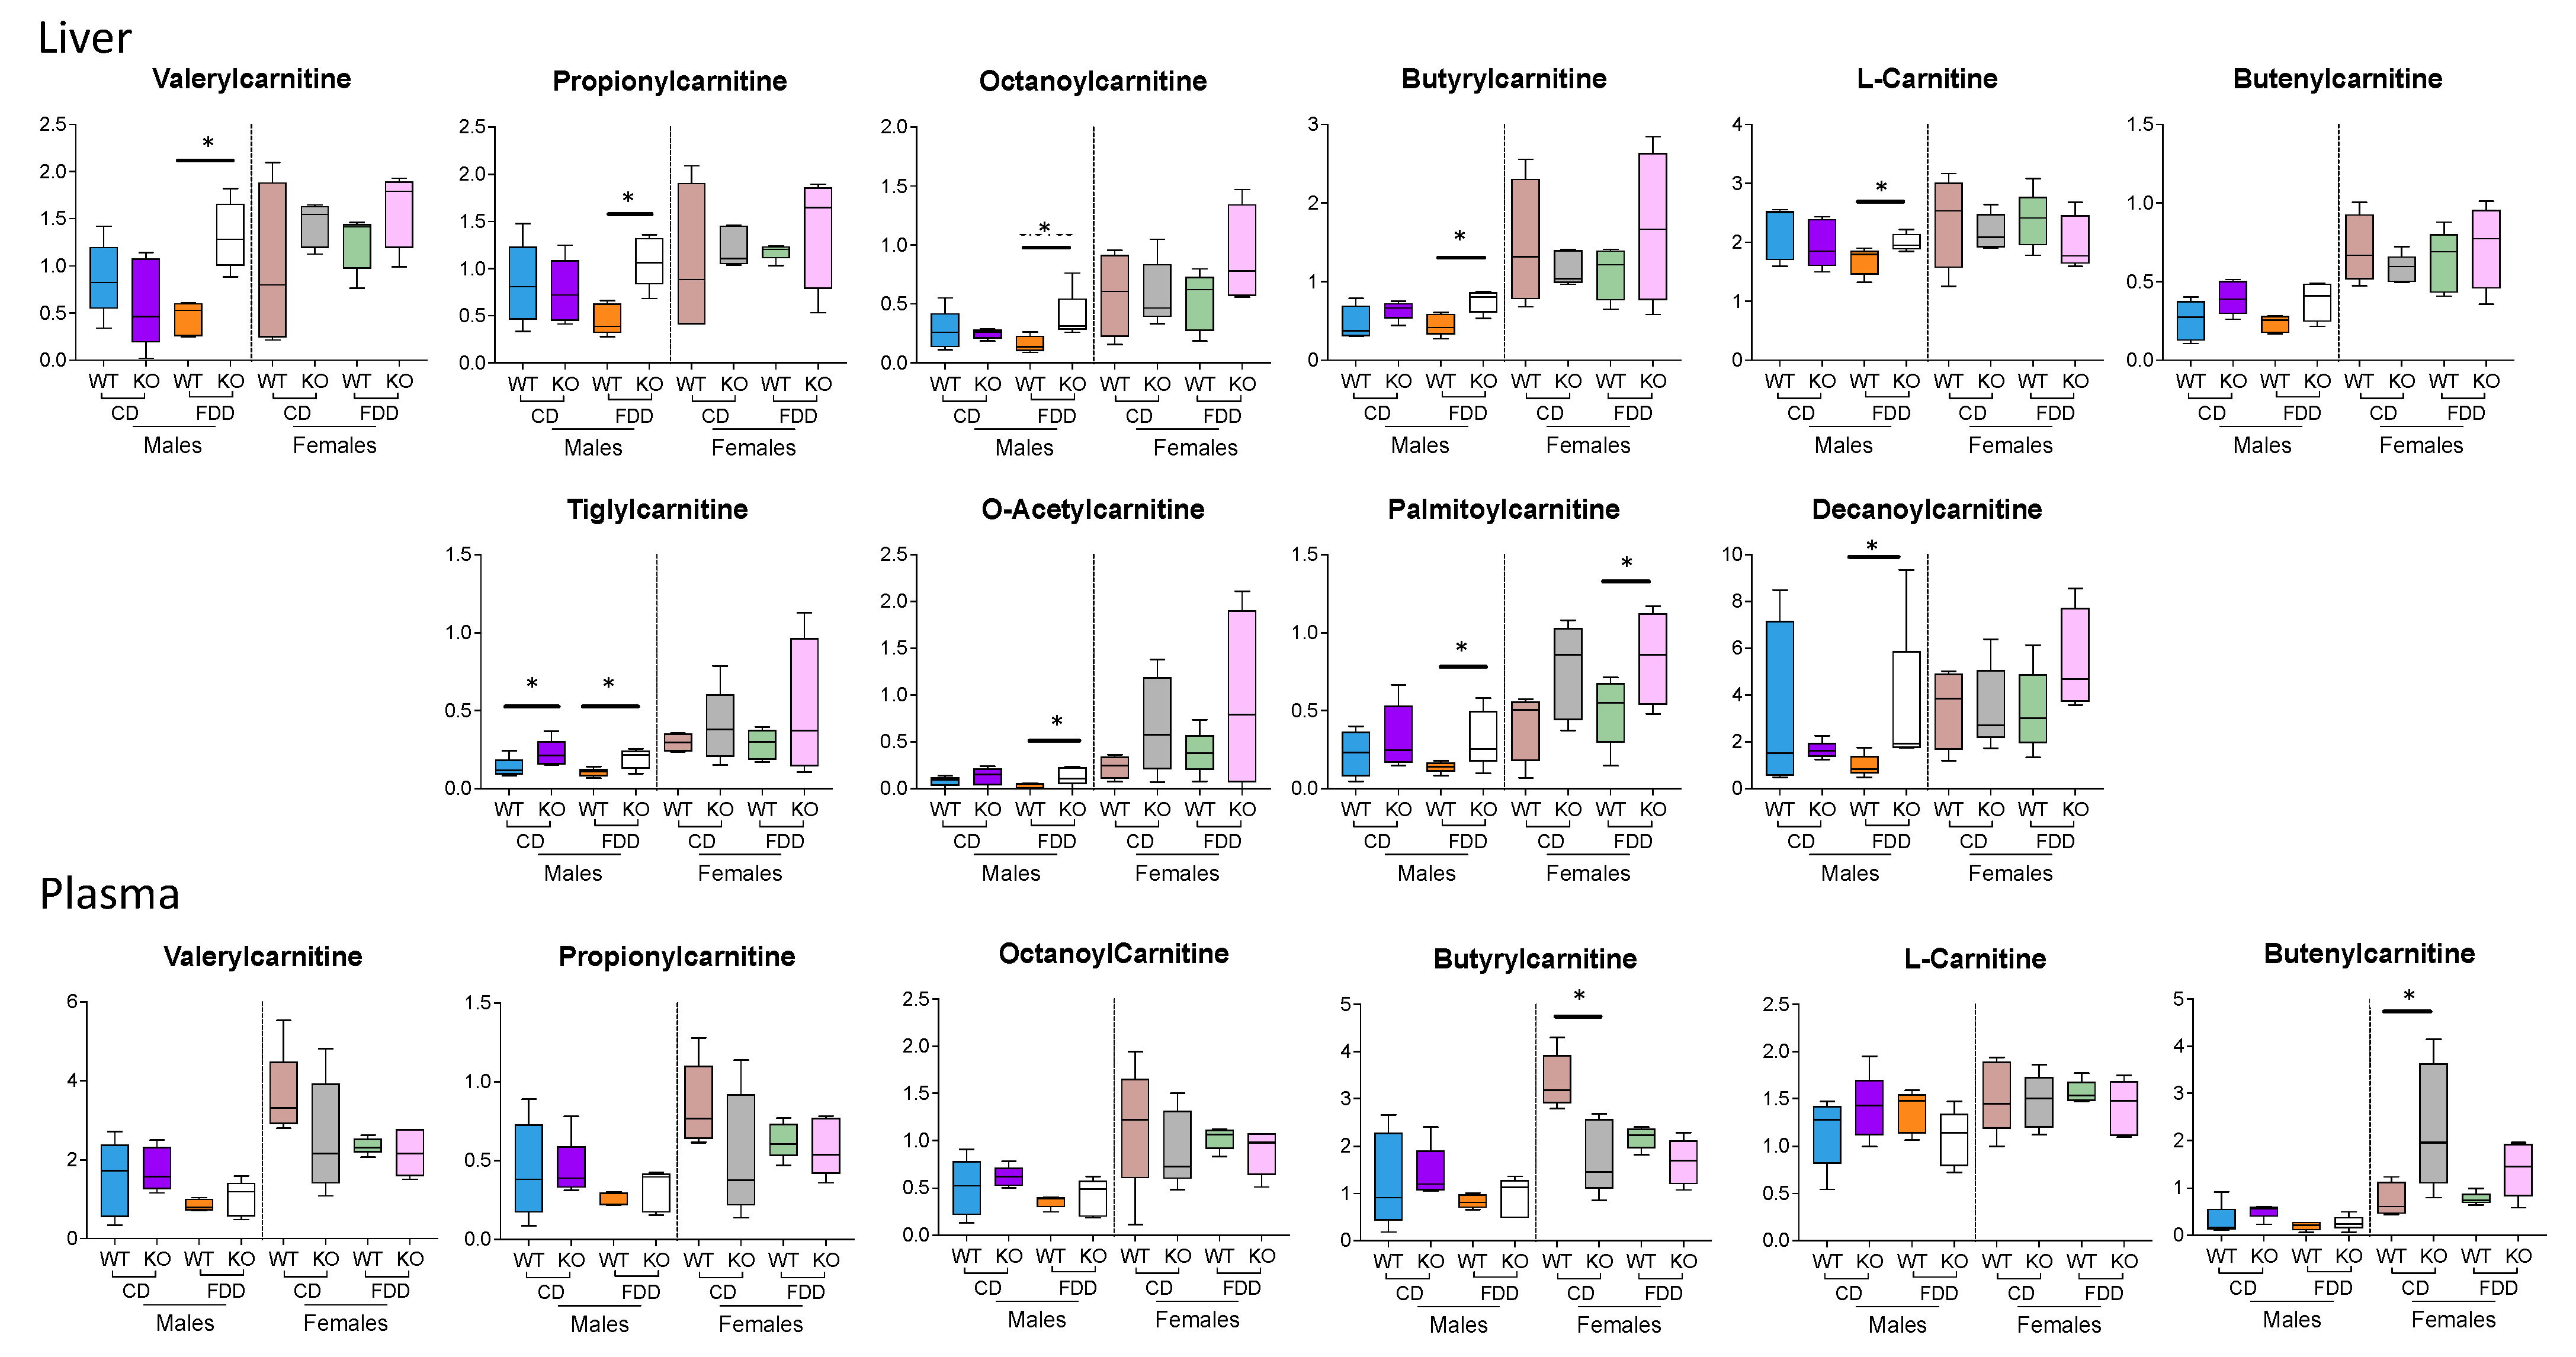
3.8. Acylcarnitines
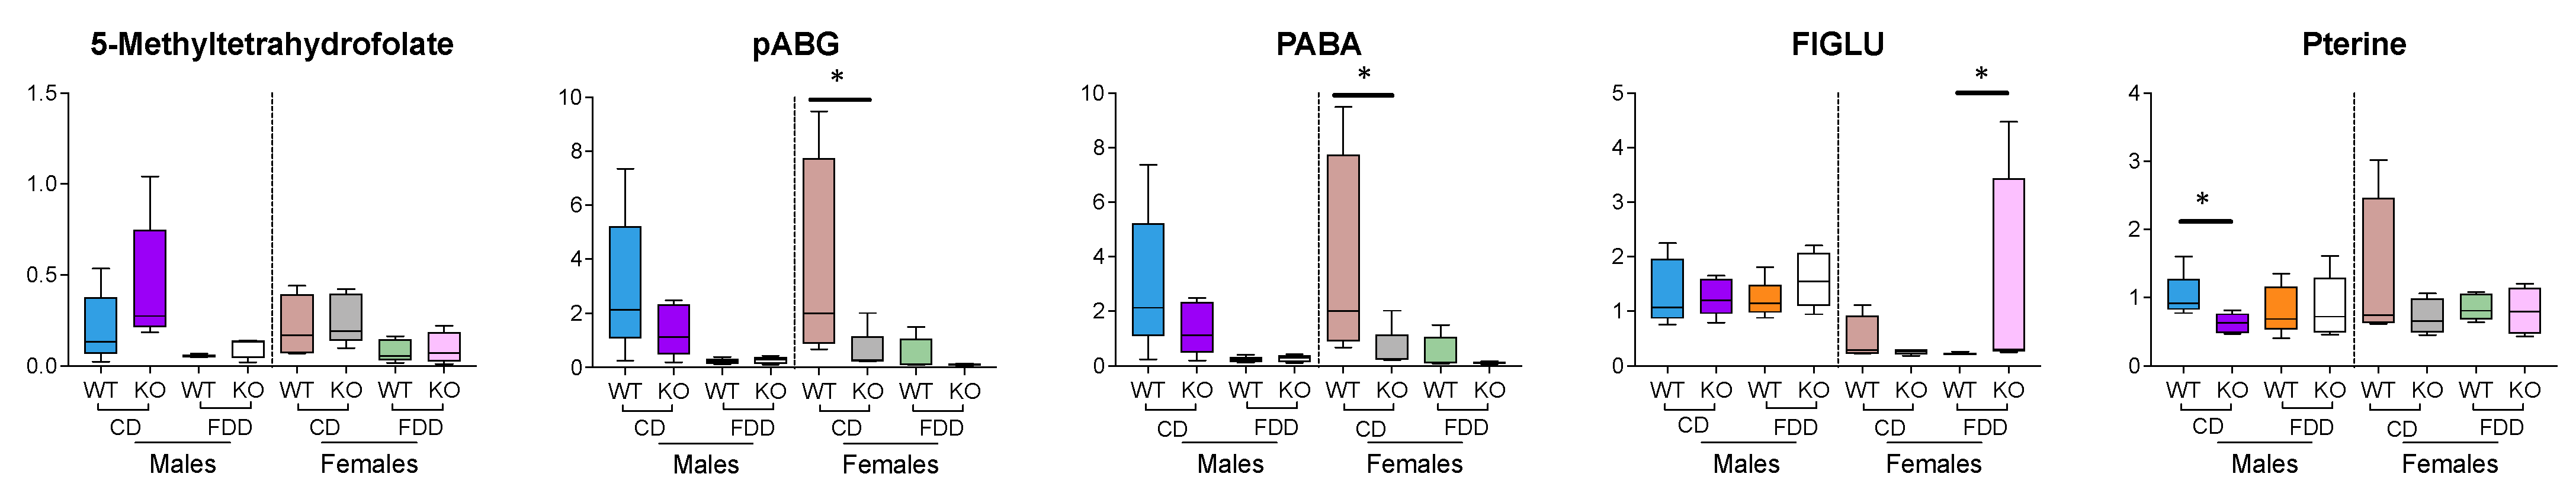
3.9. Folate-Related Metabolites
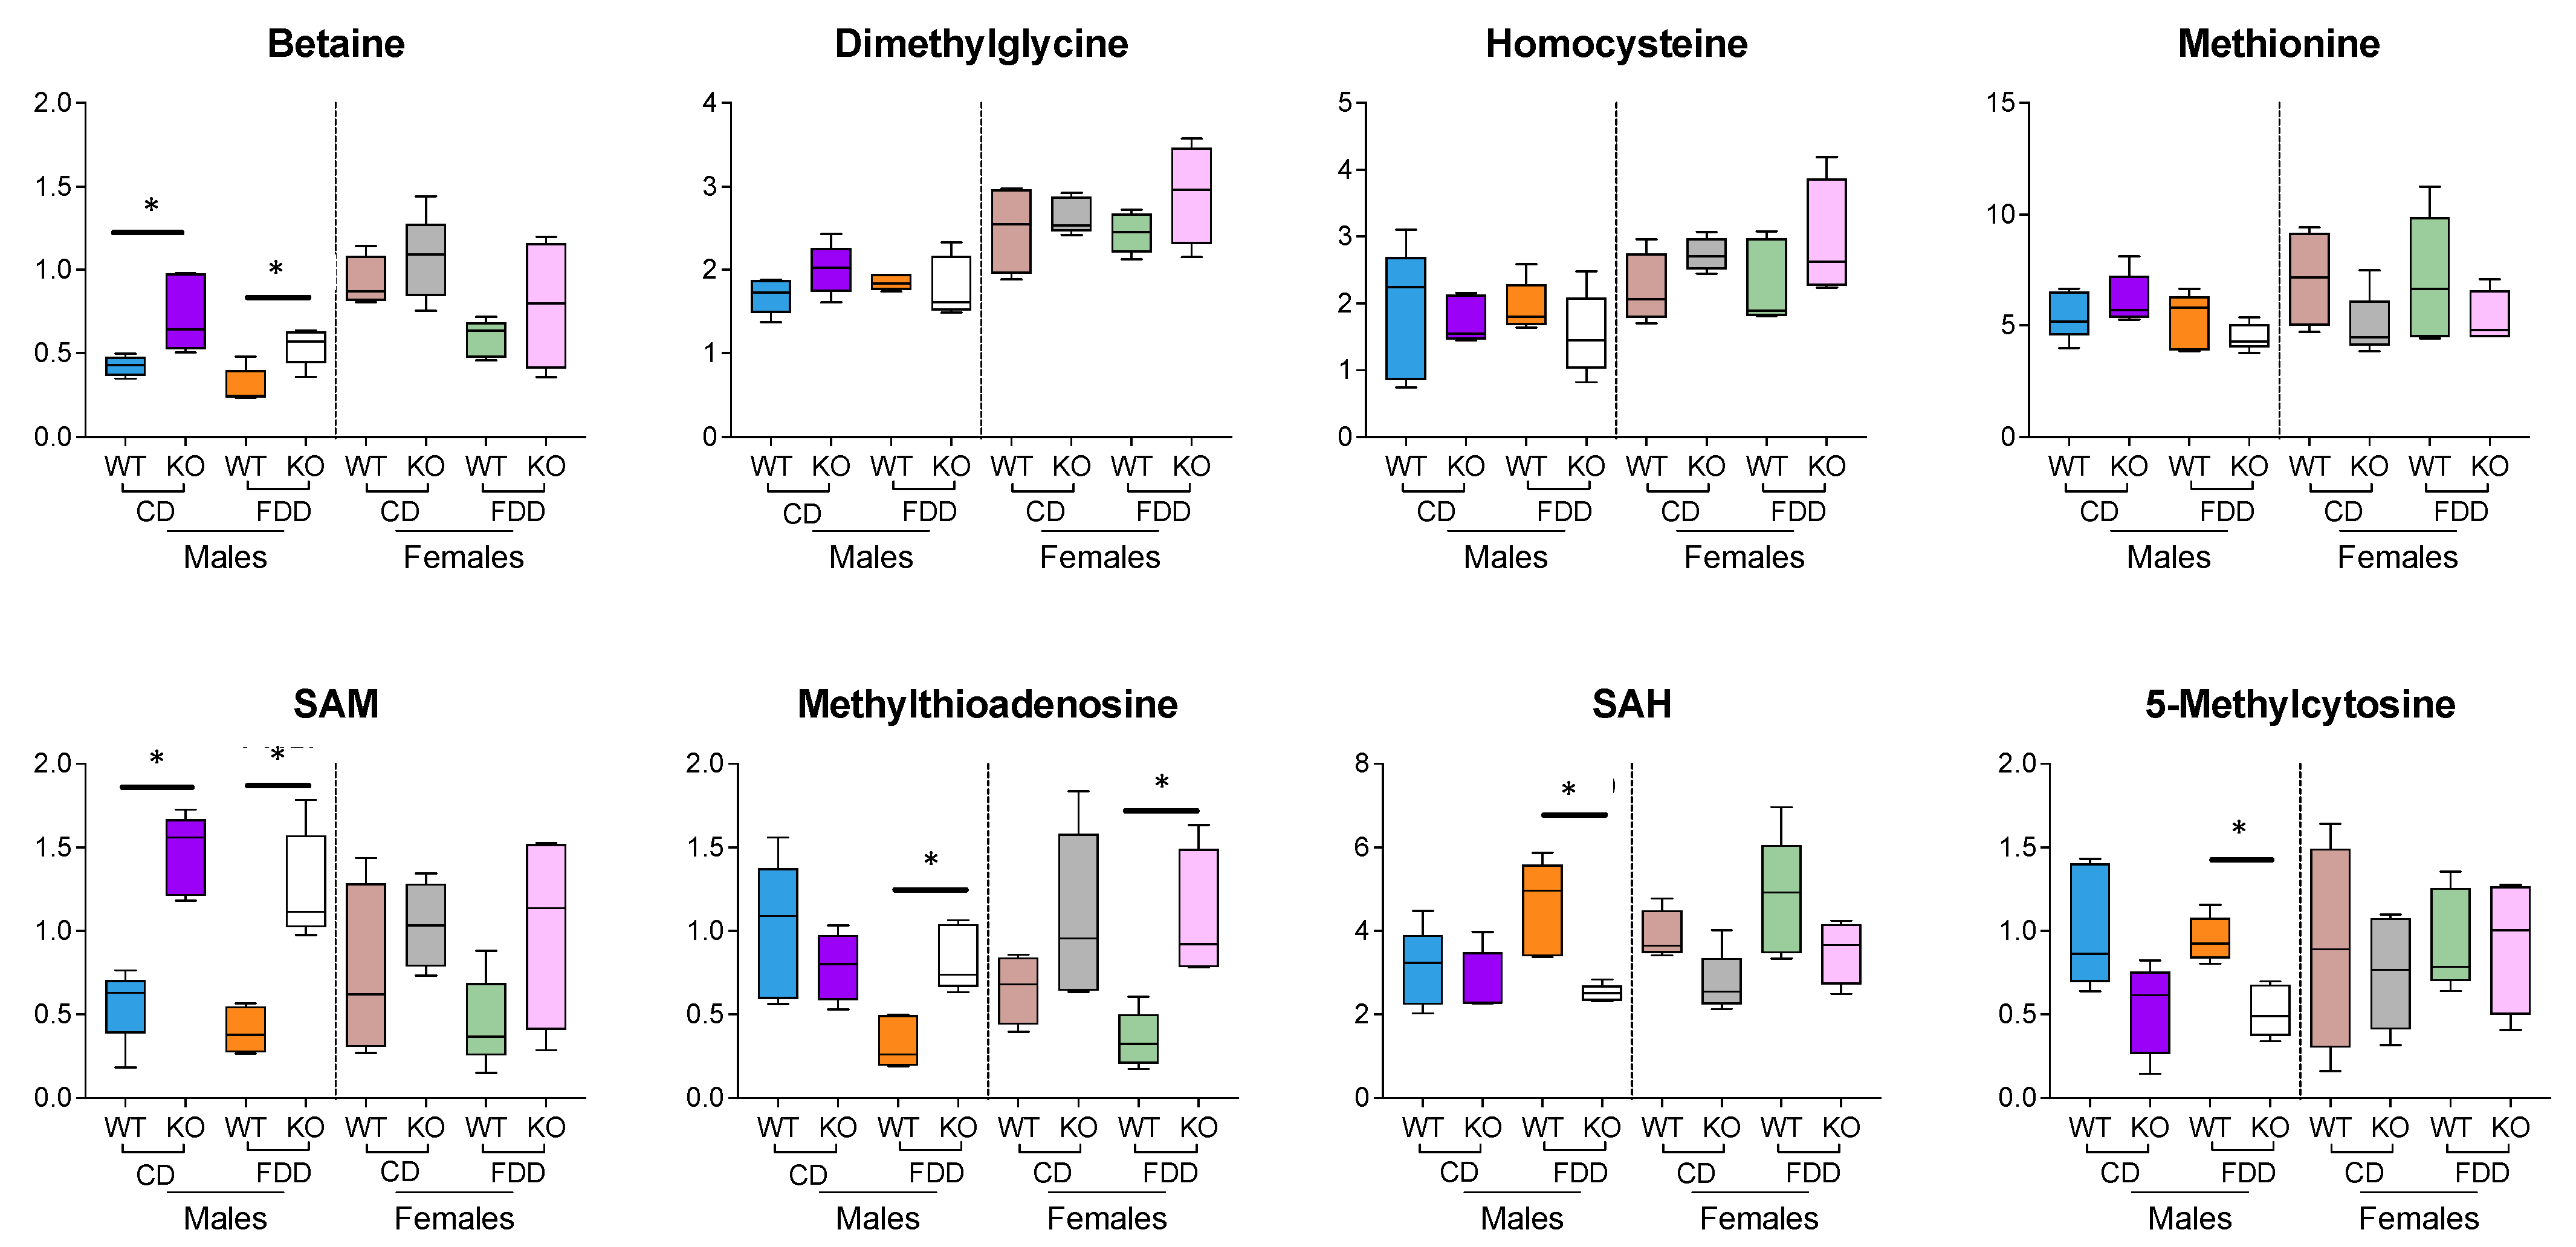
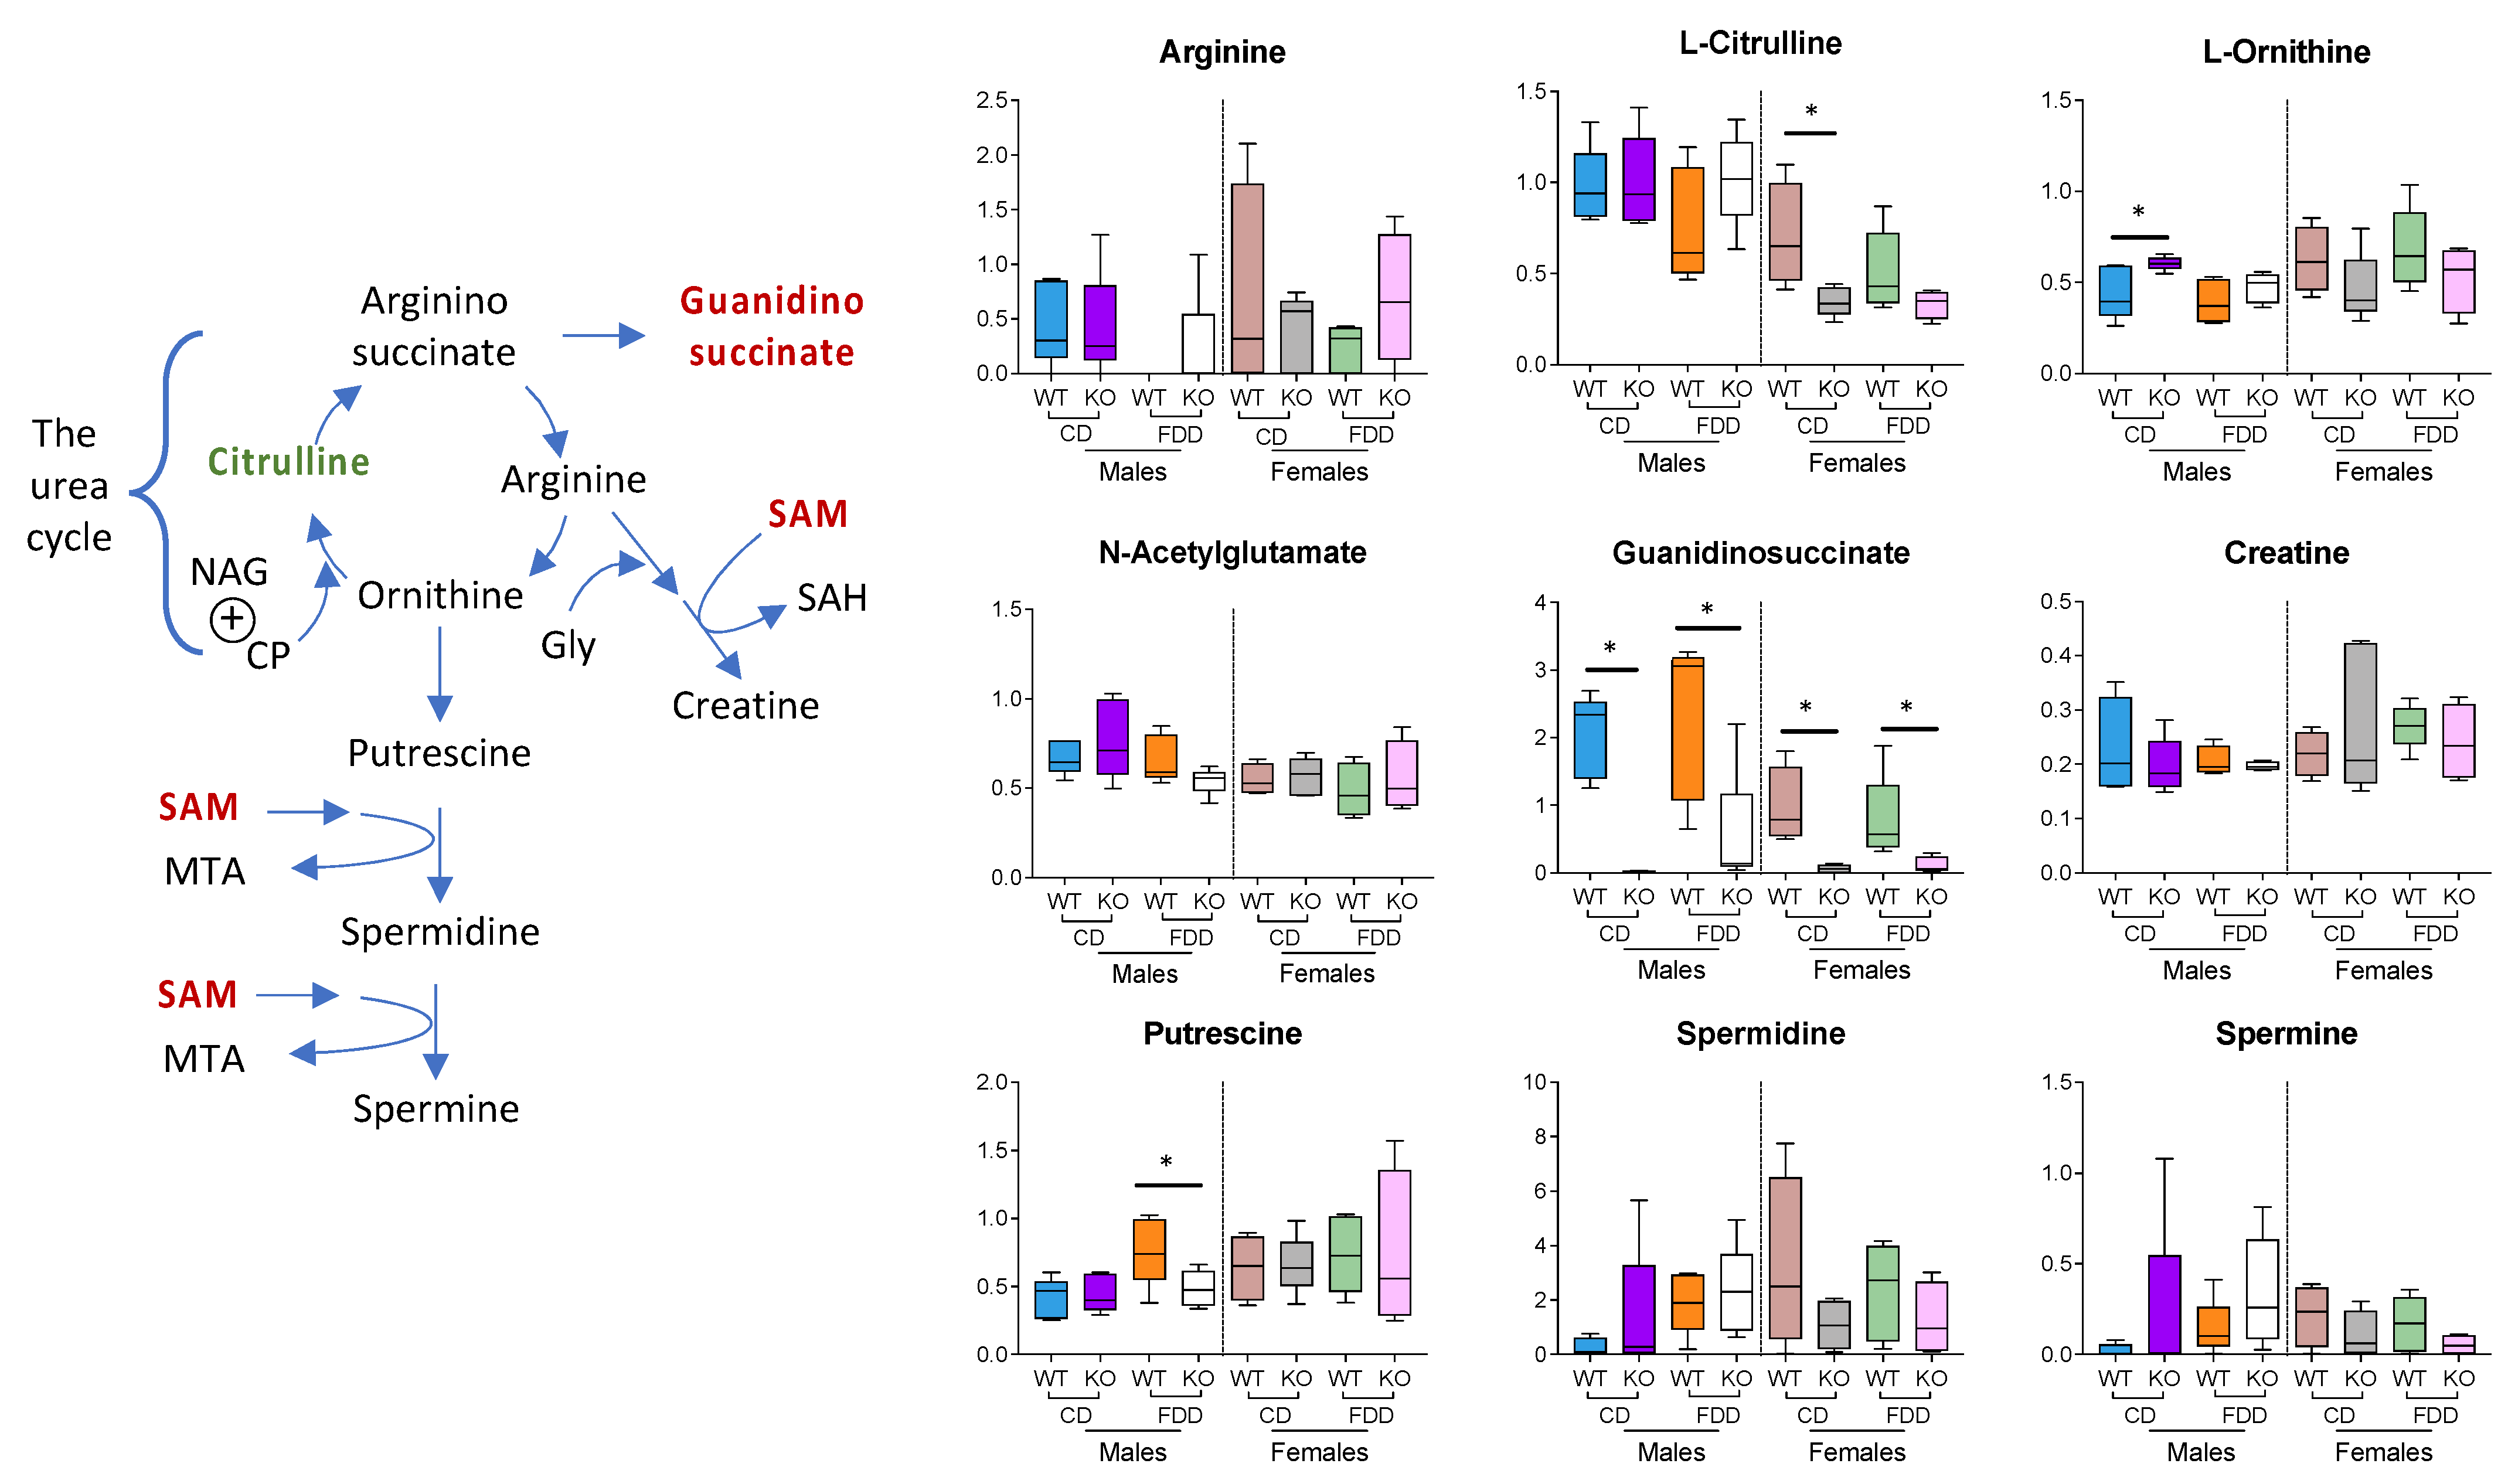
3.10. Methylation-Related Metabolites
4. Conclusions
Supplementary Materials
Author Contributions
Funding
Institutional Review Board Statement
Data Availability Statement
Conflicts of Interest
References
- Tibbetts, A.S.; Appling, D.R. Compartmentalization of Mammalian folate-mediated one-carbon metabolism. Annu. Rev. Nutr. 2010, 30, 57–81. [Google Scholar] [CrossRef] [PubMed]
- Ducker, G.S.; Rabinowitz, J.D. One-Carbon Metabolism in Health and Disease. Cell Metab. 2017, 25, 27–42. [Google Scholar] [CrossRef] [PubMed] [Green Version]
- Wagner, C. Biochemical role of folate in cellular metabolism. In Folate in Health and Disease; Bailey, L.B., Ed.; Marcel Dekker, Inc.: New York, NY, USA, 1995; pp. 23–42. [Google Scholar]
- Strickland, K.C.; Krupenko, N.I.; Krupenko, S.A. Molecular mechanisms underlying the potentially adverse effects of folate. Clin. Chem. Lab. Med. 2013, 51, 607–616. [Google Scholar] [CrossRef] [PubMed] [Green Version]
- Rock, C.L.; Lampe, J.W.; Patterson, R.E. Nutrition, genetics, and risks of cancer. Annu. Rev. Public Health 2000, 21, 47–64. [Google Scholar] [CrossRef] [PubMed]
- Fleming, A. The role of folate in the prevention of neural tube defects: Human and animal studies. Nutr. Rev. 2001, 59, S13–S20. [Google Scholar] [CrossRef] [PubMed]
- Moat, S.J.; Lang, D.; McDowell, I.F.; Clarke, Z.L.; Madhavan, A.K.; Lewis, M.J.; Goodfellow, J. Folate, homocysteine, endothelial function and cardiovascular disease. J. Nutr. Biochem. 2004, 15, 64–79. [Google Scholar] [CrossRef] [PubMed]
- Krupenko, S.A. FDH: An aldehyde dehydrogenase fusion enzyme in folate metabolism. Chem. Biol. Interact. 2009, 178, 84–93. [Google Scholar] [CrossRef] [Green Version]
- Krupenko, S.A.; Krupenko, N.I. Loss of ALDH1L1 folate enzyme confers a selective metabolic advantage for tumor progression. Chem. Biol. Interact. 2019, 302, 149–155. [Google Scholar] [CrossRef]
- Oleinik, N.V.; Krupenko, N.I.; Krupenko, S.A. Epigenetic silencing of ALDH1L1, a metabolic regulator of cellular proliferation, in cancers. Genes Cancer 2011, 2, 130–139. [Google Scholar] [CrossRef] [PubMed]
- Dmitriev, A.A.; Kashuba, V.I.; Haraldson, K.; Senchenko, V.N.; Pavlova, T.V.; Kudryavtseva, A.V.; Anedchenko, E.A.; Krasnov, G.S.; Pronina, I.V.; Loginov, V.I.; et al. Genetic and epigenetic analysis of non-small cell lung cancer with NotI-microarrays. Epigenetics 2012, 7, 502–513. [Google Scholar] [CrossRef] [Green Version]
- Dmitriev, A.A.; Rudenko, E.E.; Kudryavtseva, A.V.; Krasnov, G.S.; Gordiyuk, V.V.; Melnikova, N.V.; Stakhovsky, E.O.; Kononenko, O.A.; Pavlova, L.S.; Kondratieva, T.T.; et al. Epigenetic alterations of chromosome 3 revealed by NotI-microarrays in clear cell renal cell carcinoma. Biomed. Res. Int. 2014, 2014, 735292. [Google Scholar] [CrossRef] [PubMed]
- Senchenko, V.N.; Kisseljova, N.P.; Ivanova, T.A.; Dmitriev, A.A.; Krasnov, G.S.; Kudryavtseva, A.V.; Panasenko, G.V.; Tsitrin, E.B.; Lerman, M.I.; Kisseljov, F.L.; et al. Novel tumor suppressor candidates on chromosome 3 revealed by NotI-microarrays in cervical cancer. Epigenetics 2013, 8, 409–420. [Google Scholar] [CrossRef] [PubMed] [Green Version]
- Krupenko, S.A.; Oleinik, N.V. 10-formyltetrahydrofolate dehydrogenase, one of the major folate enzymes, is down-regulated in tumor tissues and possesses suppressor effects on cancer cells. Cell Growth Differ. 2002, 13, 227–236. [Google Scholar] [PubMed]
- Rodriguez, F.J.; Giannini, C.; Asmann, Y.W.; Sharma, M.K.; Perry, A.; Tibbetts, K.M.; Jenkins, R.B.; Scheithauer, B.W.; Anant, S.; Jenkins, S.; et al. Gene expression profiling of NF-1-associated and sporadic pilocytic astrocytoma identifies aldehyde dehydrogenase 1 family member L1 (ALDH1L1) as an underexpressed candidate biomarker in aggressive subtypes. J. Neuropathol. Exp. Neurol. 2008, 67, 1194–1204. [Google Scholar] [CrossRef] [PubMed] [Green Version]
- Chen, X.Q.; He, J.R.; Wang, H.Y. Decreased expression of ALDH1L1 is associated with a poor prognosis in hepatocellular carcinoma. Med. Oncol. 2012, 29, 1843–1849. [Google Scholar] [CrossRef]
- Hartomo, T.B.; Van Huyen Pham, T.; Yamamoto, N.; Hirase, S.; Hasegawa, D.; Kosaka, Y.; Matsuo, M.; Hayakawa, A.; Takeshima, Y.; Iijima, K.; et al. Involvement of aldehyde dehydrogenase 1A2 in the regulation of cancer stem cell properties in neuroblastoma. Int. J. Oncol. 2015, 46, 1089–1098. [Google Scholar] [CrossRef] [Green Version]
- Darby, I.A.; Vuillier-Devillers, K.; Pinault, E.; Sarrazy, V.; Lepreux, S.; Balabaud, C.; Bioulac-Sage, P.; Desmouliere, A. Proteomic analysis of differentially expressed proteins in peripheral cholangiocarcinoma. Cancer Microenviron. 2010, 4, 73–91. [Google Scholar] [CrossRef] [Green Version]
- Krupenko, N.I.; Sharma, J.; Fogle, H.M.; Pediaditakis, P.; Strickland, K.C.; Du, X.; Helke, K.L.; Sumner, S.; Krupenko, S.A. Knockout of Putative Tumor Suppressor Aldh1l1 in Mice Reprograms Metabolism to Accelerate Growth of Tumors in a Diethylnitrosamine (DEN) Model of Liver Carcinogenesis. Cancers 2021, 13, 3219. [Google Scholar] [CrossRef]
- Krupenko, N.I.; Sharma, J.; Pediaditakis, P.; Fekry, B.; Helke, K.L.; Du, X.; Sumner, S.; Krupenko, S.A. Cytosolic 10-formyltetrahydrofolate dehydrogenase regulates glycine metabolism in mouse liver. Sci. Rep. 2019, 9, 14937. [Google Scholar] [CrossRef] [Green Version]
- Alves, A.; Bassot, A.; Bulteau, A.L.; Pirola, L.; Morio, B. Glycine Metabolism and Its Alterations in Obesity and Metabolic Diseases. Nutrients 2019, 11, 1356. [Google Scholar] [CrossRef] [Green Version]
- Audano, M.; Maldini, M.; De Fabiani, E.; Mitro, N.; Caruso, D. Gender-related metabolomics and lipidomics: From experimental animal models to clinical evidence. J. Proteom. 2018, 178, 82–91. [Google Scholar] [CrossRef] [PubMed]
- Reusch, J.E.B.; Kumar, T.R.; Regensteiner, J.G.; Zeitler, P.S.; Conference, P. Identifying the Critical Gaps in Research on Sex Differences in Metabolism Across the Life Span. Endocrinology 2018, 159, 9–19. [Google Scholar] [CrossRef] [PubMed] [Green Version]
- Brennan, L.; Gibbons, H. Sex matters: A focus on the impact of biological sex on metabolomic profiles and dietary interventions. Proc. Nutr. Soc. 2020, 79, 205–209. [Google Scholar] [CrossRef]
- Krumsiek, J.; Mittelstrass, K.; Do, K.T.; Stuckler, F.; Ried, J.; Adamski, J.; Peters, A.; Illig, T.; Kronenberg, F.; Friedrich, N.; et al. Gender-specific pathway differences in the human serum metabolome. Metabolomics 2015, 11, 1815–1833. [Google Scholar] [CrossRef] [Green Version]
- Huang, M.C.; Douillet, C.; Su, M.; Zhou, K.; Wu, T.; Chen, W.; Galanko, J.A.; Drobna, Z.; Saunders, R.J.; Martin, E.; et al. Metabolomic profiles of arsenic (+3 oxidation state) methyltransferase knockout mice: Effect of sex and arsenic exposure. Arch. Toxicol. 2017, 91, 189–202. [Google Scholar] [CrossRef] [PubMed] [Green Version]
- Barron, K.; Ogretmen, B.; Krupenko, N. Ceramide synthase 6 mediates sex-specific metabolic response to dietary folic acid in mice. J. Nutr. Biochem. 2021, 98, 108832. [Google Scholar] [CrossRef] [PubMed]
- Barron, K.; Ogretmen, B.; Krupenko, N. Dietary Folic Acid Alters Metabolism of Multiple Vitamins in a CerS6- and Sex-Dependent Manner. Front. Nutr. 2021, 8, 758403. [Google Scholar] [CrossRef]
- Zukunft, S.; Prehn, C.; Rohring, C.; Moller, G.; Hrabe de Angelis, M.; Adamski, J.; Tokarz, J. High-throughput extraction and quantification method for targeted metabolomics in murine tissues. Metabolomics 2018, 14, 18. [Google Scholar] [CrossRef] [Green Version]
- Li, S.; Li, Y.; Rushing, B.R.; Harris, S.E.; McRitchie, S.L.; Jones, J.C.; Dominguez, D.; Sumner, S.J.; Dohlman, H.G. Multi-omics analysis of glucose-mediated signaling by a moonlighting Gbeta protein Asc1/RACK1. PLoS Genet. 2021, 17, e1009640. [Google Scholar] [CrossRef]
- Harville, E.W.; Li, Y.Y.; Pan, K.; McRitchie, S.; Pathmasiri, W.; Sumner, S. Untargeted analysis of first trimester serum to reveal biomarkers of pregnancy complications: A case-control discovery phase study. Sci. Rep. 2021, 11, 3468. [Google Scholar] [CrossRef]
- Valikangas, T.; Suomi, T.; Elo, L.L. A systematic evaluation of normalization methods in quantitative label-free proteomics. Brief. Bioinform. 2018, 19, 1–11. [Google Scholar] [CrossRef] [PubMed]
- Li, Y.Y.; Rushing, B.; Schroder, M.; Sumner, S.; Kay, C.D. Exploring the Contribution of (Poly)phenols to the Dietary Exposome Using High Resolution Mass Spectrometry Untargeted Metabolomics. Mol. Nutr. Food Res. 2022, e2100922. [Google Scholar] [CrossRef] [PubMed]
- Rushing, B.R.; McRitchie, S.; Arbeeva, L.; Nelson, A.E.; Azcarate-Peril, M.A.; Li, Y.Y.; Qian, Y.; Pathmasiri, W.; Sumner, S.C.J.; Loeser, R.F. Fecal metabolomics reveals products of dysregulated proteolysis and altered microbial metabolism in obesity-related osteoarthritis. Osteoarthr. Cartil. 2022, 30, 81–91. [Google Scholar] [CrossRef] [PubMed]
- Rushing, B.R.; Schroder, M.; Sumner, S.C.J. Comparison of Lysis and Detachment Sample Preparation Methods for Cultured Triple-Negative Breast Cancer Cells Using UHPLC-HRMS-Based Metabolomics. Metabolites 2022, 12, 168. [Google Scholar] [CrossRef]
- Li, S.; Li, Y.; Rushing, B.R.; Harris, S.E.; McRitchie, S.L.; Dominguez, D.; Sumner, S.J.; Dohlman, H.G. Multi-Omics Analysis of Multiple Glucose-Sensing Receptor Systems in Yeast. Biomolecules 2022, 12, 175. [Google Scholar] [CrossRef]
- Li, Y.Y.; Ghanbari, R.; Pathmasiri, W.; McRitchie, S.; Poustchi, H.; Shayanrad, A.; Roshandel, G.; Etemadi, A.; Pollock, J.D.; Malekzadeh, R.; et al. Untargeted Metabolomics: Biochemical Perturbations in Golestan Cohort Study Opium Users Inform Intervention Strategies. Front. Nutr. 2020, 7, 584585. [Google Scholar] [CrossRef]
- Huang, M.C.; Douillet, C.; Dover, E.N.; Zhang, C.; Beck, R.; Tejan-Sie, A.; Krupenko, S.A.; Styblo, M. Metabolic Phenotype of Wild-Type and As3mt-Knockout C57BL/6J Mice Exposed to Inorganic Arsenic: The Role of Dietary Fat and Folate Intake. Environ. Health Perspect 2018, 126, 127003. [Google Scholar] [CrossRef] [Green Version]
- Dearden, L.; Bouret, S.G.; Ozanne, S.E. Sex and gender differences in developmental programming of metabolism. Mol. Metab. 2018, 15, 8–19. [Google Scholar] [CrossRef]
- Sadre-Marandi, F.; Dahdoul, T.; Reed, M.C.; Nijhout, H.F. Sex differences in hepatic one-carbon metabolism. BMC Syst. Biol. 2018, 12, 89. [Google Scholar] [CrossRef] [Green Version]
- Henry, C.J.; Nemkov, T.; Casas-Selves, M.; Bilousova, G.; Zaberezhnyy, V.; Higa, K.C.; Serkova, N.J.; Hansen, K.C.; D’Alessandro, A.; DeGregori, J. Folate dietary insufficiency and folic acid supplementation similarly impair metabolism and compromise hematopoiesis. Haematologica 2017, 102, 1985–1994. [Google Scholar] [CrossRef] [Green Version]
- Krupenko, S.A.; Horita, D.A. The Role of Single-Nucleotide Polymorphisms in the Function of Candidate Tumor Suppressor ALDH1L1. Front. Genet. 2019, 10, 1013. [Google Scholar] [CrossRef]
- Schmitz, J.C.; Grindey, G.B.; Schultz, R.M.; Priest, D.G. Impact of dietary folic acid on reduced folates in mouse plasma and tissues. Relationship to dideazatetrahydrofolate sensitivity. Biochem. Pharmacol. 1994, 48, 319–325. [Google Scholar] [CrossRef]
- Oleinik, N.V.; Helke, K.L.; Kistner-Griffin, E.; Krupenko, N.I.; Krupenko, S.A. Rho GTPases RhoA and Rac1 mediate effects of dietary folate on metastatic potential of A549 cancer cells through the control of cofilin phosphorylation. J. Biol. Chem. 2014, 289, 26383–26394. [Google Scholar] [CrossRef] [PubMed] [Green Version]
- Burgoon, J.M.; Selhub, J.; Nadeau, M.; Sadler, T.W. Investigation of the effects of folate deficiency on embryonic development through the establishment of a folate deficient mouse model. Teratology 2002, 65, 219–227. [Google Scholar] [CrossRef] [PubMed]
- Broadhurst, D.; Goodacre, R.; Reinke, S.N.; Kuligowski, J.; Wilson, I.D.; Lewis, M.R.; Dunn, W.B. Guidelines and considerations for the use of system suitability and quality control samples in mass spectrometry assays applied in untargeted clinical metabolomic studies. Metabolomics 2018, 14, 72. [Google Scholar] [CrossRef] [Green Version]
- Triba, M.N.; Le Moyec, L.; Amathieu, R.; Goossens, C.; Bouchemal, N.; Nahon, P.; Rutledge, D.N.; Savarin, P. PLS/OPLS models in metabolomics: The impact of permutation of dataset rows on the K-fold cross-validation quality parameters. Mol. Biosyst. 2015, 11, 13–19. [Google Scholar] [CrossRef]
- Ruoppolo, M.; Caterino, M.; Albano, L.; Pecce, R.; Di Girolamo, M.G.; Crisci, D.; Costanzo, M.; Milella, L.; Franconi, F.; Campesi, I. Targeted metabolomic profiling in rat tissues reveals sex differences. Sci. Rep. 2018, 8, 4663. [Google Scholar] [CrossRef]
- Barba, I.; Andres, M.; Picon, I.; Aguade-Bruix, S.; Garcia-Dorado, D. Sex differences in the (1)H NMR metabolic profile of serum in cardiovascular risk patients. Sci. Rep. 2019, 9, 2380. [Google Scholar] [CrossRef] [Green Version]
- Lonardo, A.; Nascimbeni, F.; Ballestri, S.; Fairweather, D.; Win, S.; Than, T.A.; Abdelmalek, M.F.; Suzuki, A. Sex Differences in Nonalcoholic Fatty Liver Disease: State of the Art and Identification of Research Gaps. Hepatology 2019, 70, 1457–1469. [Google Scholar] [CrossRef]
- Hirschel, J.; Vogel, M.; Baber, R.; Garten, A.; Beuchel, C.; Dietz, Y.; Dittrich, J.; Korner, A.; Kiess, W.; Ceglarek, U. Relation of Whole Blood Amino Acid and Acylcarnitine Metabolome to Age, Sex, BMI, Puberty, and Metabolic Markers in Children and Adolescents. Metabolites 2020, 10, 149. [Google Scholar] [CrossRef] [Green Version]
- Perng, W.; Francis, E.C.; Smith, H.A.; Carey, J.; Wang, D.; Kechris, K.M.; Dabelea, D. Sex-Specific Metabolite Biomarkers of NAFLD in Youth: A Prospective Study in the EPOCH Cohort. J. Clin. Endocrinol. Metab. 2020, 105, e3437–e3450. [Google Scholar] [CrossRef] [PubMed]
- Pooya, S.; Blaise, S.; Moreno Garcia, M.; Giudicelli, J.; Alberto, J.M.; Gueant-Rodriguez, R.M.; Jeannesson, E.; Gueguen, N.; Bressenot, A.; Nicolas, B.; et al. Methyl donor deficiency impairs fatty acid oxidation through PGC-1alpha hypomethylation and decreased ER-alpha, ERR-alpha, and HNF-4alpha in the rat liver. J. Hepatol. 2012, 57, 344–351. [Google Scholar] [CrossRef] [PubMed] [Green Version]
- Da Silva, R.P.; Kelly, K.B.; Al Rajabi, A.; Jacobs, R.L. Novel insights on interactions between folate and lipid metabolism. Biofactors 2014, 40, 277–283. [Google Scholar] [CrossRef] [PubMed] [Green Version]
- Suh, J.R.; Herbig, A.K.; Stover, P.J. New perspectives on folate catabolism. Annu. Rev. Nutr. 2001, 21, 255–282. [Google Scholar] [CrossRef]
- Green, J.M.; Hollandsworth, R.; Pitstick, L.; Carter, E.L. Purification and characterization of the folate catabolic enzyme p-aminobenzoyl-glutamate hydrolase from Escherichia coli. J. Bacteriol. 2010, 192, 2407–2413. [Google Scholar] [CrossRef] [Green Version]
- Bozzo, G.G.; Basset, G.J.; Naponelli, V.; Noiriel, A.; Gregory, J.F., 3rd; Hanson, A.D. Characterization of the folate salvage enzyme p-aminobenzoylglutamate hydrolase in plants. Phytochemistry 2008, 69, 29–37. [Google Scholar] [CrossRef] [Green Version]
- Chippel, D.; Scrimgeour, K.G. Oxidative degradation of dihydrofolate and tetrahydrofolate. Can. J. Biochem. 1970, 48, 999–1009. [Google Scholar] [CrossRef]
- Michalak, E.M.; Burr, M.L.; Bannister, A.J.; Dawson, M.A. The roles of DNA, RNA and histone methylation in ageing and cancer. Nat. Rev. Mol. Cell. Biol. 2019, 20, 573–589. [Google Scholar] [CrossRef]
- Sanchez-Jimenez, F.; Medina, M.A.; Villalobos-Rueda, L.; Urdiales, J.L. Polyamines in mammalian pathophysiology. Cell. Mol. Life Sci. 2019, 76, 3987–4008. [Google Scholar] [CrossRef]
- Brosnan, J.T.; da Silva, R.P.; Brosnan, M.E. The metabolic burden of creatine synthesis. Amino. Acids 2011, 40, 1325–1331. [Google Scholar] [CrossRef]
- Fujioka, M. Mammalian small molecule methyltransferases: Their structural and functional features. Int. J. Biochem. 1992, 24, 1917–1924. [Google Scholar] [CrossRef]
- Anguera, M.C.; Field, M.S.; Perry, C.; Ghandour, H.; Chiang, E.P.; Selhub, J.; Shane, B.; Stover, P.J. Regulation of Folate-mediated One-carbon Metabolism by 10-Formyltetrahydrofolate Dehydrogenase. J. Biol. Chem. 2006, 281, 18335–18342. [Google Scholar] [CrossRef] [PubMed] [Green Version]
- Cohen, B.D. Methyl group deficiency and guanidino production in uremia. Mol. Cell Biochem. 2003, 244, 31–36. [Google Scholar] [CrossRef] [PubMed]


| Liver | ||||
| Groups | R2X | R2Y | Q2 | |
| Males | ||||
| WT-CD vs. FD | 0.721 | 1 | 0.749 | |
| KO-CD vs. FD | 0.783 | 1 | 0.755 | |
| FDD-WT vs. KO | 0.814 | 1 | 0.551 | |
| CD-WT vs. KO | 0.777 | 1 | 0.841 | |
| Females | ||||
| WT-CD vs. FD | 0.853 | 1 | 0.547 | |
| KO-CD vs. FD | 0.855 | 1 | 0.81 | |
| FDD-WT vs. KO | 0.833 | 1 | 0.748 | |
| CD-WT vs. KO | 0.864 | 1 | 0.614 | |
| Plasma | ||||
| Groups | R2X | R2Y | Q2 | |
| Males | ||||
| WT-CD vs. FD | 0.882 | 1 | 0.924 | |
| KO-CD vs. FD | 0.914 | 1 | 0.506 | |
| FDD-WT vs. KO | 0.883 | 1 | 0.689 | |
| CD-WT vs. KO | 0.853 | 1 | 0.624 | |
| Females | ||||
| WT-CD vs. FD | 0.814 | 1 | 0.762 | |
| KO-CD vs. FD | 0.319 | 0.914 | 0.384 | |
| FDD-WT vs. KO | 0.689 | 1 | 0.78 | |
| CD-WT vs. KO | 0.898 | 1 | 0.834 | |
Publisher’s Note: MDPI stays neutral with regard to jurisdictional claims in published maps and institutional affiliations. |
© 2022 by the authors. Licensee MDPI, Basel, Switzerland. This article is an open access article distributed under the terms and conditions of the Creative Commons Attribution (CC BY) license (https://creativecommons.org/licenses/by/4.0/).
Share and Cite
Sharma, J.; Rushing, B.R.; Hall, M.S.; Helke, K.L.; McRitchie, S.L.; Krupenko, N.I.; Sumner, S.J.; Krupenko, S.A. Sex-Specific Metabolic Effects of Dietary Folate Withdrawal in Wild-Type and Aldh1l1 Knockout Mice. Metabolites 2022, 12, 454. https://doi.org/10.3390/metabo12050454
Sharma J, Rushing BR, Hall MS, Helke KL, McRitchie SL, Krupenko NI, Sumner SJ, Krupenko SA. Sex-Specific Metabolic Effects of Dietary Folate Withdrawal in Wild-Type and Aldh1l1 Knockout Mice. Metabolites. 2022; 12(5):454. https://doi.org/10.3390/metabo12050454
Chicago/Turabian StyleSharma, Jaspreet, Blake R. Rushing, Madeline S. Hall, Kristi L. Helke, Susan L. McRitchie, Natalia I. Krupenko, Susan J. Sumner, and Sergey A. Krupenko. 2022. "Sex-Specific Metabolic Effects of Dietary Folate Withdrawal in Wild-Type and Aldh1l1 Knockout Mice" Metabolites 12, no. 5: 454. https://doi.org/10.3390/metabo12050454