
A Comparison of Solvent-Based Extraction Methods to Assess the Central Carbon Metabolites in Mouse Bone and Muscle

 , , and
Abstract
:
1. Introduction
2. Results
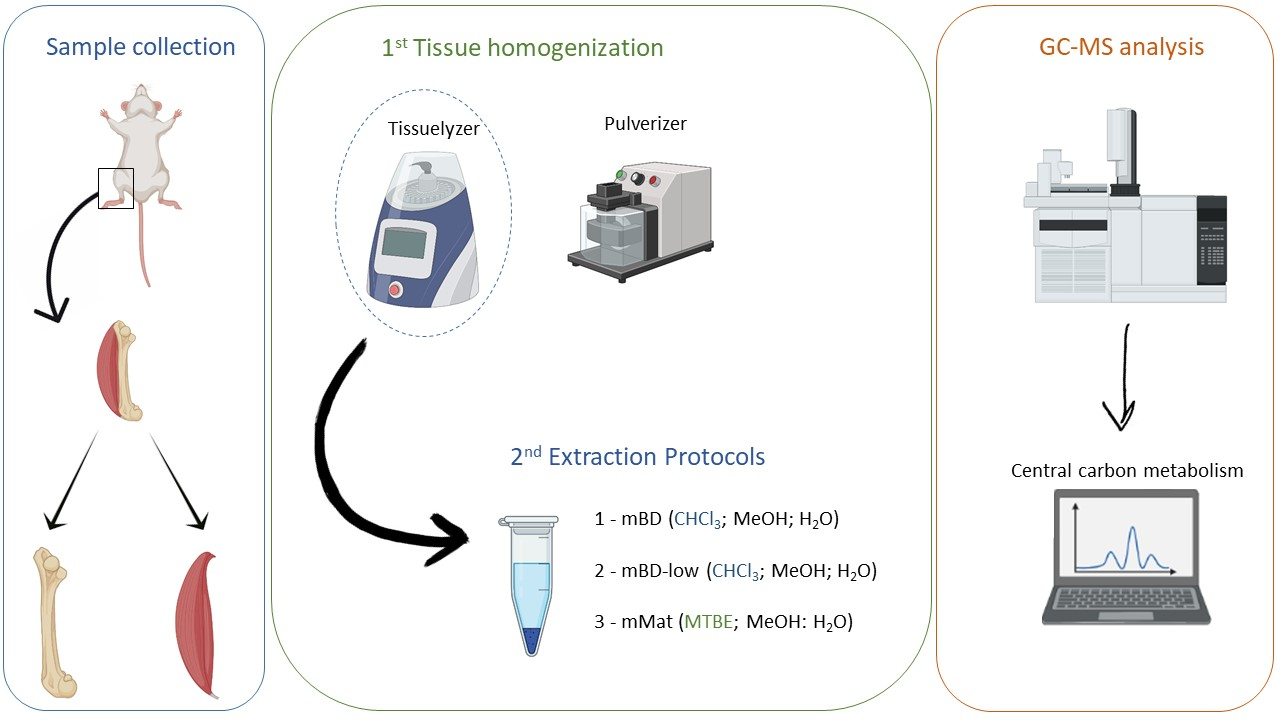
2.1. Tissue Homogenization: Tissuelyzer vs. Pulverizer
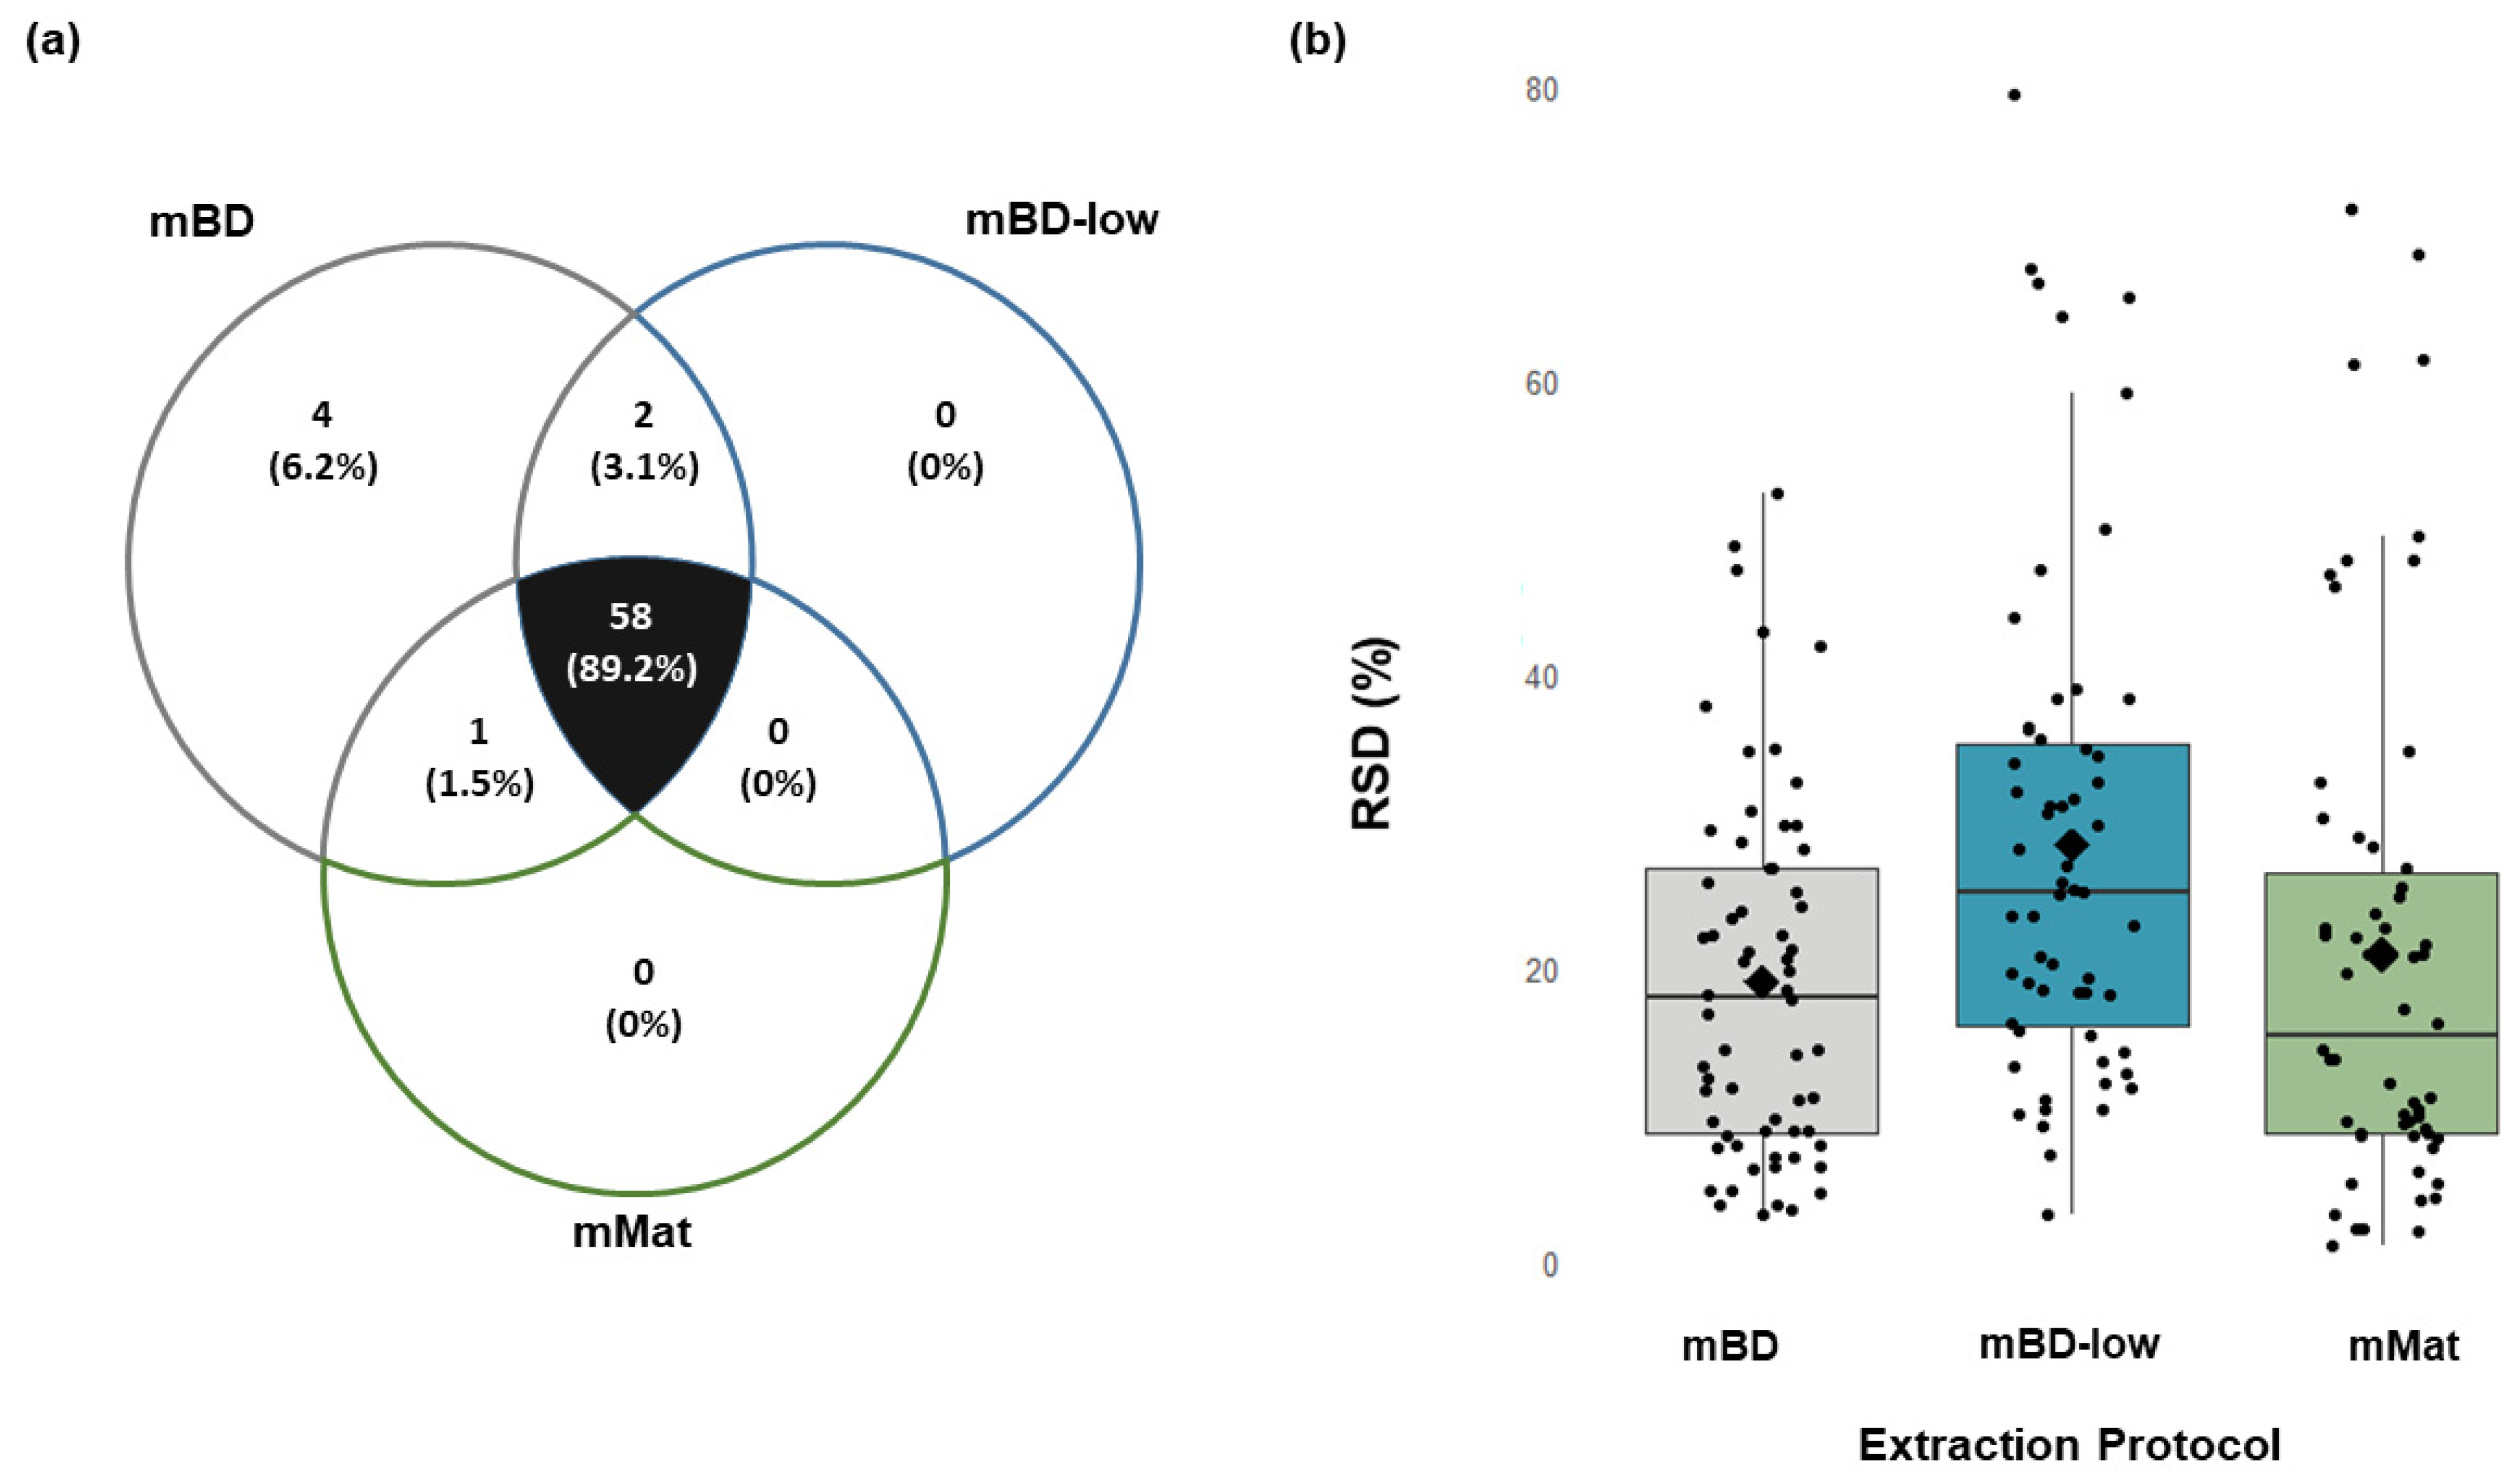
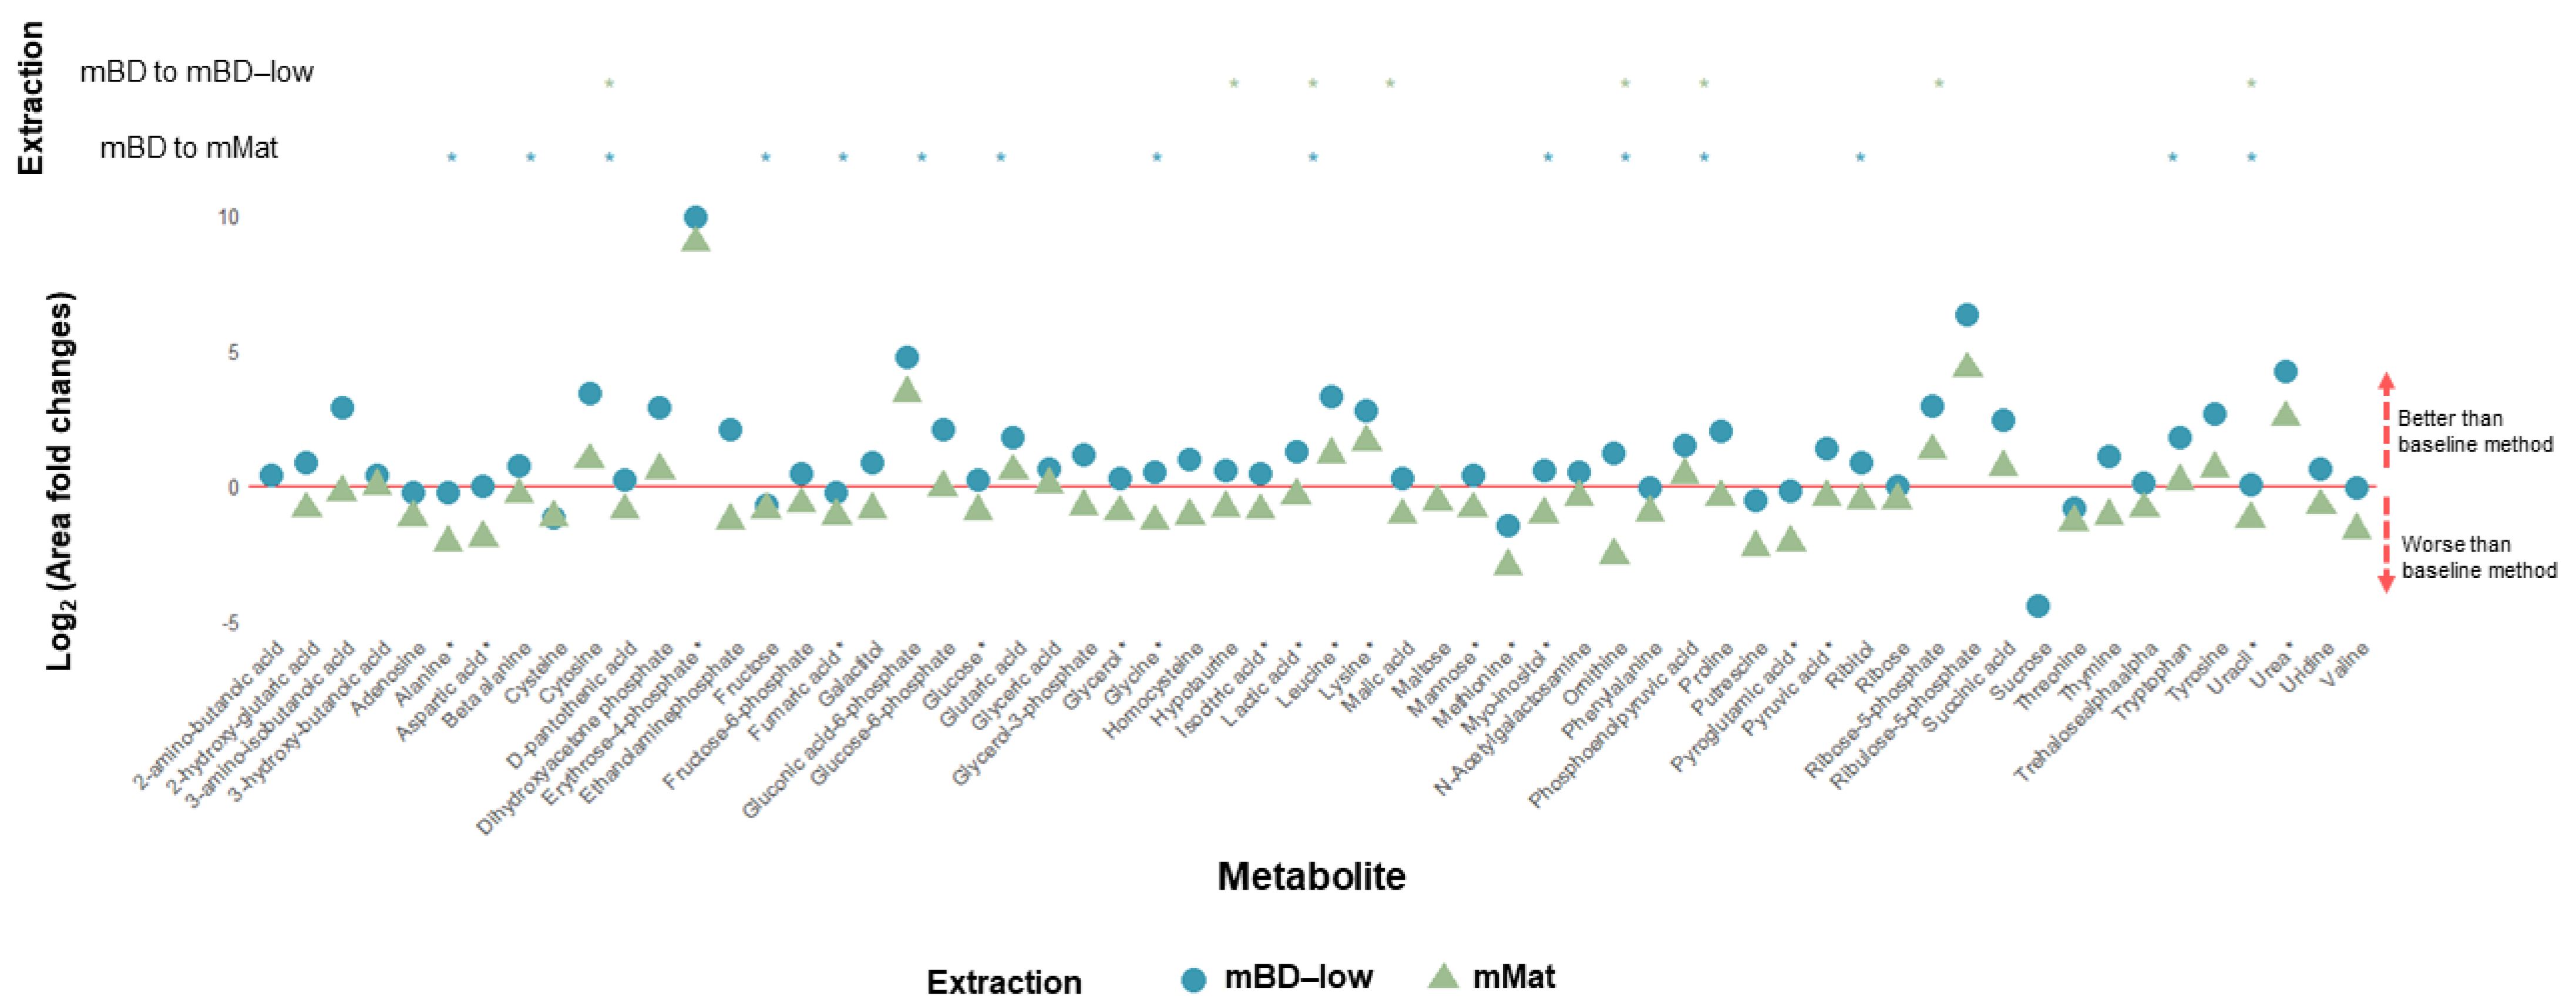
2.2. Bone (Mice)
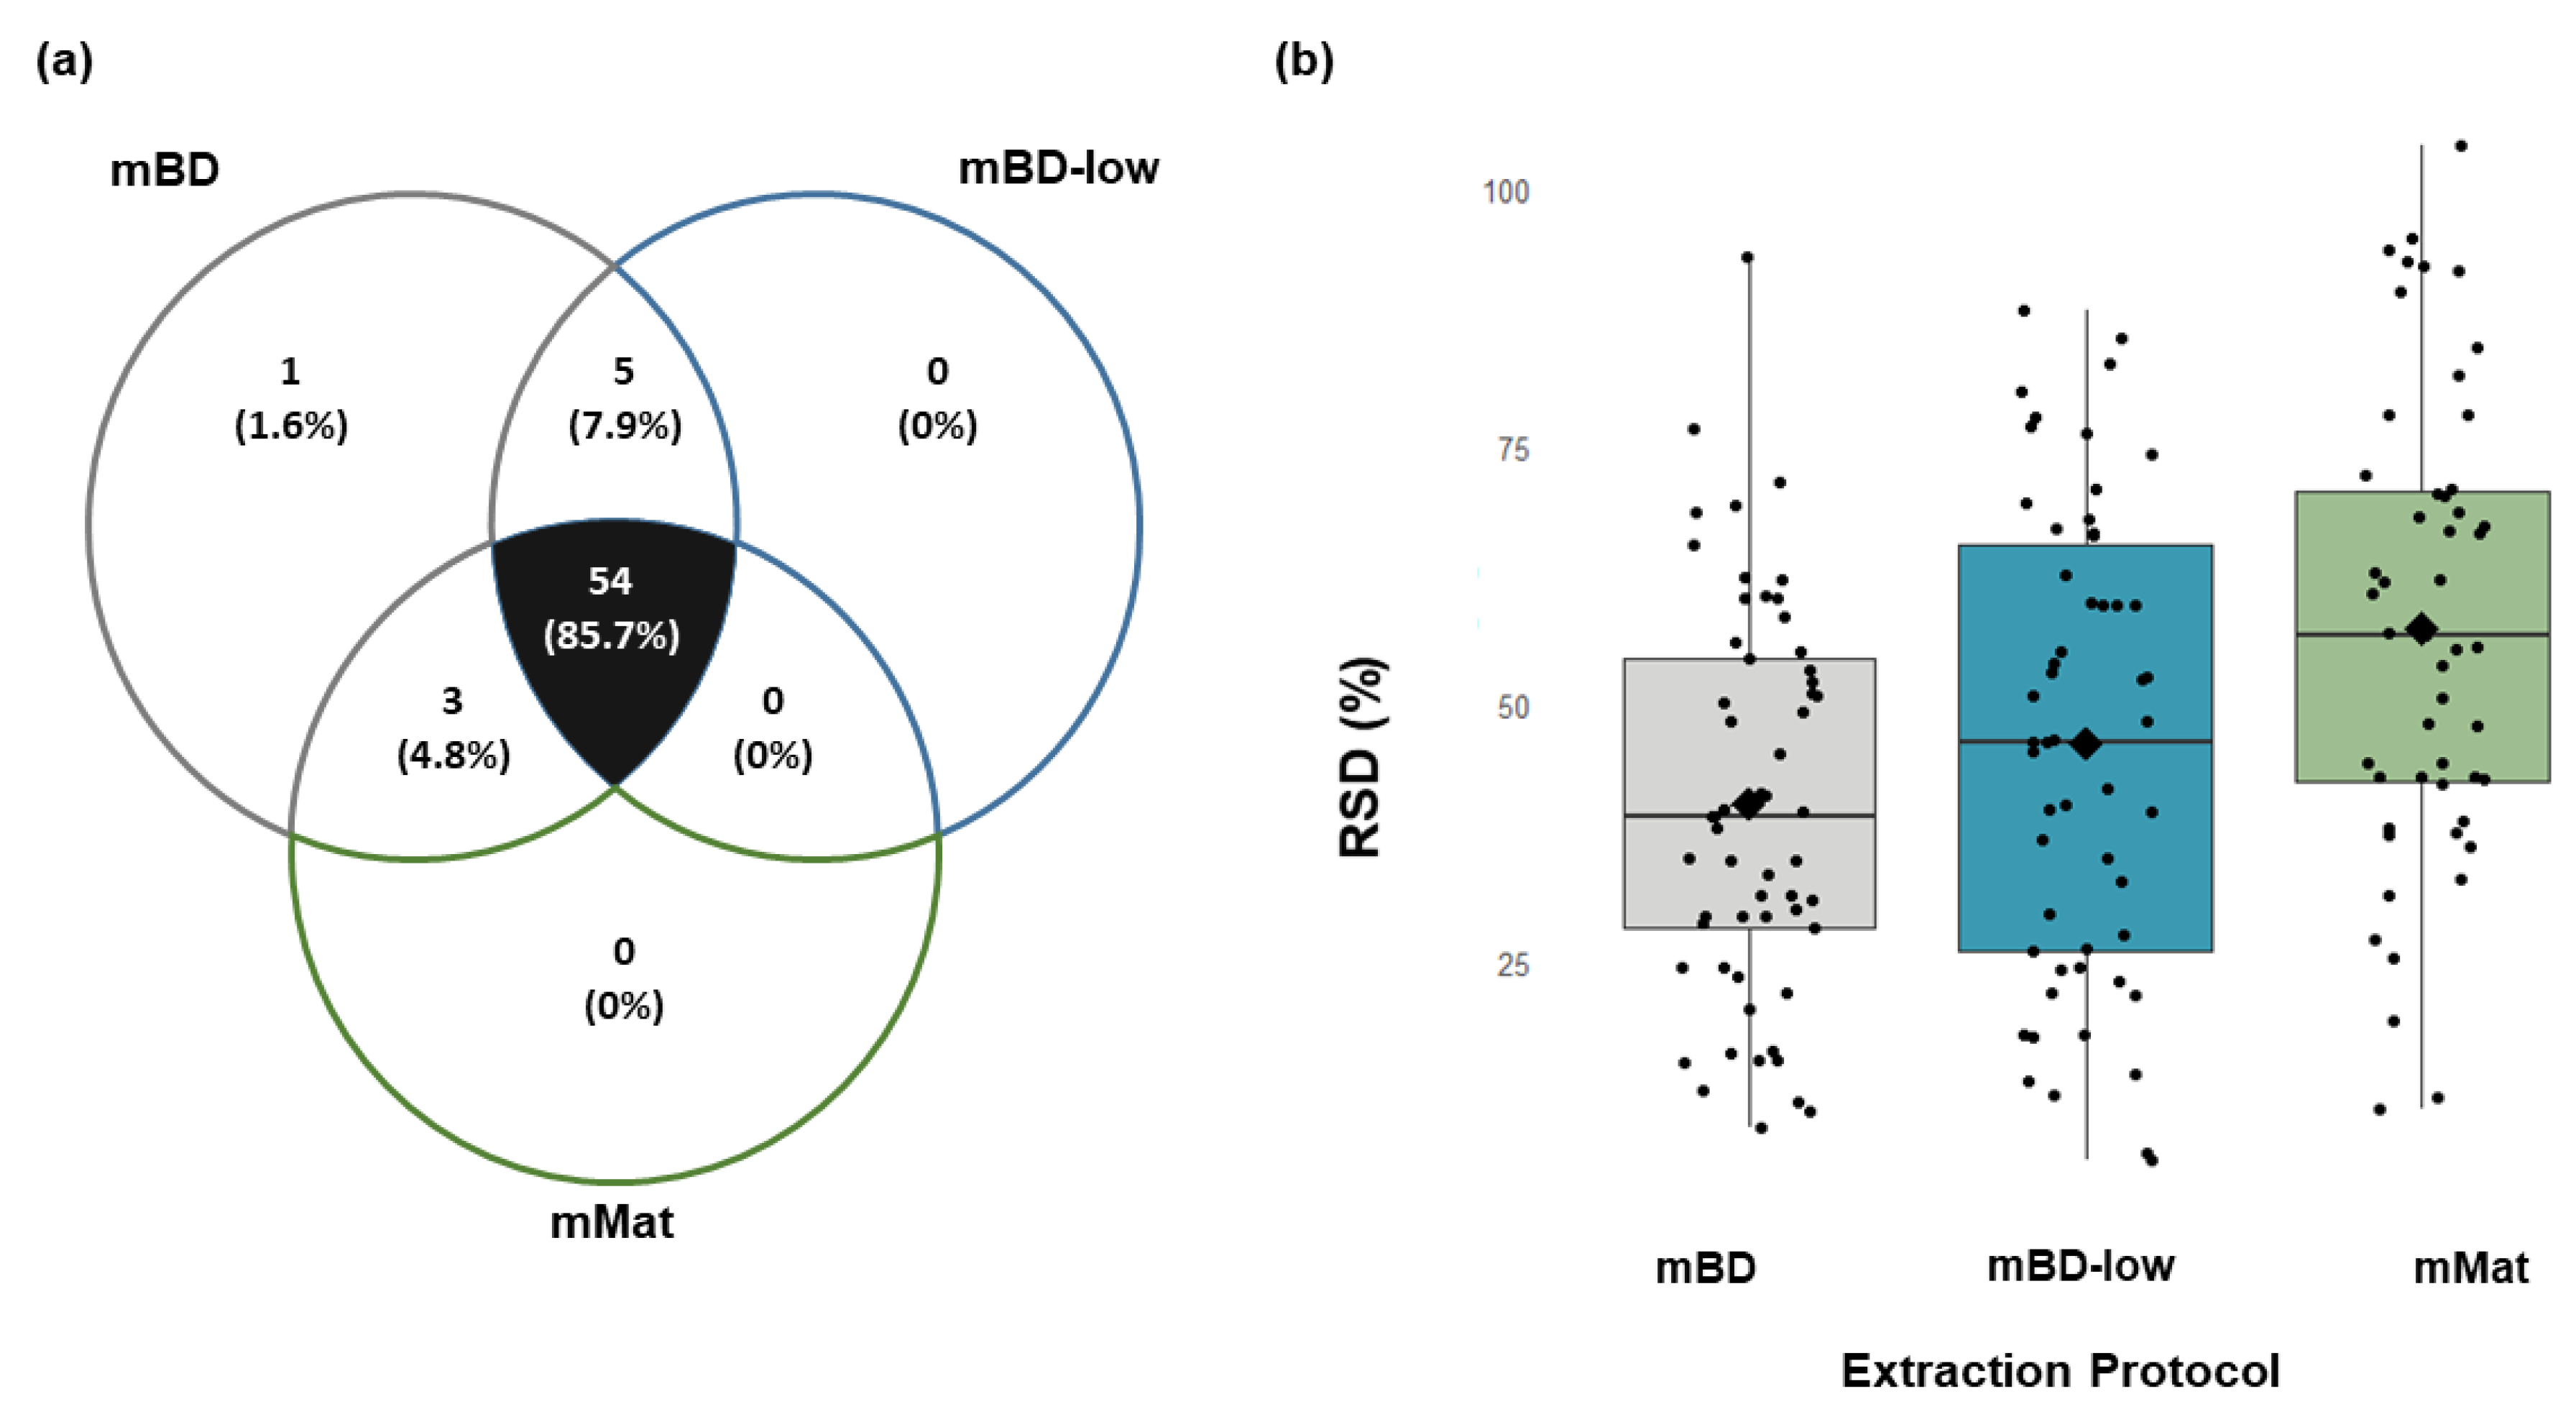
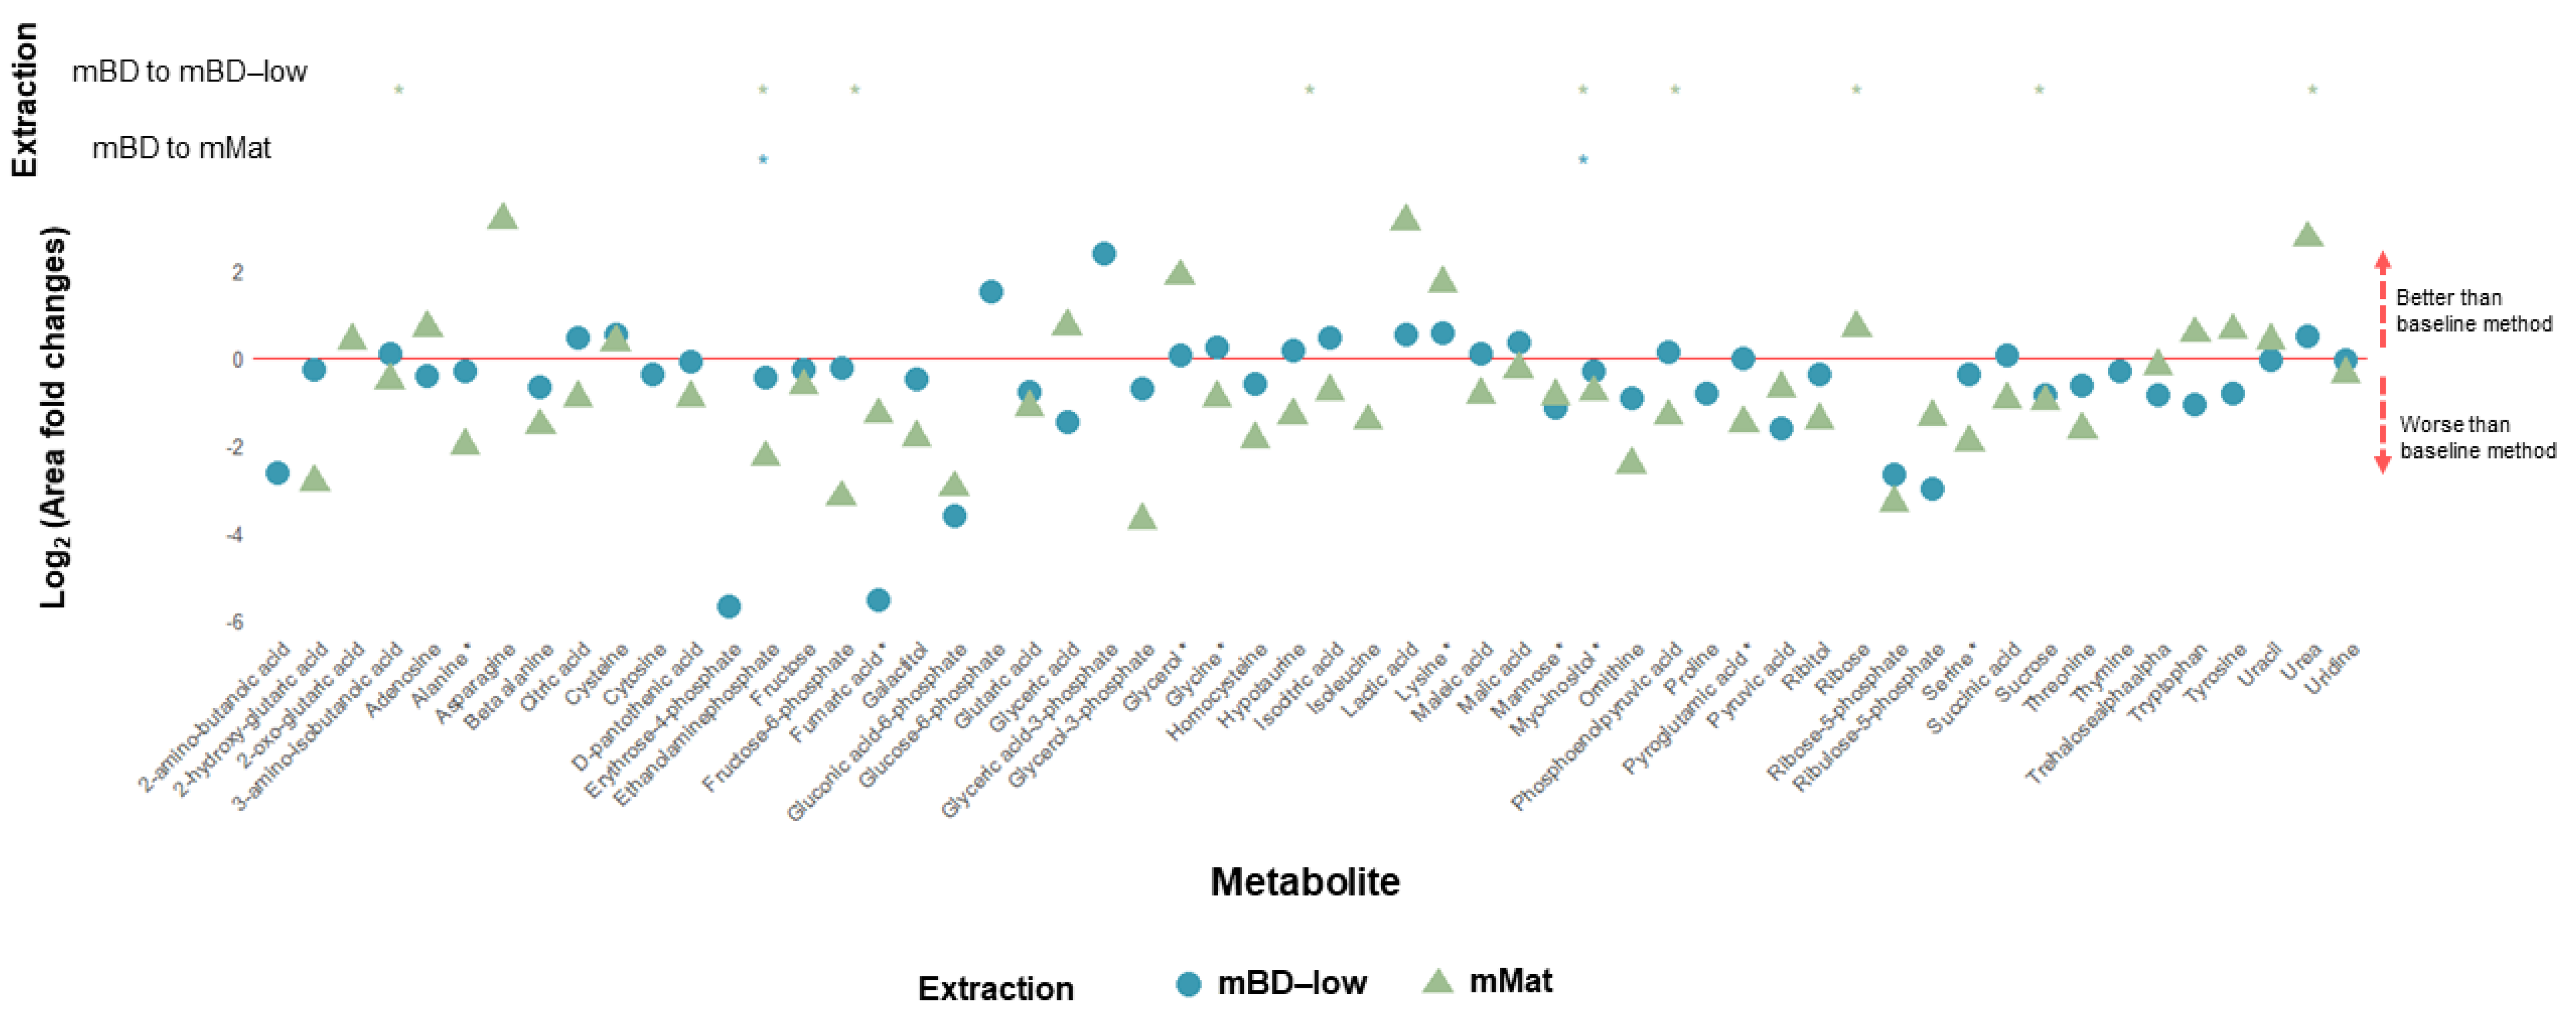
2.3. Muscle (Mice)
3. Discussion
4. Materials and Methods
4.1. Sample Acquisition and Storage
4.2. Sample Preparations
4.2.1. Tissue Homogenization
4.2.2. Extraction of polar metabolites
4.2.3. Sample Derivatization
4.3. Data Acquisition by Gas Chromatography-Mass Spectrometry (GC-MS)
4.4. Data Processing and Analysis
5. Conclusions
Supplementary Materials
Author Contributions
Funding
Institutional Review Board Statement
Informed Consent Statement
Data Availability Statement
Acknowledgments
Conflicts of Interest
References
- Zhao, H.; Li, X.; Zhang, D.; Chen, H.; Chao, Y.; Wu, K.; Dong, X.; Su, J. Integrative Bone Metabolomics—Lipidomics Strategy for Pathological Mechanism of Postmenopausal Osteoporosis Mouse Model. Sci. Rep. 2018, 8, 16456. [Google Scholar] [CrossRef] [PubMed]
- Kang, J.; Zhu, L.; Lu, J.; Zhang, X. Application of Metabolomics in Autoimmune Diseases: Insight into Biomarkers and Pathology. J. Neuroimmunol. 2015, 279, 25–32. [Google Scholar] [CrossRef] [PubMed]
- Saigusa, D.; Matsukawa, N.; Hishinuma, E.; Koshiba, S. Identification of Biomarkers to Diagnose Diseases and Find Adverse Drug Reactions by Metabolomics. Drug Metab. Pharmacokinet. 2021, 37, 100373. [Google Scholar] [CrossRef] [PubMed]
- Fan, J.; Jahed, V.; Klavins, K. Metabolomics in Bone Research. Metabolites 2021, 11, 434. [Google Scholar] [CrossRef]
- Chen, S.; Hoene, M.; Li, J.; Li, Y.; Zhao, X.; Häring, H.U.; Schleicher, E.D.; Weigert, C.; Xu, G.; Lehmann, R. Simultaneous Extraction of Metabolome and Lipidome with Methyl Tert-Butyl Ether from a Single Small Tissue Sample for Ultra-High Performance Liquid Chromatography/Mass Spectrometry. J. Chromatogr. A 2013, 1298, 9–16. [Google Scholar] [CrossRef]
- Uchitomi, R.; Hatazawa, Y.; Senoo, N.; Yoshioka, K.; Fujita, M.; Shimizu, T.; Miura, S.; Ono, Y.; Kamei, Y. Metabolomic Analysis of Skeletal Muscle in Aged Mice. Sci. Rep. 2019, 9, 10425. [Google Scholar] [CrossRef] [Green Version]
- Kilcoyne, J.; Fux, E. Strategies for the Elimination of Matrix Effects in the Liquid Chromatography Tandem Mass Spectrometry Analysis of the Lipophilic Toxins Okadaic Acid and Azaspiracid-1 in Molluscan Shellfish. J. Chromatogr. A 2010, 1217, 7123–7130. [Google Scholar] [CrossRef]
- Trufelli, H.; Palma, P.; Famiglini, G.; Cappiello, A. An Overview of Matrix Effects in Liquid Chromatography-Mass Spectrometry. Mass Spectrom. Rev. 2011, 30, 491–509. [Google Scholar] [CrossRef]
- Tang, L.; Kebarle, P. Dependence of Ion Intensity in Electrospray Mass Spectrometry on the Concentration of the Analytes in the Electrosprayed Solution. Anal. Chem. 1993, 65, 3654–3668. [Google Scholar] [CrossRef]
- Loeffler, J.; Duda, G.N.; Sass, F.A.; Dienelt, A. The Metabolic Microenvironment Steers Bone Tissue Regeneration. Trends Endocrinol. Metab. 2018, 29, 99–110. [Google Scholar] [CrossRef]
- Bligh, E.G.; Dyer, W.J. A Rapid Method of Total Lipid Extraction and Purification. Can. J. Biochem. Physiol. 1959, 37, 911–917. [Google Scholar] [CrossRef] [PubMed]
- Matyash, V.; Liebisch, G.; Kurzchalia, T.V.; Shevchenko, A.; Schwudke, D. Lipid Extraction by Methyl-Tert-Butyl Ether for High-Throughput Lipidomics. J. Lipid Res. 2008, 49, 1137–1146. [Google Scholar] [CrossRef] [PubMed] [Green Version]
- Opialla, T.; Kempa, S.; Pietzke, M. Towards a More Reliable Identification of Isomeric Metabolites Using Pattern Guided Retention Validation. Metabolites 2020, 10, 457. [Google Scholar] [CrossRef] [PubMed]
- Fritsche-Guenther, R.; Gloaguen, Y.; Kirchner, M.; Mertins, P.; Tunn, P.U.; Kirwan, J.A. Progression-Dependent Altered Metabolism in Osteosarcoma Resulting in Different Nutrient Source Dependencies. Cancers 2020, 12, 1371. [Google Scholar] [CrossRef]
- Dunn, W.B.; Wilson, I.D.; Nicholls, A.W.; Broadhurst, D. The Importance of Experimental Design and QC Samples in Large-Scale and MS-Driven Untargeted Metabolomic Studies of Humans. Bioanalysis 2012, 4, 2249–2264. [Google Scholar] [CrossRef] [Green Version]
- Bruce, S.J.; Breton, I.; Decombaz, J.; Boesch, C.; Scheurer, E.; Montoliu, I.; Rezzi, S.; Kochhar, S.; Guy, P.A. A Plasma Global Metabolic Profiling Approach Applied to an Exercise Study Monitoring the Effects of Glucose, Galactose and Fructose Drinks during Post-Exercise Recovery. J. Chromatogr. B Anal. Technol. Biomed. Life Sci. 2010, 878, 3015–3023. [Google Scholar] [CrossRef]
- Naz, S.; Moreira Dos Santos, D.C.; García, A.; Barbas, C. Analytical Protocols Based on LC-MS, GC-MS and CE-MS for Nontargeted Metabolomics of Biological Tissues. Bioanalysis 2014, 6, 1657–1677. [Google Scholar] [CrossRef]
- Fritsche-Guenther, R.; Zasada, C.; Mastrobuoni, G.; Royla, N.; Rainer, R.; Roßner, F.; Pietzke, M.; Klipp, E.; Sers, C.; Kempa, S. Alterations of MTOR Signaling Impact Metabolic Stress Resistance in Colorectal Carcinomas with BRAF and KRAS Mutations. Sci. Rep. 2018, 8, 9204. [Google Scholar] [CrossRef]
- Caterino, M.; Ruoppolo, M.; Costanzo, M.; Albano, L.; Crisci, D.; Sotgiu, G.; Saderi, L.; Montella, A.; Franconi, F.; Campesi, I. Sex Affects Human Premature Neonates’ Blood Metabolome According to Gestational Age, Parenteral Nutrition, and Caffeine Treatment. Metabolites 2021, 11, 158. [Google Scholar] [CrossRef]
- Römisch-Margl, W.; Prehn, C.; Bogumil, R.; Röhring, C.; Suhre, K.; Adamski, J. Procedure for Tissue Sample Preparation and Metabolite Extraction for High-Throughput Targeted Metabolomics. Metabolomics 2012, 8, 133–142. [Google Scholar] [CrossRef]
- Nam, M.; Huh, J.E.; Kim, M.S.; Ryu, D.H.; Park, J.; Kim, H.S.; Lee, S.Y.; Hwang, G.S. Metabolic Alterations in the Bone Tissues of Aged Osteoporotic Mice. Sci. Rep. 2018, 8, 8127. [Google Scholar] [CrossRef] [PubMed]
- El Rammouz, R.; Létisse, F.; Durand, S.; Portais, J.C.; Moussa, Z.W.; Fernandez, X. Analysis of Skeletal Muscle Metabolome: Evaluation of Extraction Methods for Targeted Metabolite Quantification Using Liquid Chromatography Tandem Mass Spectrometry. Anal. Biochem. 2010, 398, 169–177. [Google Scholar] [CrossRef] [PubMed]
- Alves, R.D.A.M.; Dane, A.D.; Harms, A.; Strassburg, K.; Seifar, R.M.; Verdijk, L.B.; Kersten, S.; Berger, R.; Hankemeier, T.; Vreeken, R.J. Global Profiling of the Muscle Metabolome: Method Optimization, Validation and Application to Determine Exercise-Induced Metabolic Effects. Metabolomics 2015, 11, 271–285. [Google Scholar] [CrossRef]
- Bekele, E.A.; Annaratone, C.E.P.; Hertog, M.L.A.T.M.; Nicolai, B.M.; Geeraerd, A.H. Multi-Response Optimization of the Extraction and Derivatization Protocol of Selected Polar Metabolites from Apple Fruit Tissue for GC-MS Analysis. Anal. Chim. Acta 2014, 824, 42–56. [Google Scholar] [CrossRef] [PubMed]
- Liang, H.R.; Foltz, R.L.; Meng, M.; Bennett, P. Ionization Enhancement in Atmospheric Pressure Chemical Ionization and Suppression in Electrospray Ionization between Target Drugs and Stable-Isotope-Labeled Internal Standards in Quantitative Liquid Chromatography/Tandem Mass Spectrometry. Rapid Commun. Mass Spectrom. 2003, 17, 2815–2821. [Google Scholar] [CrossRef] [PubMed]
- Zukunft, S.; Prehn, C.; Röhring, C.; Möller, G.; Hrabě de Angelis, M.; Adamski, J.; Tokarz, J. High-Throughput Extraction and Quantification Method for Targeted Metabolomics in Murine Tissues. Metabolomics 2018, 14, 18. [Google Scholar] [CrossRef] [Green Version]
- Sostare, E.; Di Guida, R.; Kirwan, J.; Chalal, K.; Palmer, E.; Dunn, W.B.; Viant, M.R. Erratum for Comparison of Modified Matyash Method to Conventional Solvent Systems for Polar Metabolite and Lipid Extractions” (Anal. Chim. Acta 1037 (2018), (301–315). Anal. Chim. Acta 2019, 1091, 169. [Google Scholar] [CrossRef]
- Anwar, M.A.; Vorkas, P.A.; Li, J.V.; Shalhoub, J.; Want, E.J.; Davies, A.H.; Holmes, E. Optimization of Metabolite Extraction of Human Vein Tissue for Ultra Performance Liquid Chromatography-Mass Spectrometry and Nuclear Magnetic Resonance-Based Untargeted Metabolic Profiling. Analyst 2015, 140, 7586–7597. [Google Scholar] [CrossRef]
- Patterson, R.E.; Ducrocq, A.J.; McDougall, D.J.; Garrett, T.J.; Yost, R.A. Comparison of Blood Plasma Sample Preparation Methods for Combined LC-MS Lipidomics and Metabolomics. J. Chromatogr. B Anal. Technol. Biomed. Life Sci. 2015, 1002, 260–266. [Google Scholar] [CrossRef] [Green Version]
- Sheng, J.; Vannela, R.; Rittmann, B.E. Evaluation of Methods to Extract and Quantify Lipids from Synechocystis PCC 6803. Bioresour. Technol. 2011, 102, 1697–1703. [Google Scholar] [CrossRef]
- Reis, A.; Rudnitskaya, A.; Blackburn, G.J.; Fauzi, N.M.; Pitt, A.R.; Spickett, C.M. A Comparison of Five Lipid Extraction Solvent Systems for Lipidomic Studies of Human LDL. J. Lipid Res. 2013, 54, 1812–1824. [Google Scholar] [CrossRef] [PubMed] [Green Version]
- Abbott, S.K.; Jenner, A.M.; Mitchell, T.W.; Brown, S.H.J.; Halliday, G.M.; Garner, B. An Improved High-Throughput Lipid Extraction Method for the Analysis of Human Brain Lipids. Lipids 2013, 48, 307–318. [Google Scholar] [CrossRef] [PubMed] [Green Version]
- European Medicines Agency. Guideline on Bioanalytical Method Validation. EMEA/CHMP/EWP/192217/2009 2009, 44, 1–23. [Google Scholar]
- Sostare, J.; Di Guida, R.; Kirwan, J.; Chalal, K.; Palmer, E.; Dunn, W.B.; Viant, M.R. Comparison of Modified Matyash Method to Conventional Solvent Systems for Polar Metabolite and Lipid Extractions. Anal. Chim. Acta 2018, 1037, 301–315. [Google Scholar] [CrossRef]
- Fritsche-Guenther, R.; Bauer, A.; Gloaguen, Y.; Lorenz, M.; Kirwan, J.A. Modified Protocol of Harvesting, Extraction, and Normalization Approaches for Gas Chromatography Mass Spectrometry-Based Metabolomics Analysis of Adherent Cells Grown under High Fetal Calf Serum Conditions. Metabolites 2020, 10, 2. [Google Scholar] [CrossRef] [Green Version]


| Homogenization Method | No. Biological Replicates | No. Metabolites Detected | mRSD (%) |
|---|---|---|---|
| Tissuelyzer | 5 | 38 | 31 ± 5 |
| Pulverizer | 5 | 36 | 40 ± 5 |
| Homogenization Method | Derivatives | Trimethylsilylation (TMS) | Methoximation (MeOX) | |||
|---|---|---|---|---|---|---|
| 4-TMS | 3-TMS | 2-TMS | 1-TMS | |||
| Tissuelyzer | No of metabolites | 5 | 12 | 17 | 4 | 8 |
| RSD range (%) | 11 to 75 | 5 to 107 | 8 to 98 | 5 to 38 | 6 to74 | |
| mRSD (%) | 24 | 28 | 31 | 16 | 36 | |
| Pulverizer | No of metabolites | 5 | 13 | 13 | 4 | 8 |
| RSD range (%) | 29 to 164 | 12 to 86 | 10 to 142 | 13 to 82 | 10 to 67 | |
| mRSD (%) | 50 | 41 | 38 | 60 | 38 | |
| mRSD (%) | No. Metabolites Detected | Missing Metabolites | Mean No. NA’s for Each Sample (%) | No. Replicates Used for Analysis/Total Prepared | |
|---|---|---|---|---|---|
| mBD | 15 | 65 ± 2 | 1 ± 2 | 6 ± 1 | 4/5 |
| mBD-low | 18 | 60 ± 0 | 6 ± 0 | 11 ± 1 | 4/5 |
| mMat | 15 | 59 ± 0 | 7 ± 0 | 11 ± 0 | 3/5 |
| mRSD (%) | No. Metabolites Detected | Missing Metabolites | Mean No. NA’s for Each Sample (%) | No. Replicates Used for Analysis/Total Prepared | |
|---|---|---|---|---|---|
| mBD | 35 | 63 ± 2 | 3 ± 2 | 4 ± 2 | 4/5 |
| mBD-low | 46 | 59 ± 1 | 7 ± 1 | 9 ± 1 | 5/5 |
| mMat | 47 | 57 ± 2 | 9 ± 2 | 11 ± 4 | 5/5 |
Publisher’s Note: MDPI stays neutral with regard to jurisdictional claims in published maps and institutional affiliations. |
© 2022 by the authors. Licensee MDPI, Basel, Switzerland. This article is an open access article distributed under the terms and conditions of the Creative Commons Attribution (CC BY) license (https://creativecommons.org/licenses/by/4.0/).
Share and Cite
Dias, D.B.; Fritsche-Guenther, R.; Gutmann, F.; Duda, G.N.; Kirwan, J.; Poh, P.S.P. A Comparison of Solvent-Based Extraction Methods to Assess the Central Carbon Metabolites in Mouse Bone and Muscle. Metabolites 2022, 12, 453. https://doi.org/10.3390/metabo12050453
Dias DB, Fritsche-Guenther R, Gutmann F, Duda GN, Kirwan J, Poh PSP. A Comparison of Solvent-Based Extraction Methods to Assess the Central Carbon Metabolites in Mouse Bone and Muscle. Metabolites. 2022; 12(5):453. https://doi.org/10.3390/metabo12050453
Chicago/Turabian StyleDias, Daniela B., Raphaela Fritsche-Guenther, Friederike Gutmann, Georg N. Duda, Jennifer Kirwan, and Patrina S. P. Poh. 2022. "A Comparison of Solvent-Based Extraction Methods to Assess the Central Carbon Metabolites in Mouse Bone and Muscle" Metabolites 12, no. 5: 453. https://doi.org/10.3390/metabo12050453