1. Introduction
Population-based and epidemiological biobank studies provide essential information about the health of the general population and are key resources for research into disease etiology and comorbidities [
1,
2,
3,
4]. There are numerous large biobank projects around the globe, including in Europe, North America, Australia, China, Japan, Korea and Qatar [
5,
6,
7,
8,
9] that gather biological samples, clinical data, basic laboratory test results, along with imaging data and questionaries. These data sets are primarily obtained from volunteers without any specific health-related inclusion/exclusion criteria [
10]. Further insights into disease etiologies and comorbidities are derived from these samples as a result of technological advancement and the introduction of the -omics sciences (genomics, transcriptomics, proteomics, metabolomics), along with large electronic databases that are capable of storing and managing the large data sets associated with the subject information into widely accessible population-based biobanks [
11,
12].
Statistics on the use of prescription drugs and over-the-counter medication reflect actual patient behavior in disease management. They can even provide insights into the genetic bases of complex diseases, as shown in a recent genome-wide association study on medication use in UK Biobank [
13]. However, information on medication use, diet and lifestyle is generally obtained from questionnaires, which may be inaccurate due to multiple factors, including communication issues, unclear wording or too extensive questionaries [
14]. Such biases may substantially affect the analysis of the actual drug exposure which can result in false estimation of used medication and their effects [
15,
16]. A previous study, assessing the concordance between the information on medication use derived in parallel from questionnaires and from pharmacy database records reported good concordance for medication used to treat chronic disorders, such as cardiovascular disease, type 2 diabetes (T2D) and hypothyroidism, but poor concordance for medication used over shorter periods of time [
17]. Therefore, validation of questionnaire-derived medication data is critical for accurate analysis.
In this context, non-targeted metabolomics, designed for the broad characterization of ideally all relevant small molecules in a biological sample, can help to answer the question of how well self-reported and blood-detected drug uses match. Indeed, a pilot study conducted on 83 subjects deployed metabolomics to test whether questionnaire-derived medication use could be verified using metabolomics readouts from urine [
18]. The study showed that molecular evidence for many classes of medication could be obtained from urine metabolic profiles. Nevertheless, some of the drugs, predominantly those extensively metabolized and excreted by the liver (omeprazole, rabeprazole, atorvastatin, and simvastatin), were not captured by the metabolomics analyses of urine. However, the potential of untargeted metabolic profiling applied in the plasma samples as a strategy for the verification of the questionary-derived data on the medication usage has not been previously explored.
Here, we analyze self-reported drug use from 6000 participants of the Qatar Biobank (QBB) [
9,
19] together with non-targeted metabolomics measurements made on 2807 matching blood plasma samples. We curate and annotate the self-reported drug use data using ATC terms and ask how self-reported QBB drug use compares with top self-reported drug use in the UK Biobank (UKB). We then analyze the metabolomics data to ask (1) how well self-reported drug use is reflected in blood detected metabolites, (2) which drugs are potentially under-reported by study participants, that is, only detected in blood, and (3) which drugs are not detected using the currently available metabolomics platforms, that is, only self-reported by the participants? We discuss relevant examples in more detail, including the use of paracetamol, metformin, statins, and psychoactive drugs.
2. Results
2.3. Comparison of Self-Reported Drug Use in QBB and UK Biobank
To evaluate the consistency of self-reported medication in QBB with what is observed in other population studies, we used UK Biobank data. The average age of the UKB participants at recruitment (56.5 yrs, s.d. = 8 yrs) was fifteen years higher than that of the QBB participant, whereas the average BMI (27.3, s.d. = 4.8) and the proportion of female participants (54.4%) in UKB was comparable to QBB. Despite their older age, only 5.3% of the UKB participants were diagnosed with diabetes, compared with 17.4% in QBB. Medication use in UKB was obtained via a verbal interview with a trained nurse (see methods). 372,854 out of 500,000 participants (74.6%) in UKB reported taking at least one medication item (
Supplementary Table S2), which is substantially higher than in QBB (51.4%) but nevertheless in agreement with the observed increase in medication use with age (
Figure 1b).
The most frequently reported items in UKB were paracetamol (N = 102,058), aspirin (N = 72,926), ibuprofen (N = 67,388), simvastatin (N = 64,538), omeprazole (N = 35,724), bendroflumethiazide (N = 30,052), ramipril (N = 27,363), amlodipine (N = 26,198), levothyroxine (N = 24,081), and atorvastatin (N = 21,516). Among the dietary supplements the most frequently reported items in UKB were glucosamine products (N = 34,219), cod liver oil capsules (N = 29,961), omega-3/fish oil supplements (N = 19,877), and multivitamin supplements (N = 16,504). It is noteworthy that the three most frequently reported medications in UKB were analgesics (paracetamol, aspirin, and ibuprofen), whereas only a small fraction of QBB participants reported their use. Other frequently reported medications in UKB were the anti-dyslipidemia drugs simvastatin and atorvastatin, as well as drugs used to control high blood pressure, including bendroflumethiazide, ramipril, and amlodipine. In contrast to QBB, metformin and other blood glucose controlling agents were not among the most frequently reported drugs in UKB.
Overall, there were substantial differences in self-reported medication use between UKB and QBB. These may in part be due to differences in demographics (older participants taking more medication), lifestyle (e.g., use of vitamin supplements) and disease prevalence (i.e., diabetes rates), but there also appears to be a reporting bias for some of the over-the-counter drugs (e.g., only 28 of the 6000 QBB participants report using paracetamol, whereas 1 in 5 UKB participants do). It may, therefore, be of interest to evaluate the self-reported use of these medications with blood detection, as we shall investigate in the following section.
2.4. Linking Drug Metabolites Detected in Blood and Self-Reported Medication
For independent validation of the questionnaire-derived medication use, samples of 3000 QBB participants were analyzed on the non-targeted HD4 metabolomics platform of Metabolon Inc. (Morrisville, NC, USA) that is operated by the Anti-Doping Laboratory–Qatar. For 2807 of these samples, we had access to matching questionnaire data. In total, semi-quantitative levels of 1159 metabolites were reported; of these, 119 were annotated as drugs and assigned by Metabolon to 13 different drug categories (
Supplementary Table S3). In 80% of the blood samples at least one drug metabolite related to the category “
analgesics/anesthetics” was detected (see methods), 46.5% of the blood samples contained at least one molecule related to drugs targeting “
metabolic processes”, and 22.3% of the samples contained at least one metabolite related to “
drugs used to treat cardiovascular problems”.
We investigated the overlap between self-reported medication use and the detection of drug-related metabolites in the participants’ blood samples in a hypothesis free approach by testing all possible 2 × 2 tables constituted by the counts of “
detected” (yes/no) versus “
self-reported” (yes/no) drug molecules for significant deviation from the null using a Fisher exact test. We accounted for multiple testing by the number of tested metabolites (N = 119) times the number of self-reported medication items (N = 394), yielding a conservative Bonferroni level of significance of
p < 1.1 × 10
−6 (
Supplementary Table S4).
In total, 82 metabolite–drug pairs showed a significant overlap between self-reported drug usage and blood-detected metabolites at this level of significance. Multiple metabolites can associate with the same drug (e.g., multiple detected acetaminophen metabolites associated with paracetamol usage) and multiple drugs that are used to treat a single underlying condition (e.g., self-reported metformin use with drugs used to treat diabetes comorbidities). To avoid confounding or counting the same medication multiple times, we applied a stringent mutual-best-hit criterion, meaning that we considered only the single strongest associations for each self-reported medication and for each detected drug metabolite, respectively, and this only if they were their mutual strongest association. We found 22 such mutual-best-hit matches that reached Bonferroni significance (
Table 3). In all 22 cases, the self-reported medication and the detected drug metabolite were identical or biochemically related (e.g., self-reported use of atorvastatin associated with detection of o-hydroxyatorvastatin in blood). When including mutual-best-hits up to nominal significance (
p-value < 0.05), we found 59 self-reported medication-detected drug metabolite pairs (
Supplementary Table S4), many of which were biochemically related or identical (e.g., ibuprofen, tramadol, verapamil, tamoxifen).
Metabolites of undetermined biochemical identity (unknowns) may correspond to drug metabolites and can potentially be identified by their association with self-reported medication. To identify possible cases, we repeated the analysis by including all unknows with >50% missing values (N = 40) (see
Supplementary Table S5). All associations between named metabolites and self-reported medication remained unchanged. In total, 6 unknowns had associations that were significant after correcting for 394 self-reported medications times 40 unknowns (
p < 3.2 × 10
−6). A total of 5 of these unknowns were associated with “metformin”, “unspecified hypertension”, and “vitamin d” and might be confounded by indication rather than constitute metabolites of the associated medication. One molecule (X − 17348) was associated with esomeprazole (14 out of 26 self-reported esomeprazole users had X − 17348 detected in their blood, whereas X − 17348 was detected in total in only 11.6% of the samples,
p-value = 1.6 × 10
−7, Fisher test).
Among the 22 mutual-best-hits that were significant at a conservative Bonferroni level of significance, in all these cases the number of self-reported medications was lower than the number of matching drug metabolites detected in blood. The average fraction of cases in which a matching drug metabolite was both, self-reported and detected in blood was 26.7%. The average fraction of self-reported-only cases was 7.4% and that of detected-only cases was 65.8%. If a drug had been self-reported by a study participant, it was also detected in that participant’s blood sample in 79.4% of the cases. On the other hand, if a drug metabolite had been detected in a blood sample, the corresponding study participant reported taking the matching medication in only 29.5% of the cases. Thus, there is a good recall of self-reported medication using non-targeted metabolomics. On the other hand, a large amount of detection of drug metabolites without a matching self-reported medication also occurred. We investigate relevant examples of these cases in the following section.
3. Discussion
Our study describes the potential of non-targeted metabolomics in the assessment of questionary-derived data on medication use. In this analysis we found evidence of the under-reporting of drugs within the QBB participants, as it is a likely the case in acetaminophen and psychoactive drug usage. The under-reporting of medication has many potential possible sources. It is possible that cultural biases and norms influence the comfort level of participants disclosing their complete medication list. This is potentially the underlying cause in the drastic but presumed under-reporting of psychoactive medications within the QBB population as compared with UKB. Under-reporting is also likely exacerbated by the prevalence of certain drugs, such as acetaminophen. Acetaminophen is present in many different formulations including common cold and flu medications, which could mean that the participant(s) simply did not know that acetaminophen was present in the over-the-counter medicine they used. It should also be noted that the differences in the reporting of pain-killer usage may be due to differences in the interpretation of the questions posed by QBB and UKB, i.e., what the individual study participants may consider as a “medication”.
In contrast, we also found evidence of false positive detection of select drugs as shown by metformin. There are various technical method-specific issues which can lead to over-detection of drugs in samples during untargeted metabolomic analysis, especially of large sample sets as encountered in this study. Data generated from large sample sets are susceptible to increased variability because of the day-to-day changes in instrument performance including differences in instrument sensitivity, chromatographic drift of compounds, and varying levels of process contribution or chromatographic carry-over that occur over time. The challenge with this study was also related to the size of the study. Process blank levels differ from run to run as different consumable lots are used over time. Based on the rate of presumed false positives in this study and a closer look at the data it appears that a stricter overall requirement of experimental area counts over process blank area counts is required to account for the more variable process blank levels over time in the future. These issues likely contributed to the increased false positive detection of metformin in this study.
Unlike many biochemicals which can be expected to be found in most, if not all, samples, drugs are inherently present in only a fraction of all the samples in a population study. A careful balance must be struck between the ability to detect drugs (sensitivity), which is required to account for drug dosing and clearance rates, and the avoidance of false positives. Several approaches can be utilized to reduce the false positive rate and increase confidence in the presence of a particular drug. The presence of primary or secondary metabolites of the active substance is a strong indicator that the drug is present, and that the detection is valid in any given sample. Unfortunately, some drugs, including metformin discussed here, do not lend themselves to this form of further scrutiny as it is cleared from the body without modification. Another approach is to require detection of a drug by multiple analytical methods from the same sample. As many untargeted methods employ multiple LC-MS methods for the analysis of each sample the detection of the drug on multiple arms greatly increases the confidence in the presence of the drug. Lastly, a requirement of a high-quality fragmentation spectra match for the potential drug in each sample, rather than in a preponderance of aligned peaks or in the aligned peak in a technical replicate only, provides an elevated level of confidence in the presence of the drug without the need to use other identifications as a part of the analysis. Considering the observed and presumed false positive rate of metformin detection, the data could be re-interrogated using the above noted additional scrutiny to reduce false positives.
In balance with more stringent criteria to reduce false positives is the likely reciprocal increase in false negatives. The clearance rate of drugs coupled with the time from dosing to collection and the dosage-to-weight ratio can mean that the compound falls below the limit of detection of the method, particularly when more stringent criteria are used. Under-reporting of drugs can be mitigated using a robust library built from authentic standards of known drugs, as well as their known metabolites. This increases the ability to detect some drugs for a period after initial dosing as they are metabolized by the body over time.
Finally, an in our opinion unlikely general explanation for our observations, but possibly still relevant to individual cases, is the presence of certain molecules in the drinking water. A very recent global study on the presence of pharmaceutical pollutants in river waters reported numerous of the metabolites that we find under-reported here, including metformin and acetaminophen [
25].
In the end, both human and technical factors were at play and will likely continue to play a role in the noted discrepancies between the reporting and detection of drug metabolites (
Table 5). As always, in both instances, it is important to identify which factors can be better controlled, such as the human factors of memory and honesty by taking a careful medical history and accurate collation of the self-reporting data, and for the technical issues the careful analysis and interpretation of the obtained data and further improvement of detection and metabolite annotation methods. Large biobank studies can play a major role in this process.
Author Contributions
Conceptualization, K.S. and A.H.; formal analysis, K.S.; data interpretation, R.J.R. and A.M.E.; data curation, N.S., S.Z. and A.H.; writing—original draft preparation, K.S.; writing—review and editing, K.S., N.S., S.Z., C.R.T., A.H., R.J.R. and A.M.E. All authors have read and agreed to the published version of the manuscript.
Funding
This study is supported by the Biomedical Research Program at Weill Cornell Medicine in Qatar, a program funded by the Qatar Foundation. K.S. is also supported by Qatar National Research Fund (QNRF) grant NPRP11C-0115-180010. Qatar Biobank is supported by Qatar Foundation. The statements made herein are solely the responsibility of the authors.
Institutional Review Board Statement
The study was conducted according to the guidelines of the Declaration of Helsinki and approved by Hamad Medical Corporation Ethics Committee and Qatar Biobank institutional review board. Use of the Qatar Biobank data was approved under reference Ex -2019-RES-ACC-0160-0083 and E -2020-QF-QBB-RES-ACC-0205-0123.
Informed Consent Statement
The present study was performed on data obtained from Qatar Biobank study participants. All study participants signed an informed consent form prior to their participation.
Data Availability Statement
Acknowledgments
We are grateful to all study participants of Qatar Biobank for their invaluable contributions to this study and to the staff of Qatar Biobank for their support with data access and management.
Conflicts of Interest
R.J.R. and A.M.E. are employees of Metabolon Inc.; The other authors declare no conflict of interest. The funders had no role in the design of the study, in the collection, analyses, or interpretation of data, in the writing of the manuscript, or in the decision to publish the results.
References
- Bycroft, C.; Freeman, C.; Petkova, D.; Band, G.; Elliott, L.T.; Sharp, K.; Motyer, A.; Vukcevic, D.; Delaneau, O.; O’Connell, J.; et al. The UK Biobank resource with deep phenotyping and genomic data. Nature 2018, 562, 203–209. [Google Scholar] [CrossRef] [PubMed] [Green Version]
- German National Cohort (GNC) Consortium. The German National Cohort: Aims, study design and organization. Eur. J. Epidemiol. 2014, 29, 371–382. [Google Scholar] [CrossRef]
- Hudson, K.L.R.; Patrick-Lake, B.; Burchard, E.G. Precision Medicine Initiative (PMI) Working Group Report to the Advisory Committee to the Director, N. In Proceedings of the The Precision Medicine Initiative Cohort Program—Building a Research Foundation for 21st Century Medicine, online, 17 September 2015. [Google Scholar]
- Chen, Z.; Chen, J.; Collins, R.; Guo, Y.; Peto, R.; Wu, F.; Li, L. China Kadoorie Biobank of 0.5 million people: Survey methods, baseline characteristics and long-term follow-up. Int. J. Epidemiol. 2011, 40, 1652–1666. [Google Scholar] [CrossRef] [PubMed] [Green Version]
- O’Donoghue, S.; Dee, S.; Byrne, J.A.; Watson, P.H. How Many Health Research Biobanks Are There? Biopreserv. Biobank. 2021; ahead of print. [Google Scholar] [CrossRef] [PubMed]
- Zhang, Y.; Li, Q.; Wang, X.; Zhou, X. China Biobanking. Adv. Exp. Med. Biol. 2015, 864, 125–140. [Google Scholar] [CrossRef] [PubMed]
- Nagai, A.; Hirata, M.; Kamatani, Y.; Muto, K.; Matsuda, K.; Kiyohara, Y.; Ninomiya, T.; Tamakoshi, A.; Yamagata, Z.; Mushiroda, T.; et al. Overview of the BioBank Japan Project: Study design and profile. J. Epidemiol. 2017, 27, S2–S8. [Google Scholar] [CrossRef] [PubMed]
- Cho, S.Y.; Hong, E.J.; Nam, J.M.; Han, B.; Chu, C.; Park, O. Opening of the national biobank of Korea as the infrastructure of future biomedical science in Korea. Osong Public Health Res. Perspect. 2012, 3, 177–184. [Google Scholar] [CrossRef] [PubMed] [Green Version]
- Al Kuwari, H.; Al Thani, A.; Al Marri, A.; Al Kaabi, A.; Abderrahim, H.; Afifi, N.; Qafoud, F.; Chan, Q.; Tzoulaki, I.; Downey, P.; et al. The Qatar Biobank: Background and methods. BMC Public Health 2015, 15, 1208. [Google Scholar] [CrossRef] [PubMed] [Green Version]
- Sudlow, C.; Gallacher, J.; Allen, N.; Beral, V.; Burton, P.; Danesh, J.; Downey, P.; Elliott, P.; Green, J.; Landray, M.; et al. UK biobank: An open access resource for identifying the causes of a wide range of complex diseases of middle and old age. PLoS Med. 2015, 12, e1001779. [Google Scholar] [CrossRef] [PubMed] [Green Version]
- Tadaka, S.; Hishinuma, E.; Komaki, S.; Motoike, I.N.; Kawashima, J.; Saigusa, D.; Inoue, J.; Takayama, J.; Okamura, Y.; Aoki, Y.; et al. jMorp updates in 2020: Large enhancement of multi-omics data resources on the general Japanese population. Nucleic Acids Res. 2021, 49, D536–D544. [Google Scholar] [CrossRef] [PubMed]
- Carey, D.J.; Fetterolf, S.N.; Davis, F.D.; Faucett, W.A.; Kirchner, H.L.; Mirshahi, U.; Murray, M.F.; Smelser, D.T.; Gerhard, G.S.; Ledbetter, D.H. The Geisinger MyCode community health initiative: An electronic health record-linked biobank for precision medicine research. Genet. Med. Off. J. Am. Coll. Med. Genet. 2016, 18, 906–913. [Google Scholar] [CrossRef] [Green Version]
- Wu, Y.; Byrne, E.M.; Zheng, Z.; Kemper, K.E.; Yengo, L.; Mallett, A.J.; Yang, J.; Visscher, P.M.; Wray, N.R. Genome-wide association study of medication-use and associated disease in the UK Biobank. Nat. Commun. 2019, 10, 1891. [Google Scholar] [CrossRef] [Green Version]
- Choi, B.C.; Pak, A.W. A catalog of biases in questionnaires. Prev. Chronic Dis. 2005, 2, A13. [Google Scholar]
- Jurek, A.M.; Greenland, S.; Maldonado, G.; Church, T.R. Proper interpretation of non-differential misclassification effects: Expectations vs observations. Int. J. Epidemiol. 2005, 34, 680–687. [Google Scholar] [CrossRef] [Green Version]
- West, S.L.; Strom, B.L.; Poole, C. Validity of Pharmacoepidemiologic Drug and Diagnosis Data; Wiley: Hoboken, NJ, USA, 2000; pp. 661–705. [Google Scholar] [CrossRef]
- Sediq, R.; van der Schans, J.; Dotinga, A.; Alingh, R.A.; Wilffert, B.; Bos, J.H.; Schuiling-Veninga, C.C.; Hak, E. Concordance assessment of self-reported medication use in the Netherlands three-generation Lifelines Cohort study with the pharmacy database iaDB.nl: The PharmLines initiative. Clin. Epidemiol. 2018, 10, 981–989. [Google Scholar] [CrossRef] [Green Version]
- Klont, F.; Kremer, D.; Gomes Neto, A.W.; Berger, S.P.; Touw, D.J.; Hak, E.; Bonner, R.; Bakker, S.J.L.; Hopfgartner, G. Metabolomics data complemented drug use information in epidemiological databases: Pilot study of potential kidney donors. J. Clin. Epidemiol. 2021, 135, 10–16. [Google Scholar] [CrossRef]
- Al Thani, A.; Fthenou, E.; Paparrodopoulos, S.; Al Marri, A.; Shi, Z.; Qafoud, F.; Afifi, N. Qatar Biobank Cohort Study: Study Design and First Results. Am. J. Epidemiol. 2019, 188, 1420–1433. [Google Scholar] [CrossRef]
- Wishart, D.S.; Knox, C.; Guo, A.C.; Cheng, D.; Shrivastava, S.; Tzur, D.; Gautam, B.; Hassanali, M. DrugBank: A knowledgebase for drugs, drug actions and drug targets. Nucleic Acids Res. 2008, 36, D901–D906. [Google Scholar] [CrossRef]
- Wishart, D.S.; Feunang, Y.D.; Guo, A.C.; Lo, E.J.; Marcu, A.; Grant, J.R.; Sajed, T.; Johnson, D.; Li, C.; Sayeeda, Z.; et al. DrugBank 5.0: A major update to the DrugBank database for 2018. Nucleic Acids Res. 2018, 46, D1074–D1082. [Google Scholar] [CrossRef]
- Santos, R.; Ursu, O.; Gaulton, A.; Bento, A.P.; Donadi, R.S.; Bologa, C.G.; Karlsson, A.; Al-Lazikani, B.; Hersey, A.; Oprea, T.I.; et al. A comprehensive map of molecular drug targets. Nat. Reviews. Drug Discov. 2017, 16, 19–34. [Google Scholar] [CrossRef]
- Mazaleuskaya, L.L.; Sangkuhl, K.; Thorn, C.F.; FitzGerald, G.A.; Altman, R.B.; Klein, T.E. PharmGKB summary: Pathways of acetaminophen metabolism at the therapeutic versus toxic doses. Pharm. Genom. 2015, 25, 416–426. [Google Scholar] [CrossRef] [PubMed] [Green Version]
- McGill, M.R.; Jaeschke, H. Metabolism and Disposition of Acetaminophen: Recent Advances in Relation to Hepatotoxicity and Diagnosis. Pharm. Res. 2013, 30, 2174–2187. [Google Scholar] [CrossRef] [PubMed] [Green Version]
- Wilkinson, J.L.; Boxall, A.B.A.; Kolpin, D.W.; Leung, K.M.Y.; Lai, R.W.S.; Galbán-Malagón, C.; Adell, A.D.; Mondon, J.; Metian, M.; Marchant, R.A.; et al. Pharmaceutical pollution of the world’s rivers. Proc. Natl. Acad. Sci. USA 2022, 119, e2113947119. [Google Scholar] [CrossRef] [PubMed]
- Evans, A.M.; DeHaven, C.D.; Barrett, T.; Mitchell, M.; Milgram, E. Integrated, nontargeted ultrahigh performance liquid chromatography/electrospray ionization tandem mass spectrometry platform for the identification and relative quantification of the small-molecule complement of biological systems. Anal. Chem. 2009, 81, 6656–6667. [Google Scholar] [CrossRef] [PubMed]
Figure 1.
Histogram of the 6000 QBB participants included in this study, presented by sex and age (a); fraction of male (blue), female (pink), and all (black) QBB participants who self-reported using at least one over-the-counter or prescription drug, stratified by age (b).
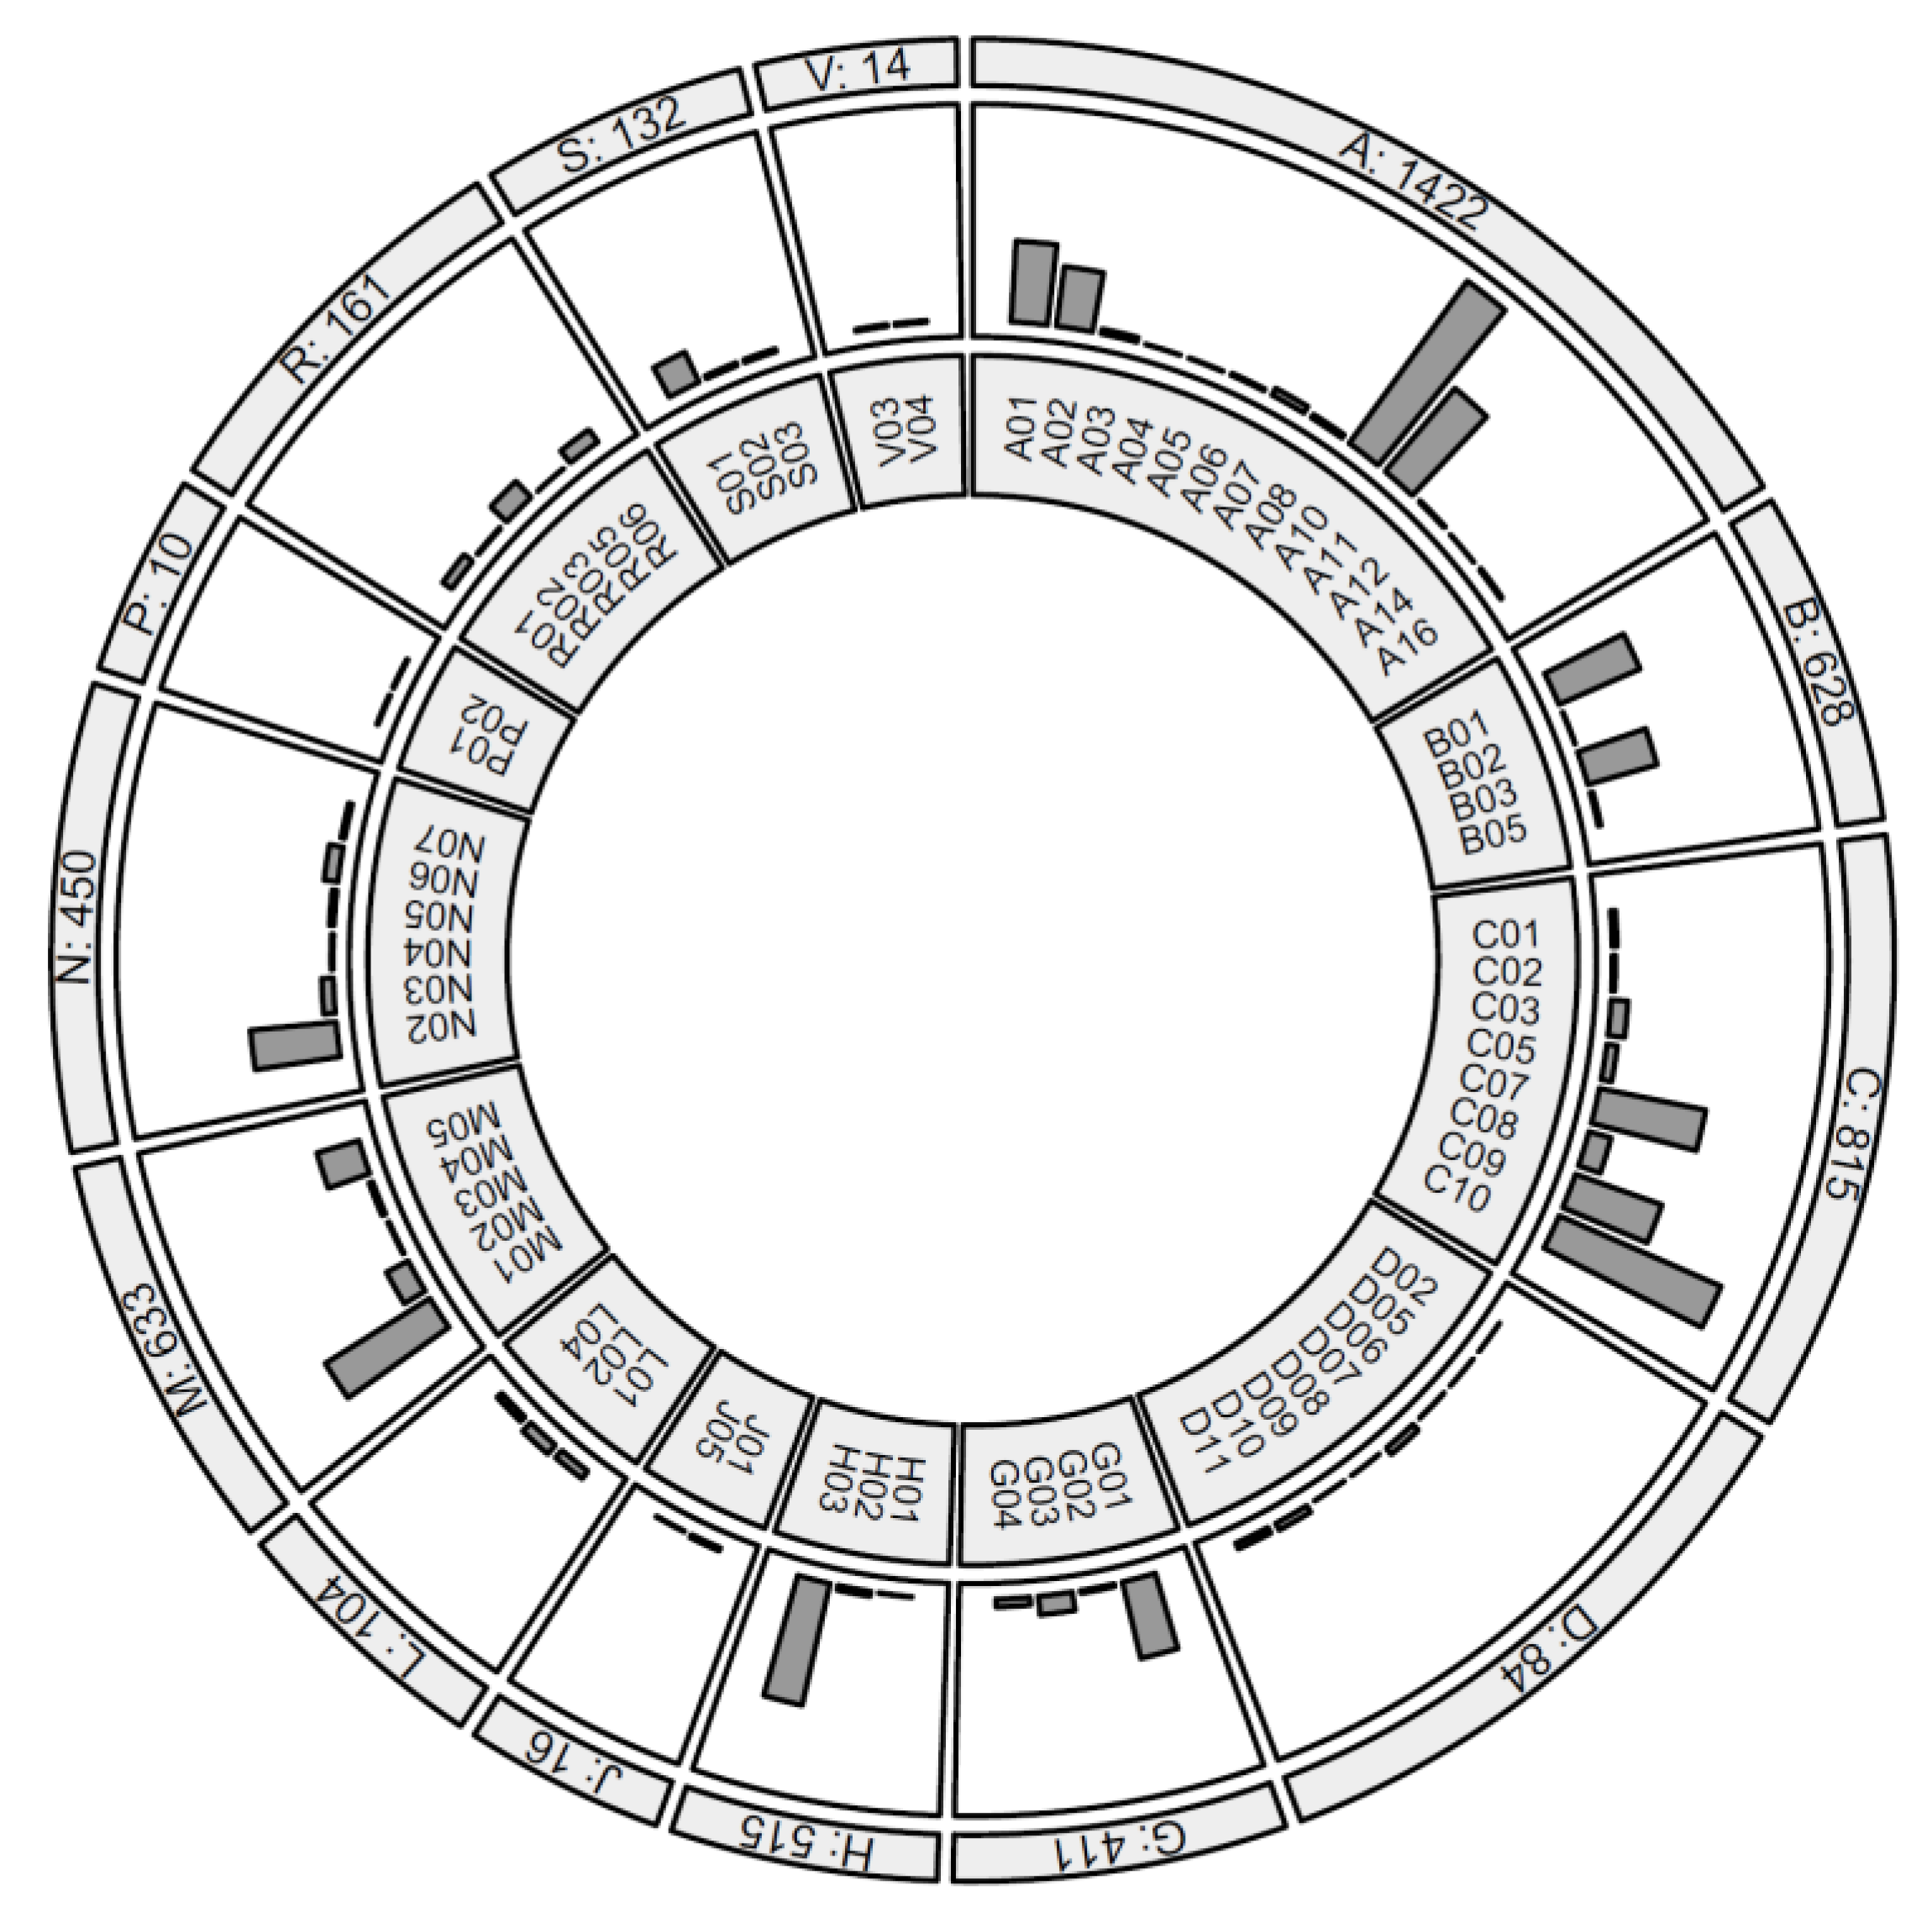
Figure 2.
Counts of drugs taken by 6000 QBB participants, ordered by ATC therapeutic subgroup. Subgroups with over 100 counts are: A10:DRUGS USED IN DIABETES (795), C10:LIPID MODIFYING AGENTS (700), H03:THYROID THERAPY (495), M01:ANTIINFLAMMATORY AND ANTIRHEUMATIC PRODUCTS (488), A11:VITAMINS (430), C07:BETA BLOCKING AGENTS (430), C09:AGENTS ACTING ON THE RENIN-ANGIOTENSIN SYSTEM (363), B01:ANTITHROMBOTIC AGENTS (350), N02:ANALGESICS (341), A01:STOMATOLOGICAL PREPARATIONS (321), G01:GYNECOLOGICAL ANTIINFECTIVES AND ANTISEPTICS (312), B03:ANTIANEMIC PREPARATIONS (285), A02:DRUGS FOR ACID RELATED DISORDERS (239), M05:DRUGS FOR TREATMENT OF BONE DISEASES (174), S01:OPHTHALMOLOGICALS (132). See
Supplementary Table S1 for all subgroup definitions and all counts.
Figure 3.
Frequencies (by age and sex group) of the twelve most frequently reported drug classes (ATC code level 2) by age and sex; percentages of males (cyan) and females (red) who reported at least one drug of the indicated classes in their respective age group, computed based on the responses of 6000 participants of QBB.
Figure 4.
Overlap between individuals who gave an affirmative answer to the question of whether they were treated for a given disorder with tablets (green), who self-reported the use of at least one medication with an indication for the given disorder (orange), and who provided a blood sample with at least one metabolite of a drug with an indication for the given disorder detected (blue); the given disorders were hypertension (a), dyslipidemia (b), and diabetes (c).
Figure 5.
Overlap between acetaminophen metabolites detected in blood. Venn diagrams for the nine acetaminophen (AC) metabolites detected in this study, grouped by metabolites specific to the CYP, SULT, and UGT pathways, resp. (a–c), and for the most frequently detected metabolite from each pathway (d); all nine AC metabolites were detected together in 310 (11.0%) samples, and at least one AC metabolite was detected in 1255 (44.7%) samples.
Figure 6.
Histogram of metformin counts (batch-corrected, log-scaled, relative units) in individuals who self-reported using metformin (blue) and individuals who were unlikely to use metformin (red); Of 571 individuals who are unlikely to take metformin, 431 (75.5%) have no metformin detected in their blood samples, whereas 140 (24.5%) do; of the 220 individuals who self-report using metformin, 203 (92.3%) have metformin detected in their blood and only 17 (7.7%) do not.
Table 1.
Demographics of the 6000 QBB participants who were included in this study. Except for HbA1c and BMI, all information is self-reported using questionnaires dispensed at baseline.
| Variable | Value(s) |
|---|
| Mean age in years (s.d.) | 39.7 (12.8) |
| Female (%) | 3412 (56.9%) |
| Mean BMI in kg/m2 (s.d.) | 28.9 (6.2) |
| Mean HbA1c % (s.d.) | 5.7 (1.26) |
| Diagnosed with diabetes (%) | 1041 (17.4%) |
| Treated for diabetes with tablets (%) | 717 (12.0%) |
| Treated for diabetes with insulin (%) | 286 (4.8%) |
| Treated for high cholesterol (%) | 1829 (30.5%) |
| Treated for high cholesterol with tablets (%) | 815 (13.6%) |
| Treated for high blood pressure (%) | 966 (16.1%) |
| Treated for high blood pressure with tablets (%) | 652 (10.9%) |
| Regular smoker (%) | 602 (10.0%) |
| Reported at least one over-the-counter or prescription drug (%) | 3086 (51.4%) |
Table 2.
Number of self-reported medication by ATC anatomical main group, based on responses of 6000 QBB participants, whereof 3086 reported to take at least one kind of medication.
| ID | Anatomical Main Group | N 1 |
|---|
| A 1 | ALIMENTARY TRACT AND METABOLISM | 1422 |
| B | BLOOD AND BLOOD FORMING ORGANS | 628 |
| C | CARDIOVASCULAR SYSTEM | 815 |
| D | DERMATOLOGICALS | 84 |
| G | GENITO URINARY SYSTEM AND SEX HORMONES | 411 |
| H | SYSTEMIC HORMONAL PREPARATIONS, EXCL. SEX HORMONES AND INSULINS | 515 |
| J | ANTIINFECTIVES FOR SYSTEMIC USE | 16 |
| L | ANTINEOPLASTIC AND IMMUNOMODULATING AGENTS | 104 |
| M | MUSCULO-SKELETAL SYSTEM | 633 |
| N | NERVOUS SYSTEM | 450 |
| P | ANTIPARASITIC PRODUCTS, INSECTICIDES AND REPELLENTS | 10 |
| R | RESPIRATORY SYSTEM | 161 |
| S | SENSORY ORGANS | 132 |
| V | VARIOUS | 14 |
Table 3.
Self-reported medication (N self) and drug metabolites detected in blood (N blood); The total number of samples in this analysis was N = 2807. Included are all mutual best-hits with Bonferroni-significant associations (Fisher test,
p-value < 0.05/N-self-reported/N-detected = 0.05/394/119 = 1.1 × 10
−6). All pairwise associations that reached nominal significance (
p < 0.05) are in
Supplementary Table S4.
Self-Reported
Medication | N
Self | Metabolite Detected
in Blood | N
Blood | p-Value (Fisher) | Self
Only | Blood Only | Both |
|---|
| metformin | 220 | metformin | 846 | 8.7 × 10−92 | 17 | 643 | 203 |
| atorvastatin | 90 | o-hydroxyatorvastatin | 110 | 3.1 × 10−76 | 27 | 47 | 63 |
| valsartan | 40 | valsartan | 171 | 7.0 × 10−46 | 2 | 133 | 38 |
| losartan | 24 | losartan | 27 | 3.7 × 10−38 | 5 | 8 | 19 |
| gliclazide | 47 | gliclazide | 468 | 6.2 × 10⁻³⁰ | 4 | 425 | 43 |
| indapamide | 15 | indapamide | 34 | 9.2 × 10⁻²⁵ | 2 | 21 | 13 |
| warfarin | 9 | 10-hydroxywarfarin | 13 | 2.4 × 10⁻²³ | 0 | 4 | 9 |
| atenolol | 18 | atenolol | 140 | 4.8 × 10⁻²² | 1 | 123 | 17 |
| acetylsalicylic acid | 111 | salicyluric
glucuronide | 1292 | 2.5 × 10⁻²¹ | 13 | 1194 | 98 |
| escitalopram | 10 | citalopram/escitalopram | 31 | 5.4 × 10⁻²¹ | 0 | 21 | 10 |
| esomeprazole | 26 | omeprazole | 67 | 7.4 × 10⁻²¹ | 10 | 51 | 16 |
| glimepiride | 18 | glimepiride | 25 | 1.7 × 10⁻¹⁷ | 8 | 15 | 10 |
| topiramate | 7 | topiramate | 20 | 2.9 × 10⁻¹⁶ | 0 | 13 | 7 |
| pantoprazole | 12 | pantoprazole | 88 | 4.0 × 10⁻¹² | 3 | 79 | 9 |
| celecoxib | 18 | celecoxib | 58 | 1.5 × 10⁻¹¹ | 9 | 49 | 9 |
| pregabalin | 7 | pregabalin | 16 | 6.3 × 10⁻¹¹ | 2 | 11 | 5 |
| fexofenadine | 12 | fexofenadine | 57 | 7.2 × 10⁻¹⁰ | 5 | 50 | 7 |
| perindopril | 12 | perindopril | 14 | 1.1 × 10⁻⁹ | 7 | 9 | 5 |
| pioglitazone | 5 | hydroxypioglitazone | 23 | 1.7 × 10⁻⁸ | 1 | 19 | 4 |
| acetaminophen | 17 | 2-methoxyacetaminophen
glucuronide | 419 | 2.1 × 10⁻⁸ | 4 | 406 | 13 |
| montelukast | 5 | montelukast | 26 | 2.9 × 10⁻⁸ | 1 | 22 | 4 |
| repaglinide | 2 | repaglinide | 3 | 7.6 × 10⁻⁷ | 0 | 1 | 2 |
Table 4.
Nine metabolites of the drug paracetamol (acetaminophen) were individually detected in between 370 and 1102 of the 2807 blood samples, with a joint detection of all nine metabolites in 310 samples. LC/MS characteristics of the detected molecules are provided together with the biochemical detoxification pathway in which the respective molecules are involved (see text).
| Biochemical | N Detected
(% of 2807) | N Overlap
(% of 17) | LC/MS
Mode | Retention
Index | Mass | Pathway |
|---|
4-acetaminophen
sulfate | 1102 (39.3%) | 16 (98.5%) | Neg | 1792 | 230.01287 | SULT |
4-acetamidophenyl
glucuronide | 938 (33.4%) | 16 (98.2%) | Neg | 1400 | 326.08814 | UGT |
| 4-acetamidophenol | 708 (25.2%) | 15 (97.6%) | Neg | 2173.7 | 150.05605 | Paracetamol |
3-(methylthio)
acetaminophen sulfate * | 621 (22.1%) | 14 (97.3%) | Neg | 2265 | 276.00059 | CYP/SULT |
2-hydroxyacetaminophen
sulfate * | 575 (20.5%) | 14 (97.1%) | Neg | 1674 | 246.00778 | SULT |
2-methoxyacetaminophen
glucuronide * | 419 (14.9%) | 13 (96.0%) | Neg | 1633 | 356.0987 | UGT |
2-methoxyacetaminophen
sulfate * | 411 (14.6%) | 12 (95.9%) | Neg | 1949 | 260.02343 | SULT |
3-(N-acetyl-L-cystein-S-yl)
acetaminophen | 370 (13.2%) | 11 (95.5%) | Neg | 2094 | 311.07072 | CYP |
3-(cystein-S-yl)
acetaminophen * | 414 (14.7%) | 11 (96.0%) | Pos Early | 2420 | 271.07471 | CYP |
Table 5.
Possible reasons for the apparent under- and over-detection of drug metabolites.
| Drug Metabolite | Possible Reason | Example |
|---|
| Non- identification | The metabolite is not
in the platform library | Metabolites of unknown identity,
X – 17348 with esomeprazole |
| Non-detection | The metabolite is not captured
by the current LC/MS protocol | Rosuvastatin, reported by
141/6000 participants, but not detected |
| Under-detection | Blood levels below level of detection (metabolite half-life, timing of sampling) | Atorvastatin |
| Over-detection | Medication is taken, but not reported | Painkillers, anti-depressants |
| Over-detection | Carry-over from other samples | Not observed |
| Over-detection | Misidentification of other molecules
(overlapping signals) | Metformin |
| Ubiquitous | Metabolite is endogenous, supplementation by medication cannot be determined by presence/absence of detection | Levothyroxine,
reported by 492/6000 participants |
| Publisher’s Note: MDPI stays neutral with regard to jurisdictional claims in published maps and institutional affiliations. |
© 2022 by the authors. Licensee MDPI, Basel, Switzerland. This article is an open access article distributed under the terms and conditions of the Creative Commons Attribution (CC BY) license (https://creativecommons.org/licenses/by/4.0/).


 ,
, 


