
Comparative Metabolite Profiling of Wheat Cultivars (Triticum aestivum) Reveals Signatory Markers for Resistance and Susceptibility to Stripe Rust and Aluminium (Al3+) Toxicity

 ,
,  , , , and
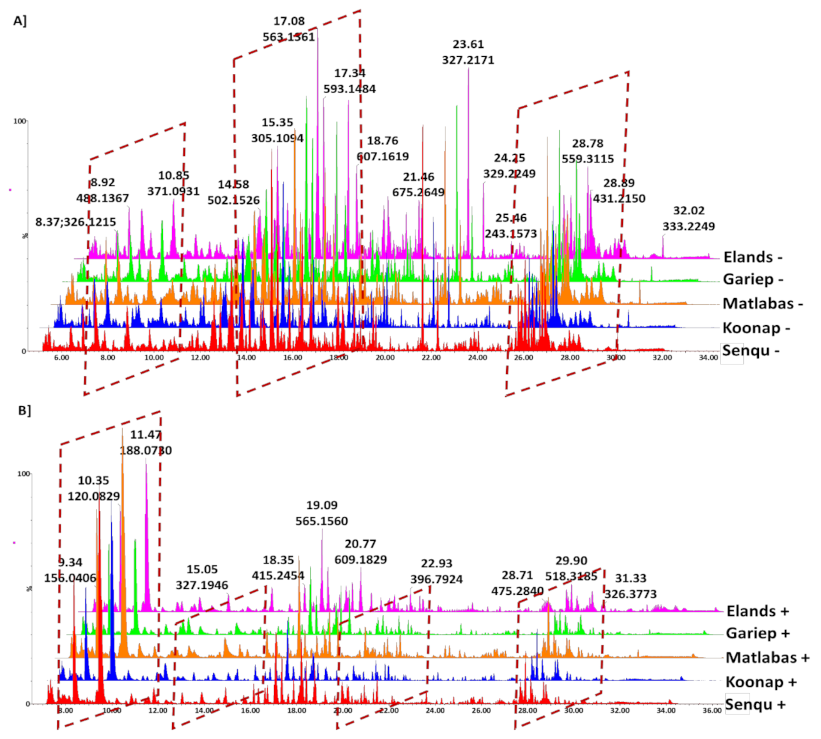
Abstract
:1. Introduction
2. Results
2.1. Analysis of Chromatographic and Mass Spectrometric Data for Differential Detection of Metabolites in Wheat Cultivars
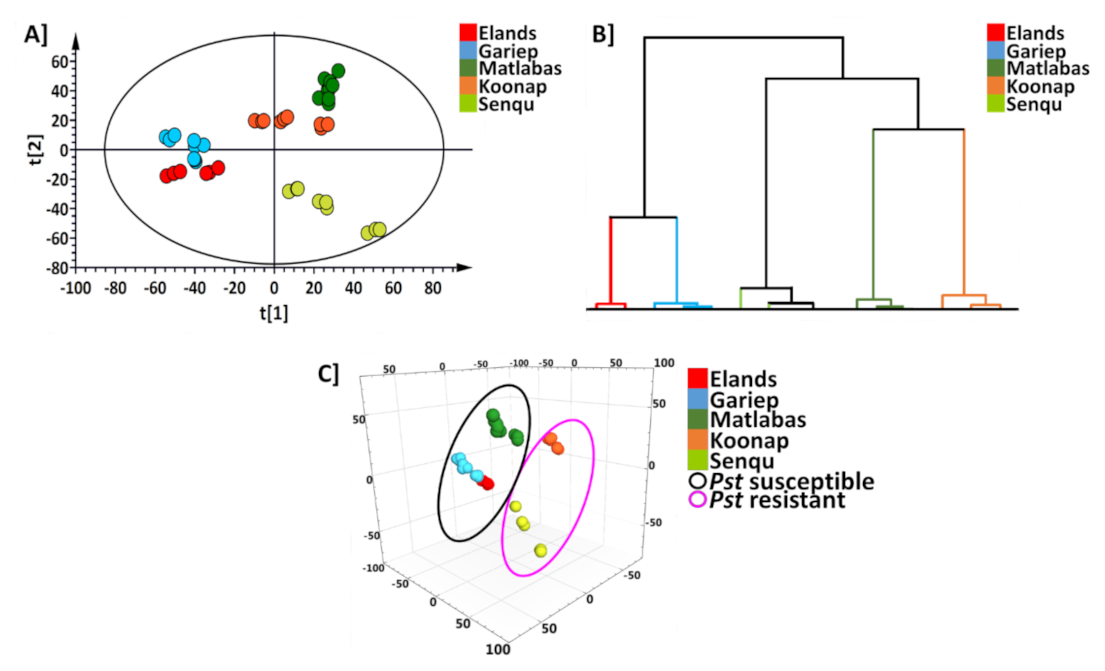
2.2. Chemometric and Statistical Data Analysis for Metabolite Profiling of Wheat Cultivars
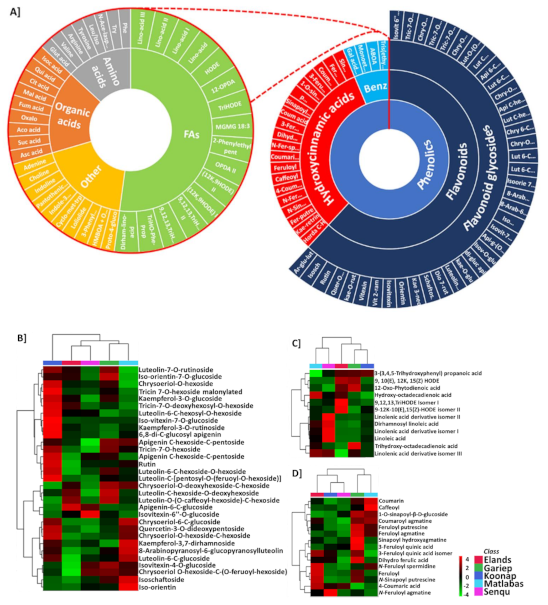
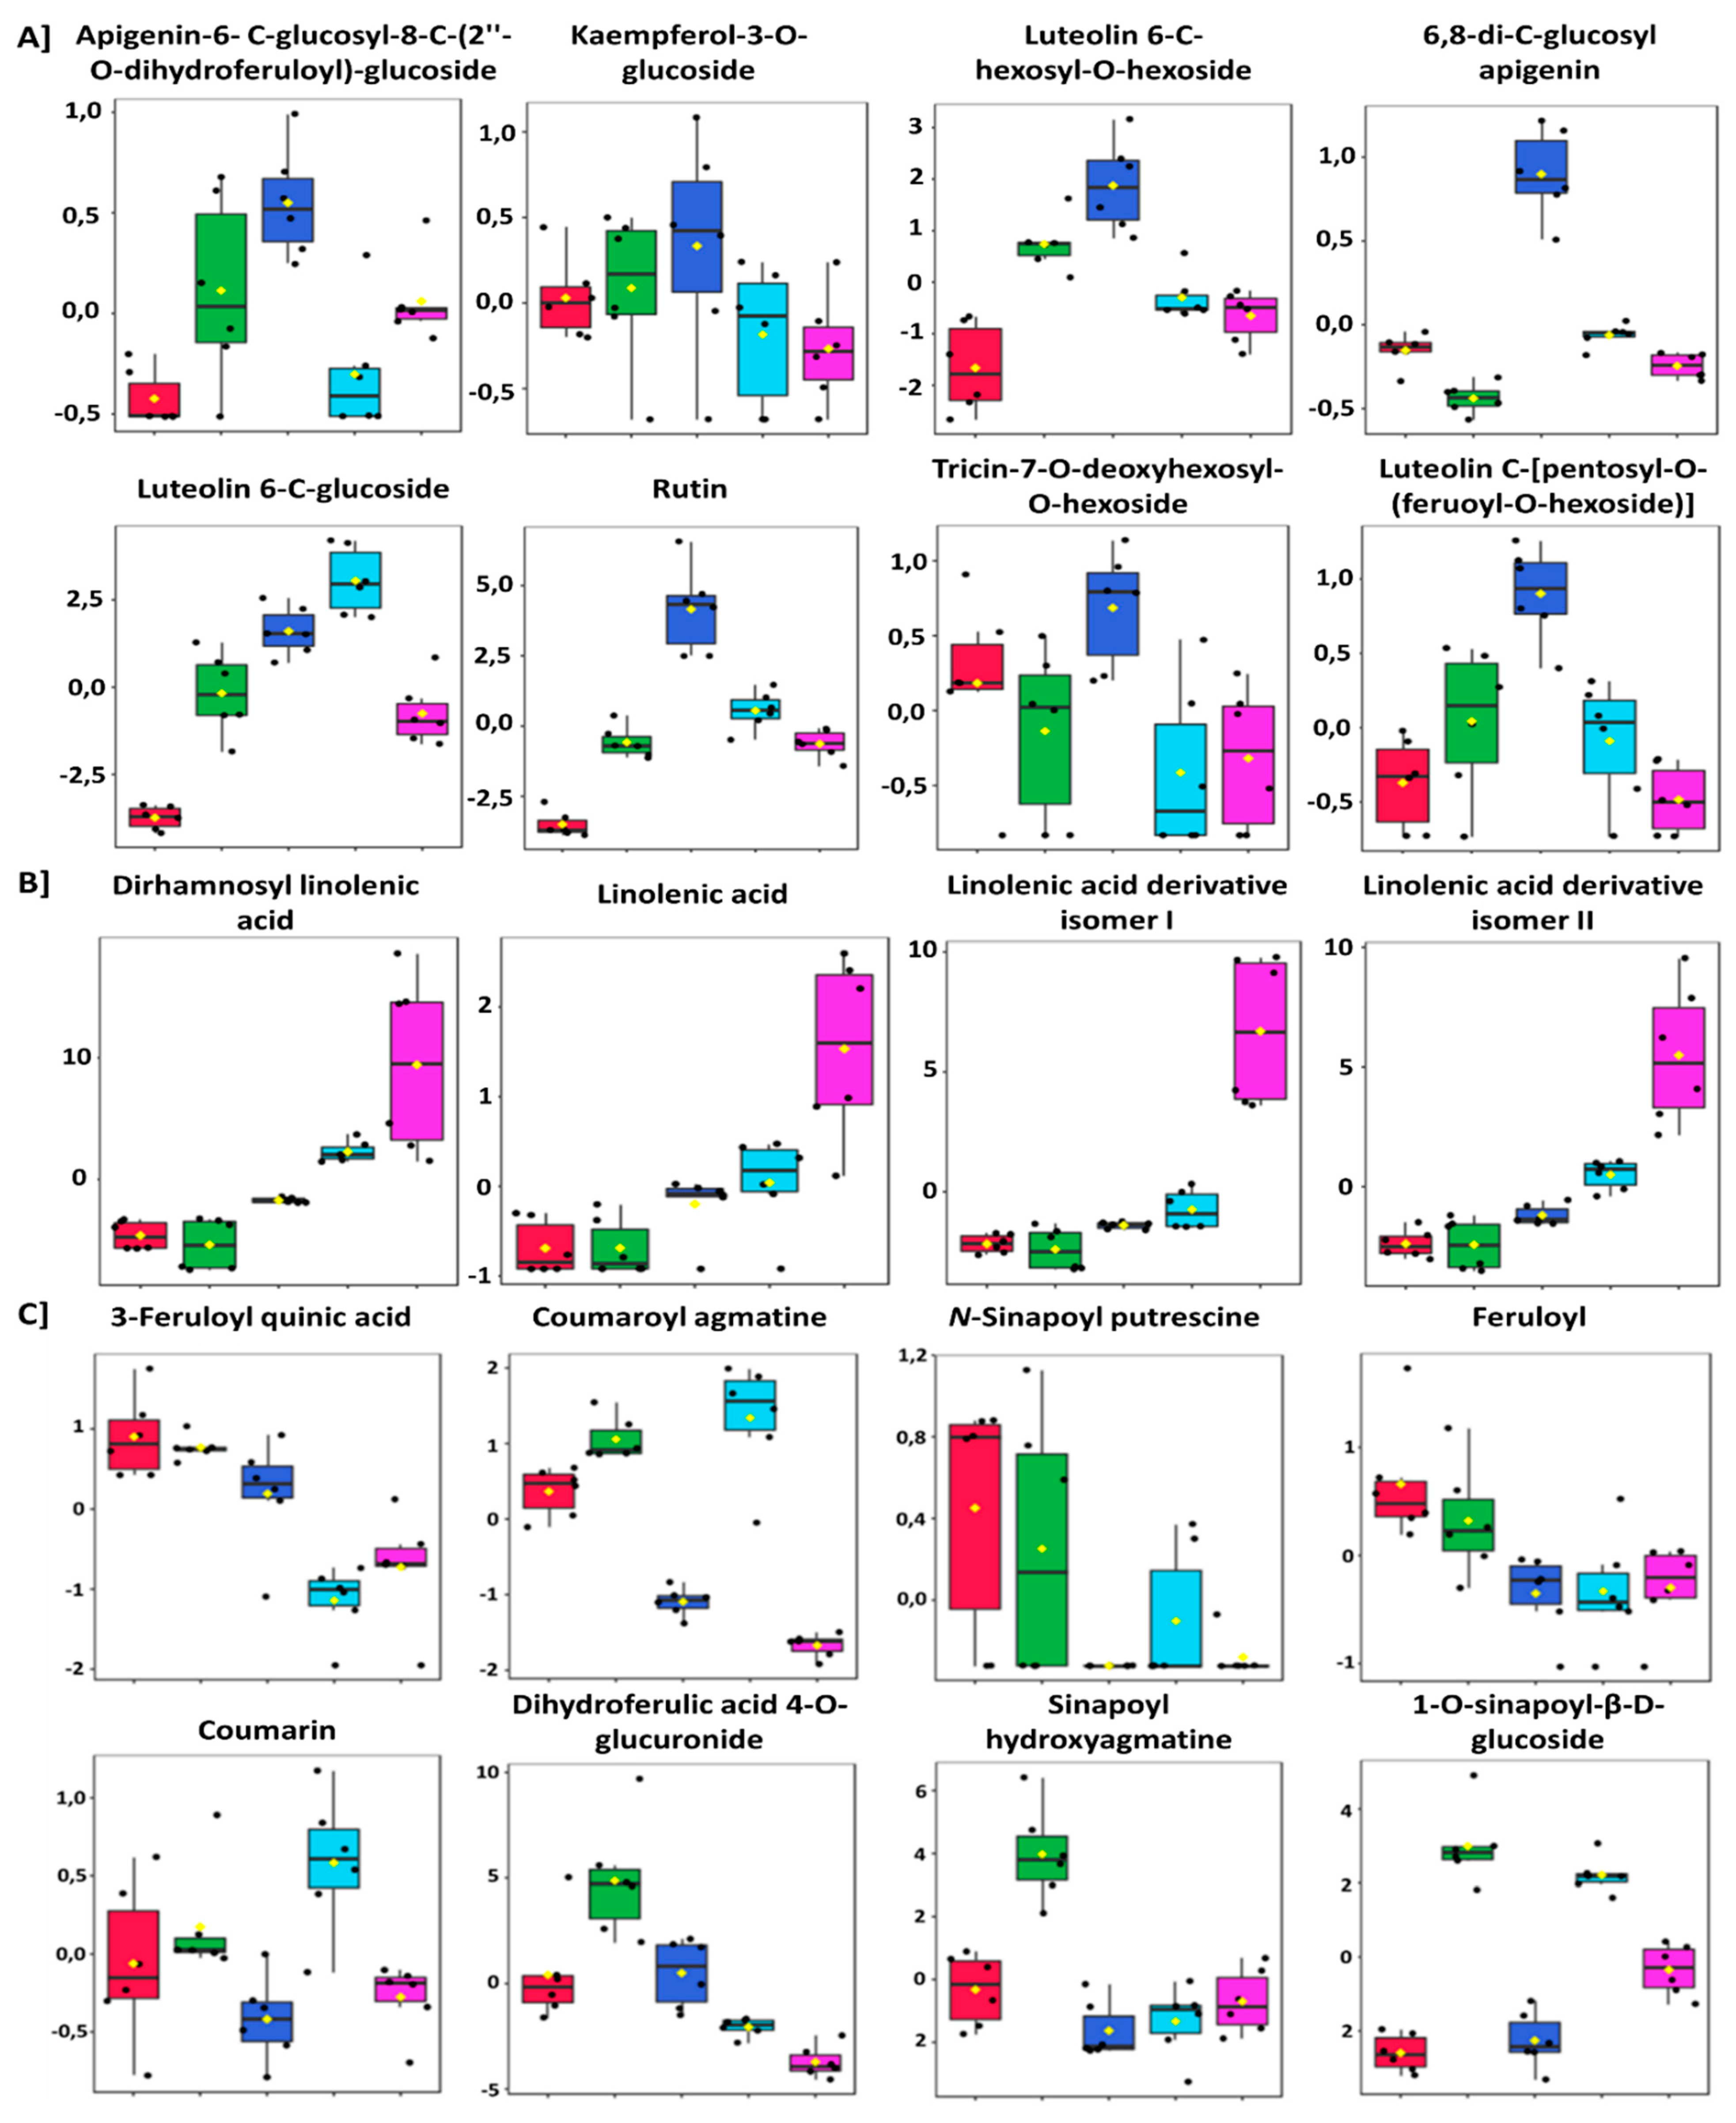
2.3. Evaluation of Differential Metabolic Profiles of Wheat Cultivars
3. Discussion
4. Materials and Methods
4.1. Wheat Cultivation
4.2. Plant Harvesting and Metabolite Extraction
4.3. Metabolomics-Based Data Acquisition, Analysis, and Interpretation
4.3.1. Untargeted Metabolomics Study with UHPLC-MS Analysis
4.3.2. Data Processing and Multivariate Data Analysis (MVDA)
5. Conclusions
Supplementary Materials
Author Contributions
Funding
Institutional Review Board Statement
Informed Consent Statement
Data Availability Statement
Acknowledgments
Conflicts of Interest
References
- Shewry, P.R. Wheat. J. Exp. Bot. 2009, 60, 1537–1553. [Google Scholar] [CrossRef]
- Rady, M.M.; Ahmed, S.M.A.; Seif El-Yazal, M.A.; Taie, H.A.A. Alleviation of cadmium stress in wheat by polyamines. In Cadmium Tolerance in Plants: Agronomic, Molecular, Signalling, and Omic Approaches; Elsevier Inc.: Amsterdam, The Netherlands, 2019; Chapter 17; pp. 463–496. [Google Scholar] [CrossRef]
- Lukow, O.M.; McVetty, P.B.E. Grain production and consumption | Cereal grains in North America. In Encyclopaedia of Grain Science; Academic Press: Kidlington, UK, 2004; pp. 94–106. [Google Scholar] [CrossRef]
- Nhemachena, C.R.; Kirsten, J. A historical assessment of sources and uses of wheat varietal innovations in South Africa. South Afr. J. Sci. 2017, 113, 1–8. [Google Scholar] [CrossRef]
- Matthews, S.B.; Santra, M.; Mensack, M.M.; Wolfe, P.; Byrne, P.F.; Thompson, H.J. Metabolite Profiling of a Diverse Collection of Wheat Lines Using Ultraperformance Liquid Chromatography Coupled with Time-of-Flight Mass Spectrometry. PLoS ONE 2012, 7, e44179. [Google Scholar] [CrossRef] [PubMed] [Green Version]
- Jankielsohn, A.; Miles, C. How do older wheat cultivars compare to modern wheat cultivars currently on the market in South Africa? J. Hortic. Sci. Res. 2017, 1, 42–47. [Google Scholar] [CrossRef]
- Shamuyarira, K.W.; Shimelis, H.; Tapera, T.; Tsilo, T.J. Genetic Advancement of Newly Developed Wheat Populations Under Drought-Stressed and Non-Stressed Conditions. J. Crop Sci. Biotechnol. 2019, 22, 169–176. [Google Scholar] [CrossRef]
- Tadele, Z. Raising Crop Productivity in Africa through Intensification. Agronomy 2017, 7, 22. [Google Scholar] [CrossRef]
- Sultan, B.; Defrance, D.; Iizumi, T. Evidence of crop production losses in West Africa due to historical global warming in two crop models. Sci. Rep. 2019, 9, 12834. [Google Scholar] [CrossRef] [Green Version]
- Miedaner, T.; Juroszek, P. Climate change will influence disease resistance breeding in wheat in Northwestern Europe. Theor. Appl. Genet. 2021, 134, 1771–1785. [Google Scholar] [CrossRef] [PubMed]
- Farhangfar, S.; Bannayan, M.; Khazaei, H.R.; Baygi, M.M. Vulnerability assessment of wheat and maize production affected by drought and climate change. Int. J. Disaster Risk Reduct. 2015, 13, 37–51. [Google Scholar] [CrossRef]
- Sasson, A. Food security for Africa: An urgent global challenge. Agric. Food Secur. 2012, 1, 2. [Google Scholar] [CrossRef] [Green Version]
- Gassner, A.; Harris, D.; Mausch, K.; Terheggen, A.; Lopes, C.; Finlayson, R.; Dobie, P. Poverty eradication and food security through agriculture in Africa: Rethinking objectives and entry points. Outlook Agric. 2019, 48, 309–315. [Google Scholar] [CrossRef] [Green Version]
- Smit, H.; Tolmay, V.; Barnard, A.; Jordaan, J.; Koekemoer, F.; Otto, W.; Pretorius, Z.; Purchase, J.; Tolmay, J. An overview of the context and scope of wheat (Triticum aestivum) research in South Africa from 1983 to 2008. S. Afr. J. Plant Soil 2010, 27, 81–96. [Google Scholar] [CrossRef]
- Carmona, M.; Sautua, F.; Pérez-Hérnandez, O.; Reis, E.M. Role of Fungicide Applications on the Integrated Management of Wheat Stripe Rust. Front. Plant Sci. 2020, 11, 733. [Google Scholar] [CrossRef]
- Shahin, A.A. Occurrence of new races and virulence changes of the wheat stripe rust pathogen (Puccinia striiformis f. sp. tritici) in Egypt. Arch. Phytopathol. Plant Prot. 2020, 53, 552–569. [Google Scholar] [CrossRef]
- Rahman, A.; Lee, S.-H.; Ji, H.C.; Kabir, A.H.; Jones, C.S.; Lee, K.-W. Importance of Mineral Nutrition for Mitigating Aluminum Toxicity in Plants on Acidic Soils: Current Status and Opportunities. Int. J. Mol. Sci. 2018, 19, 3073. [Google Scholar] [CrossRef] [Green Version]
- Rahaman, M.; Chen, D.; Egillani, Z.; Eklukas, C.; Echen, M. Advanced phenotyping and phenotype data analysis for the study of plant growth and development. Front. Plant Sci. 2015, 6, 619. [Google Scholar] [CrossRef] [Green Version]
- Lin, Z.; Zhang, X.; Yang, X.; Li, G.; Tang, S.; Wang, S.; Ding, Y.; Liu, Z. Proteomic analysis of proteins related to rice grain chalkiness using iTRAQ and a novel comparison system based on a notched-belly mutant with white-belly. BMC Plant Biol. 2014, 14, 163. [Google Scholar] [CrossRef] [Green Version]
- Parray, J.A.; Shameem, N. Metabolomics for crop improvement: Quality and productivity. In Sustainable Agriculture Advances in Plant Metabolome and Microbiome; Elsevier Inc.: Amsterdam, The Netherlands, 2020; Chapter 1; pp. 1–42. [Google Scholar]
- Djande, C.Y.H.; Piater, L.A.; Steenkamp, P.A.; Tugizimana, F.; Dubery, I.A. A Metabolomics Approach and Chemometric Tools for Differentiation of Barley Cultivars and Biomarker Discovery. Metabolites 2021, 11, 578. [Google Scholar] [CrossRef] [PubMed]
- Großkinsky, D.K.; Svensgaard, J.; Christensen, S.; Roitsch, T. Plant phenomics and the need for physiological phenotyping across scales to narrow the genotype-to-phenotype knowledge gap. J. Exp. Bot. 2015, 66, 5429–5440. [Google Scholar] [CrossRef] [Green Version]
- Jaradat, A.A. Breeding oilseed crops for climate change. In Breeding Oilseed Crops for Sustainable Production; Gupta, S.K., Ed.; Elsevier Inc.: Amsterdam, The Netherlands, 2016. [Google Scholar]
- Fernie, A.R.; Schauer, N. Metabolomics-assisted breeding: A viable option for crop improvement? Trends Genet. 2009, 25, 39–48. [Google Scholar] [CrossRef] [PubMed]
- Gago, J.; Fernie, A.R.; Nikoloski, Z.; Tohge, T.; Martorell, S.; Escalona, J.M.; Ribas-Carbó, M.; Flexas, J.; Medrano, H. Integrative field scale phenotyping for investigating metabolic components of water stress within a vineyard. Plant Methods 2017, 13, 90. [Google Scholar] [CrossRef] [PubMed]
- Lavergne, F.D.; Broeckling, C.D.; Cockrell, D.M.; Haley, S.D.; Peairs, F.B.; Jahn, C.E.; Heuberger, A.L. GC-MS Metabolomics to Evaluate the Composition of Plant Cuticular Waxes for Four Triticum aestivum Cultivars. Int. J. Mol. Sci. 2018, 19, 249. [Google Scholar] [CrossRef] [Green Version]
- Liigand, P.; Kaupmees, K.; Haav, K.; Liigand, J.; Leito, I.; Girod, M.; Antoine, R.; Kruve, A. Think Negative: Finding the Best Electrospray Ionization/MS Mode for Your Analyte. Anal. Chem. 2017, 89, 5665–5668. [Google Scholar] [CrossRef] [Green Version]
- Pretorius, C.; Tugizimana, F.; Steenkamp, P.; Piater, L.; Dubery, I. Metabolomics for Biomarker Discovery: Key Signatory Metabolic Profiles for the Identification and Discrimination of Oat Cultivars. Metabolites 2021, 11, 165. [Google Scholar] [CrossRef]
- Nephali, L.; Piater, L.A.; Dubery, I.A.; Patterson, V.; Huyser, J.; Burgess, K.; Tugizimana, F. Biostimulants for Plant Growth and Mitigation of Abiotic Stresses: A Metabolomics Perspective. Metabolites 2020, 10, 505. [Google Scholar] [CrossRef]
- Zeiss, D.R.; Mhlongo, M.I.; Tugizimana, F.; Steenkamp, P.A.; Dubery, I.A. Comparative Metabolic Phenotyping of Tomato (Solanum lycopersicum) for the Identification of Metabolic Signatures in Cultivars Differing in Resistance to Ralstonia solanacearum. Int. J. Mol. Sci. 2018, 19, 2558. [Google Scholar] [CrossRef] [Green Version]
- Mhlongo, M.; Steenkamp, P.A.; Piater, L.; Madala, N.E.; Dubery, I.A. Profiling of Altered Metabolomic States in Nicotiana tabacum Cells Induced by Priming Agents. Front. Plant Sci. 2016, 7, 1527. [Google Scholar] [CrossRef] [Green Version]
- Metabo Analyst. Available online: https://www.metaboanalyst.ca (accessed on 24 August 2020).
- Sumner, L.W.; Amberg, A.; Barrett, D.; Beale, M.H.; Beger, R.; Daykin, C.A.; Fan, T.W.-M.; Fiehn, O.; Goodacre, R.; Griffin, J.L.; et al. Proposed minimum reporting standards for chemical analysis Chemical Analysis Working Group (CAWG) Metabolomics Standards Initiative (MSI). Metabolomics 2007, 3, 211–221. [Google Scholar] [CrossRef] [PubMed] [Green Version]
- Nigro, D.; Grausgruber, H.; Guzman, C.; Laddomada, B. Phenolic compounds in wheat kernels: Genetic and genomic studies of biosynthesis and regulation. In Wheat Quality for Improving Processing and Human Health; Igrejas, G., Ikeda, T.M., Guzman, C., Eds.; Springer Nature: Basingstoke, UK, 2020; pp. 225–253. [Google Scholar] [CrossRef]
- Žilić, S. Phenolic Compounds of Wheat Their Content, Antioxidant Capacity and Bioaccessibility. MOJ Food Process. Technol. 2016, 2, 00037. [Google Scholar] [CrossRef]
- Laddomada, B.; Caretto, S.; Mita, G. Wheat Bran Phenolic Acids: Bioavailability and Stability in Whole Wheat-Based Foods. Molecules 2015, 20, 15666–15685. [Google Scholar] [CrossRef]
- Pascual, M.B.; El-Azaz, J.; De La Torre, F.N.; Cañas, R.A.; Avila, C.; Cánovas, F.M. Biosynthesis and Metabolic Fate of Phenylalanine in Conifers. Front. Plant Sci. 2016, 7, 1030. [Google Scholar] [CrossRef] [PubMed] [Green Version]
- Delgado, A.M.; Issaoui, M.; Chammem, N. Analysis of Main and Healthy Phenolic Compounds in Foods. J. AOAC Int. 2019, 102, 1356–1364. [Google Scholar] [CrossRef]
- Yang, D.; Wang, T.; Long, M.; Li, P. Quercetin: Its Main Pharmacological Activity and Potential Application in Clinical Medicine. Oxid. Med. Cell. Longev. 2020, 2020, 8825387. [Google Scholar] [CrossRef] [PubMed]
- Groenbaek, M.; Tybirk, E.; Neugart, S.; Sundekilde, U.; Schreiner, M.; Kristensen, H.L. Flavonoid Glycosides and Hydroxycinnamic Acid Derivatives in Baby Leaf Rapeseed From White and Yellow Flowering Cultivars With Repeated Harvest in a 2-Years Field Study. Front. Plant Sci. 2019, 10, 355. [Google Scholar] [CrossRef]
- Vuolo, M.M.; Lima, S.V.; Marostica Junior, M.R. Phenolic compounds: Structure, classification, and antioxidant power. In Bioactive Compounds; Campos, M.R.S., Ed.; Elsevier Inc.: Amsterdam, The Netherlands, 2019. [Google Scholar]
- Beneduci, A.; Furia, E.; Russo, N.; Marino, T. Complexation behaviour of caffeic, ferulic and p-coumaric acids towards aluminium cations: A combined experimental and theoretical approach. New J. Chem. 2017, 41, 5182–5190. [Google Scholar] [CrossRef]
- Coale, M.J. The Economic Benefits of the South African Agricultural Research Council’s Wheat Breeding Program: 1992–2015. Master’s Thesis, University of Arkansas, Fayetteville, AR, USA, 2017. Available online: http://scholarworks.uark.edu/etd/2600 (accessed on 3 June 2021).
- Liu, S.; Zhao, L.; Liao, Y.; Luo, Z.; Wang, H.; Wang, P.; Zhao, H.; Xia, J.; Huang, C. Dysfunction of the 4-coumarate:coenzyme A ligase 4CL4 impacts aluminum resistance and lignin accumulation in rice. Plant J. 2020, 104, 1233–1250. [Google Scholar] [CrossRef]
- Barceló, J.; Poschenrieder, C. Fast root growth responses, root exudates, and internal detoxification as clues to the mechanisms of aluminium toxicity and resistance: A review. Environ. Exp. Bot. 2002, 48, 75–92. [Google Scholar] [CrossRef]
- Kidd, P.; Llugany, M.; Poschenrieder, C.; Gunsé, B.; Barceló, J. The role of root exudates in aluminium resistance and silicon-induced amelioration of aluminium toxicity in three varieties of maize (Zea mays L.). J. Exp. Bot. 2001, 52, 1339–1352. [Google Scholar] [CrossRef] [Green Version]
- Ferreyra, M.L.F.; Rius, S.P.; Casati, P. Flavonoids: Biosynthesis, biological functions, and biotechnological applications. Front. Plant Sci. 2012, 3, 222. [Google Scholar] [CrossRef] [Green Version]
- Gogoi, R.; Singh, D.V.; Srivastava, K.D. Phenols as a biochemical basis of resistance in wheat against Karnal bunt. Plant Pathol. 2001, 50, 470–476. [Google Scholar] [CrossRef]
- Rakshit, S.; Mishra, S.K.; Dasgupta, S.K.; Sharma, B. Differential induction of chitinase in powdery mildew resistant and susceptible lines of pea (Pisum sativum L.) in response to powdery mildew infection. Ann. Agric. Res. 1999, 20, 103. [Google Scholar]
- Izydorczyk, M.S. Arabinoxylans. In Handbook of Hydrocolloids, 2nd ed.; Phillips, G.O., Williams, P.A., Eds.; Woodhead Publishing Limited: Sawston, UK, 2009; pp. 653–692. [Google Scholar]
- Izydorczyk, M.; Nam, S.; Sharma, A.; Kletke, J. Exploring dry grain fractionation as a means to valorize high-protein malting barley. Cereal Chem. J. 2021, 98, 840–850. [Google Scholar] [CrossRef]
- Kan, A. Characterization of the fatty acid and mineral compositions of selected cereal cultivars from Turkey. Rec. Nat. Prod. 2015, 9, 124–134. [Google Scholar]
- Lim, G.; Singhal, R.; Kachroo, A.; Kachroo, P. Fatty acid–and lipid-mediated signaling in plant defense. Annu. Rev. Phytopathol. 2017, 55, 505–536. [Google Scholar] [CrossRef] [PubMed]
- Walley, J.W.; Kliebenstein, D.J.; Bostock, R.M.; Dehesh, K. Fatty acids and early detection of pathogens. Curr. Opin. Plant Biol. 2013, 16, 520–526. [Google Scholar] [CrossRef] [Green Version]
- Tayeh, C.; Randoux, B.; Laruelle, F.; Bourdon, N.; Renard-Merlierand, D.; Reignault, P. Lipids as markers of induced resistance in wheat: A biochemical and molecular approach. In Lipid Metabolism; Baez, R.V., Ed.; Intech Open: London, UK, 2013; Chapter 15; pp. 363–390. [Google Scholar]
- Madi, L.; Wang, X.; Kobiler, I.; Lichter, A.; Prusky, D. Stress on avocado fruits regulates Δ9-stearoyl ACP desaturase expression, fatty acid composition, antifungal diene level and resistance to Colletotrichum gloeosporioides attack. Physiol. Mol. Plant Pathol. 2003, 62, 277–283. [Google Scholar] [CrossRef]
- Papagianni, M. Scientific Fundamentals of Biotechnology: Organic Acids. In Comprehensive Biotechnology, 2nd ed.; Moo-Young, M., Ed.; Elsevier B.V.: Amsterdam, The Netherlands, 2011; Volume 1, pp. 109–120. [Google Scholar] [CrossRef]
- Martínez-Reyes, I.; Chandel, N.S. Mitochondrial TCA cycle metabolites control physiology and disease. Nat. Commun. 2020, 11, 102. [Google Scholar] [CrossRef] [PubMed] [Green Version]
- Jaiswal, S.K.; Naamala, J.; Dakora, F.D. Nature and mechanisms of aluminium toxicity, tolerance and amelioration in symbiotic legumes and rhizobia. Biol. Fertil. Soils 2018, 54, 309–318. [Google Scholar] [CrossRef]
- Brunner, I.; Sperisen, C. Aluminum exclusion and aluminum tolerance in woody plants. Front. Plant Sci. 2013, 4, 172. [Google Scholar] [CrossRef] [PubMed] [Green Version]
- Delhaize, E.; Ryan, P.R.; Randall, P.J. Aluminum Tolerance in Wheat (Triticum aestivum L.) II. Aluminum-Stimulated Excretion of Malic Acid from Root Apices. Plant Physiol. 1993, 103, 695–702. [Google Scholar] [CrossRef] [Green Version]
- Delhaize, E.; Gruber, B.; Ryan, P.R. The roles of organic anion permeases in aluminium resistance and mineral nutrition. FEBS Lett. 2007, 581, 2255–2262. [Google Scholar] [CrossRef] [Green Version]
- Godzien, J.; Ciborowski, M.; Martínez-Alcázar, M.P.; Samczuk, P.; Kretowski, A.; Barbas, C. Rapid and Reliable Identification of Phospholipids for Untargeted Metabolomics with LC–ESI–QTOF–MS/MS. J. Proteome Res. 2015, 14, 3204–3216. [Google Scholar] [CrossRef]
- Mhlongo, M.I.; Piater, L.A.; Steenkamp, P.A.; Labuschagne, N.; Dubery, I.A. Metabolic Profiling of PGPR-Treated Tomato Plants Reveal Priming-Related Adaptations of Secondary Metabolites and Aromatic Amino Acids. Metabolites 2020, 10, 210. [Google Scholar] [CrossRef] [PubMed]
- Madala, N.E.; Steenkamp, P.A.; Piater, L.A.; Dubery, I.A. Metabolomic analysis of isonitrosoacetophenone-induced perturbations in phenolic metabolism of Nicotiana tabacum cells. Phytochemistry 2013, 94, 82–90. [Google Scholar] [CrossRef] [PubMed]
- Dictionary of Natural Products. Available online: www.dnp.chemnetbase.com (accessed on 14 June 2021).
- PubChem. Available online: https://pubchem.ncbi.nlm.nih.gov/ (accessed on 14 June 2021).
- ChemSpider. Available online: http://www.chemspider.com/ (accessed on 10 June 2021).
- Mareya, C.R.; Tugizimana, F.; Di Lorenzo, F.; Silipo, A.; Piater, L.A.; Molinaro, A.; Dubery, I.A. Adaptive defence-related changes in the metabolome of Sorghum bicolor cells in response to lipopolysaccharides of the pathogen Burkholderia andropogonis. Sci. Rep. 2020, 10, 7626. [Google Scholar] [CrossRef] [PubMed]


Publisher’s Note: MDPI stays neutral with regard to jurisdictional claims in published maps and institutional affiliations. |
© 2022 by the authors. Licensee MDPI, Basel, Switzerland. This article is an open access article distributed under the terms and conditions of the Creative Commons Attribution (CC BY) license (https://creativecommons.org/licenses/by/4.0/).
Share and Cite
Mashabela, M.D.; Piater, L.A.; Steenkamp, P.A.; Dubery, I.A.; Tugizimana, F.; Mhlongo, M.I. Comparative Metabolite Profiling of Wheat Cultivars (Triticum aestivum) Reveals Signatory Markers for Resistance and Susceptibility to Stripe Rust and Aluminium (Al3+) Toxicity. Metabolites 2022, 12, 98. https://doi.org/10.3390/metabo12020098
Mashabela MD, Piater LA, Steenkamp PA, Dubery IA, Tugizimana F, Mhlongo MI. Comparative Metabolite Profiling of Wheat Cultivars (Triticum aestivum) Reveals Signatory Markers for Resistance and Susceptibility to Stripe Rust and Aluminium (Al3+) Toxicity. Metabolites. 2022; 12(2):98. https://doi.org/10.3390/metabo12020098
Chicago/Turabian StyleMashabela, Manamele D., Lizelle A. Piater, Paul A. Steenkamp, Ian A. Dubery, Fidele Tugizimana, and Msizi I. Mhlongo. 2022. "Comparative Metabolite Profiling of Wheat Cultivars (Triticum aestivum) Reveals Signatory Markers for Resistance and Susceptibility to Stripe Rust and Aluminium (Al3+) Toxicity" Metabolites 12, no. 2: 98. https://doi.org/10.3390/metabo12020098