
Body Weight Gain Is Associated with the Disease Stage in Advanced Amyotrophic Lateral Sclerosis with Invasive Ventilation

 , , ,
, , ,
Abstract
:1. Introduction
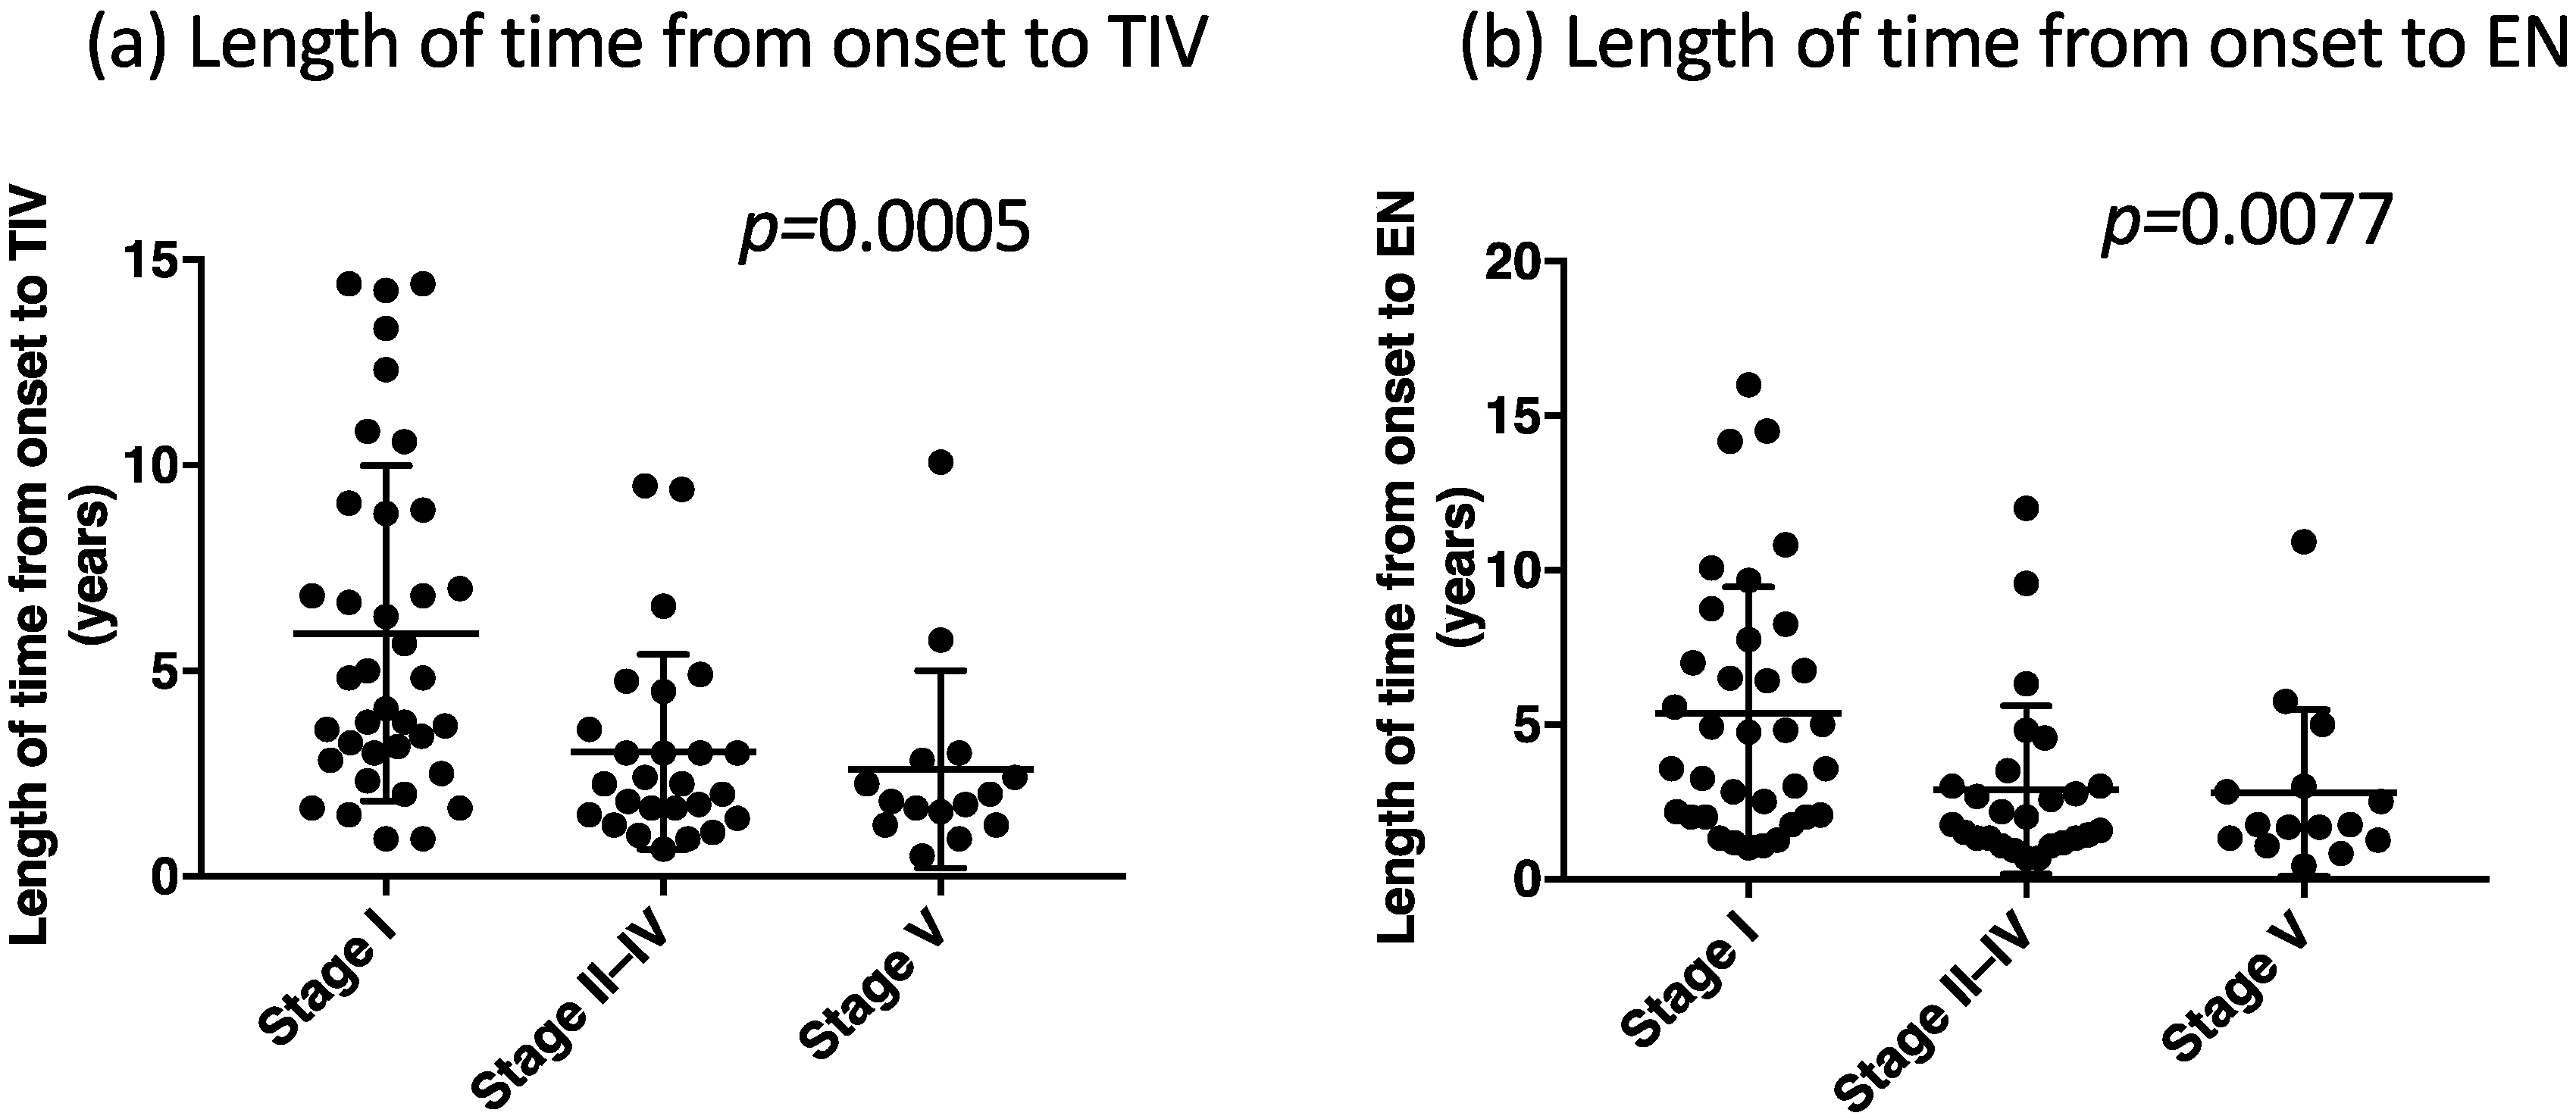
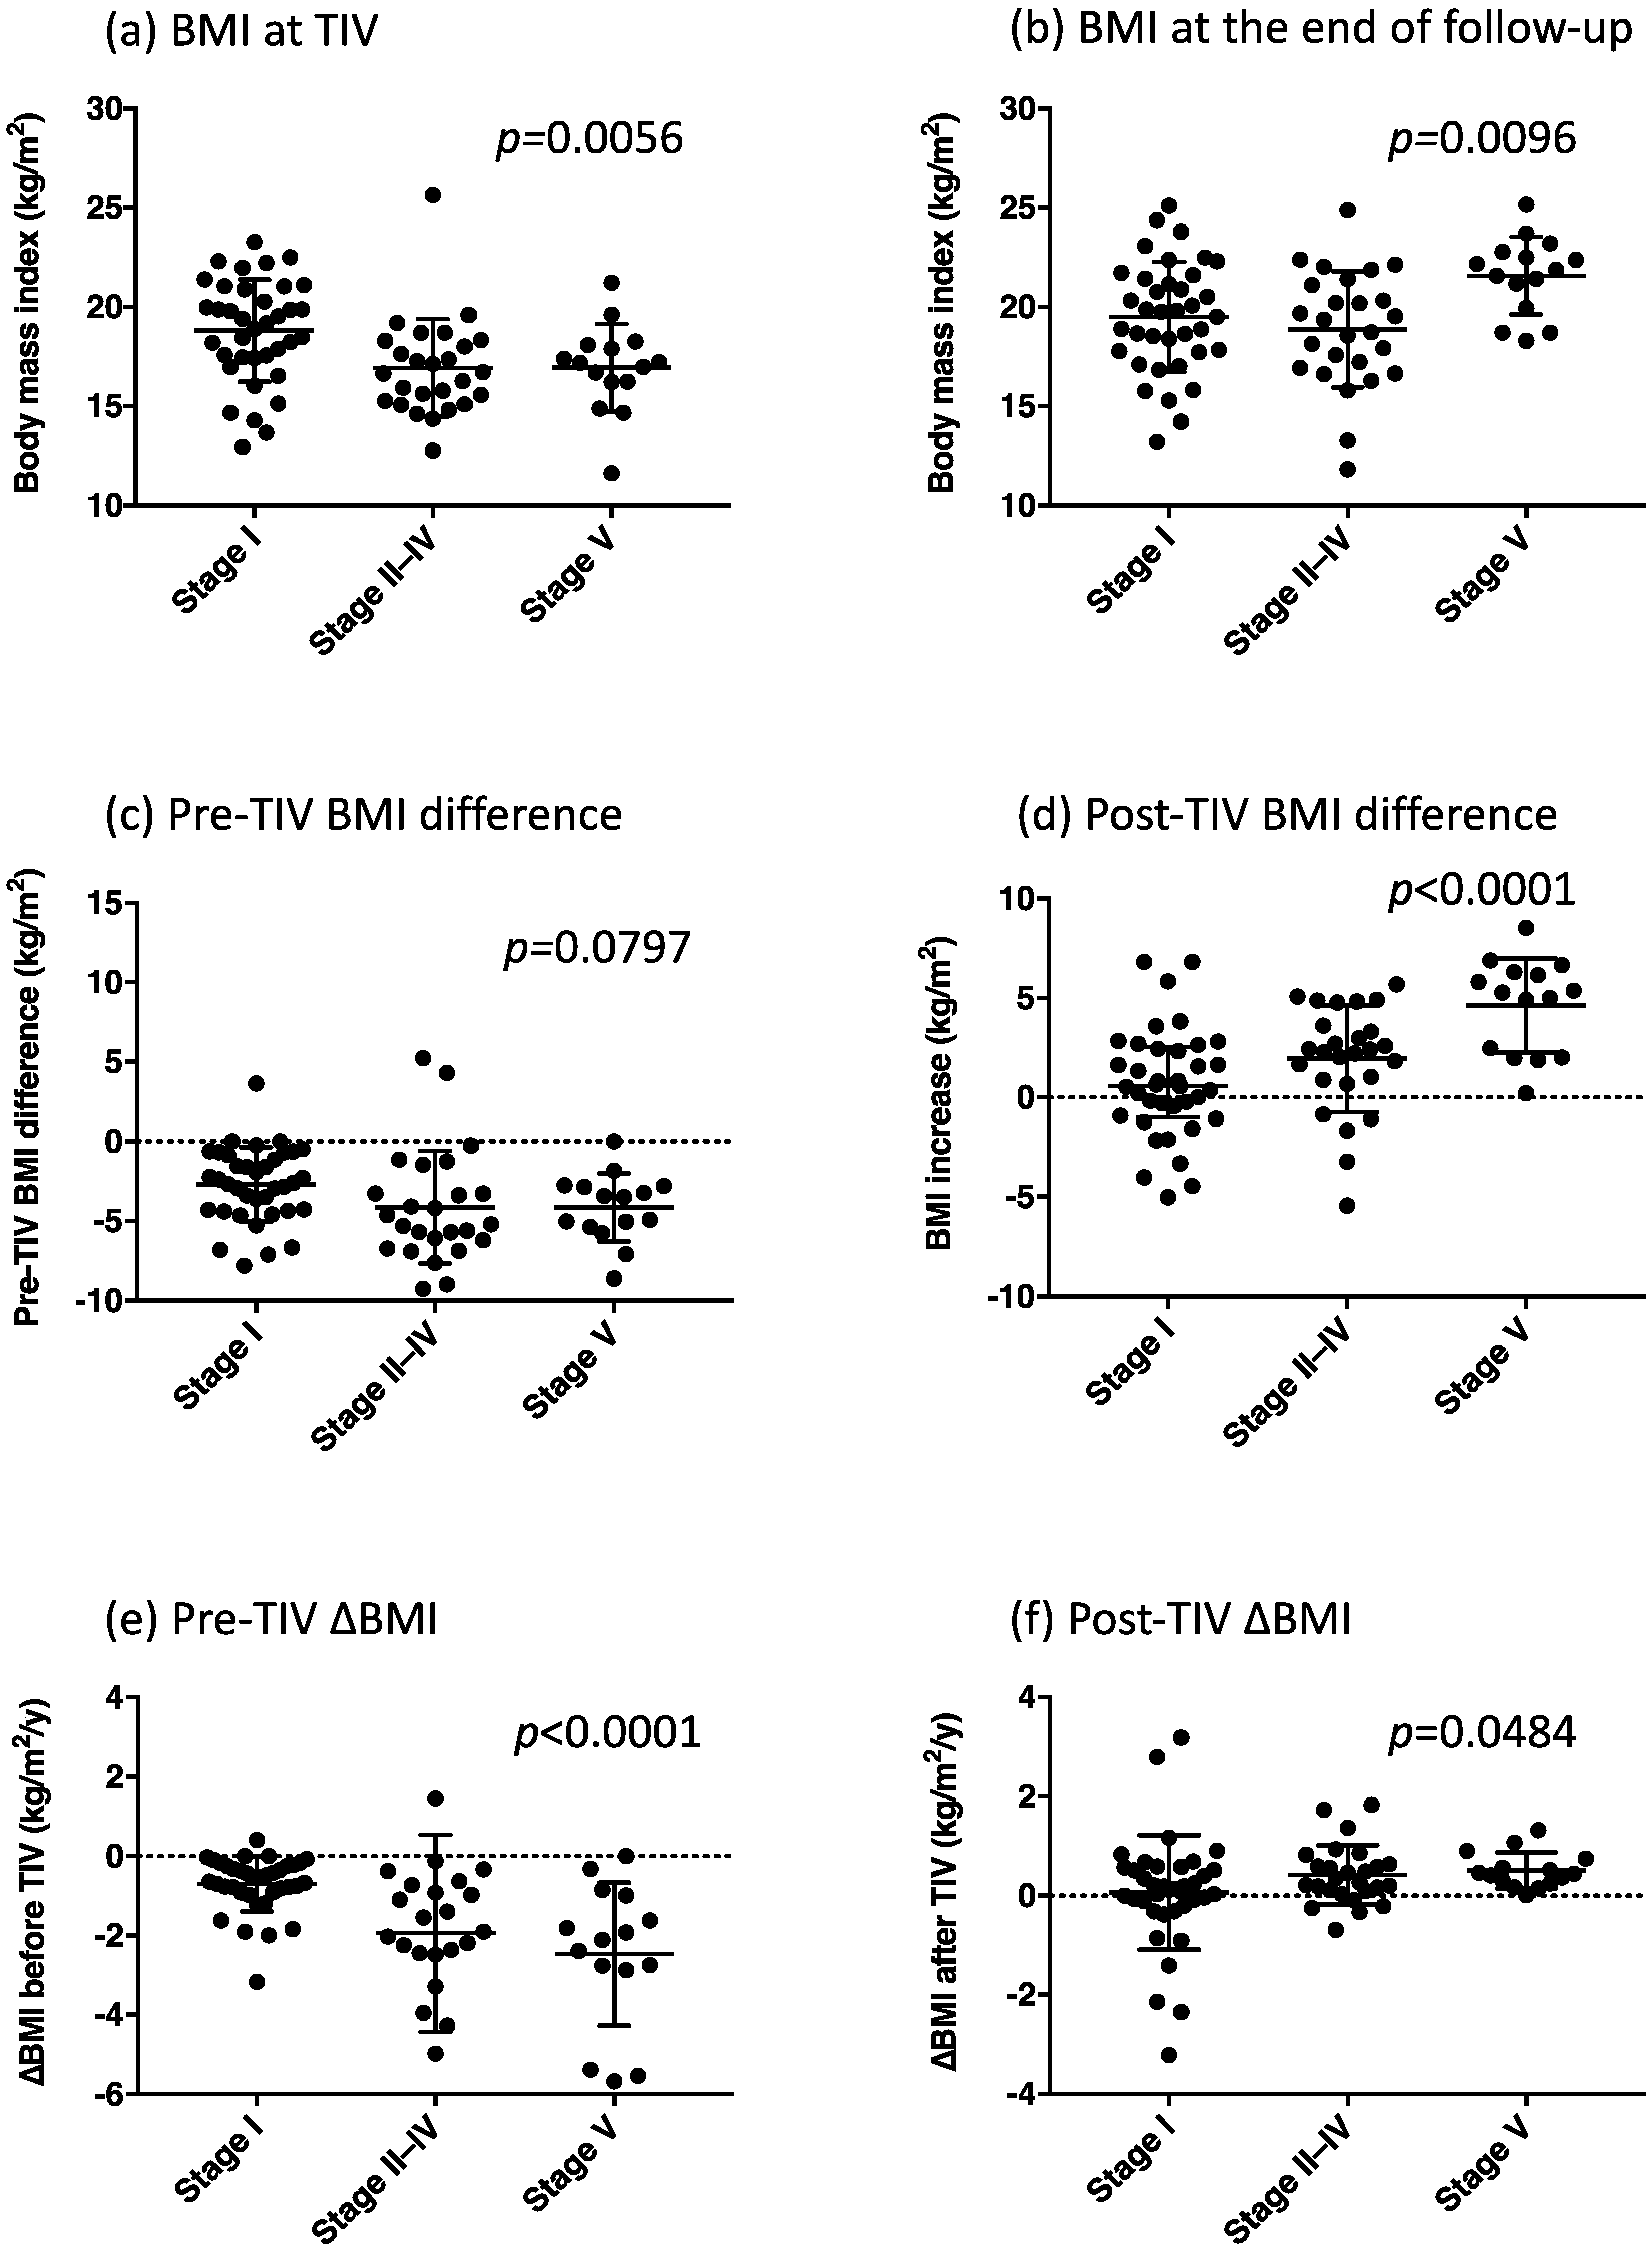
2. Results
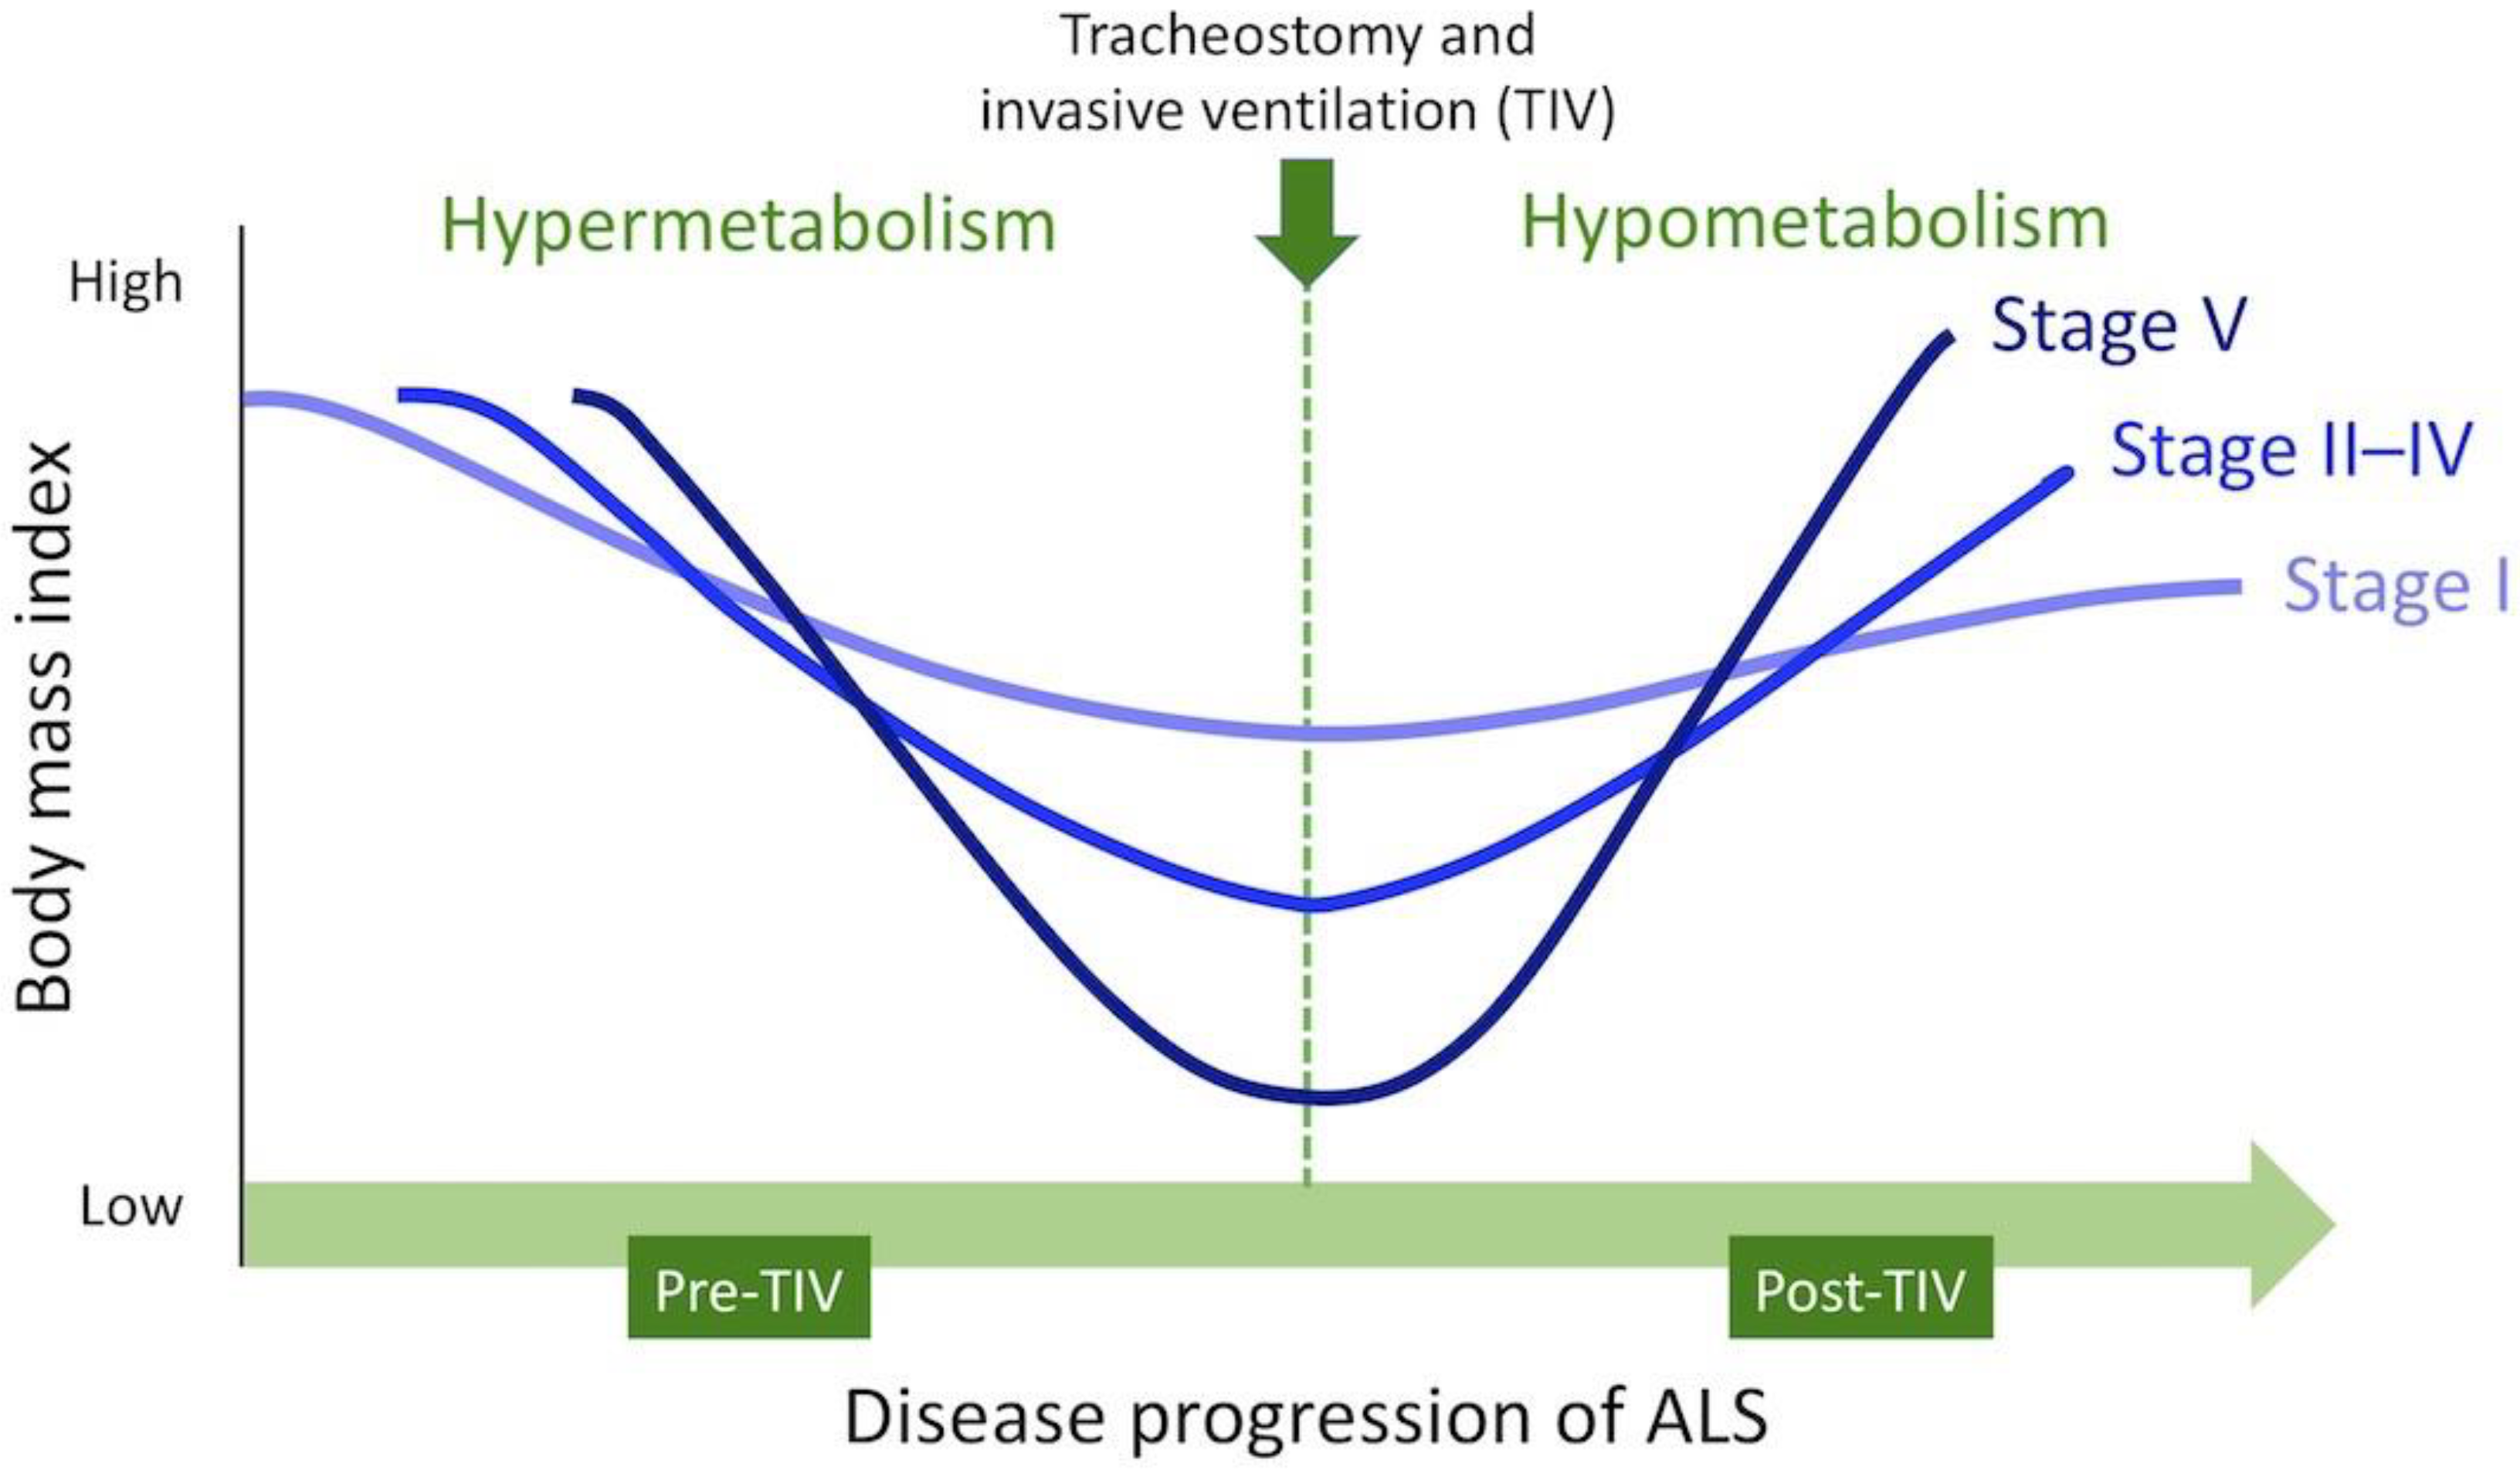
3. Discussion
4. Subjects and Methods
4.1. Patients
4.2. Assessment
- Pre-TIV BMI difference (kg/m2) = BMI at TIV use − BMI at diagnosis;
- Pre-TIV ∆BMI (kg/m2/year) = (BMI at TIV use − BMI at diagnosis)/time interval (years);
- Post-TIV BMI difference (kg/m2) = (BMI at final evaluation − BMI at TIV use);
- Post-TIV ∆BMI (kg/m2/year) = (BMI at final evaluation − BMI at TIV use)/time interval (years).
4.3. Statistical Analysis
Author Contributions
Funding
Institutional Review Board Statement
Informed Consent Statement
Data Availability Statement
Acknowledgments
Conflicts of Interest
References
- Watanabe, H.; Atsuta, N.; Nakamura, R.; Hirakawa, A.; Watanabe, H.; Ito, M.; Senda, J.; Katsuno, M.; Izumi, Y.; Morita, M.; et al. Factors affecting longitudinal functional decline and survival in amyotrophic lateral sclerosis patients. Amyotroph. Lateral Scler. Front. Degener. 2015, 16, 230–236. [Google Scholar] [CrossRef]
- Hayashi, N.; Atsuta, N.; Yokoi, D.; Nakamura, R.; Nakatochi, M.; Katsuno, M.; Izumi, Y.; Kanai, K.; Hattori, N.; Taniguchi, A.; et al. Prognosis of amyotrophic lateral sclerosis patients undergoing tracheostomy invasive ventilation therapy in Japan. J. Neurol. Neurosurg. Psychiatry 2020, 91, 285–290. [Google Scholar] [CrossRef]
- Chio, A.; Logroscino, G.; Hardiman, O.; Swingler, R.; Mitchell, D.; Beghi, E.; Traynor, B.G.; Eurals, C. Prognostic factors in ALS: A critical review. Amyotroph. Lateral Scler. 2009, 10, 310–323. [Google Scholar] [CrossRef] [PubMed] [Green Version]
- Janse van Mantgem, M.R.; van Eijk, R.P.A.; van der Burgh, H.K.; Tan, H.H.G.; Westeneng, H.J.; van Es, M.A.; Veldink, J.H.; van den Berg, L.H. Prognostic value of weight loss in patients with amyotrophic lateral sclerosis: A population-based study. J. Neurol. Neurosurg. Psychiatry 2020, 91, 867–875. [Google Scholar] [CrossRef] [PubMed]
- Moglia, C.; Calvo, A.; Grassano, M.; Canosa, A.; Manera, U.; D’Ovidio, F.; Bombaci, A.; Bersano, E.; Mazzini, L.; Mora, G.; et al. Early weight loss in amyotrophic lateral sclerosis: Outcome relevance and clinical correlates in a population-based cohort. J. Neurol. Neurosurg. Psychiatry 2019, 90, 666–673. [Google Scholar] [CrossRef]
- Shimizu, T.; Nakayama, Y.; Matsuda, C.; Haraguchi, M.; Bokuda, K.; Ishikawa-Takata, K.; Kawata, A.; Isozaki, E. Prognostic significance of body weight variation after diagnosis in ALS: A single-centre prospective cohort study. J. Neurol. 2019, 266, 1412–1420. [Google Scholar] [CrossRef] [PubMed]
- Jesus, P.; Fayemendy, P.; Nicol, M.; Lautrette, G.; Sourisseau, H.; Preux, P.M.; Desport, J.C.; Marin, B.; Couratier, P. Hypermetabolism is a deleterious prognostic factor in patients with amyotrophic lateral sclerosis. Eur. J. Neurol. 2018, 25, 97–104. [Google Scholar] [CrossRef]
- Nakamura, R.; Kurihara, M.; Ogawa, N.; Kitamura, A.; Yamakawa, I.; Bamba, S.; Sanada, M.; Sasaki, M.; Urushitani, M. Prognostic prediction by hypermetabolism varies depending on the nutritional status in early amyotrophic lateral sclerosis. Sci. Rep. 2021, 11, 17943. [Google Scholar] [CrossRef]
- Steyn, F.J.; Ioannides, Z.A.; van Eijk, R.P.A.; Heggie, S.; Thorpe, K.A.; Ceslis, A.; Heshmat, S.; Henders, A.K.; Wray, N.R.; van den Berg, L.H.; et al. Hypermetabolism in ALS is associated with greater functional decline and shorter survival. J. Neurol. Neurosurg. Psychiatry 2018, 89, 1016–1023. [Google Scholar] [CrossRef] [Green Version]
- Ahmed, R.M.; Irish, M.; Piguet, O.; Halliday, G.M.; Ittner, L.M.; Farooqi, S.; Hodges, J.R.; Kiernan, M.C. Amyotrophic lateral sclerosis and frontotemporal dementia: Distinct and overlapping changes in eating behaviour and metabolism. Lancet Neurol. 2016, 15, 332–342. [Google Scholar] [CrossRef] [Green Version]
- Nakayama, Y.; Shimizu, T.; Mochizuki, Y.; Hayashi, K.; Matsuda, C.; Nagao, M.; Watabe, K.; Kawata, A.; Oyanagi, K.; Isozaki, E.; et al. Predictors of impaired communication in amyotrophic lateral sclerosis patients with tracheostomy-invasive ventilation. Amyotroph. Lateral Scler. Front. Degener. 2016, 17, 38–46. [Google Scholar] [CrossRef]
- Nakayama, Y.; Shimizu, T.; Matsuda, C.; Haraguchi, M.; Hayashi, K.; Bokuda, K.; Nagao, M.; Kawata, A.; Ishikawa-Takata, K.; Isozaki, E. Body weight variation predicts disease progression after invasive ventilation in amyotrophic lateral sclerosis. Sci. Rep. 2019, 9, 12262. [Google Scholar] [CrossRef] [PubMed] [Green Version]
- Ichihara, N.; Namba, K.; Ishikawa-Takata, K.; Sekine, K.; Takase, M.; Kamada, Y.; Fujii, S. Energy requirement assessed by doubly-labeled water method in patients with advanced amyotrophic lateral sclerosis managed by tracheotomy positive pressure ventilation. Amyotroph. Lateral Scler. 2012, 13, 544–549. [Google Scholar] [CrossRef] [PubMed]
- Shimizu, T.; Hayashi, H.; Tanabe, H. Energy metabolism of ALS patients under mechanical ventilation and tube feeding. Rinsho Shinkeigaku 1991, 31, 255–259. [Google Scholar] [PubMed]
- Kasarskis, E.J.; Mendiondo, M.S.; Matthews, D.E.; Mitsumoto, H.; Tandan, R.; Simmons, Z.; Bromberg, M.B.; Kryscio, R.J.; the ALS Nutrition/NIPPV Study Group. Estimating daily energy expenditure in individuals with amyotrophic lateral sclerosis. Am. J. Clin. Nutr. 2014, 99, 792–803. [Google Scholar] [CrossRef] [Green Version]
- Shimizu, T.; Ishikawa-Takata, K.; Sakata, A.; Nagaoka, U.; Ichihara, N.; Ishida, C.; Nakayama, Y.; Komori, T.; Nishizawa, M. The measurement and estimation of total energy expenditure in Japanese patients with ALS: A doubly labelled water method study. Amyotroph. Lateral Scler. Front. Degener. 2017, 18, 37–45. [Google Scholar] [CrossRef]
- Bayer, D.; Antonucci, S.; Muller, H.P.; Saad, R.; Dupuis, L.; Rasche, V.; Bockers, T.M.; Ludolph, A.C.; Kassubek, J.; Roselli, F. Disruption of orbitofrontal-hypothalamic projections in a murine ALS model and in human patients. Transl. Neurodegener. 2021, 10, 17. [Google Scholar] [CrossRef]
- Gorges, M.; Vercruysse, P.; Muller, H.P.; Huppertz, H.J.; Rosenbohm, A.; Nagel, G.; Weydt, P.; Petersen, A.; Ludolph, A.C.; Kassubek, J.; et al. Hypothalamic atrophy is related to body mass index and age at onset in amyotrophic lateral sclerosis. J. Neurol. Neurosurg. Psychiatry 2017, 88, 1033–1041. [Google Scholar] [CrossRef]
- Gabery, S.; Ahmed, R.M.; Caga, J.; Kiernan, M.C.; Halliday, G.M.; Petersen, A. Loss of the metabolism and sleep regulating neuronal populations expressing orexin and oxytocin in the hypothalamus in amyotrophic lateral sclerosis. Neuropathol. Appl. Neurobiol. 2021, 47, 979–989. [Google Scholar] [CrossRef]
- Dupuis, L.; Dengler, R.; Heneka, M.T.; Meyer, T.; Zierz, S.; Kassubek, J.; Fischer, W.; Steiner, F.; Lindauer, E.; Otto, M.; et al. A randomized, double blind, placebo-controlled trial of pioglitazone in combination with riluzole in amyotrophic lateral sclerosis. PLoS ONE 2012, 7, e37885. [Google Scholar] [CrossRef]
- Vercruysse, P.; Sinniger, J.; El Oussini, H.; Scekic-Zahirovic, J.; Dieterle, S.; Dengler, R.; Meyer, T.; Zierz, S.; Kassubek, J.; Fischer, W.; et al. Alterations in the hypothalamic melanocortin pathway in amyotrophic lateral sclerosis. Brain 2016, 139, 1106–1122. [Google Scholar] [CrossRef] [PubMed] [Green Version]
- Cykowski, M.D.; Takei, H.; Schulz, P.E.; Appel, S.H.; Powell, S.Z. TDP-43 pathology in the basal forebrain and hypothalamus of patients with amyotrophic lateral sclerosis. Acta Neuropathol. Commun. 2014, 2, 171. [Google Scholar] [CrossRef] [PubMed] [Green Version]
- Brettschneider, J.; Del Tredici, K.; Toledo, J.B.; Robinson, J.L.; Irwin, D.J.; Grossman, M.; Suh, E.; Van Deerlin, V.M.; Wood, E.M.; Baek, Y.; et al. Stages of pTDP-43 pathology in amyotrophic lateral sclerosis. Ann. Neurol. 2013, 74, 20–38. [Google Scholar] [CrossRef] [PubMed]
- Geser, F.; Brandmeir, N.J.; Kwong, L.K.; Martinez-Lage, M.; Elman, L.; McCluskey, L.; Xie, S.X.; Lee, V.M.; Trojanowski, J.Q. Evidence of multisystem disorder in whole-brain map of pathological TDP-43 in amyotrophic lateral sclerosis. Arch. Neurol. 2008, 65, 636–641. [Google Scholar] [CrossRef] [PubMed] [Green Version]
- Nishiyama, Y.; Abe, K.; Tokunaga, J.; Numayama, T. Metabolic syndrome in advanced amyotrophic lateral sclerosis patients with tracheostomy-invasive ventilation. Neurol. Clin. Neurosci. 2019, 7, 174–179. [Google Scholar] [CrossRef]
- Matsuda, C.; Shimizu, T.; Nakayama, Y.; Haraguchi, M.; Hakuta, C.; Itagaki, Y.; Ogura, A.; Murata, K.; Taira, M.; Numayama, T.; et al. Macroglossia in advanced amyotrophic lateral sclerosis. Muscle Nerve 2016, 54, 386–390. [Google Scholar] [CrossRef]
- Shimizu, T.; Honda, M.; Ohashi, T.; Tsujino, M.; Nagaoka, U.; Kawata, A.; Watabe, K.; Matsubara, S.; Hayashi, H. Hyperosmolar hyperglycemic state in advanced amyotrophic lateral sclerosis. Amyotroph. Lateral Scler. 2011, 12, 379–381. [Google Scholar] [CrossRef]
- Shimizu, T.; Hayashi, H.; Kato, S.; Hayashi, M.; Tanabe, H.; Oda, M. Circulatory collapse and sudden death in respirator-dependent amyotrophic lateral sclerosis. J. Neurol. Sci. 1994, 124, 45–55. [Google Scholar] [CrossRef]
- Nakayama, Y.; Shimizu, T.; Matsuda, C.; Haraguchi, M.; Hayashi, K.; Mochizuki, Y.; Nagao, M.; Kawata, A.; Isozaki, E. Non-motor manifestations in ALS patients with tracheostomy and invasive ventilation. Muscle Nerve 2018, 57, 735–741. [Google Scholar] [CrossRef]
- Steyn, F.J.; Li, R.; Kirk, S.E.; Tefera, T.W.; Xie, T.Y.; Tracey, T.J.; Kelk, D.; Wimberger, E.; Garton, F.C.; Roberts, L.; et al. Altered skeletal muscle glucose-fatty acid flux in amyotrophic lateral sclerosis. Brain Commun. 2020, 2, fcaa154. [Google Scholar] [CrossRef]
- Brooks, B.R.; Miller, R.G.; Swash, M.; Munsat, T.L.; World Federation of Neurology Research Group on Motor Neuron Diseases. El Escorial revisited: Revised criteria for the diagnosis of amyotrophic lateral sclerosis. Amyotroph. Lateral Scler. Other Mot. Neuron. Disord. 2000, 1, 293–299. [Google Scholar] [CrossRef] [PubMed]
- Kim, W.K.; Liu, X.; Sandner, J.; Pasmantier, M.; Andrews, J.; Rowland, L.P.; Mitsumoto, H. Study of 962 patients indicates progressive muscular atrophy is a form of ALS. Neurology 2009, 73, 1686–1692. [Google Scholar] [CrossRef] [PubMed]
- Shefner, J.M.; Al-Chalabi, A.; Baker, M.R.; Cui, L.Y.; de Carvalho, M.; Eisen, A.; Grosskreutz, J.; Hardiman, O.; Henderson, R.; Matamala, J.M.; et al. A proposal for new diagnostic criteria for ALS. Clin. Neurophysiol. 2020, 131, 1975–1978. [Google Scholar] [CrossRef] [PubMed]
- Hayashi, K.; Mochizuki, Y.; Nakayama, Y.; Shimizu, T.; Kawata, A.; Nagao, M.; Mizutani, T.; Matsubara, S. Communication disorder in amyotrophic lateral sclerosis after ventilation--a proposal of staging and a study of predictive factor. Rinsho Shinkeigaku 2013, 53, 98–103. [Google Scholar] [CrossRef] [Green Version]
- Cedarbaum, J.M.; Stambler, N.; Malta, E.; Fuller, C.; Hilt, D.; Thurmond, B.; Nakanishi, A. The ALSFRS-R: A revised ALS functional rating scale that incorporates assessments of respiratory function. BDNF ALS Study Group (Phase III). J. Neurol. Sci. 1999, 169, 13–21. [Google Scholar] [CrossRef]
- Hayashi, H.; Oppenheimer, E.A. ALS patients on TPPV: Totally locked-in state, neurologic findings and ethical implications. Neurology 2003, 61, 135–137. [Google Scholar] [CrossRef] [PubMed]
- Poletti, B.; Solca, F.; Carelli, L.; Diena, A.; Colombo, E.; Torre, S.; Maranzano, A.; Greco, L.; Cozza, F.; Lizio, A.; et al. Association of Clinically Evident Eye Movement Abnormalities with Motor and Cognitive Features in Patients with Motor Neuron Disorders. Neurology 2021, 97, e1835–e1846. [Google Scholar] [CrossRef]
- Sharma, R.; Hicks, S.; Berna, C.M.; Kennard, C.; Talbot, K.; Turner, M.R. Oculomotor dysfunction in amyotrophic lateral sclerosis: A comprehensive review. Arch. Neurol. 2011, 68, 857–861. [Google Scholar] [CrossRef] [Green Version]
- McKee, H.R.; Escott, E.; Damm, D.; Kasarskis, E. Macroglossia in amyotrophic lateral sclerosis. JAMA Neurol. 2013, 70, 1432–1435. [Google Scholar] [CrossRef] [Green Version]


| All | Groups by BMI Increase Following TIV | p-Value | ||
|---|---|---|---|---|
| BMI Increase <1.86 | BMI Increase ≥1.86 | |||
| Number of patients (%) | 78 | 37 (47.4%) | 41 (52.6%) | |
| Sex (male) (n, %) | 48 (61.5%) | 20 (56.8%) | 27 (65.9%) | 0.4095 |
| Age at onset (year) | 56.5 (11.3) | 55.2 (11.8) | 57.6 (11.0) | 0.3572 |
| Onset region (bulbar) (n, %) | 18 (23.1%) | 7 (18.9%) | 11 (26.8%) | 0.4058 |
| Number of deaths (%) | 35 (44.9%) | 12 (32.4%) | 23 (56.1%) | 0.0969 |
| Time from onset to TIV use (years) | 4.3 (3.6) | 4.9 (3.6) | 3.8 (3.5) | 0.1967 |
| Time from TIV use to the end of follow-up (years) | 7.9 (6.2) | 7.4 (7.1) | 8.3 (5.2) | 0.5123 |
| Time from onset to enteral nutrition (year) | 4.0 (3.6) | 4.7 (3.8) | 3.4 (3.3) | 0.1067 |
| Duration of enteral nutrition at the end of follow-up (year) | 8.2 (5.9) | 7.7 (6.6) | 8.7 (5.4) | 0.4373 |
| BMI at diagnosis (kg/m2) | 21.3 (2.5) | 21.7 (2.5) | 20.9 (2.5) | 0.1440 |
| BMI at TIV use (kg/m2) | 17.8 (2.6) ** | 18.9 (2.7) ** | 16.9 (2.1) ** | 0.0007 |
| BMI at the end of follow-up (kg/m2) | 19.7 (2.8) ** | 18.2 (2.8) * | 21.0 (2.2) ** | <0.0001 |
| BMI difference from diagnosis to TIV use (kg/m2) | −3.5 (2.8) | −2.9 (3.0) | −4.0 (2.5) | 0.0769 |
| ∆BMI from diagnosis to TIV use (kg/m2/year) | −1.4 (1.8) | −1.1 (1.8) | −1.7 (1.8) | 0.1533 |
| BMI difference from TIV use to the end of follow-up (kg/m2) | 1.9 (3.0) | −0.6 (2.0) | 4.1 (1.8) | <0.0001 |
| ∆BMI after TIV use to the end of follow-up (kg/m2) | 0.3 (0.9) | −0.2 (1.0) | 0.7 (0.5) | <0.0001 |
| Energy intake at TIV use (kcal/day) | 1203 (272) | 1190 (335) | 1215 (201) | 0.7117 |
| Energy intake at the end of follow-up (kcal/day) | 1071 (220) | 1090 (244) | 1055 (198) | 0.5078 |
| Serum albumin at TIV use (g/dL) | 3.4 (0.6) | 3.4 (0.6) | 3.3 (0.5) | 0.8726 |
| Serum albumin at the end of follow-up (g/dL) | 3.2 (0.8) | 3.4 (0.7) | 3.0 (0.8) | 0.0185 |
| Ophthalmoplegia (n, %) | 48 (38.5%) | 16 (44.4%) | 32 (76.2%) | 0.0014 |
| Total quadriplegia (n, %) | 40 (31.2%) | 15 (40.5%) | 25 (61.9%) | 0.0662 |
| Disabilities at the end of follow-up (n, %) | ||||
| Communication stage I | 37 (47.4%) | 26 (72.2%) | 11 (26.2%) | <0.0001 |
| Communication stage II–IV | 26 (33.3%) | 10 (27.0%) | 16 (39.0%) | |
| Communication stage V | 15 (19.2%) | 1 (2.8%) | 14 (33.3%) | |
| All (N = 78) | Groups by BMI Increase Following TIV | p-Value | ||
|---|---|---|---|---|
| BMI Increase <1.86 (n = 37) | BMI Increase ≥1.86 (n = 41) | |||
| Unstable blood pressure | 20 (25.6%) | 8 (22.2%) | 12 (28.6%) | 0.5257 |
| Hypothermia | 15 (19.2%) | 4 (11.1%) | 11 (26.2%) | 0.0865 |
| Dysuria (uretheral catheter insertion) | 33 (42.3%) | 11 (30.6%) | 22 (52.4%) | 0.0499 |
| Macroglossia | 16 (20.5%) | 7 (19.4%) | 9 (21.4%) | 0.8351 |
| Hyperglycemic state | 11 (14.1%) | 6 (16.7%) | 5 (11.9%) | 0.5418 |
| Variables | Coefficient | 95% CI | p-Value |
|---|---|---|---|
| Age at onset | 0.002 | −0.535, 0.577 | 0.941 |
| Length of time from onset to TIV use | 0.144 | −0.184, 0.307 | 0.082 |
| BMI at TIV use | 0.584 | 0.320, 0.848 | <0.0001 |
| Stage | |||
| Stage II | 0.463 | −0.368, 1.294 | 0.275 |
| Stage III | 0.341 | −0.767, 1.449 | 0.547 |
| Stage IV | 0.814 | −0.260, 1.888 | 0.138 |
| Stage V | 1.469 | 0.142, 2.798 | 0.030 |
| Random effect | |||
| Residual | 2.099 | ||
| Cons | 3.140 |
Publisher’s Note: MDPI stays neutral with regard to jurisdictional claims in published maps and institutional affiliations. |
© 2022 by the authors. Licensee MDPI, Basel, Switzerland. This article is an open access article distributed under the terms and conditions of the Creative Commons Attribution (CC BY) license (https://creativecommons.org/licenses/by/4.0/).
Share and Cite
Nakayama, Y.; Shimizu, T.; Matsuda, C.; Haraguchi, M.; Hayashi, K.; Bokuda, K.; Nagao, M.; Kawata, A.; Takahashi, K. Body Weight Gain Is Associated with the Disease Stage in Advanced Amyotrophic Lateral Sclerosis with Invasive Ventilation. Metabolites 2022, 12, 191. https://doi.org/10.3390/metabo12020191
Nakayama Y, Shimizu T, Matsuda C, Haraguchi M, Hayashi K, Bokuda K, Nagao M, Kawata A, Takahashi K. Body Weight Gain Is Associated with the Disease Stage in Advanced Amyotrophic Lateral Sclerosis with Invasive Ventilation. Metabolites. 2022; 12(2):191. https://doi.org/10.3390/metabo12020191
Chicago/Turabian StyleNakayama, Yuki, Toshio Shimizu, Chiharu Matsuda, Michiko Haraguchi, Kentaro Hayashi, Kota Bokuda, Masahiro Nagao, Akihiro Kawata, and Kazushi Takahashi. 2022. "Body Weight Gain Is Associated with the Disease Stage in Advanced Amyotrophic Lateral Sclerosis with Invasive Ventilation" Metabolites 12, no. 2: 191. https://doi.org/10.3390/metabo12020191