
“Leaky Gut” as a Keystone of the Connection between Depression and Obstructive Sleep Apnea Syndrome? A Rationale and Study Design

 ,
,  ,
,
Abstract
:
1. Introduction
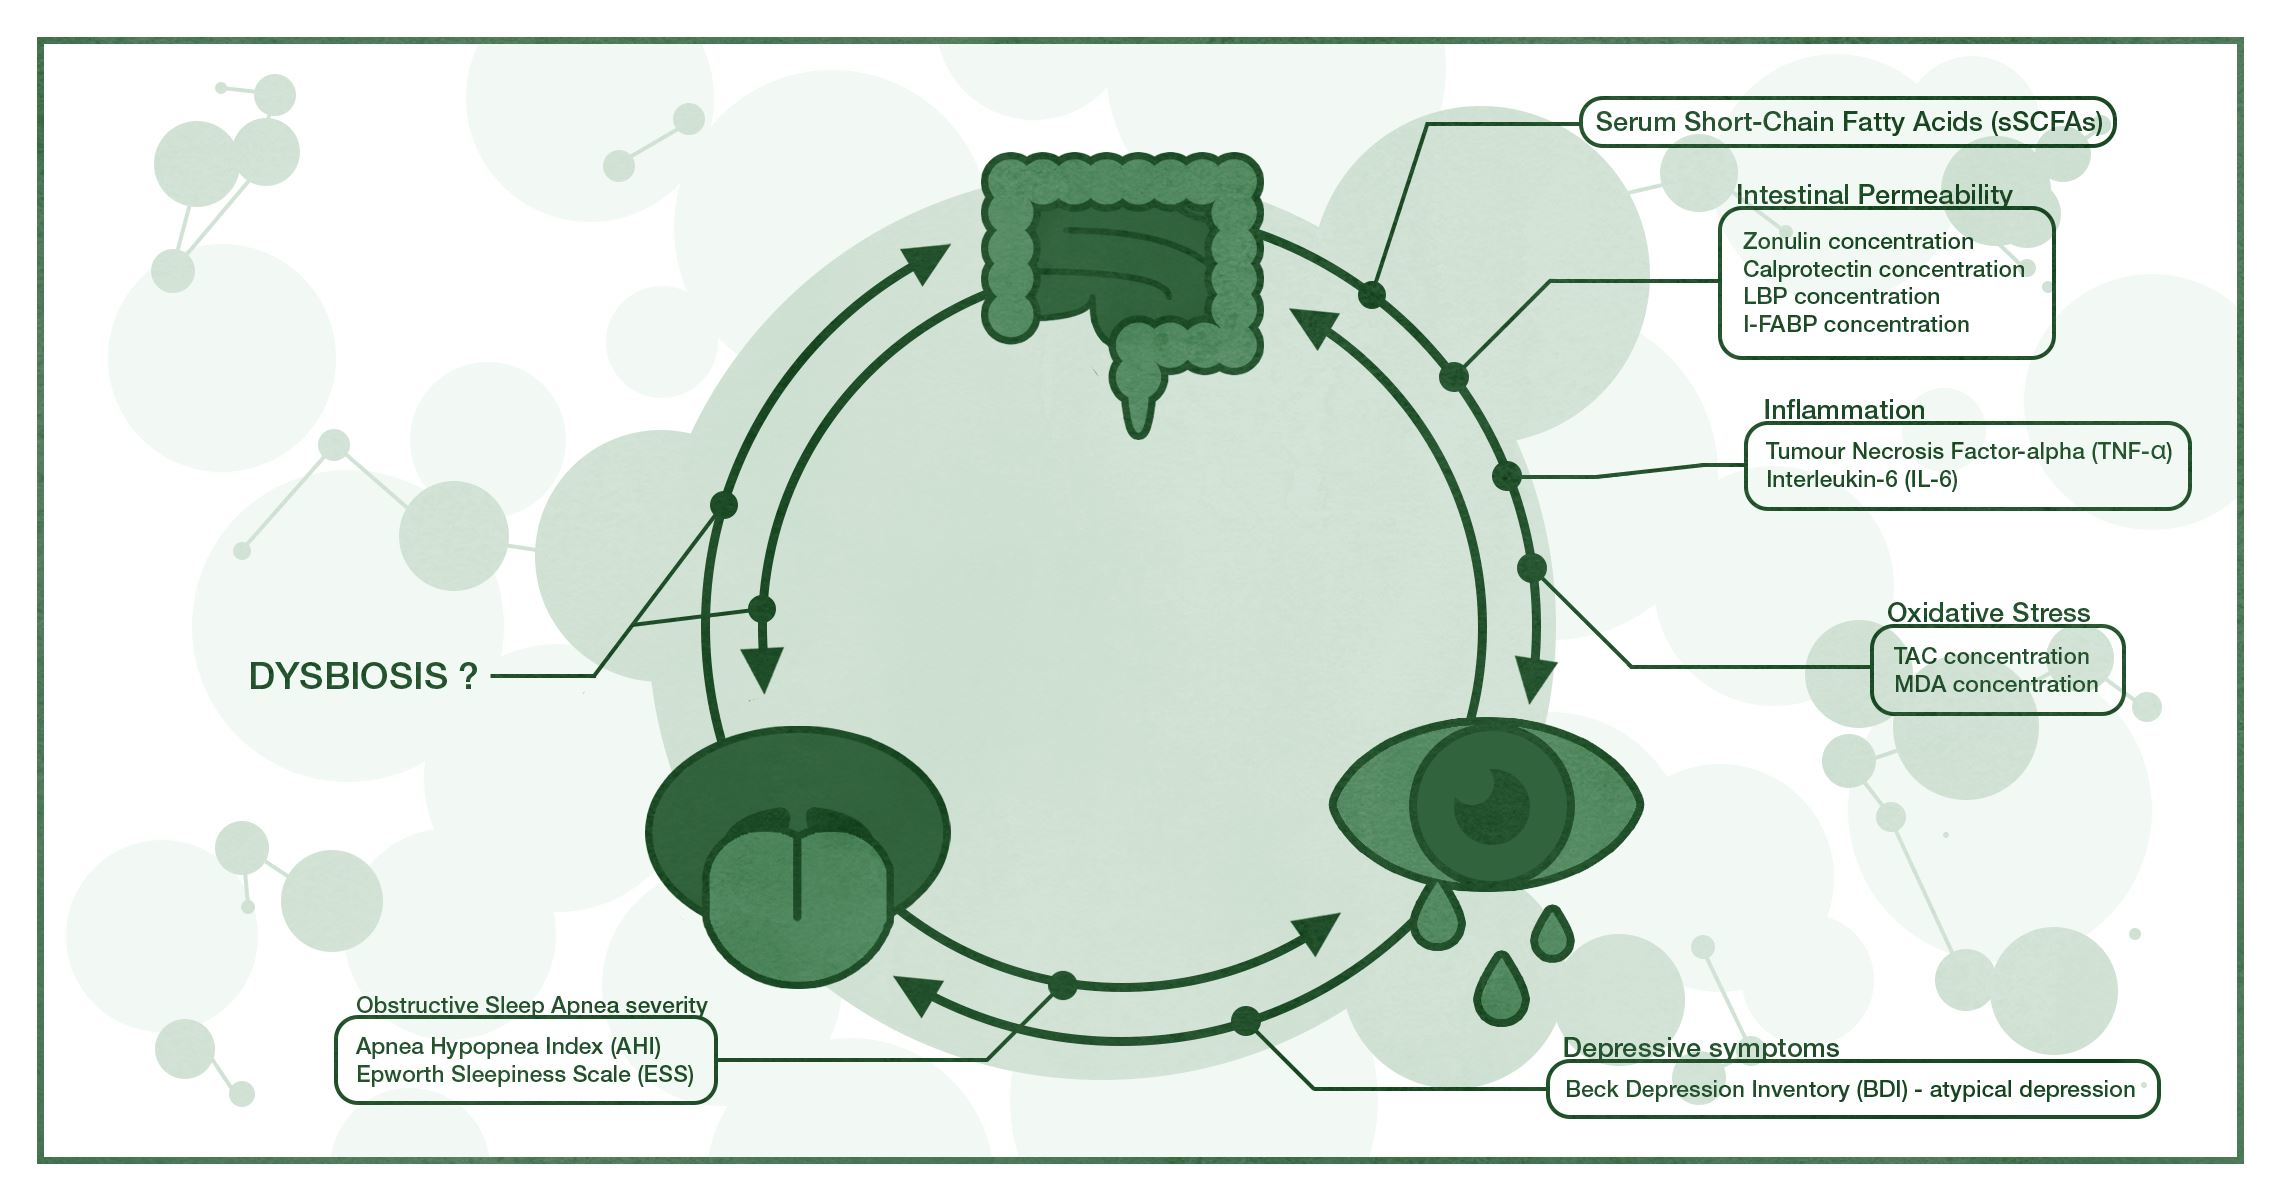
2. Results
2.1. Aim of the Study
2.2. Population
2.3. Measurements
2.4. Statistical Methods
3. Discussion
Strengths and Limitations
4. Materials and Methods
5. Conclusions
Author Contributions
Funding
Institutional Review Board Statement
Informed Consent Statement
Data Availability Statement
Acknowledgments
Conflicts of Interest
Appendix A. Sample Size Analyses Details
Appendix A.1. Correlation
Appendix A.2. Comparing Two or More Groups
Appendix A.3. Multiple Correspondence Analysis
Appendix A.4. Regression
References
- Marazziti, D.; Rutigliano, G.; Baroni, S.; Landi, P.; Dell’Osso, L. Metabolic syndrome and major depression. CNS Spectr. 2014, 19, 293–304. [Google Scholar] [CrossRef] [PubMed]
- Luppino, F.S.; De Wit, L.M.; Bouvy, P.F.; Stijnen, T.; Cuijpers, P.; Penninx, B.W.J.H.; Zitman, F.G. Overweight, obesity, and depression: A systematic review and meta-analysis of longitudinal studies. Arch. Gen. Psychiatry 2010, 67, 220–229. [Google Scholar] [CrossRef] [PubMed]
- Silveira, M.G.; Sampol, G.; Mota-Foix, M.; Ferrer, J.; Lloberes, P. Cluster-derived obstructive sleep apnea phenotypes and outcomes at five year follow-up. J. Clin. Sleep Med. 2021. [Google Scholar] [CrossRef]
- Mungo, A.; Hein, M.; Lanquart, J.P.; Loas, G. Atypical depression as a risk factor for obstructive sleep apnea syndrome in young adults. Encephale 2021. [Google Scholar] [CrossRef]
- Turkiewicz, S.; Ditmer, M.; Sochal, M.; Białasiewicz, P.; Strzelecki, D.; Gabryelska, A. Obstructive Sleep Apnea as an Acceleration Trigger of Cellular Senescence Processes through Telomere Shortening. Int. J. Mol. Sci. 2021, 22, 12536. [Google Scholar] [CrossRef]
- Chen, Y.-C.; Hsu, P.-Y.; Su, M.-C.; Chen, T.-W.; Hsiao, C.-C.; Chin, C.-H.; Liou, C.-W.; Wang, P.-W.; Wang, T.-Y.; Lin, Y.-Y.; et al. MicroRNA Sequencing Analysis in Obstructive Sleep Apnea and Depression: Anti-Oxidant and MAOA-Inhibiting Effects of miR-15b-5p and miR-92b-3p through Targeting PTGS1-NF-κB-SP1 Signaling. Antioxidants 2021, 10, 1854. [Google Scholar] [CrossRef]
- Romero-Corral, A.; Caples, S.M.; Lopez-Jimenez, F.; Somers, V.K. Interactions between obesity and obstructive sleep apnea: Implications for treatment. Chest 2010, 137, 711–719. [Google Scholar] [CrossRef] [Green Version]
- Barceló, A.; Esquinas, C.; Robles, J.; Piérola, J.; De la Peña, M.; Aguilar, I.; Morell-Garcia, D.; Alonso, A.; Toledo, N.; Sánchez-de la Torre, M.; et al. Gut epithelial barrier markers in patients with obstructive sleep apnea. Sleep Med. 2016, 26, 12–15. [Google Scholar] [CrossRef] [Green Version]
- Ishman, S.L.; Cavey, R.M.; Mettel, T.L.; Gourin, C.G. Depression, sleepiness, and disease severity in patients with obstructive sleep apnea. Laryngoscope 2010, 120, 2331–2335. [Google Scholar] [CrossRef]
- Al-Qattan, H.; Al-Omairah, H.; Al-Hashash, K.; Al-Mutairi, F.; Al-Mutairat, M.; Al-Ajmi, M.; Mohammad, A.; Alterki, A.; Ziyab, A.H. Prevalence, Risk Factors, and Comorbidities of Obstructive Sleep Apnea Risk Among a Working Population in Kuwait: A Cross-Sectional Study. Front. Neurol. 2021, 12. [Google Scholar] [CrossRef]
- Alcántara, C.; Biggs, M.L.; Davidson, K.W.; Delaney, J.A.; Jackson, C.L.; Zee, P.C.; Shea, S.J.C.; Redline, S. Sleep disturbances and depression in the multi-ethnic study of atherosclerosis. Sleep 2016, 39, 915–925. [Google Scholar] [CrossRef] [PubMed] [Green Version]
- Daabis, R.; Gharraf, H. Predictors of anxiety and depression in patients with obstructive sleep apnea. Egypt. J. Chest Dis. Tuberc. 2012, 61, 171–177. [Google Scholar] [CrossRef] [Green Version]
- Almendros, I.; Basoglu, Ö.K.; Conde, S.V.; Liguori, C.; Saaresranta, T. Metabolic dysfunction in OSA: Is there something new under the sun? J. Sleep Res. 2021, e13418. [Google Scholar] [CrossRef]
- Araújo, M.V.; Norton, A. Cognitive Impairment and Depressive Symptoms in a Patient With Obstructive Sleep Apnea: Full Recovery After CPAP Treatment. Cureus 2020, 12. [Google Scholar] [CrossRef] [PubMed]
- Reddy, A.; Mansuri, Z.; Vadukapuram, R.; Trivedi, C. Increased Suicidality and Worse Outcomes in MDD Patients With OSA: A Nationwide Inpatient Analysis of 11 Years From 2006 to 2017. J. Acad. Consult. Psychiatry 2021, 63, 46–52. [Google Scholar] [CrossRef] [PubMed]
- Zhang, D.; Zhang, Z.; Li, H.; Ding, K. Excessive Daytime Sleepiness in Depression and Obstructive Sleep Apnea: More Than Just an Overlapping Symptom. Front. Psychiatry 2021, 12, 1572. [Google Scholar] [CrossRef] [PubMed]
- Celik, Y.; Yapici-Eser, H.; Balcan, B.; Peker, Y. Association of excessive daytime sleepiness with the zung self-rated depression subscales in adults with coronary artery disease and obstructive sleep apnea. Diagnostics 2021, 11, 1176. [Google Scholar] [CrossRef]
- McIntyre, R.S.; Soczynska, J.K.; Konarski, J.Z.; Woldeyohannes, H.O.; Law, C.W.Y.; Miranda, A.; Fulgosi, D.; Kennedy, S.H. Should Depressive Syndromes Be Reclassified as “Metabolic Syndrome Type II”? Ann. Clin. Psychiatry 2007, 19, 257–264. [Google Scholar] [CrossRef]
- Wali, S.; Manzar, M.; Abdelaziz, M.; Alshomrani, R.; Alhejaili, F.; Al-Mughales, J.; Alamoudi, W.; Gozal, D. Putative associations between inflammatory biomarkers, obesity, and obstructive sleep apnea. Ann. Thorac. Med. 2021, 16, 329. [Google Scholar] [CrossRef]
- Pau, M.C.; Mangoni, A.A.; Zinellu, E.; Pintus, G.; Carru, C.; Fois, A.G.; Pirina, P.; Zinellu, A. Circulating Superoxide Dismutase Concentrations in Obstructive Sleep Apnoea (OSA): A Systematic Review and Meta-Analysis. Antioxidants 2021, 10, 1764. [Google Scholar] [CrossRef]
- Fernandes, E.R.; Pires, G.N.; Andersen, M.L.; Tufik, S.; Rosa, D.S. Oxygen saturation as a predictor of inflammation in obstructive sleep apnea. Sleep Breath. 2021, 1–8. [Google Scholar] [CrossRef] [PubMed]
- Leonard, B.E. Inflammation and depression: A causal or coincidental link to the pathophysiology? Acta Neuropsychiatr. 2018, 30, 1–16. [Google Scholar] [CrossRef] [Green Version]
- Lamers, F.; Milaneschi, Y.; De Jonge, P.; Giltay, E.J.; Penninx, B.W.J.H. Metabolic and inflammatory markers: Associations with individual depressive symptoms. Psychol. Med. 2018, 48, 1102–1110. [Google Scholar] [CrossRef] [PubMed]
- Chen, Y.; Liu, S.; Leng, S.X. Chronic Low-grade Inflammatory Phenotype (CLIP) and Senescent Immune Dysregulation. Clin. Ther. 2019, 41, 400–409. [Google Scholar] [CrossRef] [PubMed] [Green Version]
- Osimo, E.F.; Baxter, L.J.; Lewis, G.; Jones, P.B.; Khandaker, G.M. Prevalence of low-grade inflammation in depression: A systematic review and meta-Analysis of CRP levels. Psychol. Med. 2019, 49, 1958–1970. [Google Scholar] [CrossRef] [PubMed]
- Cumurcu, B.E.; Ozyurt, H.; Etikan, I.; Demir, S.; Karlidag, R. Total antioxidant capacity and total oxidant status in patients with major depression: Impact of antidepressant treatment. Psychiatry Clin. Neurosci. 2009, 63, 639–645. [Google Scholar] [CrossRef] [PubMed]
- Taene, A.; Khalili-Tanha, G.; Esmaeili, A.; Mobasheri, L.; Kooshkaki, O.; Jafari, S.; Shokouhifar, A.; Sarab, G.A. The Association of Major Depressive Disorder with Activation of NLRP3 Inflammasome, Lipid Peroxidation, and Total Antioxidant Capacity. J. Mol. Neurosci. 2020, 70, 65–70. [Google Scholar] [CrossRef]
- Liu, T.; Zhong, S.; Liao, X.; Chen, J.; He, T.; Lai, S.; Jia, Y. A Meta-Analysis of Oxidative Stress Markers in Depression. PLoS One 2015, 10, e0138904. [Google Scholar] [CrossRef]
- Lindqvist, D.; Dhabhar, F.S.; James, S.J.; Hough, C.M.; Jain, F.A.; Bersani, F.S.; Reus, V.I.; Verhoeven, J.E.; Epel, E.S.; Mahan, L.; et al. Oxidative stress, inflammation and treatment response in major depression. Psychoneuroendocrinology 2017, 76, 197–205. [Google Scholar] [CrossRef] [Green Version]
- Baek, S.E.; Lee, G.J.; Rhee, C.K.; Rho, D.Y.; Kim, D.H.; Huh, S.; Lee, S.K. Decreased Total Antioxidant Activity in Major Depressive Disorder Patients Non-Responsive to Antidepressant Treatment. Psychiatry Investig. 2016, 13, 222–226. [Google Scholar] [CrossRef] [Green Version]
- Farré, N.; Farré, R.; Gozal, D. Sleep Apnea Morbidity: A Consequence of Microbial-Immune Cross-Talk? Chest 2018, 154, 754–759. [Google Scholar] [CrossRef] [Green Version]
- Aizawa, E.; Tsuji, H.; Asahara, T.; Takahashi, T.; Teraishi, T.; Yoshida, S.; Ota, M.; Koga, N.; Hattori, K.; Kunugi, H. Possible association of Bifidobacterium and Lactobacillus in the gut microbiota of patients with major depressive disorder. J. Affect. Disord. 2016, 202, 254–257. [Google Scholar] [CrossRef] [PubMed]
- Liu, Y.; Wu, Z.; Cheng, L.; Zhang, X.; Yang, H. The role of the intestinal microbiota in the pathogenesis of host depression and mechanism of TPs relieving depression. Food Funct. 2021, 12, 7651–7663. [Google Scholar] [CrossRef] [PubMed]
- Lach, G.; Schellekens, H.; Dinan, T.G.; Cryan, J.F. Anxiety, Depression, and the Microbiome: A Role for Gut Peptides. Neurotherapeutics 2018, 15, 36–59. [Google Scholar] [CrossRef] [Green Version]
- Zheng, P.; Zeng, B.; Zhou, C.; Liu, M.; Fang, Z.; Xu, X.; Zeng, L.; Chen, J.; Fan, S.; Du, X.; et al. Gut microbiome remodeling induces depressive-like behaviors through a pathway mediated by the host’s metabolism. Mol. Psychiatry 2016, 21, 786–796. [Google Scholar] [CrossRef]
- Naseribafrouei, A.; Hestad, K.; Avershina, E.; Sekelja, M.; Linløkken, A.; Wilson, R.; Rudi, K. Correlation between the human fecal microbiota and depression. Neurogastroenterol. Motil. 2014, 26, 1155–1162. [Google Scholar] [CrossRef] [PubMed]
- Liśkiewicz, P.; Kaczmarczyk, M.; Misiak, B.; Wroński, M.; Bąba-Kubiś, A.; Skonieczna-Żydecka, K.; Marlicz, W.; Bieńkowski, P.; Misera, A.; Pełka-Wysiecka, J.; et al. Analysis of gut microbiota and intestinal integrity markers of inpatients with major depressive disorder. Prog. Neuro-Psychopharmacology Biol. Psychiatry 2020, 106, 110076. [Google Scholar] [CrossRef] [PubMed]
- Sanada, K.; Nakajima, S.; Kurokawa, S.; Barceló-Soler, A.; Ikuse, D.; Hirata, A.; Yoshizawa, A.; Tomizawa, Y.; Salas-Valero, M.; Noda, Y.; et al. Gut microbiota and majore depressive disorder: A systematic review and meta-analysis. J. Affect. Disord. 2020, 266, 1–13. [Google Scholar] [CrossRef]
- Cai, Y.; Juszczak, H.M.; Cope, E.K.; Goldberg, A.N. The microbiome in obstructive sleep apnea. Sleep 2021, 44, zsab061. [Google Scholar] [CrossRef] [PubMed]
- Hu, C.; Wang, P.; Yang, Y.; Li, J.; Jiao, X.; Yu, H.; Wei, Y.; Li, J.; Qin, Y. Chronic Intermittent Hypoxia Participates in the Pathogenesis of Atherosclerosis and Perturbs the Formation of Intestinal Microbiota. Front. Cell. Infect. Microbiol. 2021, 11, 392. [Google Scholar] [CrossRef]
- Badran, M.; Khalyfa, A.; Ericsson, A.; Gozal, D. Fecal microbiota transplantation from mice exposed to chronic intermittent hypoxia elicits sleep disturbances in naïve mice. Exp. Neurol. 2020, 334, 113439. [Google Scholar] [CrossRef] [PubMed]
- Zhang, X.; Wang, S.; Xu, H.; Yi, H.; Guan, J.; Yin, S. Metabolomics and microbiome profiling as biomarkers in obstructive sleep apnoea: A comprehensive review. Eur. Respir. Rev. 2021, 30. [Google Scholar] [CrossRef] [PubMed]
- Ko, C.Y.; Fan, J.M.; Hu, A.K.; Su, H.Z.; Yang, J.H.; Huang, L.M.; Yan, F.R.; Zhang, H.P.; Zeng, Y.M. Disruption of sleep architecture in Prevotella enterotype of patients with obstructive sleep apnea-hypopnea syndrome. Brain Behav. 2019, 9, e01287. [Google Scholar] [CrossRef] [PubMed] [Green Version]
- Ko, C.-Y.; Liu, Q.-Q.; Su, H.-Z.; Zhang, H.-P.; Fan, J.-M.; Yang, J.-H.; Hu, A.-K.; Liu, Y.-Q.; Chou, D.; Zeng, Y.-M. Gut microbiota in obstructive sleep apnea–hypopnea syndrome: Disease-related dysbiosis and metabolic comorbidities. Clin. Sci. (Lond) 2019, 133, 905. [Google Scholar] [CrossRef] [Green Version]
- Belkaid, Y.; Hand, T.W. Role of the microbiota in immunity and inflammation. Cell 2014, 157, 121–141. [Google Scholar] [CrossRef] [Green Version]
- Dam, B.; Misra, A.; Banerjee, S. Role of gut microbiota in combating oxidative stress. In Oxidative Stress in Microbial Diseases; Springer: Singapore, 2019; pp. 43–82. ISBN 9789811387630. [Google Scholar]
- Koopman, M.; Daniels, J.K.; Spitzer, C.; Lampe, A.; El Aidy, S. Depressed gut? the microbiota-diet-inflammation trialogue in depression. Curr. Opin. Psychiatry 2017, 30, 369–377. [Google Scholar] [CrossRef] [Green Version]
- Berk, M.; Williams, L.J.; Jacka, F.N.; O’Neil, A.; Pasco, J.A.; Moylan, S.; Allen, N.B.; Stuart, A.L.; Hayley, A.C.; Byrne, M.L.; et al. So depression is an inflammatory disease, but where does the inflammation come from? BMC Med. 2013, 11, 200. [Google Scholar] [CrossRef] [Green Version]
- Maes, M.; Kubera, M.; Leunis, J.C.; Berk, M. Increased IgA and IgM responses against gut commensals in chronic depression: Further evidence for increased bacterial translocation or leaky gut. J. Affect. Disord. 2012, 141, 55–62. [Google Scholar] [CrossRef]
- Ait-Belgnaoui, A.; Durand, H.; Cartier, C.; Chaumaz, G.; Eutamene, H.; Ferrier, L.; Houdeau, E.; Fioramonti, J.; Bueno, L.; Theodorou, V. Prevention of gut leakiness by a probiotic treatment leads to attenuated HPA response to an acute psychological stress in rats. Psychoneuroendocrinology 2012, 37, 1885–1895. [Google Scholar] [CrossRef] [PubMed]
- Alvarez-Mon, M.A.; Gomez-Lahoz, A.M.; Orozco, A.; Lahera, G.; Sosa-Reina, M.D.; Diaz, D.; Albillos, A.; Quintero, J.; Molero, P.; Monserrat, J.; et al. Blunted Expansion of Regulatory T Lymphocytes Is Associated With Increased Bacterial Translocation in Patients With Major Depressive Disorder. Front. Psychiatry 2021, 11, 1530. [Google Scholar] [CrossRef]
- Ohlsson, L.; Gustafsson, A.; Lavant, E.; Suneson, K.; Brundin, L.; Westrin; Ljunggren, L.; Lindqvist, D. Leaky gut biomarkers in depression and suicidal behavior. Acta Psychiatry Scand. 2019, 139, 185–193. [Google Scholar] [CrossRef] [PubMed] [Green Version]
- Seethaler, B.; Basrai, M.; Neyrinck, A.M.; Nazare, J.A.; Walter, J.; Delzenne, N.M.; Bischoff, S.C. Biomarkers for assessment of intestinal permeability in clinical practice. Am. J. Physiol. Gastrointest. Liver Physiol. 2021, 321, G11–G17. [Google Scholar] [CrossRef]
- Safadi, J.M.; Quinton, A.M.G.; Lennox, B.R.; Burnet, P.W.J.; Minichino, A. Gut dysbiosis in severe mental illness and chronic fatigue: A novel trans-diagnostic construct? A systematic review and meta-analysis. Mol. Psychiatry 2021, 1–13. [Google Scholar] [CrossRef] [PubMed]
- Heizati, M.; Li, N.; Shao, L.; Yao, X.; Wang, Y.; Hong, J.; Zhou, L.; Zhang, D.; Chang, G.; Abulikemu, S. Does increased serum d-lactate mean subclinical hyperpermeability of intestinal barrier in middle-aged nonobese males with OSA? Medicine 2017, 96. [Google Scholar] [CrossRef] [PubMed]
- Silva, Y.P.; Bernardi, A.; Frozza, R.L. The Role of Short-Chain Fatty Acids From Gut Microbiota in Gut-Brain Communication. Front. Endocrinol. 2020, 11, 25. [Google Scholar] [CrossRef] [PubMed] [Green Version]
- Deleu, S.; Machiels, K.; Raes, J.; Verbeke, K.; Vermeire, S. Short chain fatty acids and its producing organisms: An overlooked therapy for IBD? EBioMedicine 2021, 66, 103293. [Google Scholar] [CrossRef]
- Olsson, A.; Gustavsen, S.; Nguyen, T.D.; Nyman, M.; Langkilde, A.R.; Hansen, T.H.; Sellebjerg, F.; Oturai, A.B.; Bach Søndergaard, H. Serum Short-Chain Fatty Acids and Associations With Inflammation in Newly Diagnosed Patients With Multiple Sclerosis and Healthy Controls. Front. Immunol. 2021, 12, 1560. [Google Scholar] [CrossRef]
- Yamamura, R.; Nakamura, K.; Kitada, N.; Aizawa, T.; Shimizu, Y.; Nakamura, K.; Ayabe, T.; Kimura, T.; Tamakoshi, A. Associations of gut microbiota, dietary intake, and serum short-chain fatty acids with fecal short-chain fatty acids. Biosci. Microbiota Food Health 2020, 39, 11–17. [Google Scholar] [CrossRef] [Green Version]
- Wolever, T.M.S.; Josse, R.G.; Leiter, L.A.; Chiasson, J.L. Time of day and glucose tolerance status affect serum short-chain fatty concentrations in humans. Metabolism 1997, 46, 805–811. [Google Scholar] [CrossRef]
- Duscha, A.; Gisevius, B.; Hirschberg, S.; Yissachar, N.; Stangl, G.I.; Eilers, E.; Bader, V.; Haase, S.; Kaisler, J.; David, C.; et al. Propionic Acid Shapes the Multiple Sclerosis Disease Course by an Immunomodulatory Mechanism. Cell 2020, 180, 1067–1080. [Google Scholar] [CrossRef]
- Saresella, M.; Marventano, I.; Barone, M.; La Rosa, F.; Piancone, F.; Mendozzi, L.; d’Arma, A.; Rossi, V.; Pugnetti, L.; Roda, G.; et al. Alterations in Circulating Fatty Acid Are Associated With Gut Microbiota Dysbiosis and Inflammation in Multiple Sclerosis. Front. Immunol. 2020, 11, 1390. [Google Scholar] [CrossRef] [PubMed]
- Wu, G.; Jiang, Z.; Pu, Y.; Chen, S.; Wang, T.; Wang, Y.; Xu, X.; Wang, S.; Jin, M.; Yao, Y.; et al. Serum short-chain fatty acids and its correlation with motor and non-motor symptoms in Parkinson’s disease patients. BMC Neurol. 2022, 22, 1–9. [Google Scholar] [CrossRef] [PubMed]
- Trend, S.; Leffler, J.; Jones, A.P.; Cha, L.; Gorman, S.; Brown, D.A.; Breit, S.N.; Kermode, A.G.; French, M.A.; Ward, N.C.; et al. Associations of serum short-chain fatty acids with circulating immune cells and serum biomarkers in patients with multiple sclerosis. Sci. Rep. 2021, 11, 1–15. [Google Scholar] [CrossRef] [PubMed]
- Ben Thabet, J.; Gassara, I.; Smaoui, N.; Msaad, S.; Maalej Bouali, M.; Yaich, S.; Omri, S.; Feki, R.; Zouari, L.; Charfi, N.; et al. Effects of continuous positive airway pressure on depression, anxiety and quality of life in obstructive sleep apnea hypopnea syndrome patients. Encephale 2021. [Google Scholar] [CrossRef]
- Aftab, Z.; Anthony, A.T.; Rahmat, S.; Sangle, P.; Khan, S. An Updated Review on the Relationship of Depressive Symptoms in Obstructive Sleep Apnea and Continuous Positive Airway Pressure. Cureus 2021, 13. [Google Scholar] [CrossRef]
- Walker, A.; Naughton, M.T.; Shaw, L.; Jeklin, A.T.; Martin, C.; Dabscheck, E. Depression scores improve with continuous positive airway pressure in specialized sleep clinics: Real-world data. J. Clin. Sleep Med. 2021, 17, 1201–1209. [Google Scholar] [CrossRef]
- Beck, A.T.; Steer, R.A.; Brown, G.K. Manual for the Beck depression inventory-II. San Antonio, TX Psychol. Corp. 1996, 1–82. [Google Scholar]
- Zawadzki, B.; Popiel, A.; Praglowska, E. PSYCHOMETRIC PROPERTIES OF THE POLISH VERSION OF THE AARON T. BECK’S DEPRESSION INVENTORY BDI-II (Charakterystyka psychometryczna polskiej adaptacji Kwestionariusza Depresji BDI-II Aarona T. Becka). Psychologia-Etologia-Genetyka 2009, 19, 71–95. [Google Scholar]
- Badran, M.; Mashaqi, S.; Gozal, D. The gut microbiome as a target for adjuvant therapy in obstructive sleep apnea. Expert Opin. Ther. Targets 2020, 24, 1263–1282. [Google Scholar] [CrossRef]
- Banjare, J.; Salunke, M.; Indapurkar, K.; Ghate, U.; Bhalerao, S. Estimation of serum malondialdehyde as a marker of lipid peroxidation in medical students undergoing examination-induced psychological stress. J. Sci. Soc. 2017, 44, 137. [Google Scholar] [CrossRef]
- Pietrukaniec, M.; Migacz, M.; Zak-Gołąb, A.; Olszanecka-Glinianowicz, M.; Chudek, J.; Duława, J.; Holecki, M. Zonulin Family Peptide Levels in Ascites and Serum in Patients with Liver Cirrhosis: A Preliminary Study. Dis. Markers 2019, 2019. [Google Scholar] [CrossRef] [PubMed]
- Prudente, R.; Ferrari, R.; Mesquita, C.; Machado, L.; Franco, E.; Godoy, I.; Tanni, S. Nine-Year Follow-Up of Interleukin 6 in Chronic Obstructive Pulmonary Disease - Complementary Results from Previous Studies. Int. J. Chron. Obstruct. Pulmon. Dis. 2021, 16, 3019–3026. [Google Scholar] [CrossRef] [PubMed]
- Ridker, P.M.; Rifai, N.; Pfeffer, M.; Sacks, F.; Lepage, S.; Braunwald, E. Elevation of Tumor Necrosis Factor-α and Increased Risk of Recurrent Coronary Events After Myocardial Infarction. Circulation 2000, 101, 2149–2153. [Google Scholar] [CrossRef] [PubMed] [Green Version]
- Burg, M.M.; Meadows, J.; Shimbo, D.; Davidson, K.W.; Schwartz, J.E.; Soufer, R. Confluence of depression and acute psychological stress among patients with stable coronary heart disease: Effects on myocardial perfusion. J. Am. Heart Assoc. 2014, 3, e000898. [Google Scholar] [CrossRef] [Green Version]
- Vasas, P.; Gupta, A.; Owers, C.; Komolafe, O.; Finney, J.; Kirk, K.; Hussain, A.; Rai, M.; Dobbin, B.; Yeluri, S.; et al. Obstructive Sleep Apnoea Screening Preoperatively with the Epworth Questionnaire: Is It Worth It? Obes. Surg. 2019, 29, 851–857. [Google Scholar] [CrossRef]
- Janelidze, S.; Mattei, D.; Westrin, Å.; Träskman-Bendz, L.; Brundin, L. Cytokine levels in the blood may distinguish suicide attempters from depressed patients. Brain. Behav. Immun. 2011, 25, 335–339. [Google Scholar] [CrossRef] [Green Version]
- Yao, L.; Pan, L.H.; Qian, M.; Sun, W.; Gu, C.H.; Chen, L.H.; Tang, X.C.; Hu, Y.G.; Xu, L.H.; Wei, Y.Y.; et al. Tumor Necrosis Factor-α Variations in Patients With Major Depressive Disorder Before and After Antidepressant Treatment. Front. Psychiatry 2020, 11, 1372. [Google Scholar] [CrossRef]
- Maget, A.; Dalkner, N.; Hamm, C.; Bengesser, S.A.; Fellendorf, F.T.; Platzer, M.; Queissner, R.; Birner, A.; Lenger, M.; Mörkl, S.; et al. Sex differences in zonulin in affective disorders and associations with current mood symptoms. J. Affect. Disord. 2021, 294, 441–446. [Google Scholar] [CrossRef]
- Jenkins, D.G.; Quintana-Ascencio, P.F. A solution to minimum sample size for regressions. PLoS ONE 2020, 15, e0229345. [Google Scholar] [CrossRef] [Green Version]


| Area of Interest | Material and Method | Potential Endophenotype Marker of OSA-Related Depression | |
|---|---|---|---|
| General | SQ | Weight, BMI, comorbidities, medications | |
| SF-36 | QoL | ||
| Clinical symptoms | Sleep-related | PSG | AHI |
| ESS, PSQI, AIS, ISI | Daily sleepiness, sleep quality, insomnia, chronotype | ||
| psychological | BDI | Depressiveness | |
| Inflammation | Blood serum, ELISA | TNF-α, Il-6 | |
| Oxidative stress | Blood serum, ELISA | TAC, MDA | |
| Intestinal permeability | Blood serum, ELISA | Zonulin, LBP, I-FABP, Calp | |
| Microbiota function | Blood serum, | SCFAs | |
Publisher’s Note: MDPI stays neutral with regard to jurisdictional claims in published maps and institutional affiliations. |
© 2022 by the authors. Licensee MDPI, Basel, Switzerland. This article is an open access article distributed under the terms and conditions of the Creative Commons Attribution (CC BY) license (https://creativecommons.org/licenses/by/4.0/).
Share and Cite
Gawlik-Kotelnicka, O.; Margulska, A.; Gabryelska, A.; Sochal, M.; Białasiewicz, P.; Strzelecki, D. “Leaky Gut” as a Keystone of the Connection between Depression and Obstructive Sleep Apnea Syndrome? A Rationale and Study Design. Metabolites 2022, 12, 152. https://doi.org/10.3390/metabo12020152
Gawlik-Kotelnicka O, Margulska A, Gabryelska A, Sochal M, Białasiewicz P, Strzelecki D. “Leaky Gut” as a Keystone of the Connection between Depression and Obstructive Sleep Apnea Syndrome? A Rationale and Study Design. Metabolites. 2022; 12(2):152. https://doi.org/10.3390/metabo12020152
Chicago/Turabian StyleGawlik-Kotelnicka, Oliwia, Aleksandra Margulska, Agata Gabryelska, Marcin Sochal, Piotr Białasiewicz, and Dominik Strzelecki. 2022. "“Leaky Gut” as a Keystone of the Connection between Depression and Obstructive Sleep Apnea Syndrome? A Rationale and Study Design" Metabolites 12, no. 2: 152. https://doi.org/10.3390/metabo12020152