
CYP2C9 Polymorphism Influence in PK/PD Model of Naproxen and 6-O-Desmethylnaproxen in Oral Fluid
 , , and
Abstract
:1. Introduction
2. Materials and Methods
2.1. Chemicals and Reagents
2.2. Volunteers Selection and Sample Collection for PK Analysis
2.3. Genotyping CYP2C9
2.4. Sample Preparation and Extraction Methodology
2.5. LC-MS/MS
2.6. Preparation of Standard Solutions and Validation
2.7. Statistical Analysis
3. Results
3.1. Genotyping CYP2C9
3.2. Calibration Curve of Naproxen, 6-O-Desmethylnaproxen, and PGE2
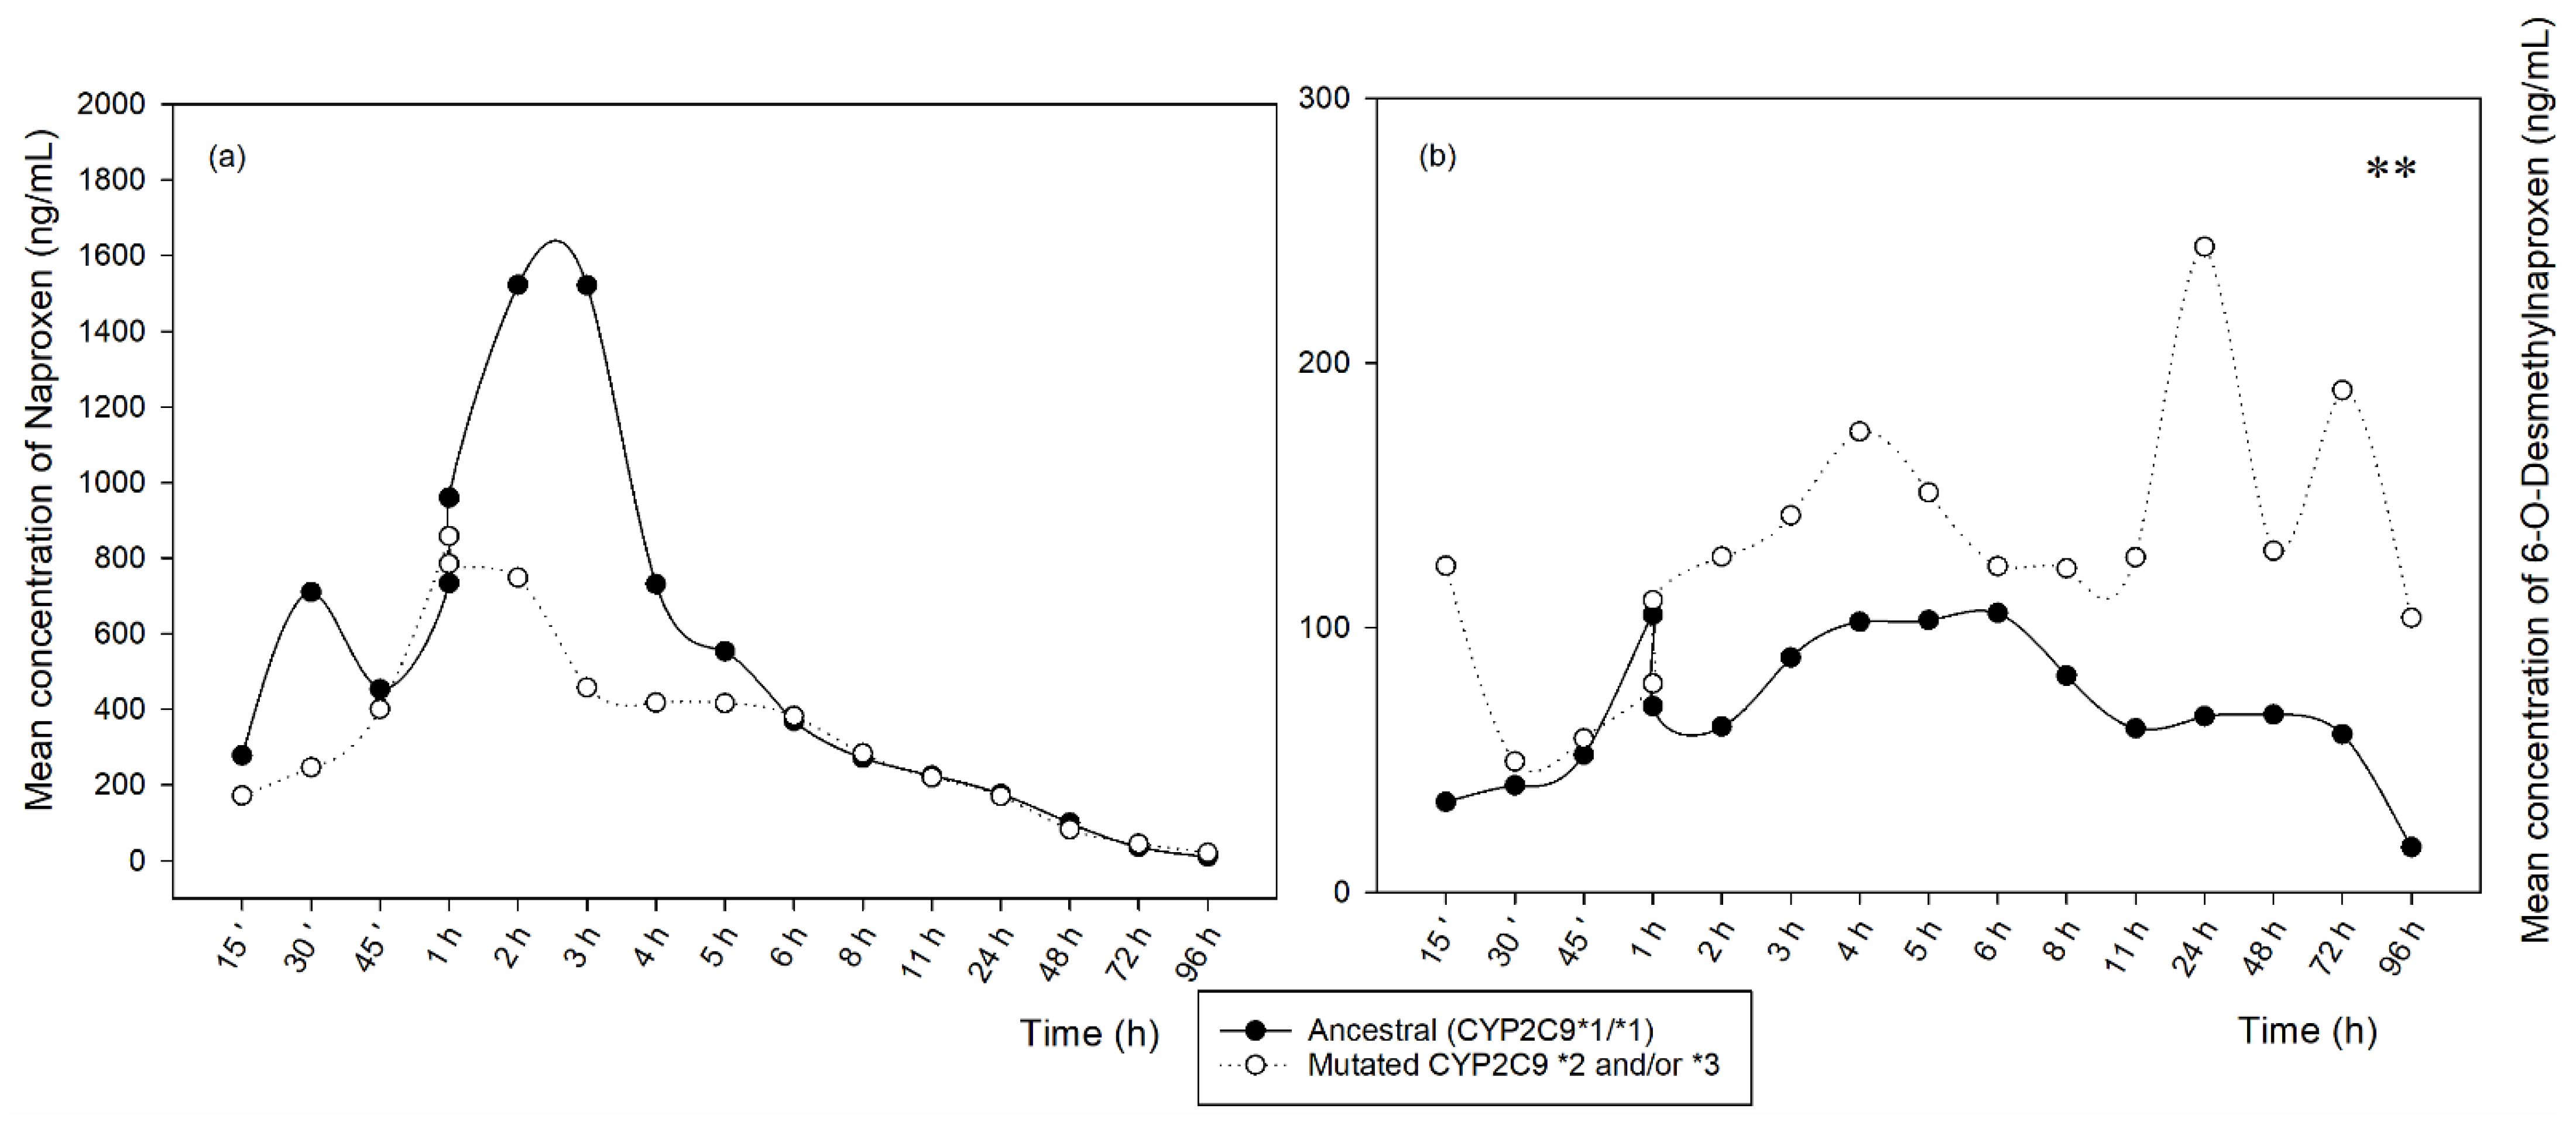
3.3. PK Analysis
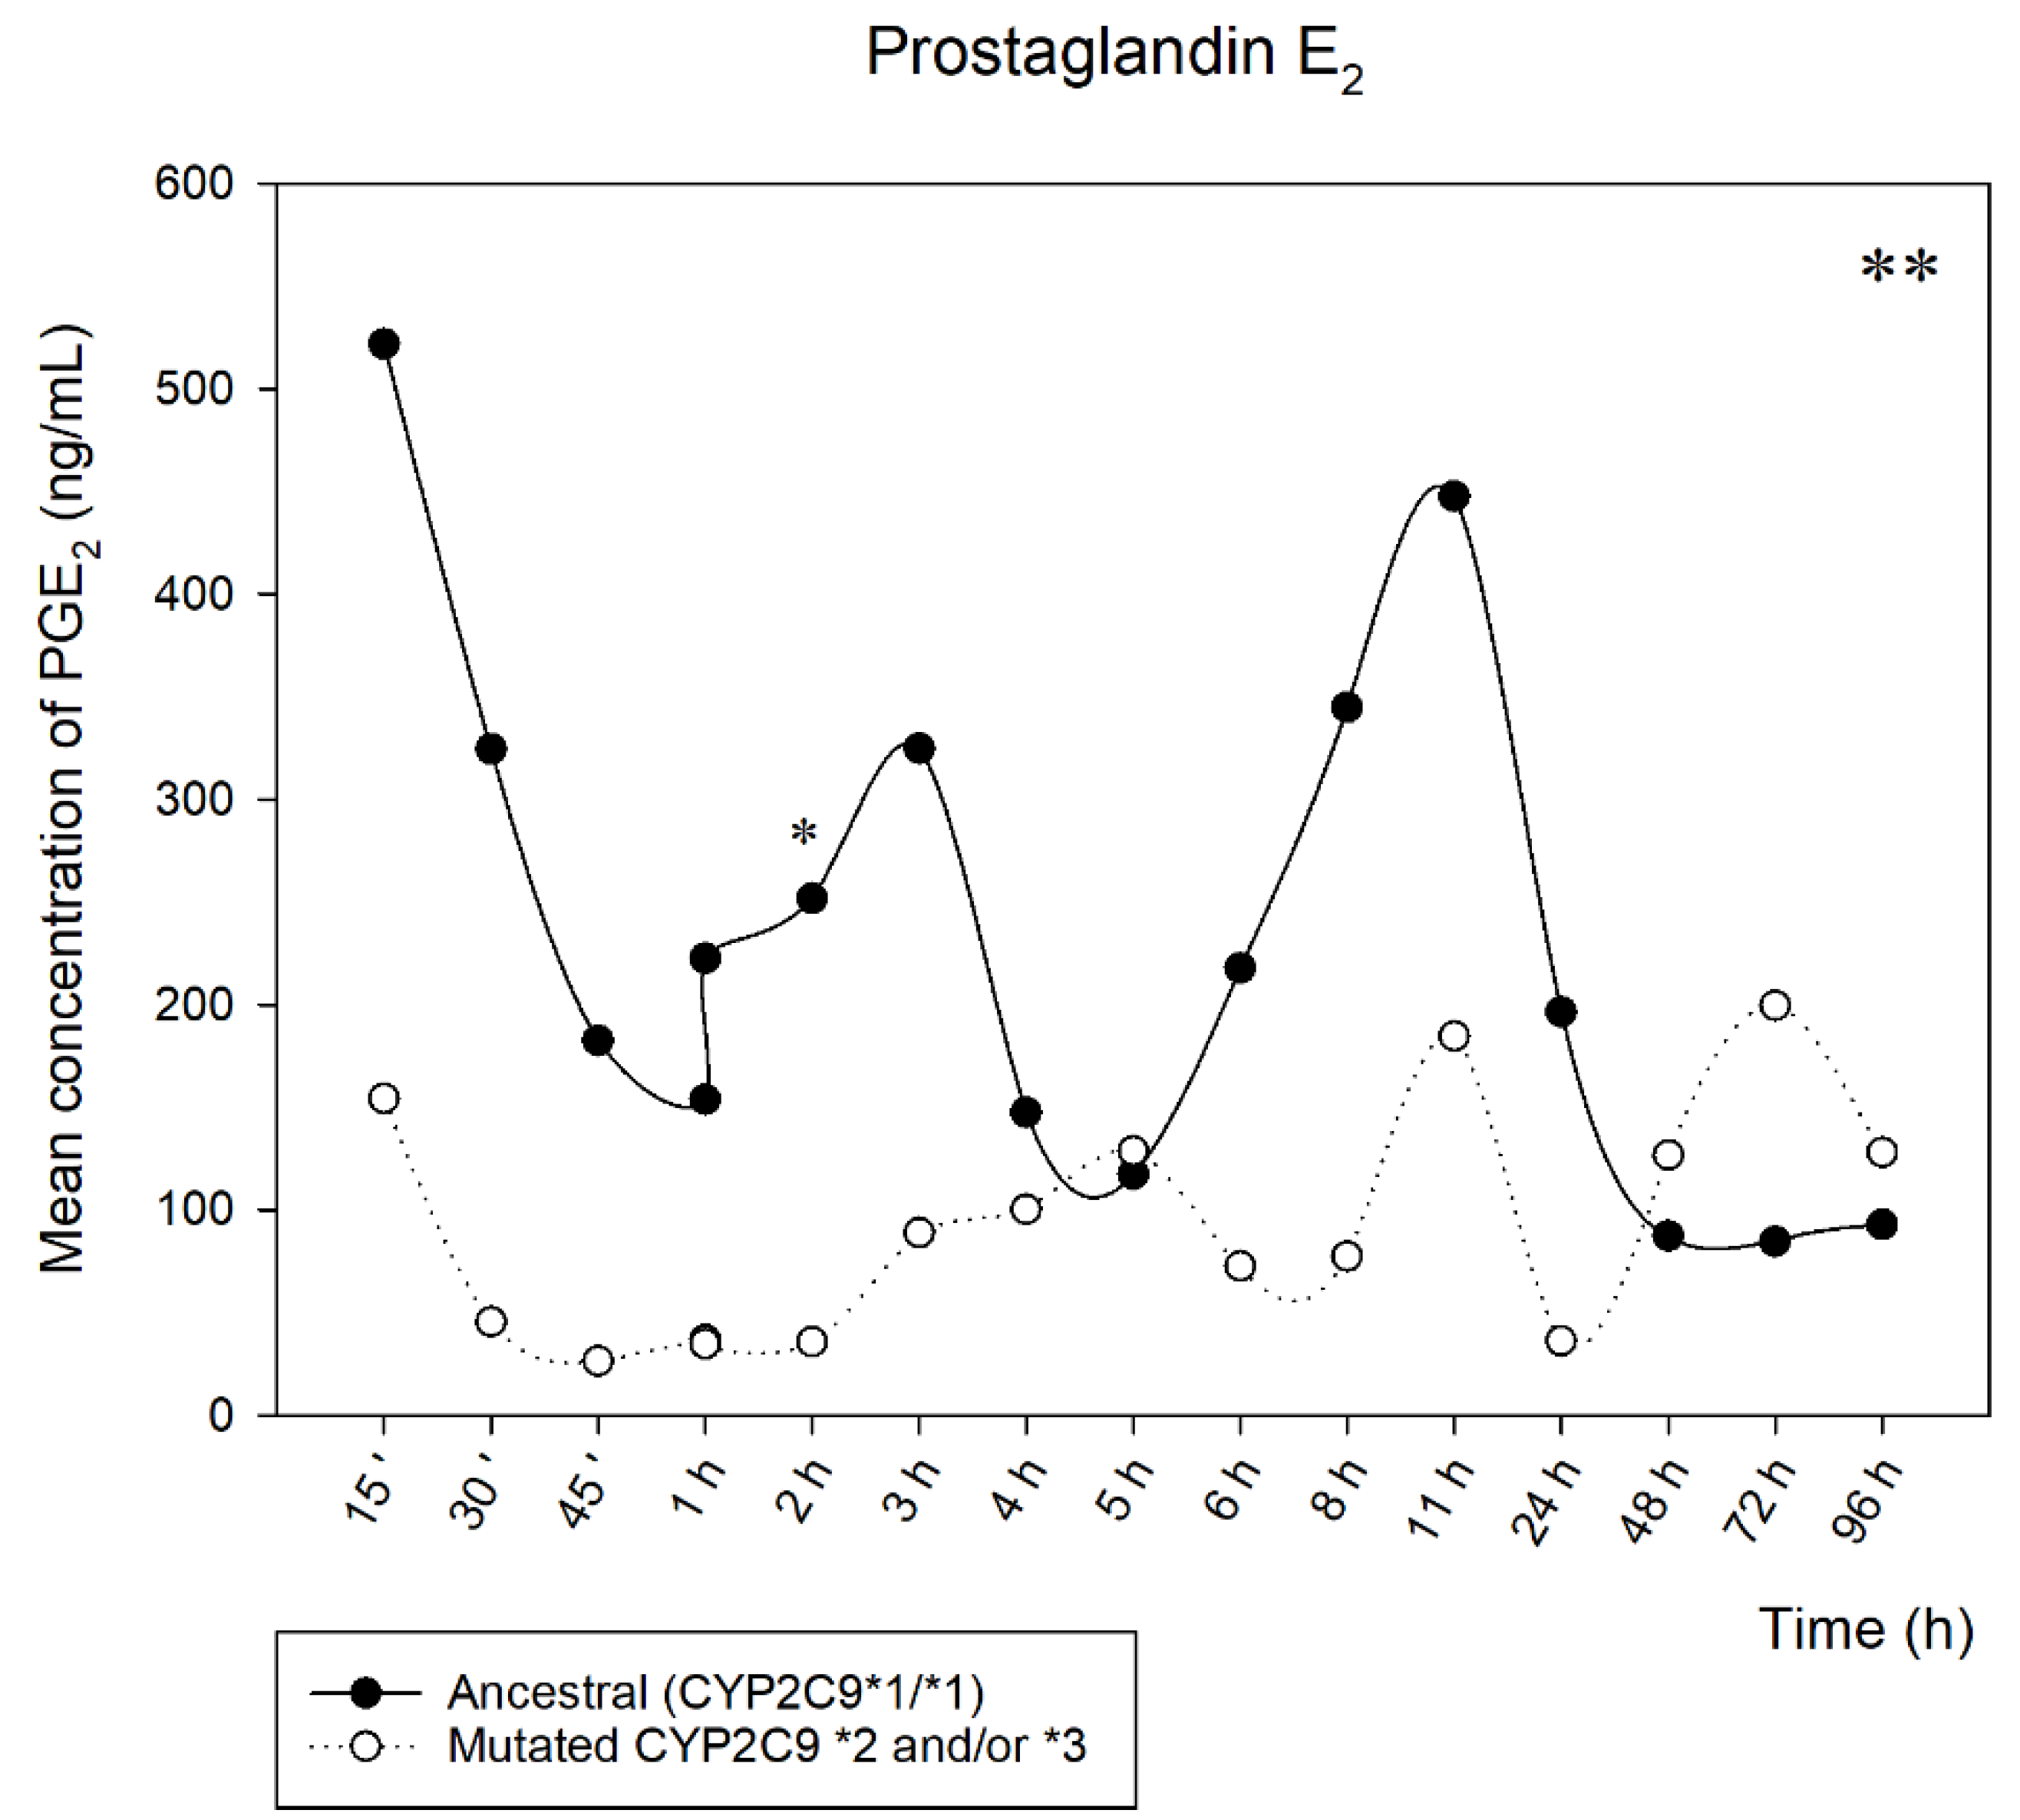
3.4. PGE2 Analysis
3.5. Analytical Validation
4. Discussion
5. Conclusions
Author Contributions
Funding
Institutional Review Board Statement
Informed Consent Statement
Data Availability Statement
Acknowledgments
Conflicts of Interest
References
- Ahmed, S.; Zhou, Z.; Zhou, J.; Chen, S.-Q. Pharmacogenomics of Drug Metabolizing Enzymes and Transporters: Relevance to Precision Medicine. Genom. Proteom. Bioinform. 2016, 14, 298–313. [Google Scholar] [CrossRef] [PubMed] [Green Version]
- Rollason, V.; Samer, C.; Piguet, V.; Dayer, P.; Desmeules, J. Pharmacogenetics of Analgesics: Toward the Individualization of Prescription. Pharmacogenomics 2008, 9, 905–933. [Google Scholar] [CrossRef] [PubMed]
- Vianna-Jorge, R.; Perini, J.A.; Rondinelli, E.; Suarez-Kurtz, G. CYP2C9 Genotypes and the Pharmacokinetics of Tenoxicam in Brazilians. Clin. Pharmacol. Ther. 2004, 76, 18–26. [Google Scholar] [CrossRef] [PubMed]
- Perini, J.A.; Vianna-Jorge, R.; Brogliato, A.R.; Suarez-Kurtz, G. Influence of CYP2C9 Genotypes on the Pharmacokinetics and Pharmacodynamics of Piroxicam. Clin. Pharmacol. Ther. 2005, 78, 362–369. [Google Scholar] [CrossRef] [PubMed]
- Rodrigues, A.D. Impact of cyp2c9 genotype on pharmacokinetics: Are all cyclooxygenase inhibitors the same: Table 1. Drug Metab. Dispos. 2005, 33, 1567–1575. [Google Scholar] [CrossRef] [PubMed] [Green Version]
- Theken, K.N.; Lee, C.R.; Gong, L.; Caudle, K.E.; Formea, C.M.; Gaedigk, A.; Klein, T.E.; Agúndez, J.A.G.; Grosser, T. Clinical Pharmacogenetics Implementation Consortium Guideline (CPIC) for CYP2C9 and Nonsteroidal Anti-Inflammatory Drugs. Clin. Pharmacol. Ther. 2020, 108, 191–200. [Google Scholar] [CrossRef] [PubMed]
- Daly, A.; Rettie, A.; Fowler, D.; Miners, J. Pharmacogenomics of CYP2C9: Functional and Clinical Considerations. J. Pers. Med. 2017, 8, 1. [Google Scholar] [CrossRef] [Green Version]
- Meibohm, B.; Derendorf, H. Basic Concepts of Pharmacokinetic/Pharmacodynamic (PK/PD) Modelling. Int. J. Clin. Pharmacol. Ther. 1997, 35, 401–413. [Google Scholar]
- Zhuang, X.; Lu, C. PBPK Modeling and Simulation in Drug Research and Development. Acta Pharm. Sin. B 2016, 6, 430–440. [Google Scholar] [CrossRef] [Green Version]
- Kim, Y.-H.; Kang, P.; Cho, C.; Jung, E.H.; Park, H.-J.; Lee, Y.J.; Bae, J.; Jang, C.-G.; Lee, S.-Y. Physiologically Based Pharmacokinetic (PBPK) Modeling for Prediction of Celecoxib Pharmacokinetics According to CYP2C9 Genetic Polymorphism. Arch. Pharm. Res. 2021, 44, 713–724. [Google Scholar] [CrossRef]
- Cho, C.-K.; Kang, P.; Park, H.-J.; Ko, E.; Mu, C.Y.; Lee, Y.J.; Choi, C.-I.; Kim, H.S.; Jang, C.-G.; Bae, J.-W.; et al. Physiologically Based Pharmacokinetic (PBPK) Modeling of Piroxicam with Regard to CYP2C9 Genetic Polymorphism. Arch. Pharm. Res. 2022, 45, 352–366. [Google Scholar] [CrossRef] [PubMed]
- Rüdesheim, S.; Wojtyniak, J.-G.; Selzer, D.; Hanke, N.; Mahfoud, F.; Schwab, M.; Lehr, T. Physiologically Based Pharmacokinetic Modeling of Metoprolol Enantiomers and α-Hydroxymetoprolol to Describe CYP2D6 Drug-Gene Interactions. Pharmaceutics 2020, 12, 1200. [Google Scholar] [CrossRef] [PubMed]
- Cho, C.; Kang, P.; Park, H.-J.; Lee, Y.J.; Bae, J.; Jang, C.-G.; Lee, S.-Y. Physiologically Based Pharmacokinetic (PBPK) Modelling of Tamsulosin Related to CYP2D6*10 Allele. Arch. Pharm. Res. 2021, 44, 1037–1049. [Google Scholar] [CrossRef]
- Jung, E.H.; Cho, C.-K.; Kang, P.; Park, H.-J.; Lee, Y.J.; Bae, J.; Choi, C.-I.; Jang, C.-G.; Lee, S.-Y. Physiologically Based Pharmacokinetic Modeling of Candesartan Related to CYP2C9 Genetic Polymorphism in Adult and Pediatric Patients. Arch. Pharm. Res. 2021, 44, 1109–1119. [Google Scholar] [CrossRef]
- Xu, M.; Zheng, L.; Zeng, J.; Xu, W.; Jiang, X.; Wang, L. Physiologically Based Pharmacokinetic Modeling of Tramadol to Inform Dose Adjustment and Drug-Drug Interactions According to CYP2D6 Phenotypes. Pharmacother. J. Hum. Pharmacol. Drug Ther. 2021, 41, 277–290. [Google Scholar] [CrossRef]
- Loisios-Konstantinidis, I.; Cristofoletti, R.; Jamei, M.; Turner, D.; Dressman, J. Physiologically Based Pharmacokinetic/Pharmacodynamic Modeling to Predict the Impact of CYP2C9 Genetic Polymorphisms, Co-Medication and Formulation on the Pharmacokinetics and Pharmacodynamics of Flurbiprofen. Pharmaceutics 2020, 12, 1049. [Google Scholar] [CrossRef] [PubMed]
- Cho, C.; Park, H.-J.; Kang, P.; Moon, S.; Lee, Y.J.; Bae, J.; Jang, C.-G.; Lee, S.-Y. Physiologically Based Pharmacokinetic (PBPK) Modeling of Meloxicam in Different CYP2C9 Genotypes. Arch. Pharm. Res. 2021, 44, 1076–1090. [Google Scholar] [CrossRef]
- Zou, H.; Banerjee, P.; Leung, S.S.Y.; Yan, X. Application of Pharmacokinetic-Pharmacodynamic Modeling in Drug Delivery: Development and Challenges. Front. Pharmacol. 2020, 11, 997. [Google Scholar] [CrossRef]
- Lon, H.-K.; Liu, D.; Jusko, W.J. Pharmacokinetic/Pharmacodynamic Modeling in Inflammation. Crit. Rev. Biomed. Eng. 2012, 40, 295–312. [Google Scholar] [CrossRef] [Green Version]
- Oliveira, G.M.; Dionísio, T.J.; Weckwerth, G.M.; Siqueira-Sandrin, V.S.; Polanco, N.L.D.H.; Faria, F.A.C.; Santos, C.F.; Calvo, A.M. Detection and Quantification of Prostaglandin E2 in Saliva by Liquid Chromatography-Tandem Mass Spectrometry Using Microextraction by Packed Sorbent. Prostaglandins Other Lipid Mediat. 2022, 163, 106672. [Google Scholar] [CrossRef]
- Shin, D.; Lee, S.J.; Ha, Y.-M.; Choi, Y.-S.; Kim, J.-W.; Park, S.-R.; Park, M.K. Pharmacokinetic and Pharmacodynamic Evaluation According to Absorption Differences in Three Formulations of Ibuprofen. Drug Des. Devel. Ther. 2017, 11, 135–141. [Google Scholar] [CrossRef] [PubMed]
- Dionísio, T.J.; Oliveira, G.M.; Morettin, M.; Faria, F.C.; Santos, C.F.; Calvo, A.M. Simultaneous Separation of Naproxen and 6-O-Desmethylnaproxen Metabolite in Saliva Samples by Liquid Chromatography–Tandem Mass Spectrometry: Pharmacokinetic Study of Naproxen Alone and Associated with Esomeprazole. PLoS ONE 2020, 15, e0236297. [Google Scholar] [CrossRef]
- Bolani, B.; Oliveira, G.M.; Dionísio, T.J.; Faria, F.A.C.; Fernandes, M.H.R.; Santos, C.F.; Calvo, A.M. Pharmacogenetic and Pharmacokinetic Assays from Saliva Samples Can Guarantee Personalized Drug Prescription. Braz. Dent. J. 2021, 32, 3–8. [Google Scholar] [CrossRef]
- Calvo, A.M.; Santos, G.M.; Dionísio, T.J.; Marques, M.P.; Brozoski, D.T.; Lanchote, V.L.; Fernandes, M.H.R.; Faria, F.A.C.; Santos, C.F. Quantification of Piroxicam and 5′-Hydroxypiroxicam in Human Plasma and Saliva Using Liquid Chromatography–Tandem Mass Spectrometry Following Oral Administration. J. Pharm. Biomed. Anal. 2016, 120, 212–220. [Google Scholar] [CrossRef] [PubMed]
- Pase, U.; Tafuro, A. [Pharmacokinetics of sodium naproxen in the blood and saliva of healthy individuals]. G. Stomatol. Ortognatodonzia 1984, 3, 364–365. [Google Scholar] [PubMed]
- Davies, N.M.; Anderson, K.E. Clinical Pharmacokinetics of Naproxen. Clin. Pharmacokinet. 1997, 32, 268–293. [Google Scholar] [CrossRef] [PubMed]
- Ahmed, H.; Wahbi, A.-A.; Elmongy, H.; Amini, A.; Koyi, H.; Branden, E.; Abdel-Rehim, M. Determination and Pharmacokinetics of Omeprazole Enantiomers in Human Plasma and Oral Fluid Utilizing Microextraction by Packed Sorbent and Liquid Chromatography-Tandem Mass Spectrometry. Int. J. Anal. Chem. 2021, 2021, 8845139. [Google Scholar] [CrossRef]
- Daryanavard, S.M.; Zolfaghari, H.; Abdel-Rehim, A.; Abdel-Rehim, M. Recent Applications of Microextraction Sample Preparation Techniques in Biological Samples Analysis. Biomed. Chromatogr. 2021, 35, e5105. [Google Scholar] [CrossRef]
- Abdel-Rehim, M.; Pedersen-Bjergaard, S.; Abdel-Rehim, A.; Lucena, R.; Moein, M.M.; Cárdenas, S.; Miró, M. Microextraction Approaches for Bioanalytical Applications: An Overview. J. Chromatogr. A 2020, 1616, 460790. [Google Scholar] [CrossRef]
- Calvo, A.M.; Zupelari-Gonçalves, P.; Dionísio, T.J.; Brozoski, D.T.; Faria, F.A.; Santos, C.F. Efficacy of Piroxicam for Postoperative Pain after Lower Third Molar Surgery Associated with CYP2C8*3 and CYP2C9. J. Pain Res. 2017, 10, 1581–1589. [Google Scholar] [CrossRef] [Green Version]
- Abdel-Rehim, M.; Altun, Z.; Blomberg, L. Microextraction in Packed Syringe (MEPS) for Liquid and Gas Chromatographic Applications. Part II?Determination of Ropivacaine and Its Metabolites in Human Plasma Samples Using MEPS with Liquid Chromatography/Tandem Mass Spectrometry. J. Mass Spectrom. 2004, 39, 1488–1493. [Google Scholar] [CrossRef] [PubMed]
- Abdel-Rehim, A.; Abdel-Rehim, M. Screening and Determination of Drugs in Human Saliva Utilizing Microextraction by Packed Sorbent and Liquid Chromatography-Tandem Mass Spectrometry. Biomed. Chromatogr. 2013, 27, 1188–1191. [Google Scholar] [CrossRef]
- Siqueira Sandrin, V.S.; Oliveira, G.M.; Weckwerth, G.M.; Polanco, N.L.D.H.; Faria, F.A.C.; Santos, C.F.; Calvo, A.M. Analysis of Different Methods of Extracting NSAIDs in Biological Fluid Samples for LC-MS/MS Assays: Scoping Review. Metabolites 2022, 12, 751. [Google Scholar] [CrossRef]
- Sorribes-Soriano, A.; Verdeguer, J.; Pastor, A.; Armenta, S.; Esteve-Turrillas, F.A. Determination of Third-Generation Synthetic Cannabinoids in Oral Fluids. J. Anal. Toxicol. 2021, 45, 331–336. [Google Scholar] [CrossRef]
- U.S. FDA. Guidance for Industry Bioanalytical Method Validation; U.S. FDA: Silver Spring, MD, USA, 2018. [Google Scholar]
- Sangkuhl, K.; Claudio-Campos, K.; Cavallari, L.H.; Agundez, J.A.G.; Whirl-Carrillo, M.; Duconge, J.; Del Tredici, A.L.; Wadelius, M.; Rodrigues Botton, M.; Woodahl, E.L.; et al. PharmVar GeneFocus: CYP2C9. Clin. Pharmacol. Ther. 2021, 110, 662–676. [Google Scholar] [CrossRef] [PubMed]
- Céspedes-Garro, C.; Fricke-Galindo, I.; Naranjo, M.E.G.; Rodrigues-Soares, F.; Fariñas, H.; de Andrés, F.; López-López, M.; Peñas-Lledó, E.M.; LLerena, A. Worldwide Interethnic Variability and Geographical Distribution of CYP2C9 Genotypes and Phenotypes. Expert Opin. Drug Metab. Toxicol. 2015, 11, 1893–1905. [Google Scholar] [CrossRef] [PubMed]
- Waring, R.H. Cytochrome P450: Genotype to Phenotype. Xenobiotica 2020, 50, 9–18. [Google Scholar] [CrossRef]
- Miners, J.O.; Coulter, S.; Tukey, R.H.; Veronese, M.E.; Birkett, D.J. Cytochromes P450, 1A2, and 2C9 Are Responsible for the Human Hepatic O-Demethylation of R- and S-Naproxen. Biochem. Pharmacol. 1996, 51, 1003–1008. [Google Scholar] [CrossRef]
- Henderson, L.M.; Hopkins, S.E.; Boyer, B.B.; Thornton, T.A.; Rettie, A.E.; Thummel, K.E. In Vivo Functional Effects of CYP2C9 M1L, a Novel and Common Variant in the Yup’ik Alaska Native Population. Drug Metab. Dispos. 2021, 49, 345–352. [Google Scholar] [CrossRef]
- Calvo, A.M.; de Oliveira Prado, M.T.; Dionísio, T.J.; Marques, M.P.; Brozoski, D.T.; Lanchote, V.L.; Faria, F.A.C.; Santos, C.F. Effective Method for the Detection of Piroxicam in Human Plasma Using HPLC. Braz. Oral Res. 2016, 30, e58err. [Google Scholar] [CrossRef]
- de Moraes Oliveira, G.; Dionisio, T.; Siqueira, V.; Ferrari, L.; Bolani, B.; Parisi, V.; Del Hierro, N.; Ishikiriama, B.; Faria, F.A.C.; dos Santos, C.F.; et al. Data Repository: CYP2C9 Polymorphism Influence in PK/PD Model of Naproxen and 6-O-Desmethylnaproxen in Oral Fluid. Available online: https://data.mendeley.com/datasets/kjmphc464z (accessed on 9 October 2022).


| MEPS Procedure Step | The Optimized Parameters |
|---|---|
| Conditioning | Methanol (100 μL) and water (2 × 50 μL) consecutively, before first use |
| Extraction | Draw-ejected, 100 μL of oral fluid |
| Washing | Milli-Q water (50 μL) |
| Elution | 10 mM ammonium acetate + methanol (80:20, v/v), 1 × 100 μL |
| Injection | Dispensed into the vial and injected directly into the LC-MS/MS 8040 |
| Washing solution | (10 × 100 µL—Methanol) between each volunteer sample |
| Female n (%) | Male n (%) | Age—Years (Mean ± SD) | Body Weight—kg (Mean ± SD) | Height—m (Mean ± SD) |
|---|---|---|---|---|
| 20 (71.4) | 8 (28.6) | 30.39 ± 9.94 | 70.92 ± 19.65 | 1.65 ± 0.11 |
| Ancestral | Mutated CYP2C9 *2 and/or *3 (n = 12) | ||||
|---|---|---|---|---|---|
| CYP2C9 *1/*1 | CYP2C9 *1/*2 | CYP2C9 *2/*2 | CYP2C9 *1/*3 | CYP2C9 *2/*3 | |
| Volunteers | 16 | 5 | 1 | 3 | 3 |
| PK Parameters | Naproxen | p-Value | |
|---|---|---|---|
| Ancestral CYP2C9 *1 (n = 16) | Mutated CYP2C9 *2 and/or *3 (n = 12) | ||
| No Normal Distribuition | Median (Q1–Q3) | ||
| Tmax (h) | 1.96 (1.50–2.30) | 1.45 (0.91–1.99) | 0.144 |
| AUC0-t (h × ng/mL) | 5700.37 (2966.69–11,619.93) | 4613.98 (1554.67–7891.63) | 0.341 |
| Cl/F (L/h) | 96.53 (47.33–185.80) | 130.33 (69.69–356.14) | 0.341 |
| Vd/F (L) | 98.86 (55.58–322.07) | 380.22 (261.84–1097.99) * | 0.039 |
| Cmax (ng/mL) | 1980.79 (659.13–3610.94) | 718.33 (367.02–1373.52) | 0.131 |
| Kel (1/h) | 0.84 (0.69–1.34) | 1.86 (1.09–4.06) * | 0.039 |
| T1/2 (h) | 0.83 (0.372–2.086) | 2.77 (0.77–4.86) | 0.186 |
| PK Parameters | 6-O-Desmethylnaproxen | p-Value | |
| No Normal Distribuition | Median (Q1–Q3) | ||
| Tmax (h) | 5.21 (3.65–21.78) | 6.78 (2.83–19.81) | 0.871 |
| AUC0-t (h × ng/mL) | 2235.45 (864.31–7669.62) | 1809.93 (900.53–11,017.08) | 0.908 |
| Cl/F (L/h) | 261.41 (72.17–636.64) | 308.03(59.82–614.67) | 0.908 |
| Vd/F (L) | 1573.55 (1077.81–2373.21) | 1384.99 (783.79–2918.91) | 0.626 |
| Cmax (ng/mL) | 128.84 (85.45–188.68) | 152.88 (72.06–258.38) | 0.626 |
| Kel (1/h) | 0.21 (0.04–0.31) | 0.22 (0.052–0.39) | 0.472 |
| T1/2 (h) | 3.31 (2.22–15.10) | 4.13 (1.76–13.72) | 0.472 |
| Naproxen (Mean ± SD) | ||||
|---|---|---|---|---|
| PK Parameters | Mutated CYP2C9 *1/*2 (n = 5) | Mutated CYP2C9 *1/*3 (n = 3) | Mutated CYP2C9 *2/*3 (n = 3) | Mutated CYP2C9 *2/*2 (n = 1) |
| Tmax (h) | 1.56 ± 1.05 | 1.44 ± 0.34 | 1.85 ± 0.69 | 0.820 |
| AUC0-t (h × ng/mL) | 14,949.15 ± 20,058.54 | 3474.07 ± 3869.14 | 5511.24 ± 3213.44 | 880.49 |
| Cl/F (L/h) | 136.47 ± 144.79 | 374.83 ± 343.48 | 149.29 ± 128.26 | 624.65 |
| Vd/F (L) | 609.51 ± 622.08 | 563.75 ± 225.70 | 619.38 ± 547.85 | 391.95 |
| Cmax (ng/mL) | 1782.51 ± 2112.46 | 617.26 ± 364.61 | 1012.28 ± 602.66 | 516.21 |
| Kel (1/h) | 11.34 ± 20.61 | 2.51 ± 2.61 | 1.93 ± 0.24 | 1.59 |
| T1/2 (h) | 18.06 ± 31.98 | 2.23 ± 2.48 | 2.84 ± 0.19 | 0.43 |
| 6-O-desmethylnaproxen (Mean ± SD) | ||||
| Tmax (h) | 16.42 ± 15.09 | 11.83 ± 9.66 | 3.23 ± 1.25 | 13.8 |
| AUC0-t (h × ng/mL) | 13,499.10 ± 20,453.47 | 6511.06 ± 5908.19 | 981.38 ± 899.89 | 3712.5 |
| Cl/F (L/h) | 325.08 ± 288.51 | 166.32 ± 157.77 | 885.80 ± 533.50 | 148.1 |
| Vd/F (L) | 1734.15 ± 1749.44 | 1676.27 ± 1887.09 | 1934.06 ± 1202.80 | 2037.0 |
| Cmax (ng/mL) | 227.59 ± 185.87 | 327.01 ± 340.25 | 140.94 ± 93.86 | 99.3 |
| Kel (1/h) | 0.22 ± 0.22 | 0.18 ± 0.19 | 0.45 ± 0.17 | 0.1 |
| T1/2 (h) | 10.95 ± 10.91 | 8.20 ± 6.69 | 1.65 ± 0.53 | 9.5 |
| Naproxen | 6-O-Desmethylnaproxen | |||
|---|---|---|---|---|
| Concentration (ng/mL) | IS Normalized Matrix Factor (CV) | Concentration (ng/mL) | IS Normalized Matrix Factor (CV) | |
| Oral fluid (6 samples) | ||||
| LQC | 9.8 | 4.26 | 9.8 | 8.34 |
| HQC | 625 | 9.40 | 625 | 5.21 |
| Linearity | ||||
| r2 | 0.989 | 0.994 | ||
| Equation of the line | f(x) = 14801.9 × x−8502.29 | f(x) = 1903.97 × x + 13960.0 | ||
| Limit of quantification (ng/mL) | 2.4 | 2.4 | ||
| Precision (CV %; n = 10) | 11.06 | 10.71 | ||
| Accuracy (%) | −5.05 | −3.88 | ||
| Precision (CV.%) and Accuracy (RE.%) | ||||
| Intra-assay (n = 5) | CV | RE | CV | RE |
| LLOQ (2.4 ng/mL) | 9.80 | −2.78 | 8.45 | −5.15 |
| LQC (9.8 ng/mL) | 9.44 | 5.33 | 7.92 | 0.32 |
| MQC (312.5 ng/mL) | 4.81 | 7.42 | 5.16 | 9.98 |
| HQC (625 ng/mL) | 5.57 | 6.91 | 5.39 | 8.44 |
| DQC (2500 ng/mL; 1:5) | 9.01 | 6.42 | 5.51 | 7.33 |
| Interassay (n = 8) | ||||
| LLOQ (2.4 ng/mL) | 8.75 | −5.26 | 8.17 | −1.89 |
| LQC (9.8 ng/mL) | 6.49 | −4.84 | 9.23 | −1.21 |
| MQC (312.5 ng/mL) | 6.02 | 4.56 | 8.59 | 6.68 |
| HQC (625 ng/mL) | 9.81 | 4.42 | 9.69 | 1.9 |
| Stabilities (n = 3) | ||||
| Short-term stability (12 h at 23 °C) | ||||
| LQC (9.8 ng/mL) | 5.09 | 1.12 | ||
| HQC (625 ng/mL) | −1.84 | 9.09 | ||
| Post-processing stability (12 h at 4 °C) | ||||
| LQC (9.8 ng/mL) | 7.84 | 3.48 | ||
| HQC (625 ng/mL) | −2.33 | −1.52 | ||
| Freeze/thaw cycle stability (−70 °C) | ||||
| LQC (9.8 ng/mL) | −10.72 | 0.68 | ||
| HQC (625 ng/mL) | −3.77 | 6.12 | ||
Publisher’s Note: MDPI stays neutral with regard to jurisdictional claims in published maps and institutional affiliations. |
© 2022 by the authors. Licensee MDPI, Basel, Switzerland. This article is an open access article distributed under the terms and conditions of the Creative Commons Attribution (CC BY) license (https://creativecommons.org/licenses/by/4.0/).
Share and Cite
Oliveira, G.M.; Dionísio, T.J.; Siqueira-Sandrin, V.S.; Ferrari, L.A.d.L.; Bolani, B.; Parisi, V.A.; Polanco, N.L.D.H.; Colombini-Ishikiriama, B.L.; Faria, F.A.C.; Santos, C.F.; et al. CYP2C9 Polymorphism Influence in PK/PD Model of Naproxen and 6-O-Desmethylnaproxen in Oral Fluid. Metabolites 2022, 12, 1106. https://doi.org/10.3390/metabo12111106
Oliveira GM, Dionísio TJ, Siqueira-Sandrin VS, Ferrari LAdL, Bolani B, Parisi VA, Polanco NLDH, Colombini-Ishikiriama BL, Faria FAC, Santos CF, et al. CYP2C9 Polymorphism Influence in PK/PD Model of Naproxen and 6-O-Desmethylnaproxen in Oral Fluid. Metabolites. 2022; 12(11):1106. https://doi.org/10.3390/metabo12111106
Chicago/Turabian StyleOliveira, Gabriela Moraes, Thiago José Dionísio, Viviane Silva Siqueira-Sandrin, Leticia Alves de Lima Ferrari, Bruna Bolani, Viviane Aparecida Parisi, Nelson Leonel Del Hierro Polanco, Bella Luna Colombini-Ishikiriama, Flávio Augusto Cardoso Faria, Carlos Ferreira Santos, and et al. 2022. "CYP2C9 Polymorphism Influence in PK/PD Model of Naproxen and 6-O-Desmethylnaproxen in Oral Fluid" Metabolites 12, no. 11: 1106. https://doi.org/10.3390/metabo12111106