
Transcriptome Analysis Reveals That NEFA and β-Hydroxybutyrate Induce Oxidative Stress and Inflammatory Response in Bovine Mammary Epithelial Cells
 , and
, and 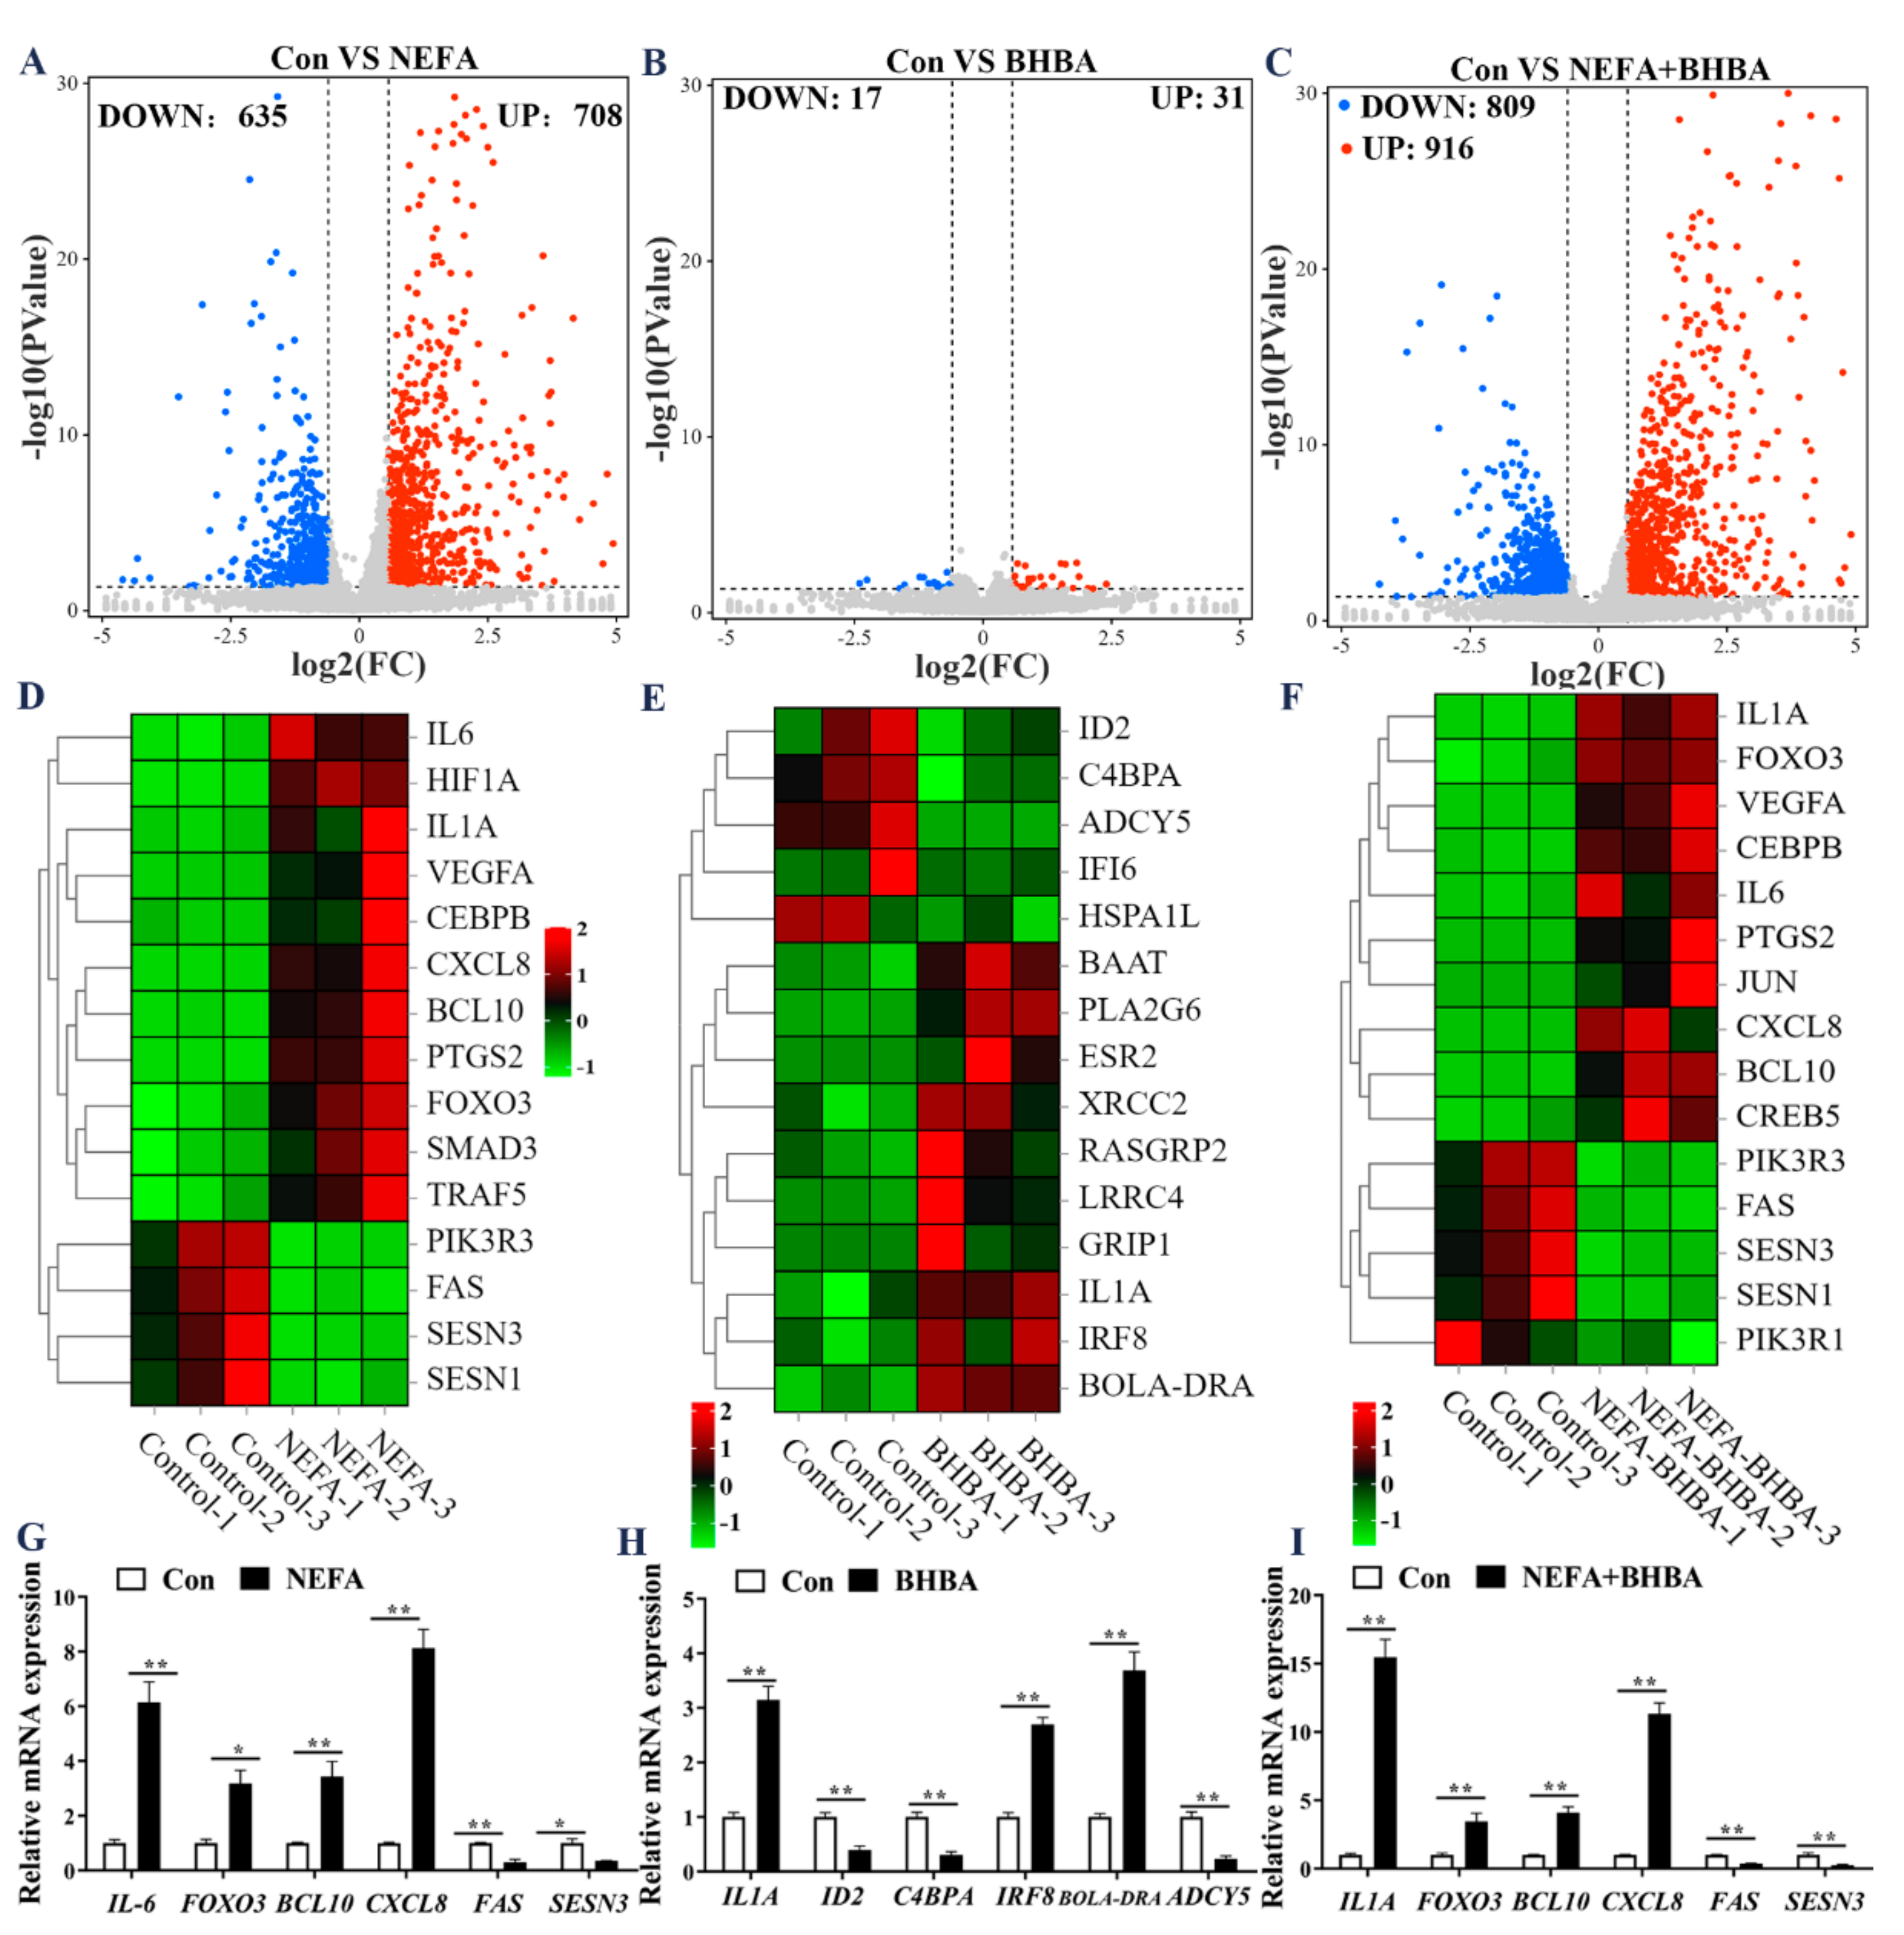
Abstract
:1. Introduction
2. Materials and Methods
2.1. Cell Culture and Treatments
2.2. Assay for Malondialdehyde, Superoxide Dismutase, and Glutathione Peroxidase
2.3. Intracellular Reactive Oxygen Species Measurement
2.4. Nitric Oxide Staining Assay
2.5. Enzyme-Linked Immunosorbent Assay (ELISA)
2.6. Real-Time Quantitative PCR Analysis
2.7. RNA-Seq and Transcriptome Analysis
2.8. Western Blot Analysis
2.9. Statistical Analysis
3. Results
3.1. Expression Dynamics of mRNAs in BMECs under the Treatment with NEFA and BHBA
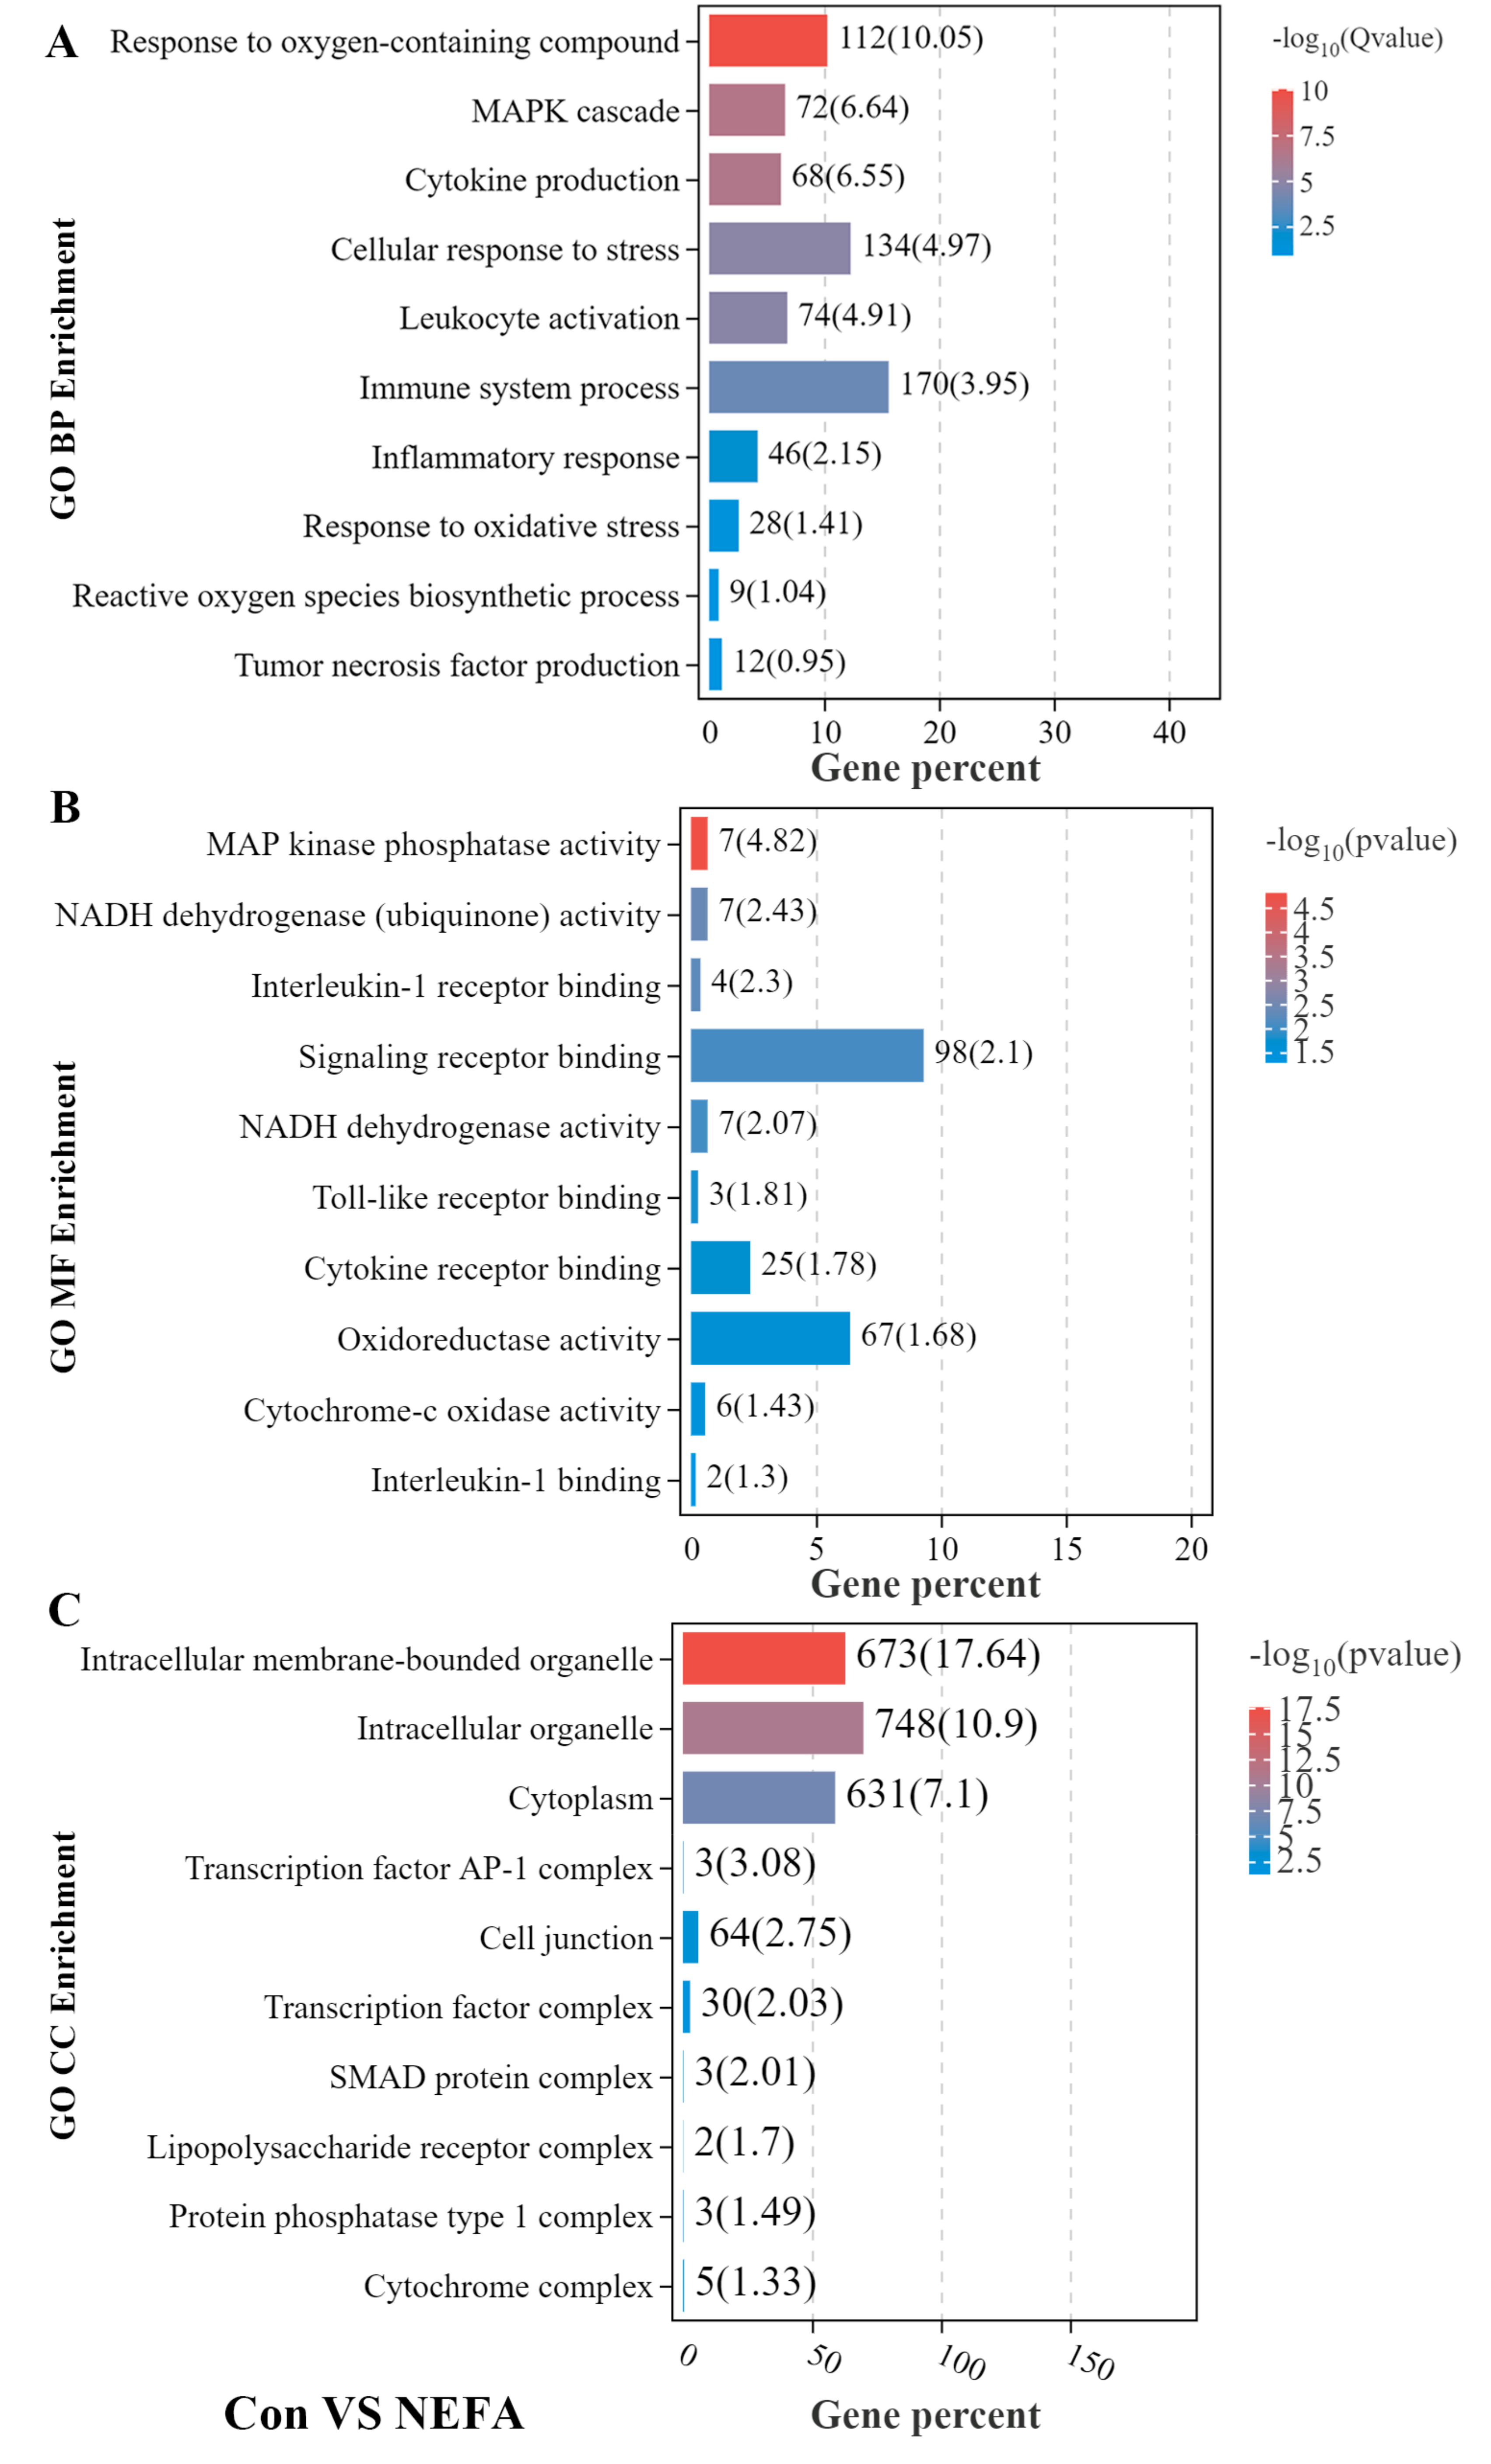
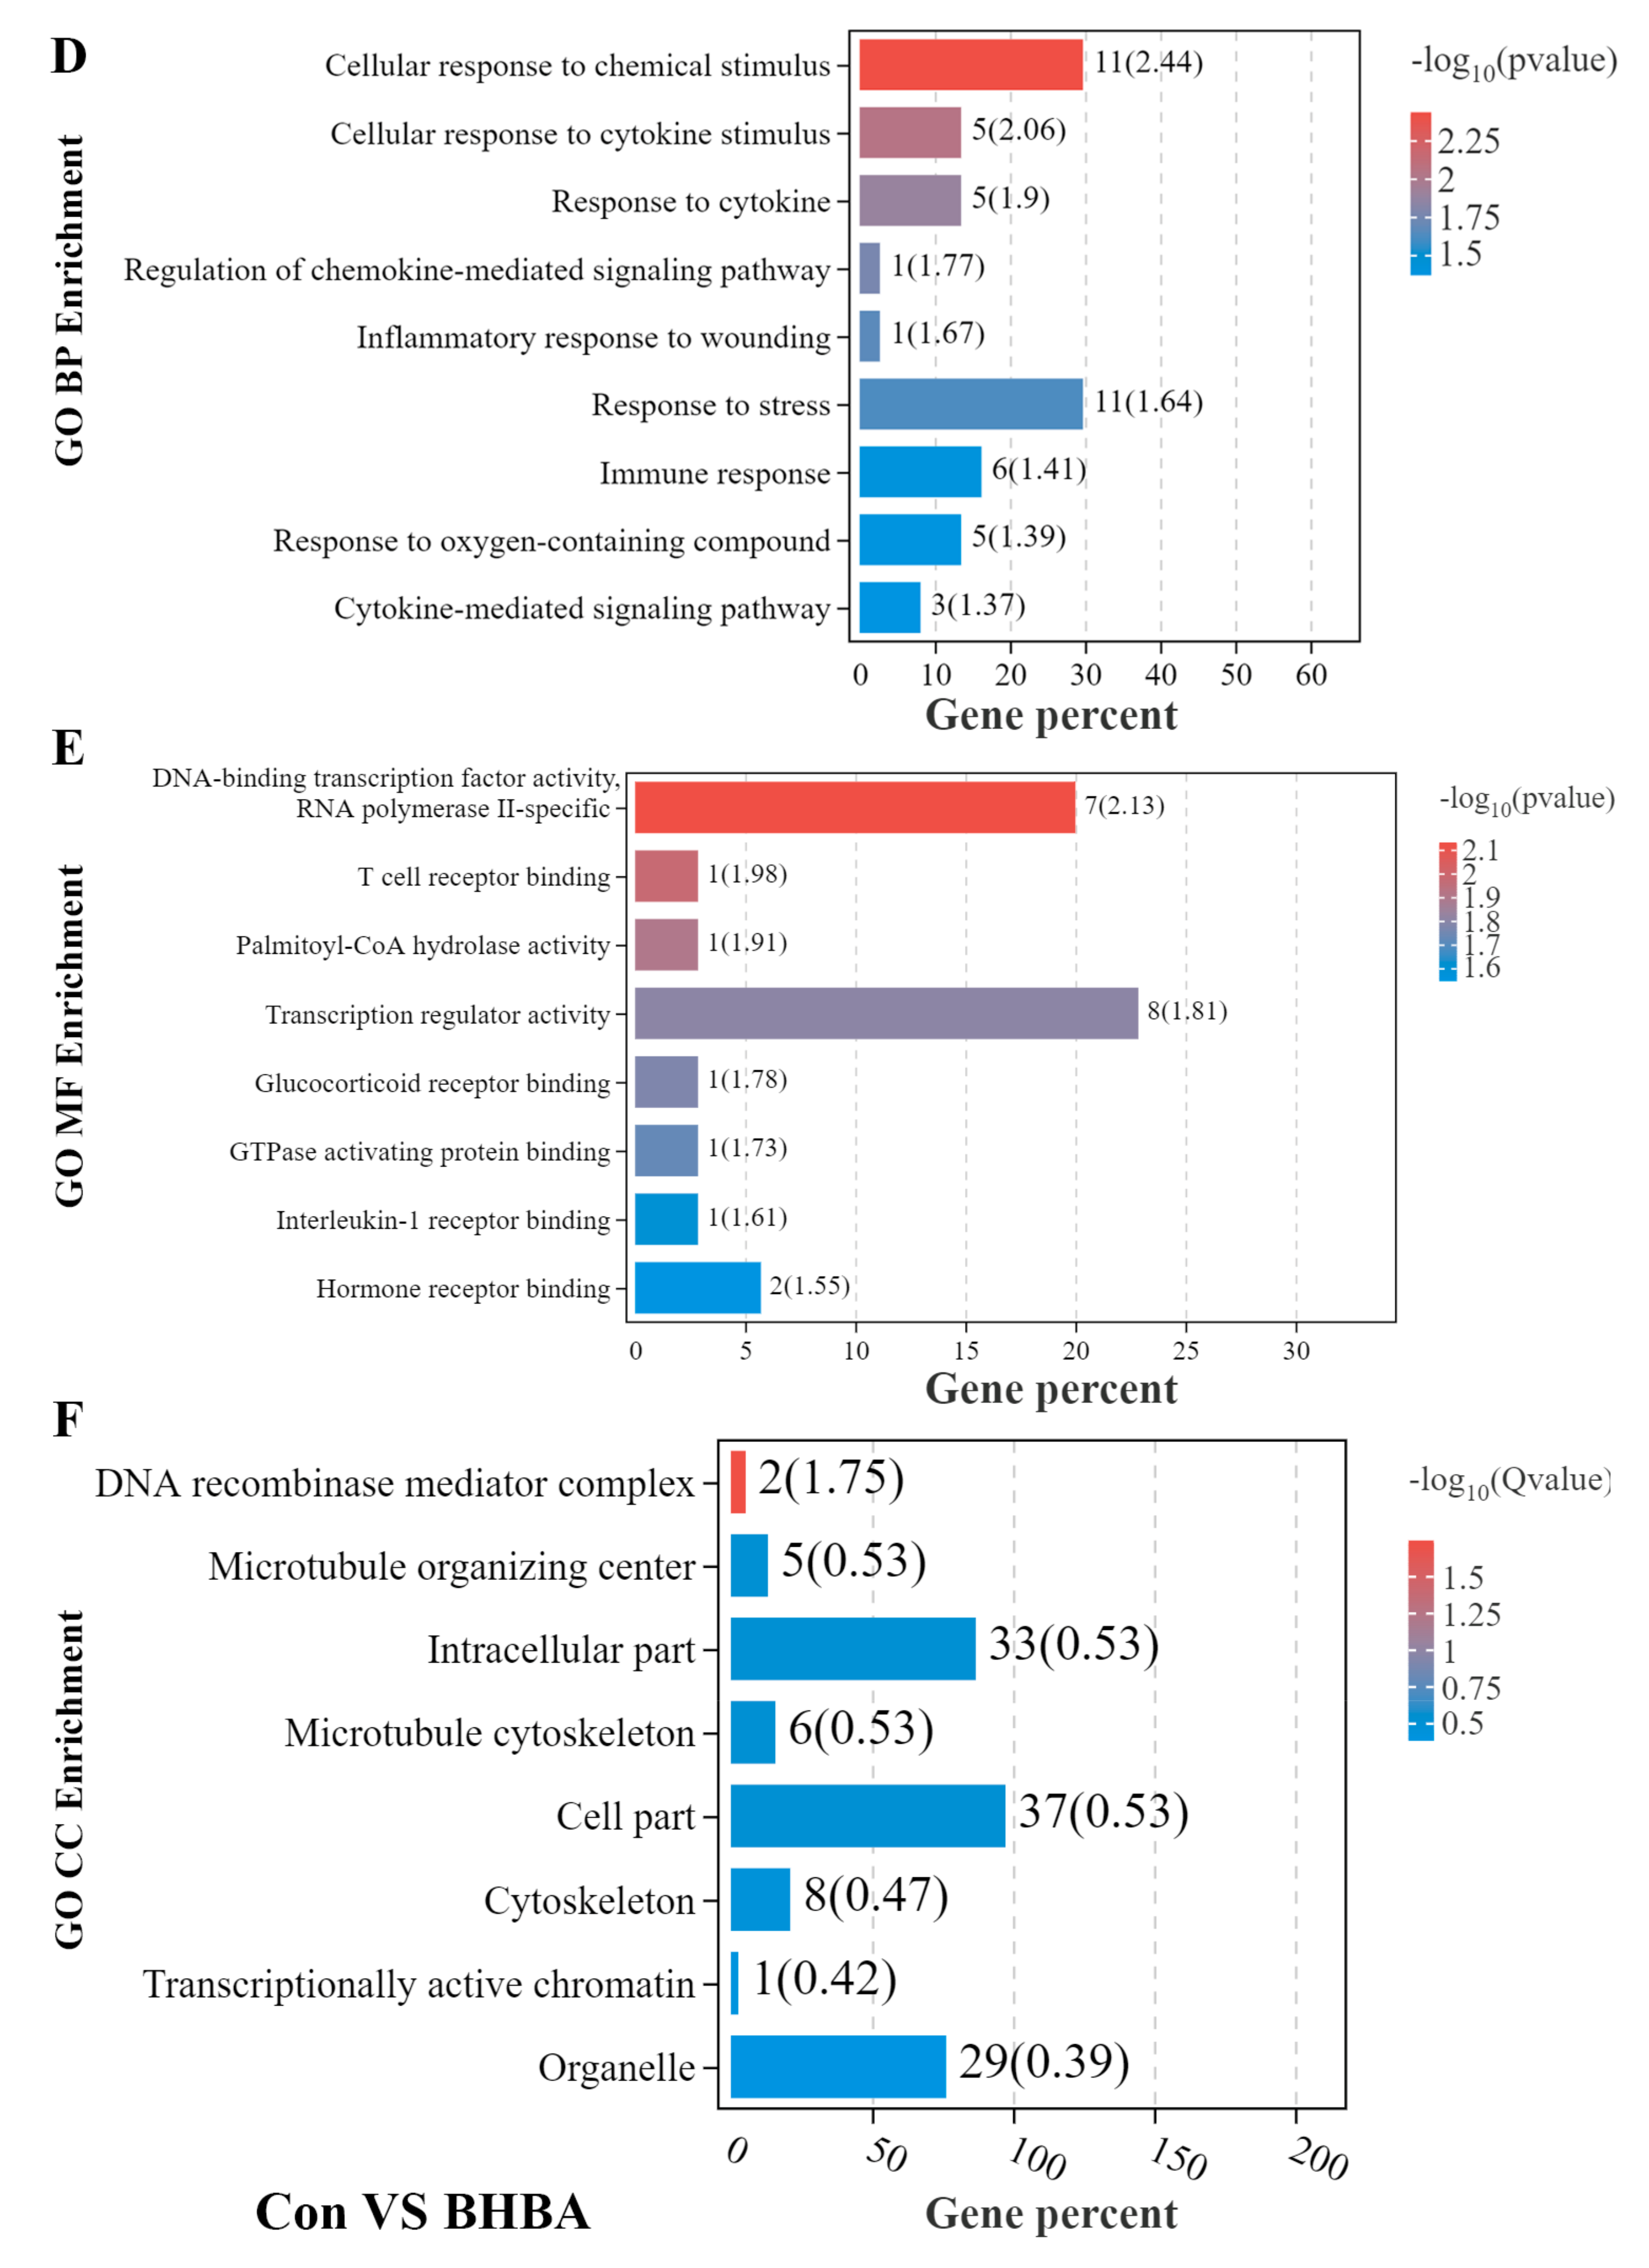
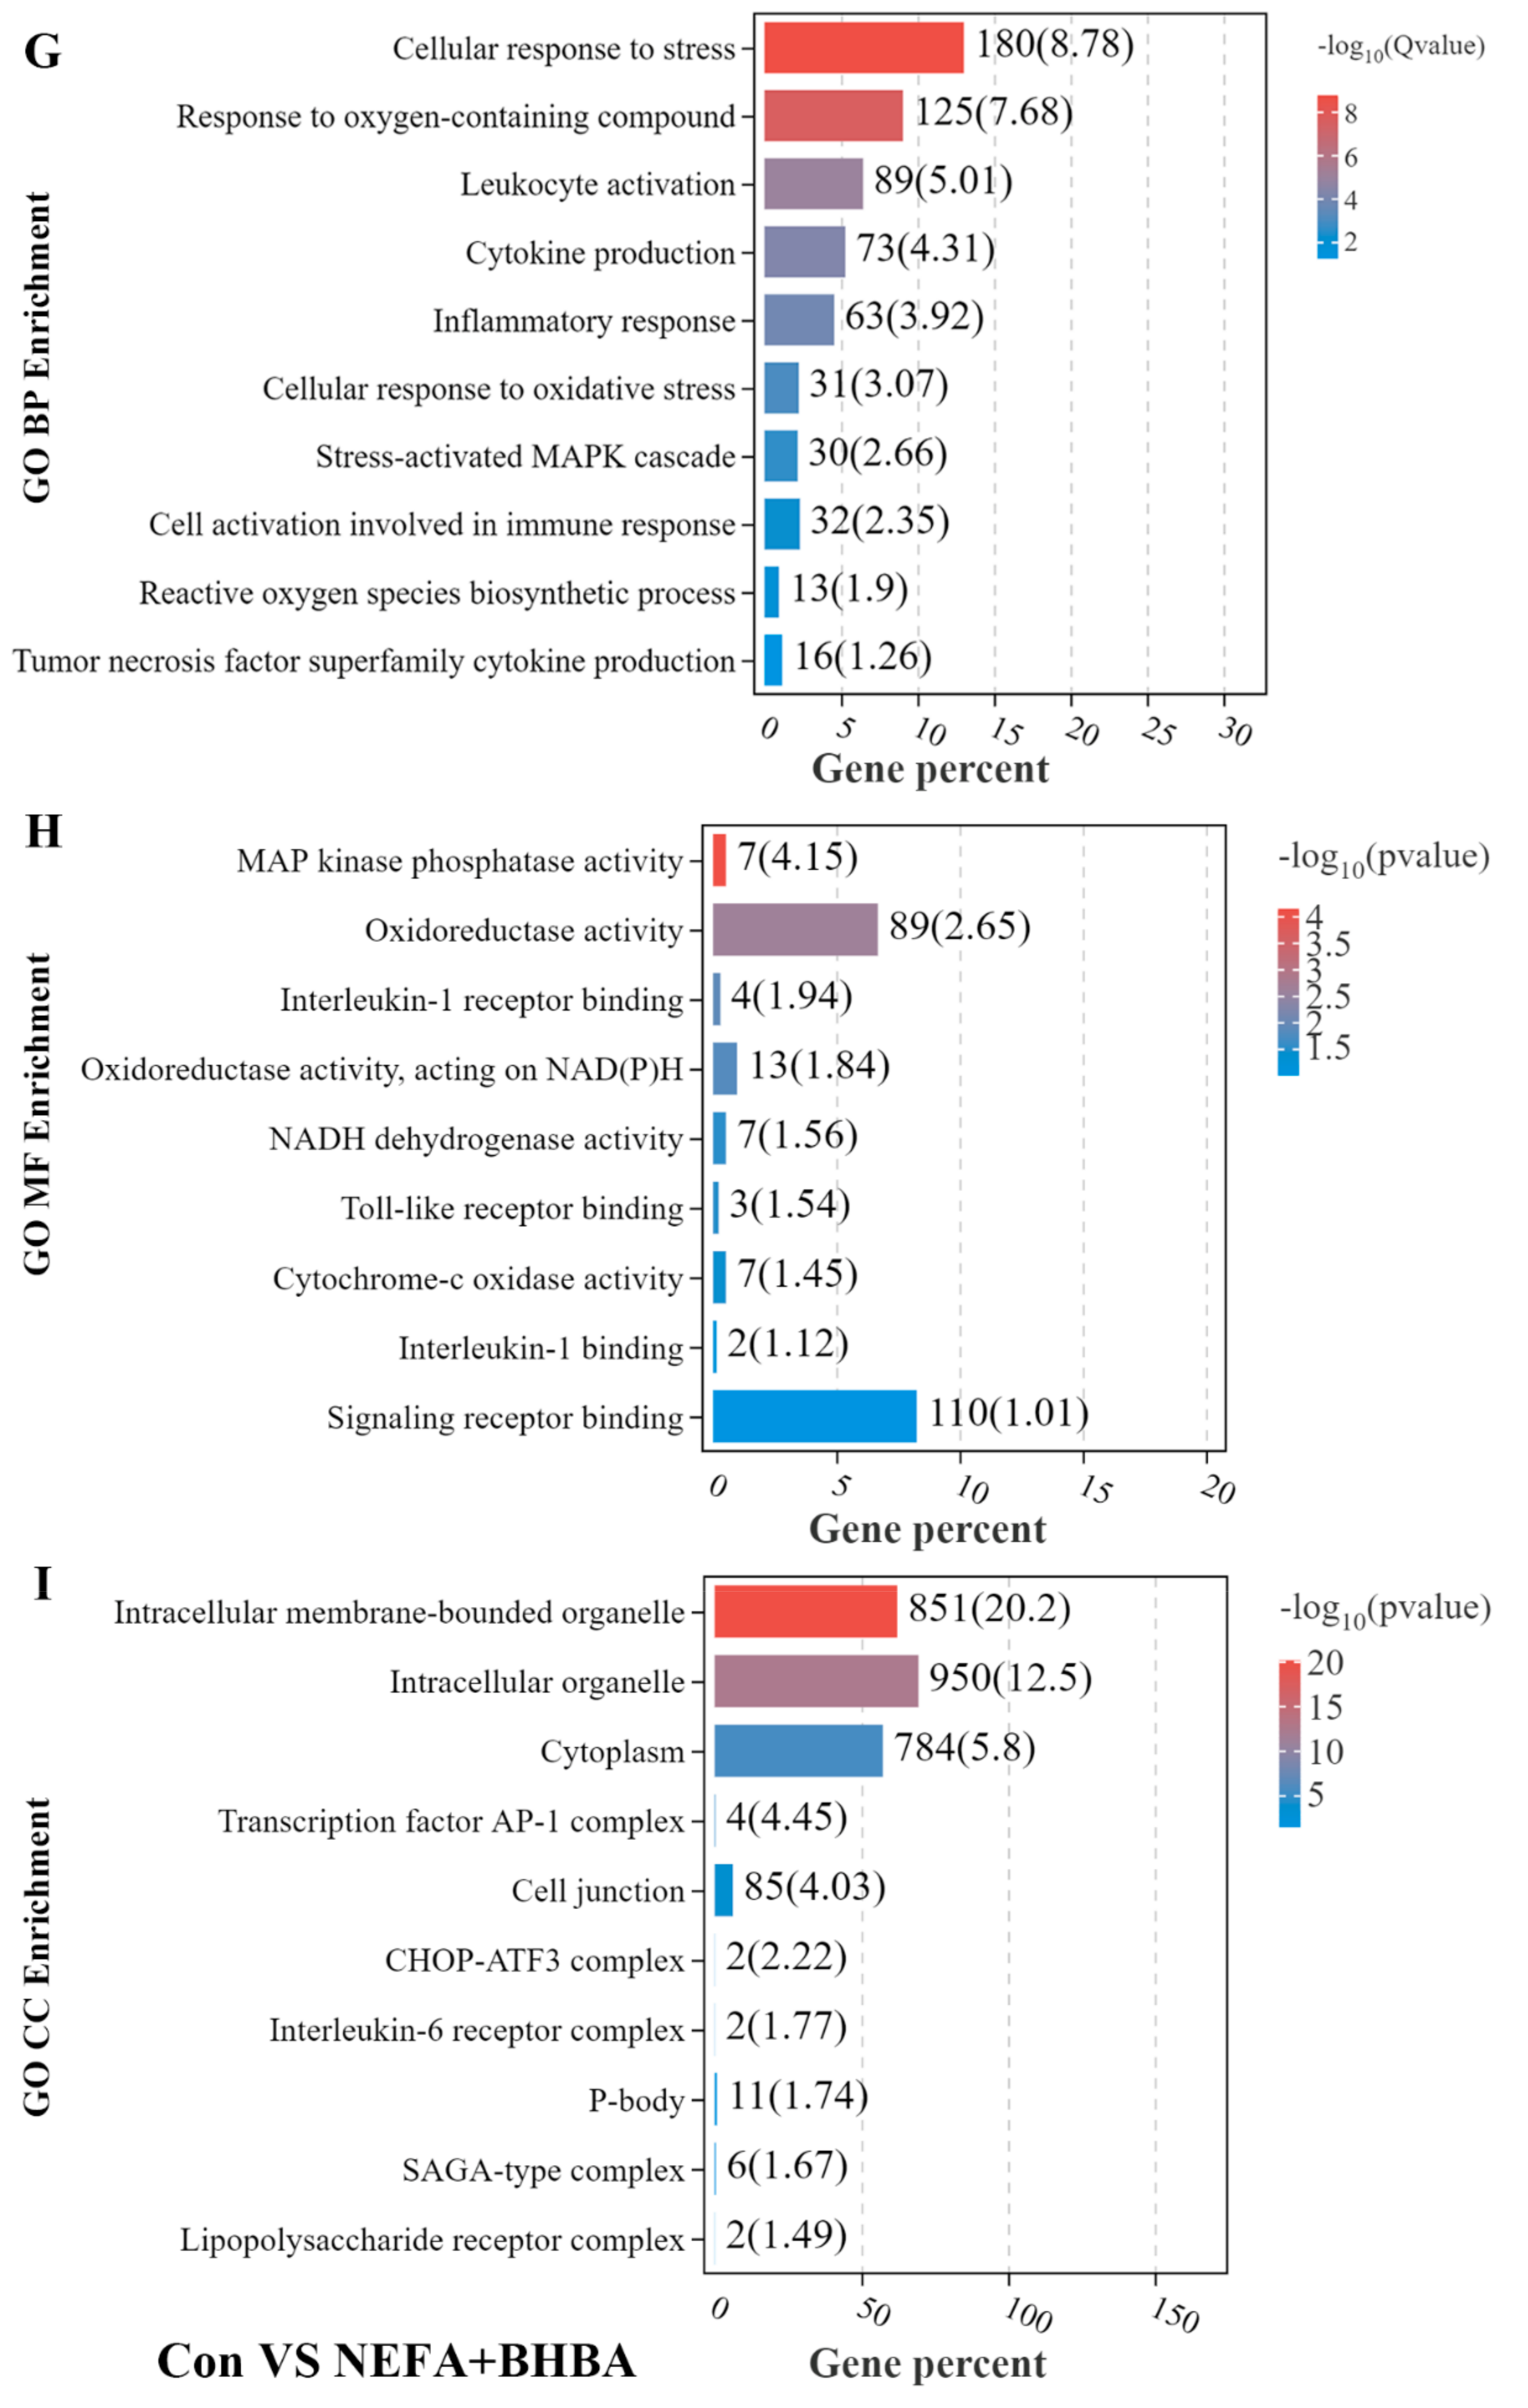
3.2. GO Enrichment Analysis of DEGs in BMECs under the Treatment with NEFA and BHBA Formatting of Mathematical Components
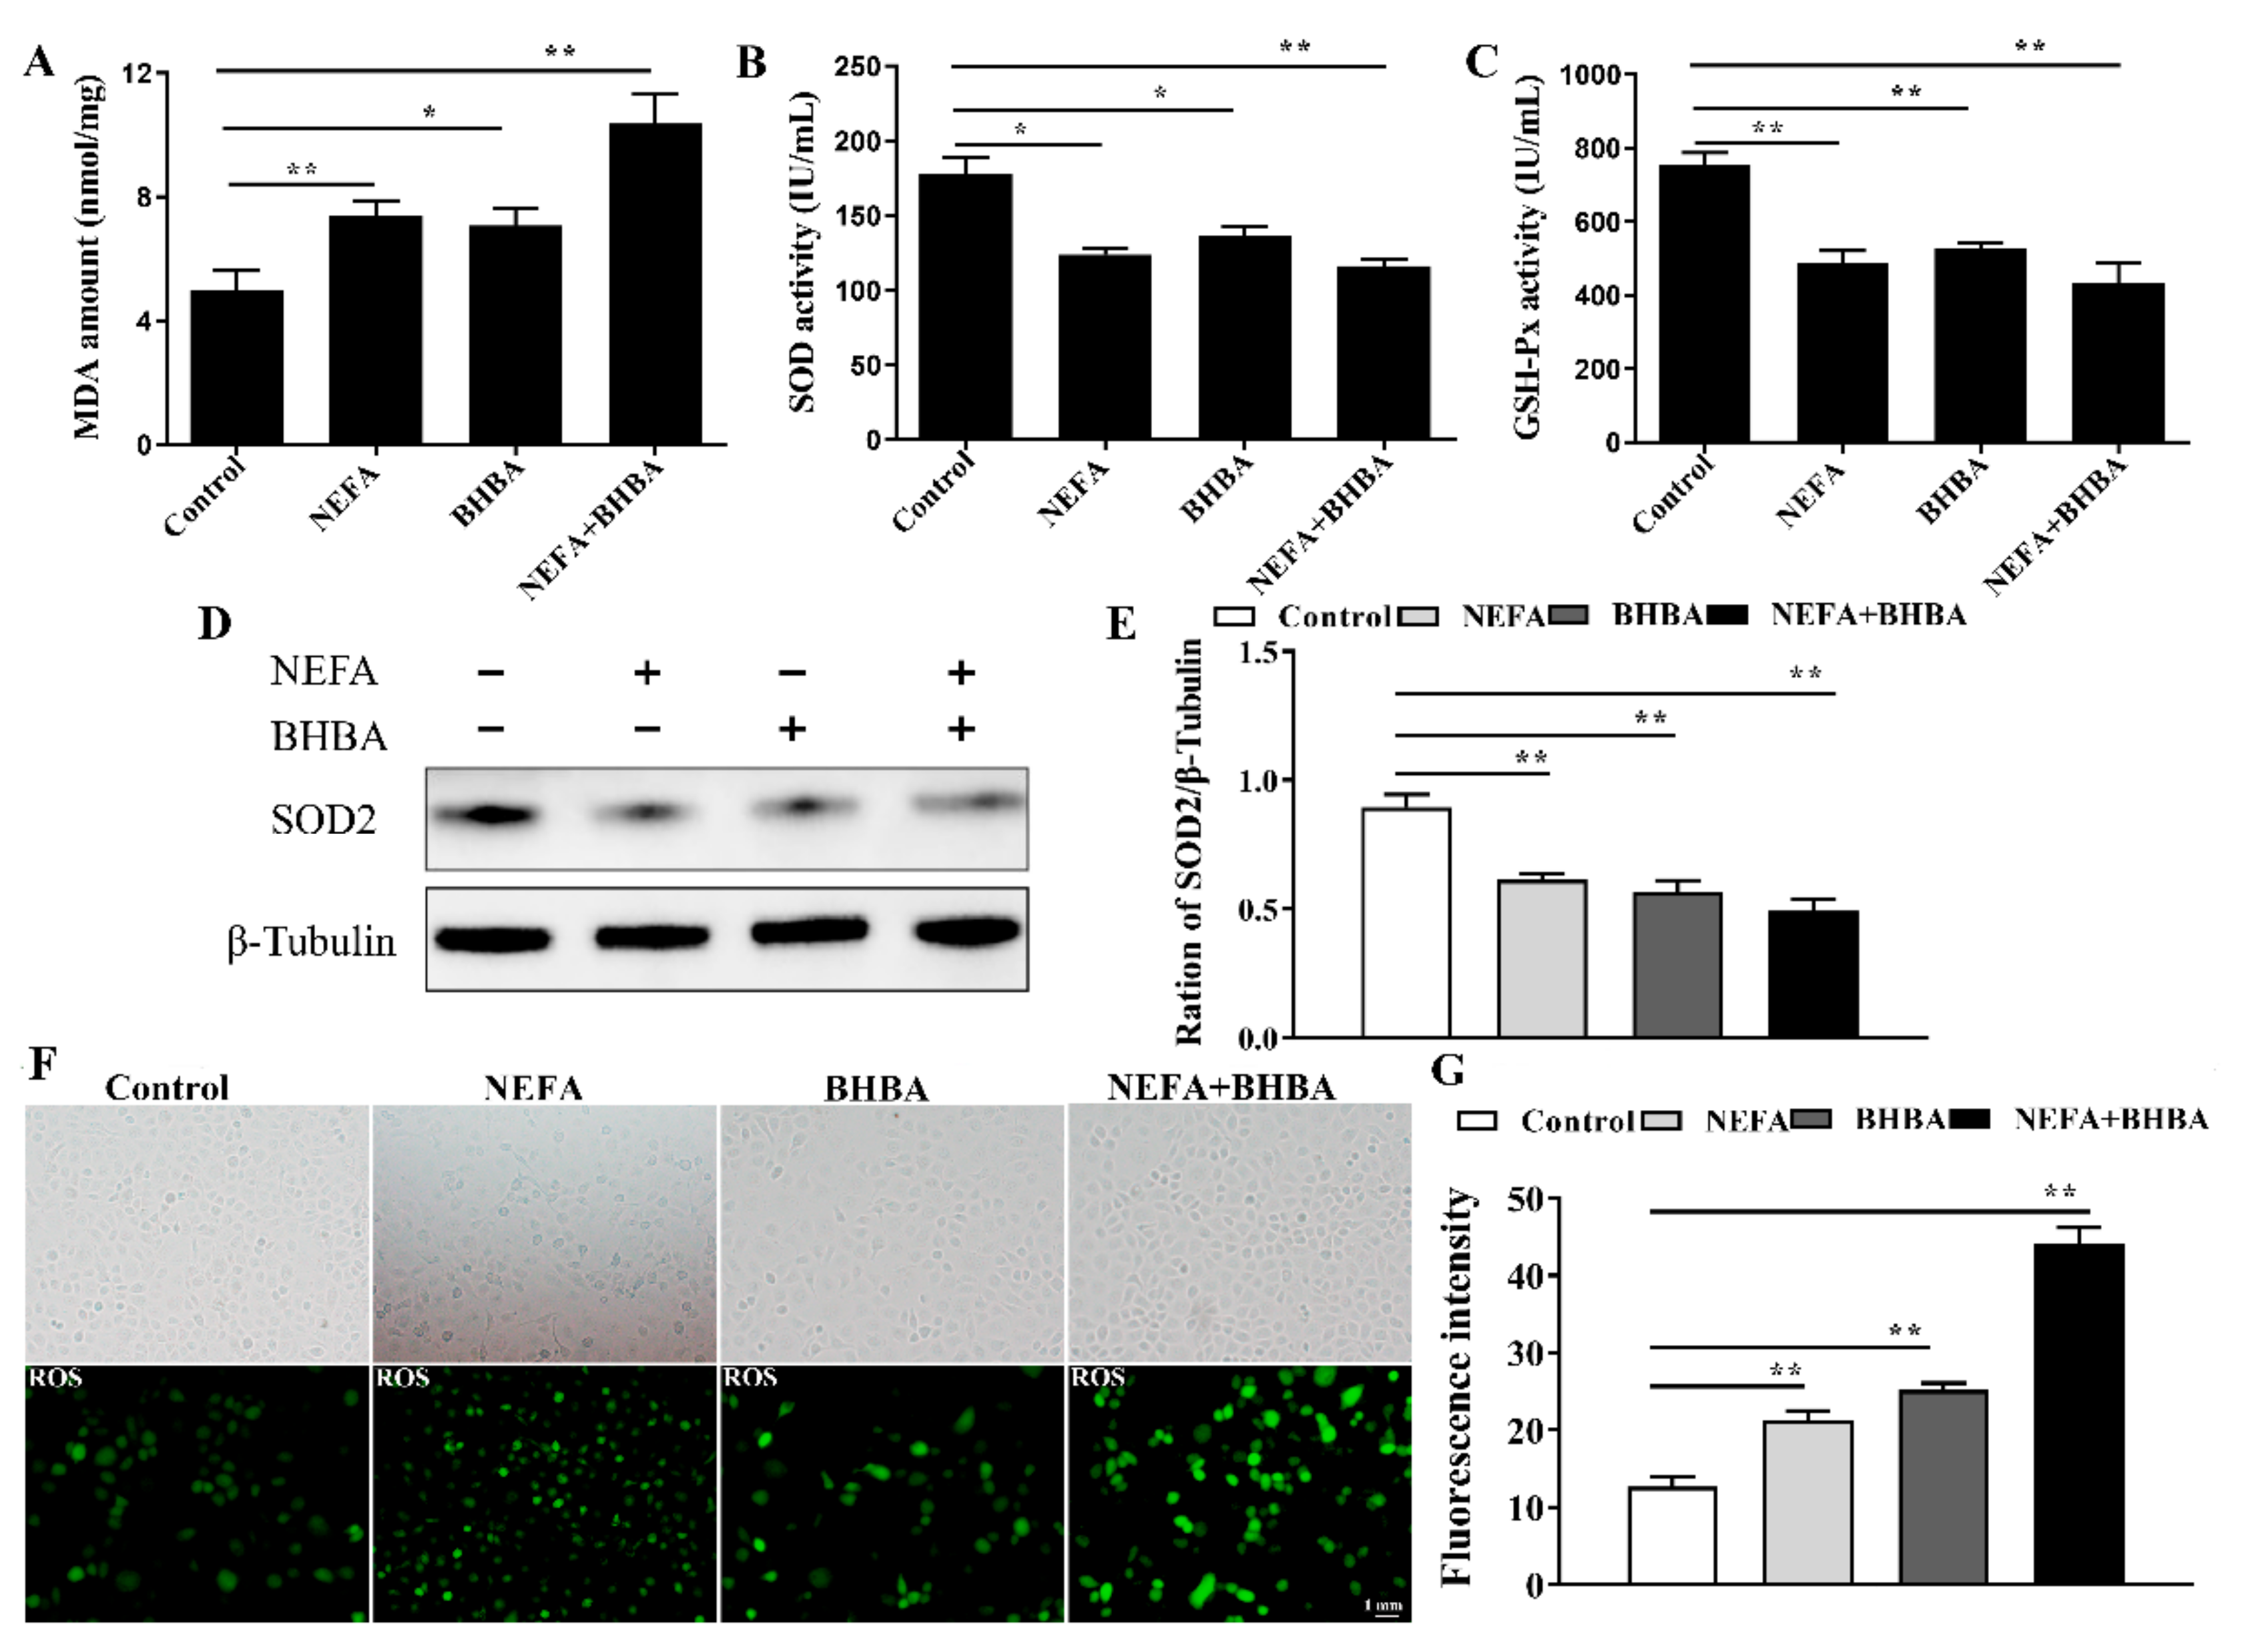
3.3. NEFA and BHBA Treatment Induced Oxidative Stress in BMECs
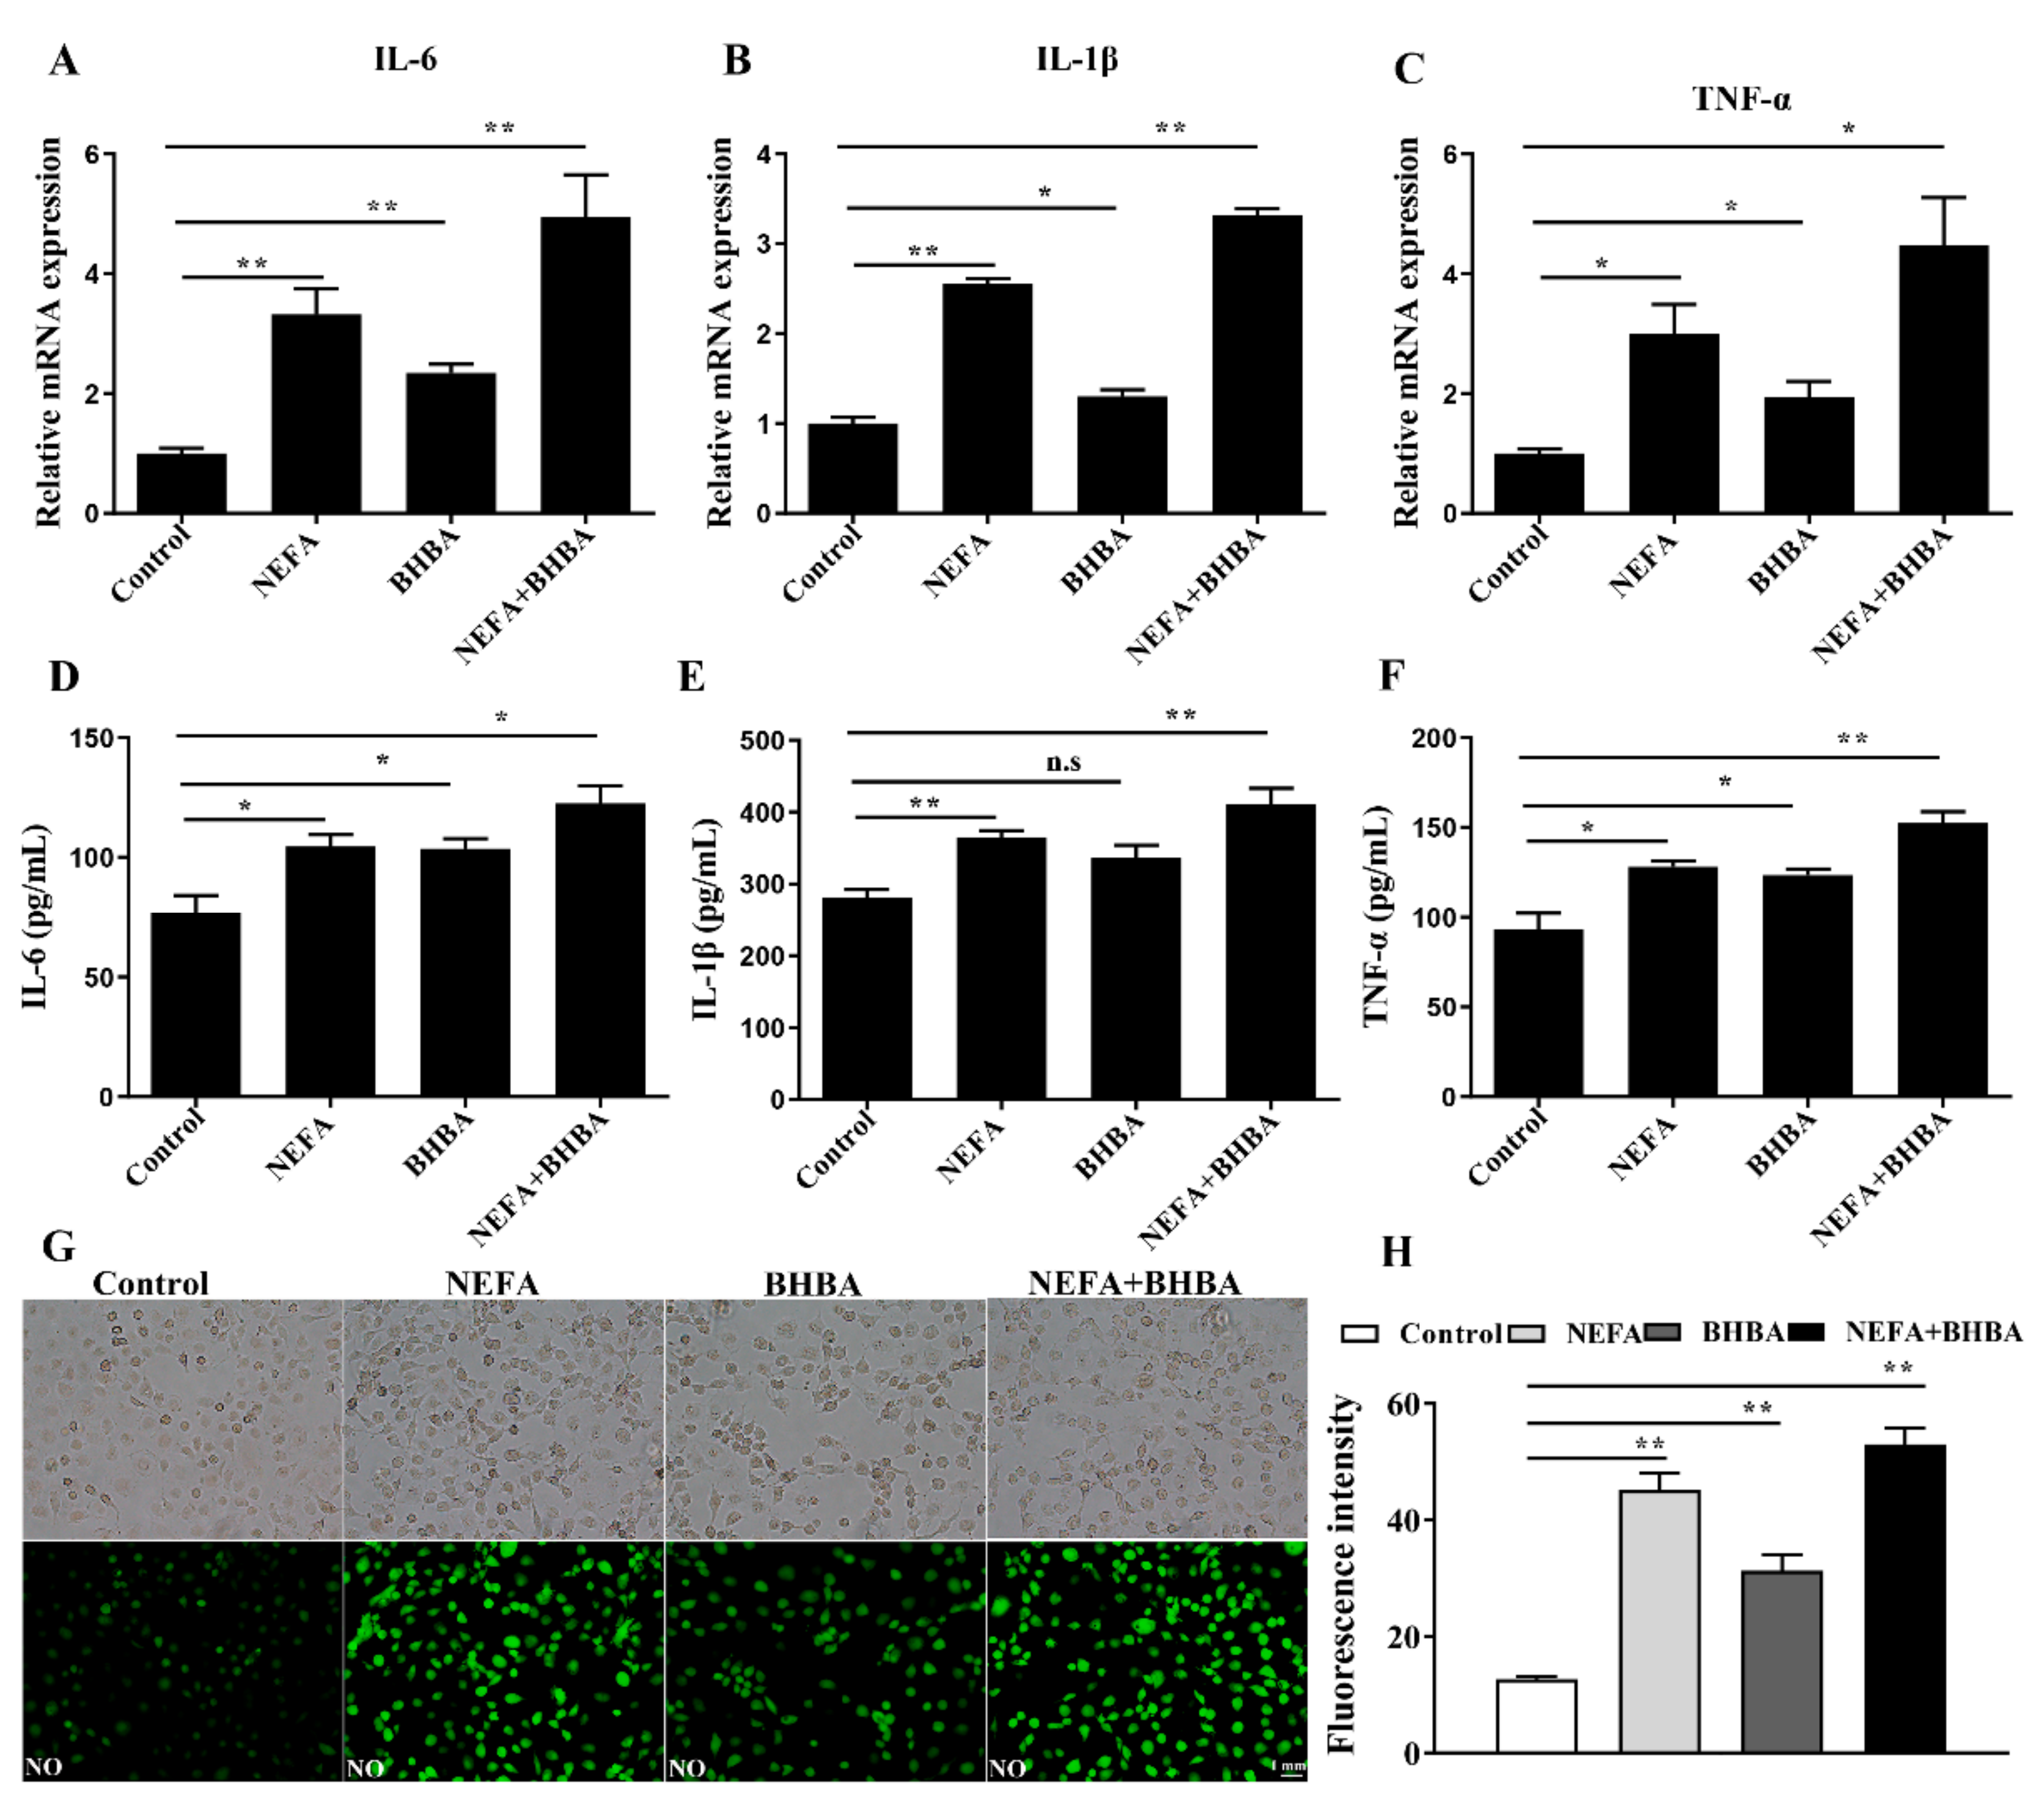
3.4. NEFA and BHBA Treatment Induced Inflammatory Response in BMECs
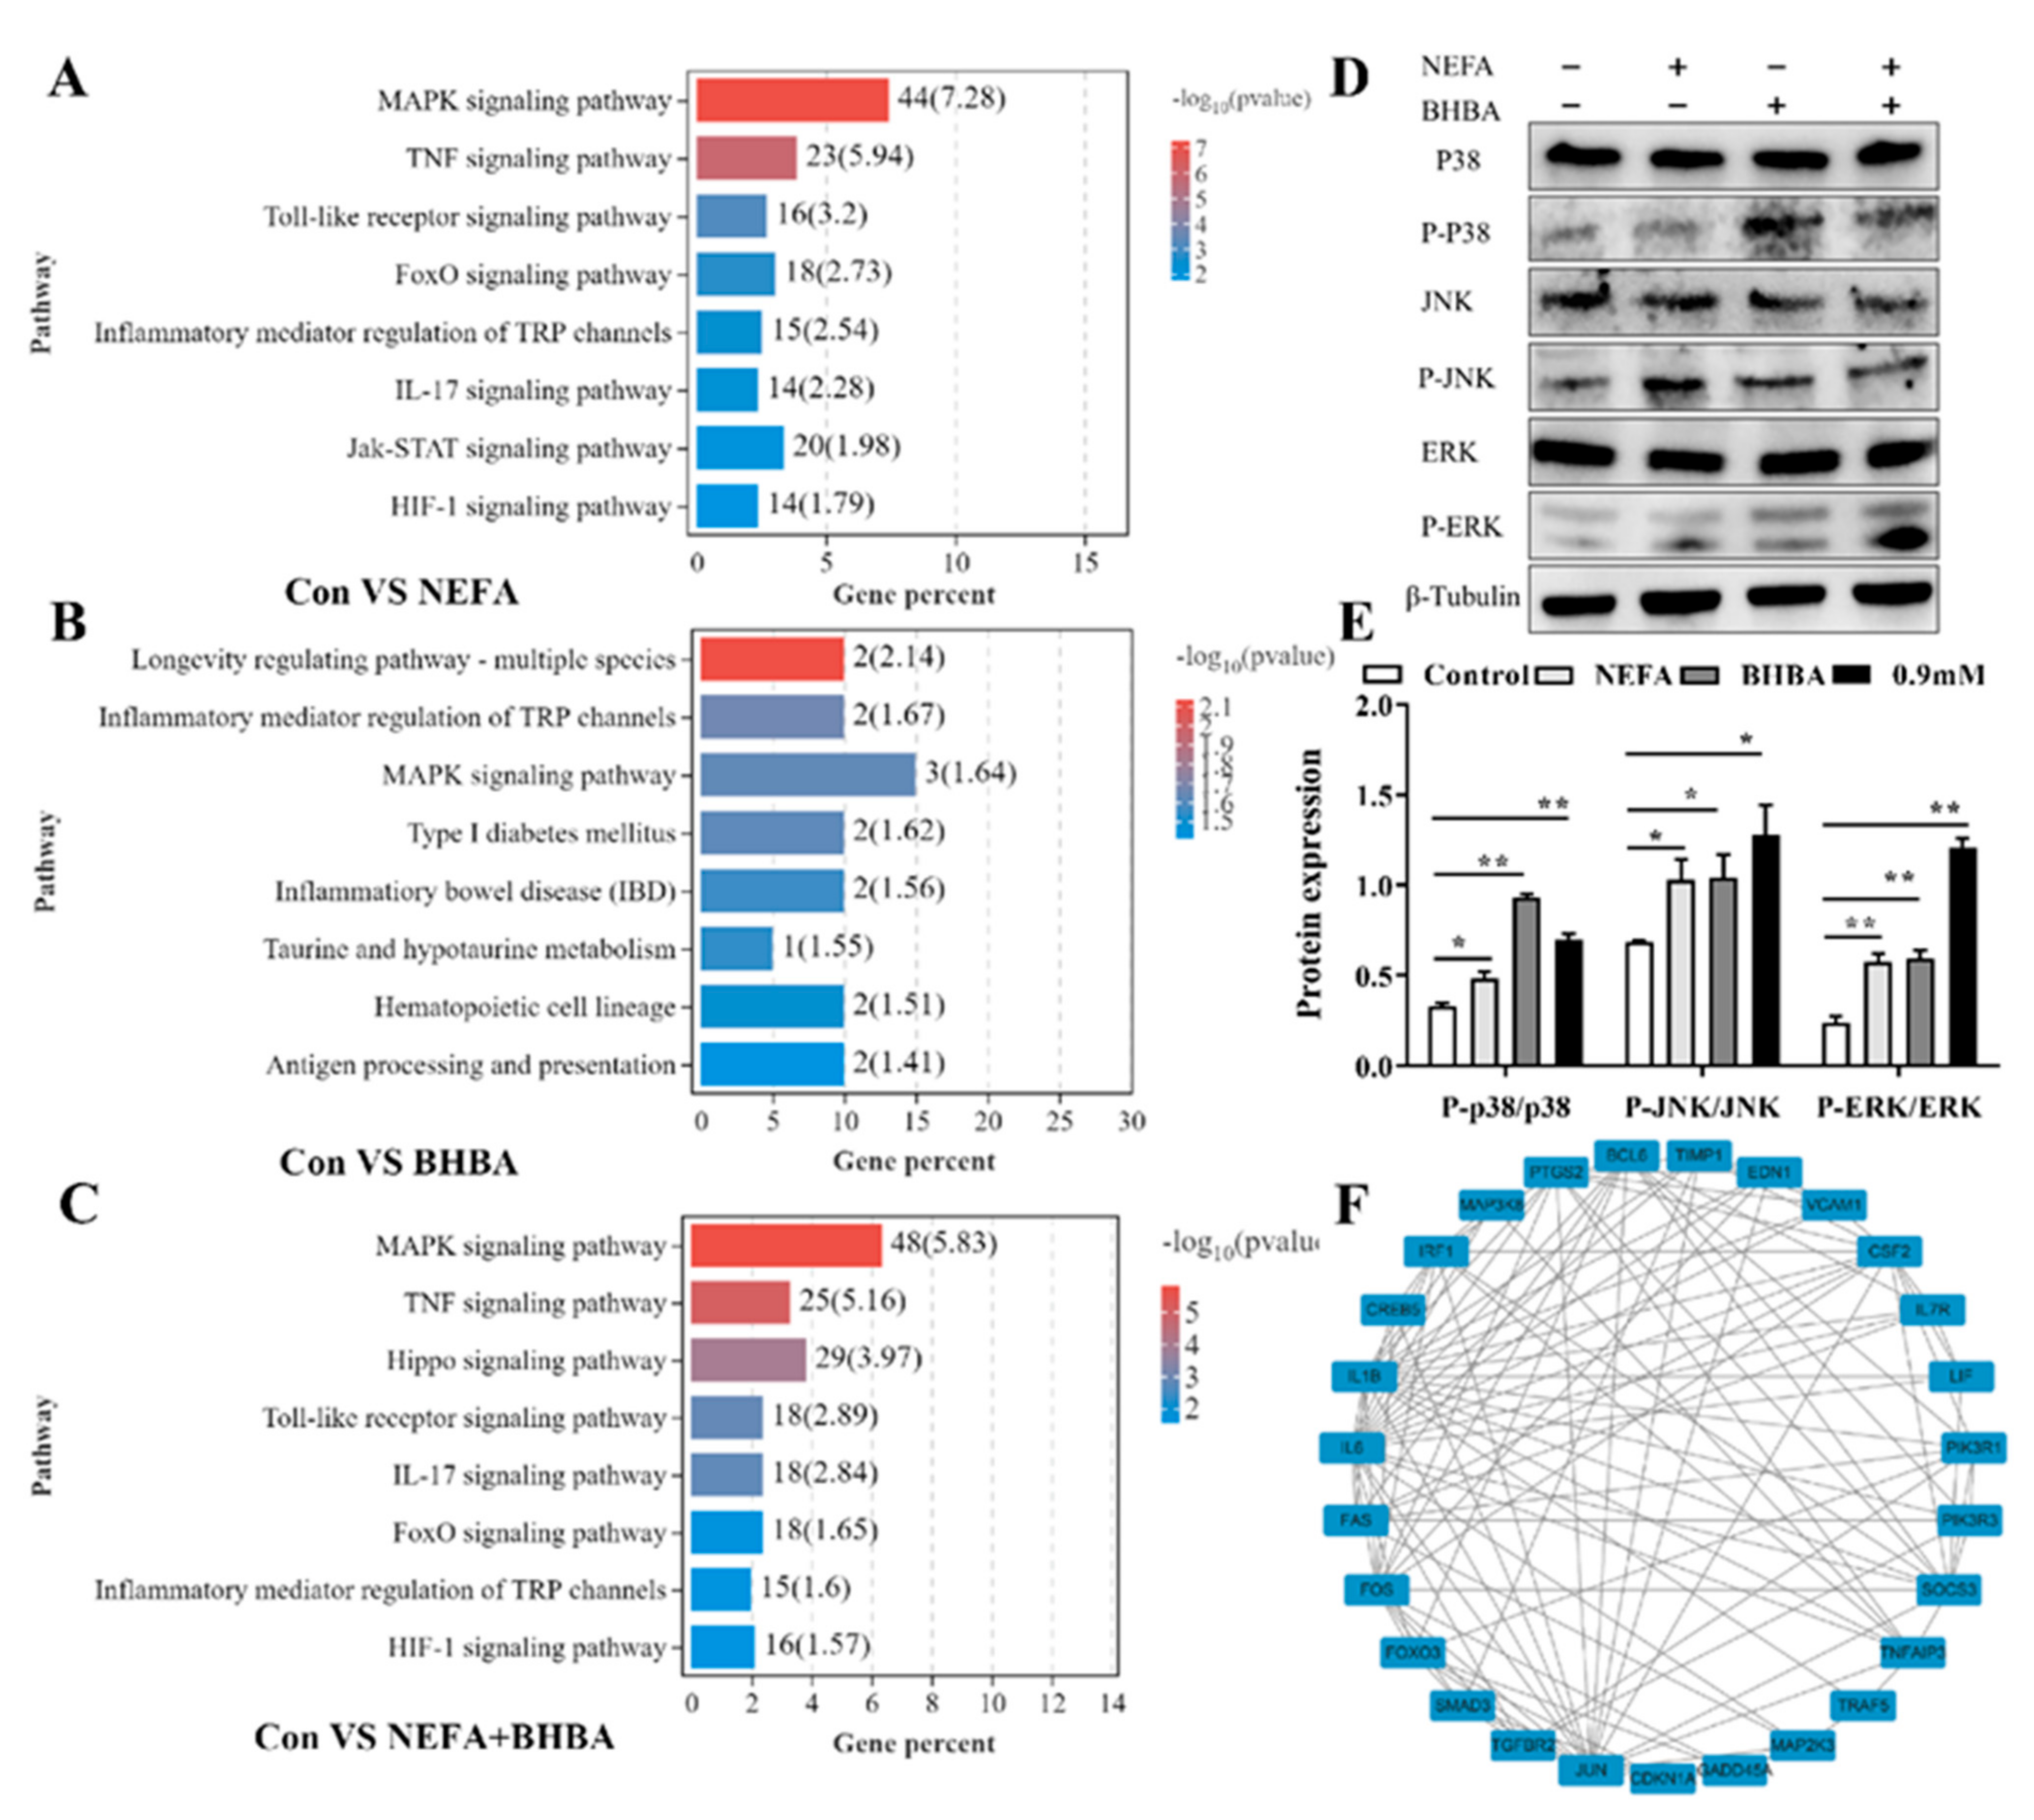
3.5. MAPK Signaling Pathway Was Involved in NEFA and BHBA-Induced Oxidative Stress and Inflammatory Response
4. Discussion
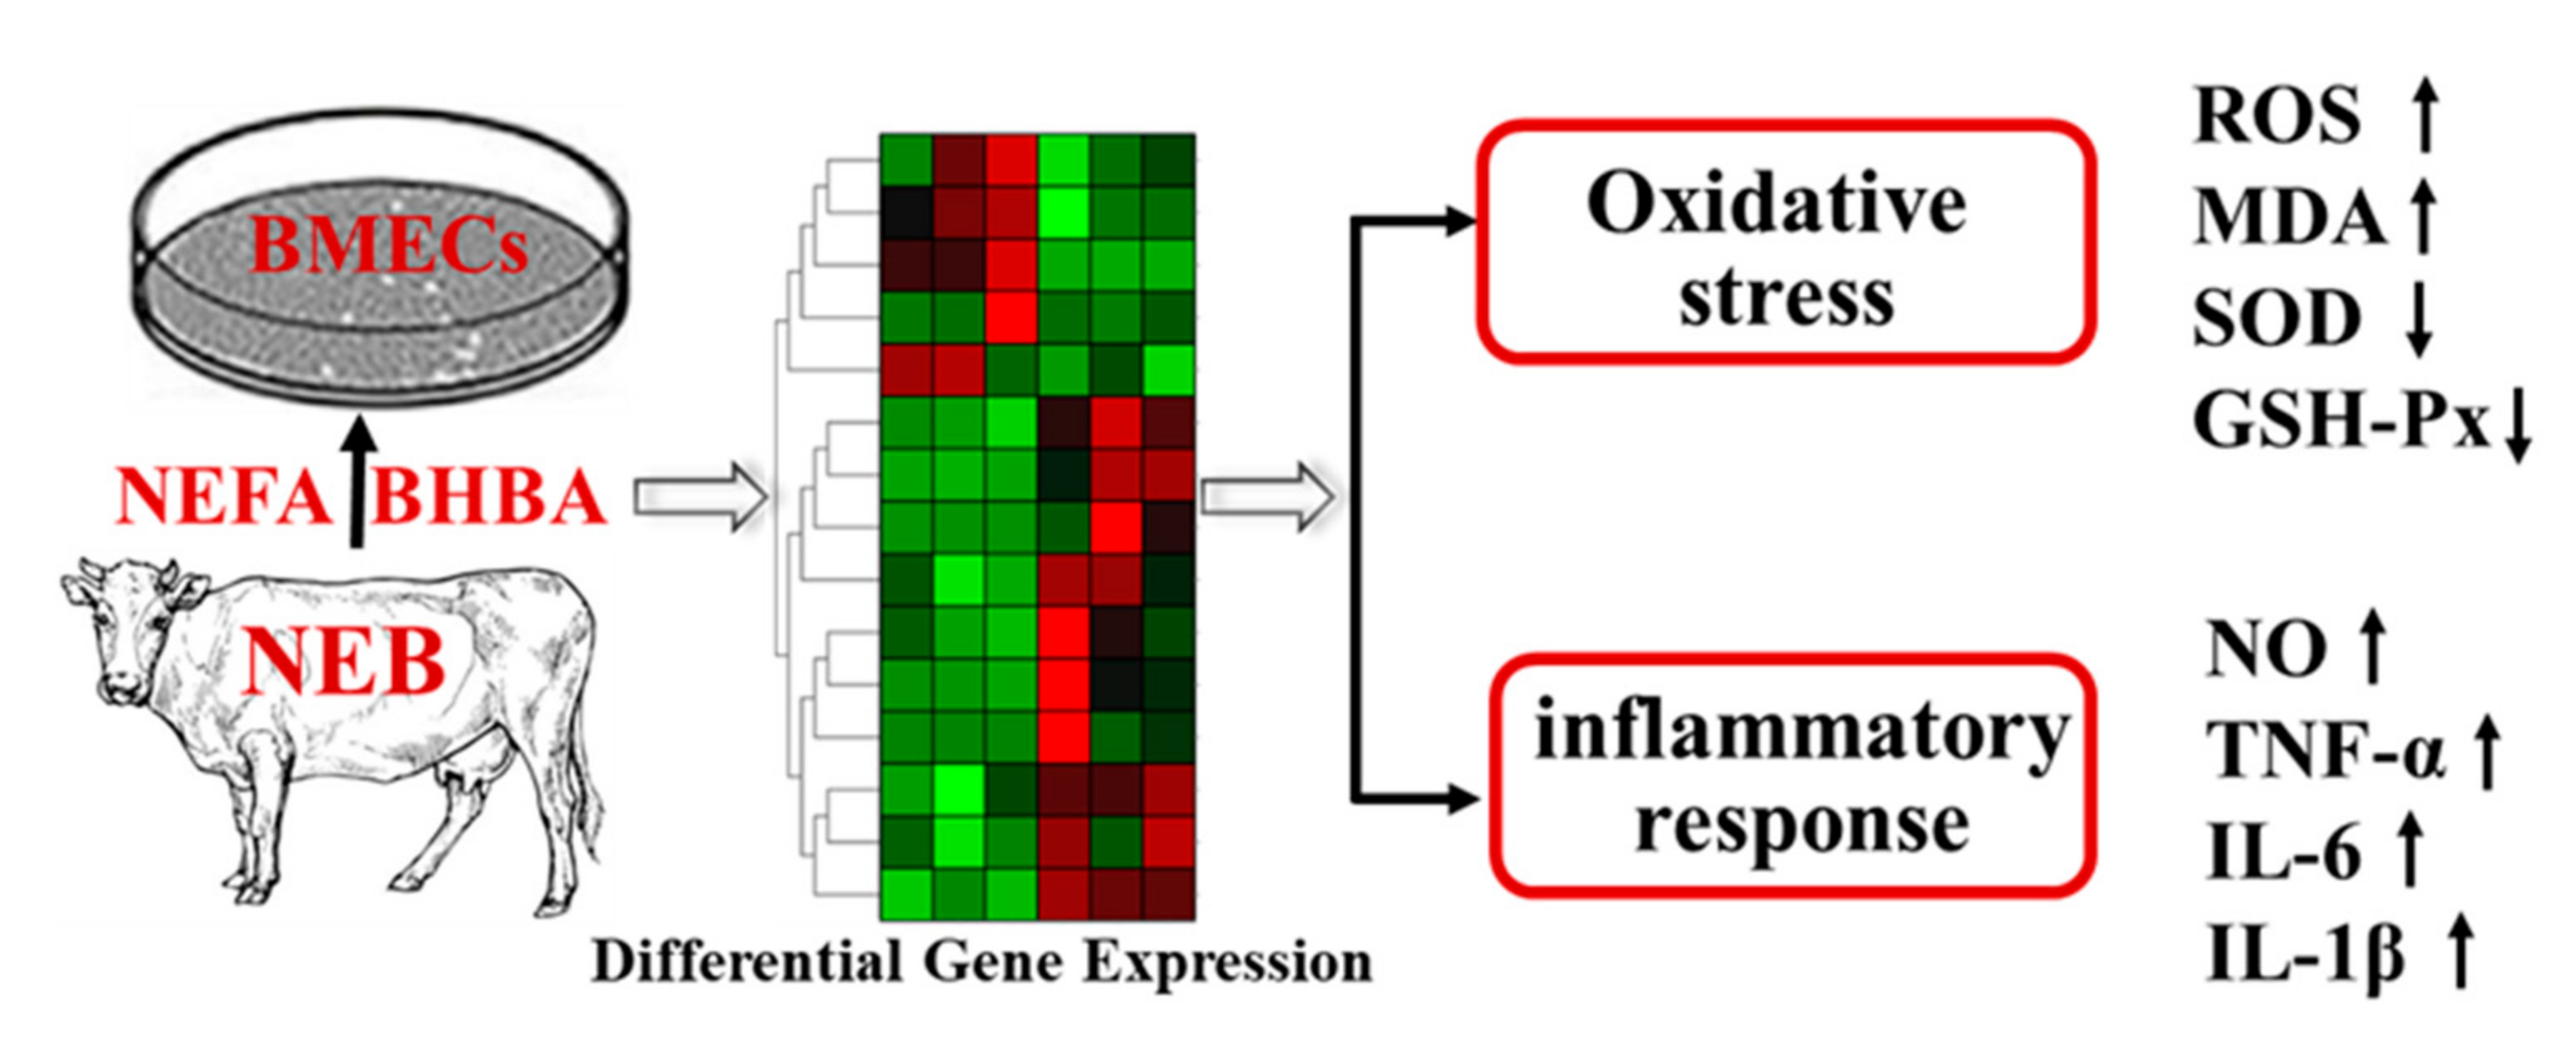
5. Conclusions
Supplementary Materials
Author Contributions
Funding
Institutional Review Board Statement
Informed Consent Statement
Data Availability Statement
Conflicts of Interest
References
- Kuhla, B. Review: Pro-inflammatory cytokines and hypothalamic inflammation: Implications for insufficient feed intake of transition dairy cows. Animal 2020, 14, s65–s77. [Google Scholar] [CrossRef] [PubMed] [Green Version]
- Goselink, R.M.A.; Schonewille, J.T.; van Duinkerken, G.; Hendriks, W.H. Physical exercise prepartum to support metabolic adaptation in the transition period of dairy cattle: A proof of concept. J. Anim. Physiol. Anim. Nutr. 2020, 104, 790–801. [Google Scholar] [CrossRef] [PubMed] [Green Version]
- Ospina, P.A.; Nydam, D.V.; Stokol, T.; Overton, T.R. Evaluation of nonesterified fatty acids and beta-hydroxybutyrate in transition dairy cattle in the northeastern United States: Critical thresholds for prediction of clinical diseases. J. Dairy Sci. 2010, 93, 546–554. [Google Scholar] [CrossRef] [PubMed] [Green Version]
- Pascottini, O.B.; Leroy, J.; Opsomer, G. Maladaptation to the transition period and consequences on fertility of dairy cows. Reprod. Domest. Anim. 2022, 57, 21–32. [Google Scholar] [CrossRef] [PubMed]
- Ospina, P.A.; McArt, J.A.; Overton, T.R.; Stokol, T.; Nydam, D.V. Using nonesterified fatty acids and β-hydroxybutyrate concentrations during the transition period for herd-level monitoring of increased risk of disease and decreased reproductive and milking performance. Vet. Clin. N. Am. Food Anim. Pract. 2013, 29, 387–412. [Google Scholar] [CrossRef]
- Chapinal, N.; Carson, M.E.; LeBlanc, S.J.; Leslie, K.E.; Godden, S.; Capel, M.; Santos, J.E.; Overton, M.W.; Duffield, T.F. The association of serum metabolites in the transition period with milk production and early-lactation reproductive performance. J. Dairy Sci. 2012, 95, 1301–1309. [Google Scholar] [CrossRef] [Green Version]
- McArt, J.A.; Nydam, D.V.; Oetzel, G.R.; Overton, T.R.; Ospina, P.A. Elevated non-esterified fatty acids and β-hydroxybutyrate and their association with transition dairy cow performance. Vet. J. 2013, 198, 560–570. [Google Scholar] [CrossRef]
- Benedet, A.; Costa, A.; De Marchi, M.; Penasa, M. Heritability estimates of predicted blood β-hydroxybutyrate and nonesterified fatty acids and relationships with milk traits in early-lactation Holstein cows. J. Dairy Sci. 2020, 103, 6354–6363. [Google Scholar] [CrossRef]
- Wang, Y.; Li, C.; Ali, I.; Li, L.; Wang, G. N-acetylcysteine modulates non-esterified fatty acid-induced pyroptosis and inflammation in granulosa cells. Mol. Immunol. 2020, 127, 157–163. [Google Scholar] [CrossRef]
- Wang, Y.; Li, C.; Li, J.; Wang, G.; Li, L. Non-Esterified Fatty Acid-Induced Reactive Oxygen Species Mediated Granulosa Cells Apoptosis Is Regulated by Nrf2/p53 Signaling Pathway. Antioxidants 2020, 9, 523. [Google Scholar] [CrossRef]
- Song, Y.; Li, X.; Li, Y.; Li, N.; Shi, X.; Ding, H.; Zhang, Y.; Li, X.; Liu, G.; Wang, Z. Non-esterified fatty acids activate the ROS-p38-p53/Nrf2 signaling pathway to induce bovine hepatocyte apoptosis in vitro. Apoptosis 2014, 19, 984–997. [Google Scholar] [CrossRef] [PubMed]
- Shi, X.; Li, D.; Deng, Q.; Li, Y.; Sun, G.; Yuan, X.; Song, Y.; Wang, Z.; Li, X.; Li, X.; et al. NEFAs activate the oxidative stress-mediated NF-κB signaling pathway to induce inflammatory response in calf hepatocytes. J. Steroid Biochem. Mol. Biol. 2015, 145, 103–112. [Google Scholar] [CrossRef] [PubMed]
- Jordaens, L.; Arias-Alvarez, M.; Pintelon, I.; Thys, S.; Valckx, S.; Dezhkam, Y.; Bols, P.E.; Leroy, J.L. Elevated non-esterified fatty acid concentrations hamper bovine oviductal epithelial cell physiology in three different in vitro culture systems. Theriogenology 2015, 84, 899–910. [Google Scholar] [CrossRef] [PubMed]
- Aardema, H.; van Tol, H.T.A.; Vos, P. An overview on how cumulus cells interact with the oocyte in a condition with elevated NEFA levels in dairy cows. Anim. Reprod. Sci. 2019, 207, 131–137. [Google Scholar] [CrossRef] [PubMed]
- Liu, L.; Lu, H.; Loor, J.J.; Aboragah, A.; Du, X.; He, J.; Peng, T.; Su, J.; Wang, Z.; Liu, G.; et al. Sirtuin 3 inhibits nuclear factor-κB signaling activated by a fatty acid challenge in bovine mammary epithelial cells. J. Dairy Sci. 2021, 104, 12871–12880. [Google Scholar] [CrossRef]
- Yan, Y.; Huang, J.; Huan, C.; Li, L.; Li, C. Non-Esterified Fatty Acid Induces ER Stress-Mediated Apoptosis via ROS/MAPK Signaling Pathway in Bovine Mammary Epithelial Cells. Metabolites 2022, 12, 803. [Google Scholar] [CrossRef]
- Chen, Y.; Tang, Y.; Luo, S.; Jia, H.; Xu, Q.; Chang, R.; Dong, Z.; Gao, S.; Song, Q.; Dong, H.; et al. Nuclear factor erythroid 2-related factor 2 protects bovine mammary epithelial cells against free fatty acid-induced mitochondrial dysfunction in vitro. J. Dairy Sci. 2021, 104, 12830–12844. [Google Scholar] [CrossRef]
- Lei, L.; Gao, W.; Loor, J.J.; Aboragah, A.; Fang, Z.; Du, X.; Zhang, M.; Song, Y.; Liu, G.; Li, X. Reducing hepatic endoplasmic reticulum stress ameliorates the impairment in insulin signaling induced by high levels of β-hydroxybutyrate in bovine hepatocytes. J. Dairy Sci. 2021, 104, 12845–12858. [Google Scholar] [CrossRef]
- Cheng, X.; Yang, S.; Xu, C.; Li, L.; Zhang, Y.; Guo, Y.; Zhang, C.; Li, P.; Long, M.; He, J. Proanthocyanidins Protect against β-Hydroxybutyrate-Induced Oxidative Damage in Bovine Endometrial Cells. Molecules 2019, 24, 400. [Google Scholar] [CrossRef] [Green Version]
- Gong, J.; Zhao, S.; Heng, N.; Wang, Y.; Hu, Z.; Wang, H.; Zhu, H. The Dynamic Transcription Profiles of Proliferating Bovine Ovarian Granulosa When Exposed to Increased Levels of β-Hydroxybutyric Acid. Front. Vet. Sci. 2022, 9, 915956. [Google Scholar] [CrossRef]
- Hillreiner, M.; Flinspach, C.; Pfaffl, M.W.; Kliem, H. Effect of the Ketone Body Beta-Hydroxybutyrate on the Innate Defense Capability of Primary Bovine Mammary Epithelial Cells. PLoS ONE 2016, 11, e0157774. [Google Scholar] [CrossRef] [PubMed] [Green Version]
- Song, Y.; Loor, J.J.; Li, C.; Liang, Y.; Li, N.; Shu, X.; Yang, Y.; Feng, X.; Du, X.; Wang, Z.; et al. Enhanced mitochondrial dysfunction and oxidative stress in the mammary gland of cows with clinical ketosis. J. Dairy Sci. 2021, 104, 6909–6918. [Google Scholar] [CrossRef] [PubMed]
- Kuroiwa, T.; Matsuda, K.; Kanazawa, T.; Chee, H.; Kimura, A.; Satoh, H.; Sato, S.; Ichijo, T. Effect of Oxidative Status on the Occurrence of Haemolactia in Dairy Cows after Calving. J. Vet. Res. 2022, 66, 251–255. [Google Scholar] [CrossRef] [PubMed]
- Schieber, M.; Chandel, N.S. ROS function in redox signaling and oxidative stress. Curr. Biol. 2014, 24, R453–R462. [Google Scholar] [CrossRef] [Green Version]
- Sun, X.; Jia, H.; Xu, Q.; Zhao, C.; Xu, C. Lycopene alleviates H2O2-induced oxidative stress, inflammation and apoptosis in bovine mammary epithelial cells via the NFE2L2 signaling pathway. Food Funct. 2019, 10, 6276–6285. [Google Scholar] [CrossRef]
- Chang, R.; Sun, X.; Jia, H.; Xu, Q.; Dong, Z.; Tang, Y.; Luo, S.; Jiang, Q.; Loor, J.J.; Xu, C. Inhibiting nuclear factor erythroid 2 related factor 2-mediated autophagy in bovine mammary epithelial cells induces oxidative stress in response to exogenous fatty acids. J. Anim. Sci. Biotechnol. 2022, 13, 48. [Google Scholar] [CrossRef]
- Li, P.; Li, L.; Zhang, C.; Cheng, X.; Zhang, Y.; Guo, Y.; Long, M.; Yang, S.; He, J. Palmitic Acid and β-Hydroxybutyrate Induce Inflammatory Responses in Bovine Endometrial Cells by Activating Oxidative Stress-Mediated NF-κB Signaling. Molecules 2019, 24, 2421. [Google Scholar] [CrossRef] [Green Version]
- Bernabucci, U.; Ronchi, B.; Lacetera, N.; Nardone, A. Influence of body condition score on relationships between metabolic status and oxidative stress in periparturient dairy cows. J. Dairy Sci. 2005, 88, 2017–2026. [Google Scholar] [CrossRef] [Green Version]
- Bradford, B.J.; Yuan, K.; Farney, J.K.; Mamedova, L.K.; Carpenter, A.J. Invited review: Inflammation during the transition to lactation: New adventures with an old flame. J. Dairy Sci. 2015, 98, 6631–6650. [Google Scholar] [CrossRef] [Green Version]
- Castillo, C.; Hernandez, J.; Bravo, A.; Lopez-Alonso, M.; Pereira, V.; Benedito, J.L. Oxidative status during late pregnancy and early lactation in dairy cows. Vet. J. 2005, 169, 286–292. [Google Scholar] [CrossRef]
- Contreras, G.A.; Sordillo, L.M. Lipid mobilization and inflammatory responses during the transition period of dairy cows. Comp. Immunol. Microbiol. Infect. Dis. 2011, 34, 281–289. [Google Scholar] [CrossRef] [PubMed]
- Chankeaw, W.; Guo, Y.Z.; Båge, R.; Svensson, A.; Andersson, G.; Humblot, P. Elevated non-esterified fatty acids impair survival and promote lipid accumulation and pro-inflammatory cytokine production in bovine endometrial epithelial cells. Reprod. Fertil. Dev. 2018, 30, 1770–1784. [Google Scholar] [CrossRef]
- Xu, T.; Lu, X.; Arbab, A.A.I.; Wu, X.; Mao, Y.; Loor, J.J.; Yang, Z. Metformin acts to suppress β-hydroxybutyric acid-mediated inflammatory responses through activation of AMPK signaling in bovine hepatocytes. J. Anim. Sci. 2021, 99, skab153. [Google Scholar] [CrossRef] [PubMed]
- Hotamisligil, G.S.; Davis, R.J. Cell Signaling and Stress Responses. Cold Spring Harb. Perspect. Biol. 2016, 8, a006072. [Google Scholar] [CrossRef] [PubMed] [Green Version]
- Kim, E.K.; Choi, E.J. Pathological roles of MAPK signaling pathways in human diseases. Biochim. Biophys. Acta 2010, 1802, 396–405. [Google Scholar] [CrossRef] [Green Version]
- Veshkini, A.; Hammon, H.M.; Lazzari, B.; Vogel, L.; Gnott, M.; Tröscher, A.; Vendramin, V.; Sadri, H.; Sauerwein, H.; Ceciliani, F. Investigating circulating miRNA in transition dairy cows: What miRNAomics tells about metabolic adaptation. Front. Genet. 2022, 13, 946211. [Google Scholar] [CrossRef]
- Song, Y.; Li, N.; Gu, J.; Fu, S.; Peng, Z.; Zhao, C.; Zhang, Y.; Li, X.; Wang, Z.; Li, X.; et al. β-Hydroxybutyrate induces bovine hepatocyte apoptosis via an ROS-p38 signaling pathway. J. Dairy Sci. 2016, 99, 9184–9198. [Google Scholar] [CrossRef]


Publisher’s Note: MDPI stays neutral with regard to jurisdictional claims in published maps and institutional affiliations. |
© 2022 by the authors. Licensee MDPI, Basel, Switzerland. This article is an open access article distributed under the terms and conditions of the Creative Commons Attribution (CC BY) license (https://creativecommons.org/licenses/by/4.0/).
Share and Cite
Li, C.; Huang, J.; Chen, X.; Yan, Y.; Li, L.; Zhao, W. Transcriptome Analysis Reveals That NEFA and β-Hydroxybutyrate Induce Oxidative Stress and Inflammatory Response in Bovine Mammary Epithelial Cells. Metabolites 2022, 12, 1060. https://doi.org/10.3390/metabo12111060
Li C, Huang J, Chen X, Yan Y, Li L, Zhao W. Transcriptome Analysis Reveals That NEFA and β-Hydroxybutyrate Induce Oxidative Stress and Inflammatory Response in Bovine Mammary Epithelial Cells. Metabolites. 2022; 12(11):1060. https://doi.org/10.3390/metabo12111060
Chicago/Turabian StyleLi, Chengmin, Junpeng Huang, Xiangxing Chen, Yexiao Yan, Lian Li, and Weiguo Zhao. 2022. "Transcriptome Analysis Reveals That NEFA and β-Hydroxybutyrate Induce Oxidative Stress and Inflammatory Response in Bovine Mammary Epithelial Cells" Metabolites 12, no. 11: 1060. https://doi.org/10.3390/metabo12111060