Article

Physiological and Proteomic Responses of Dairy Buffalo to Heat Stress Induced by Different Altitudes

1
Faculty of Animal Science and Technology, Yunnan Agricultural University, Kunming 650201, China
2
Faculty of Big Data, Yunnan Agricultural University, Kunming 650201, China
3
Yunnan Provincial Key Laboratory of Animal Nutrition and Feed Science, Kunming 650201, China
*
Author to whom correspondence should be addressed.
These authors contributed equally to this work.
Metabolites 2022, 12(10), 909; https://doi.org/10.3390/metabo12100909
Submission received: 28 August 2022 / Revised: 21 September 2022 / Accepted: 21 September 2022 / Published: 27 September 2022
(This article belongs to the Special Issue Metabolites in Ruminant Health)

Abstract

:
Buffalo are mainly distributed in low-altitude (LA), medium-altitude (MA), and high-altitude (HA) regions characterised by different thermal and oxygen environments in Yunnan province, China. Due to black skin, sparse hair, and the low density of skin sweat glands, buffalo are more sensitive to heat stress. Here, we used data-independent acquisition (DIA) proteomics to reveal a broad spectrum of proteins that play roles in adaptation to the heat stress of buffalo raised at low altitude or hypoxia at high altitude. LA buffalo showed higher body temperatures than MA- and HA buffalo, and HA buffalo had higher levels of GSH and SOD and lower levels of ROS compared to LA and MA buffalo. In 33 samples, 8476 peptides corresponding to 666 high-confidence proteins were detected. The levels of circulating complement proteins in the immune pathways were lower in LA and MA buffalo than in HA buffalo. There were higher levels of alpha-1 acid glycoprotein in LA buffalo than in MA and HA buffalo. Relative to MA buffalo, levels of blood oxygen delivery proteins were higher in LA and HA buffalo. A higher abundance of apolipoproteins was detected in LA and MA buffalo than in HA buffalo. In summary, buffalo adopted similar adaptation strategies to oxidative stress induced by heat stress or hypoxia, including immunological enhancement, high efficiency of blood oxygen delivery, and the inhibition of lipid oxidation.

1. Introduction

Buffalo are the second-largest source of milk globally. Buffalo milk is characterised by high concentrations of proteins, fat, and total solids compared to cow milk [1]. China has rich buffalo resources and produces 5% of the world’s buffalo milk [2]. Yunnan Province is located at altitudes ranging from 76 to 6740 m in Southwestern China and has complex topography. It neighbours Myanmar, Lao, and Vietnam. The geographic distribution of dairy buffalo in Yunnan Province are the states of Dehong, Baoshan, and Dali, which are characterised as low-, medium-, and high-altitude, respectively. There are about 56,000, 8000, and 15,000 buffaloes raised in the three states, respectively. Dehong state, as a typical lowland subtropical area, is characterised by high ambient temperature and humidity in warm seasons, causing chronic heat stress for buffalo in summer [3].
Higher temperatures resulting from global climate change cause low levels of animal production performance, health, and welfare [4,5]. Buffalo are warm-blooded animals, maintaining a constant body temperature of about 38.0 +/−0.5 °C. Due to their black skin, sparse hair, and the low density of skin sweat glands—one-sixth the density of cattle [6]. The optimum temperatures and humidity of buffalo are 13–18 °C and 55–65%, respectively [7], so they are more sensitive to heat stress-induced oxidative stress when the body heat load is greater than heat dissipation. In low-altitude raising regions, high humidity may restrain the efficiency of evaporative heat dissipation in buffalo [8]. Heat stress at low altitudes may adversely affect animal production performance, health, and welfare [9]. In addition, high-altitude raising regions of dairy buffaloes are characterised by a shortage of atmospheric oxygen. High-altitude hypoxia leads to the increased accumulation of reactive oxygen species (ROS) from up-regulation of the mitochondrial electron transport chain and nitric oxide synthase [10,11]. For Chinese Holstein cows, high altitude impairs rumen fermentation and increases the basal metabolism rate [12]. The oxidative stress induced by heat stress and hypoxia isregulated by ROS-mediated activation of hypoxia-inducible factor 1 and heat shock factor 1 [13].
Blood biomarkers are used as indicators of the physiological state of an animal and its responses to changing environmental conditions [14]. We hypothesised that serum proteins related to heat stress-induced oxidative stress at low altitudes or hypoxia-induced oxidative stress at high altitudes would differ in dairy buffalo raised at different altitudes. Proteomics has been widely used to assess the ability of livestock to adapt to heat stress and hypoxia [15]. Specifically, data-independent acquisition (DIA) proteomics, with high reproducibility and high throughput, is a powerful technique in proteomics studies [16]. Here, we used DIA proteomics to reveal differential proteins that play roles in adaptation to heat stress of buffalo raised at low altitude or hypoxia at high altitude. The research findings may be conducive to improving the health and welfare of buffaloes with special feed additives.

2. Materials and Methods

2.1. Experimental Animals and Management

Dairy buffalo farms used in the experiment were situated at a low altitude of 912.0 m (LA), a medium altitude of 1536.0 m (MA), or a high altitude of 1865.0 m (HA). Thirty-three healthy multiparous (parity = 3.2 ± 1.1) Nili-Ravi × Murrah × Local crossbred buffalo (9, 12, and 12 LA, MA, and HA buffalo, respectively) at mid-lactation (115 ± 10 days) were group-housed in an open-sided barn and fed two times a day using the same total mixed rations (80% whole-plant corn silage ad libitum, 12.5% concentrate feeding, 7.5% corn protein powder) in June. The nutritional values of the three feed ingredients are shown in Supplemental Table S1.
Temperature and humidity loggers (±0.2 °C; Testo 175H1), placed 2.0 m above the floor of the bedding area, recorded the ambient temperature and relative humidity at 30 min intervals to calculate the temperature-humidity index (THI) according to the following equation [17] in the field trails:
THI = (1.8 × T + 32) − (0.55 − 0.0055 × RH) × (1.8 × T − 26)
Here, T is the ambient temperature (°C), and RH is the relative humidity (%).
A waterproof micro-temperature sensor (± 0.5 °C; DS1922L, Wdsen Electronic Technology Co., Ltd. Shanghai, China), fixed in the slot of a T-shaped internal controlled drug release device (without progesterone; DEC International, NZ, Ltd. Hamilton, New Zealand), was placed in the vagina of buffalo to record body temperature at 30 min intervals. At the end of the field trial (15 d), the blood samples were collected with vacutainer tubes via jugular venipuncture. Each sample was centrifuged at 1400× g for 10 min to separate the serum. The serum samples were quickly frozen in liquid nitrogen and then stored at −80 °C for later assay.

2.2. ELISA Analysis of Serum Parameters

The levels of aldosterone (ALD), glucocorticoid (GC), corticotropin-releasing factor (CRF), prolactin (PRL), glutathione (GSH), insulin-like growth factor 1 (IGF-1), thyroxine 3 (T3), adrenocorticotropic hormone (ACTH), cortisol (COR), superoxide dismutase (SOD), ceruloplasmin (CP), heat shock factor 1 (HSF1), ROS, and hypoxia-inducible factor 1α (HIF-1α) in the serum were measured using ELISA kits according to the manufacturer’s instructions.

2.3. Sample Preparation and Fractionation for DDA Library Generation

The serum protein concentrations were determined using a BCA protein assay kit. The inter-rater agreement of all the protein samples was evaluated via an SDS-PAGE gel with Coomassie blue staining. About 20–40 μg of protein from each sample was used for data-dependent acquisition (DDA) library construction. The LA, MA, and HA samples were analysed individually.
The FASP procedure was applied for protein digestion. The protein sample (200 μg) was added to urea buffer (8 M) to a final volume of 60 μL. To this was added dithiothreitol (DTT; 1 M, 0.5 μL), and the mixture was incubated at 56 °C for 30 min. Iodacetamide (25 μL) was then added with stirring, and the resulting mixture was incubated at room temperature for 30 min. NH4HCO3 (100 mM, 240 μL) was added to dilute the urea solution to 1.5 M. To each sample tube, trypsin (4 μg) was added at a protein:trypsin ratio of 1:50 and the resulting mixture was incubated in a 37 °C water bath for 20 h. Formic acid (FA; 10%, 20 μL) was added to the protein mixture and then desalted using a Waters SPE column (Oasis MCX SPE 96-well plate, 186,008,304). Finally, the desalted samples were freeze-dried, and the peptide content was estimated via the UV light spectral density at OD280 (Nanodrop 2000C, Thermo Fisher Scientific, Waltham, MA, USA). Pooled peptides (200 μg) were fractionated into 10 fractions using a High-pH Reversed-Phase Peptide Fractionation Kit (Thermo Scientific™ Pierce™, 848,868).
Each fraction was concentrated by vacuum centrifugation and reconstituted in FA (0.1% v/v, 10 µL). The collected peptides (2 μg) were desalted on C18 cartridges (Empore™ SPE Cartridges C18 (standard density), bed ID 7 mm, volume 3 mL, Sigma, Saint Louis, MO, USA) and re-dissolved in FA (0.1% v/v, 40 µL). An iRT-kit (Ki-3002-2, Biognosys AG, Schlieren, Switzerland) was used to calibrate the relative retention time differences between runs with a 1:3 volume ratio of iRT standard peptides versus the sample peptides.

2.4. Data-Dependent Acquisition Mass Spectrometry Assay

Data-dependent acquisitions were used to generate a spectral library to form the query database for the DIA mass spectra in later data analysis. Serum protein samples were fractionated using high pH reversed-phase separation to increase proteomic depth. The gradient elution of the peptides was performed on a homemade column (100 μm × 20 mm, 5 μm-C18). The linear gradient in the column was as follows: 10–30% solution B at 0–97 min, 30–100% solution B at 97–110 min, 100% solution B at 110–120 min and 100% solution B. The peptides were separated using a linear gradient of buffer B (84% acetonitrile and 0.1% FA) at a flow rate of 250 nL min−1.
The DDA runs were performed on a Q-Exactive HF mass spectrometer (Thermo Scientific) coupled with an Easy nLC-1200 system (Thermo Scientific) for DDA analysis. Q-Exactive HF mass spectrometry was performed in the data-dependent mode to switch automatically between MS and MS/MS acquisition. The full-scan MS survey was in the positive ion mode, and the scan range was 300–1800 m/z. The mass resolution for MS1 was 60,000 at m/z 200 (3e6 AGC, 200 ms maximum injection time). The resolution for twenty sequential MS2 scans was 30,000 at m/z 200 (3e6 AGC, 120 ms maximum injection time). For MS/MS, the normalised collision energy was set at 27 eV. The DDA spectra were analysed using MaxQuant and were filtered for a false discovery rate (FDR) of 1% at the peptide and protein levels.

2.5. Mass Spectrometry Assay for Data-Independent Acquisition

The peptides in each sample were analysed by LC-MS/MS operating in the DIA mode by Shanghai Applied Protein Technology Co., Ltd., Shanghai, China. After the construction of the spectral library for database query, peptide (2 μg) mixed with iRT peptide was injected for DIA mass spectrometry. The Easy nLC-1200 system was used for chromatographic separation using a binary solvent system consisting of solvent A (0.1% FA) and solvent B (84% acetonitrile, 0.1% FA). Solvent A (95%) was used to equilibrate the analytical column (homemade tip column, 75 μm × 250 mm, 1.9 μm-C18). The peptide mixture was separated via gradient elution with a 25 cm tip column at a flow rate of 250 nL.min−1 using a linear gradient in the trap column (100 μm × 20 mm, 5 μm-C18; 10–30% solution B at 0–97 min, 30–100% solution B at 97–110 min and 100% solution B at 110–120 min).
HF mass spectrometry (Q-Exactive) was performed in the DIA mode to switch automatically between MS and MS/MS acquisition. The run time was 120 min in the positive ion mode with a linear gradient of buffer B (80% acetonitrile and 0.1% FA) at a flow rate of 250 nL min−1. The quality control samples were injected in the DIA mode to monitor the MS performance. DIA scans covered a mass range of 350–1650 m/z with the following settings: SIM full scan resolution 120,000 at 200 m/z, AGC 3e6, 50 ms maximum injection time). Thirty sequential DIA MS2 scans were run at a resolution of 30,000 at 200 m/z, AGC target 3e6, automatic maximum injection time and normalised collision energy of 30 eV.

2.6. Mass Spectrometry Data Analysis

MaxQuant software (1.5.3.17) was used to search the FASTA sequence database. The database was downloaded from http://www.uniprot.org, 20 September 2022. The iRT peptide sequence was as follows:
Biognosys|iRT-Kit|Sequence_fusionLGGNEQVTRYILAGVENSKGTFIIDPGGVIRGTFIIDPAAVIRGAGSSEPVTGLDAKTPVISGGPYEYRVEATFGVDESNAKTPVITGAPYEYRDGLDAASYYAPVRADVTPADFSEWSKLFLQFGAQGSPFLK.
The MS search parameters were as follows: cutting enzyme, trypsin; maximum missed cleavages, 2; fixed modification, carbamidomethyl (C); dynamic modifications, oxidation (M) and acetyl (Protein N-term). The reported data were based on 99% confidence for protein identification by false discovery rate (≤1%).
The spectral library was constructed by importing the original raw files, and DDA search results were imported into Spectronaut Pulsar XTM_12.0.20491.4 (Biognosys AG, Schlieren, Switzerland). Spectronaut was used to analyse the DIA data with the above constructed spectral library. The main software parameters were set as follows: retention time prediction type, dynamic iRT; interference on MS2 level correction, enabled; cross run normalisation, enabled. All of the results were filtered based on a Q value cut-off of 0.01 (equivalent to FDR < 1%).

2.7. Principal Component Analysis, GO and KEGG Pathway Annotation

The relationship between the serum samples obtained from different altitude buffalo was visualised using a principal component analysis of the quantified proteins using R packages. Significantly differential serum proteins were identified at a fold-change of greater than 1.5 (<0.67) and a p-value of less than 0.05. Gene ontology (GO) terms and the Blast2GO software (http://www.blast2go.com/b2ghome, 18 September 2018) were used for the annotation of protein sequences, and the GO annotation results were plotted using R scripts. The differential protein sequences were blasted against the Kyoto Encyclopedia of Genes and Genomes (KEGG) database (http://geneontology.org/, 30 September 2018) to identify KEGG Orthology. Differential proteins were mapped to KEGG pathways.

2.8. LC-PRM/MS Quantitative Validation of Targeted Proteins

The levels of serum proteins that are associated with heat stress or hypoxia in buffalo were quantified using parallel reaction monitoring (PRM). Each sample containing peptide (4 μg) was mixed with standard peptide ELGQSGVDTYLQTKSAAGAFGPELSR (200 fmol) after protein digestion. The gradient elution was performed on a C18 HPLC column. Solvent A (95%) was used to equilibrate the analytical column (Thermo Scientific EASY). The peptides were separated using a linear gradient of solvent B (84% acetonitrile and 0.1% FA) at a flow rate of 300 nL min−1. The linear gradient in the column was as follows: 5–10% solution B at 0–2 min, 10–30% solution B at 2–45 min, 30–100% solution B at 45–55 min and 100% solution B at 55–60 min.
HF mass spectrometry (Q-Exactive) was performed in the PRM/MS acquisition mode. Full-scan MS surveys (m/z 300–1800) were acquired with a mass resolution (R) of 60,000 at m/z 200 (3e6 AGC 200 ms maximum injection time). This was followed by twenty sequential MS2 scans for higher-energy collisional dissociation (HCD) that conformed to the following parameters: isolation window, 1.6 Th; R, 30,000 at m/z 200; AGC, 3e6; maximum IT, 120 ms; MS2 activation type, HCD. For MS/MS, the normalised collision energy was 27. Skyline v3.5.0 was used to analyse the PRM raw data. The peptide settings used for the Skyline import were consistent with the MaxQuant search parameters (i.e., enzyme set to trypsin, max missed cleavages set to 2). Three consecutive high-intensity peptides were selected to import into Skyline for each set of Skyline analyses. The number of targeted proteins, the sequences of the targeted peptides, the charges of the parent ions, and the peak areas were determined. The total peak areas were calibrated against internal peptide standards using heavy isotopes, and the target peptides were quantified based on the total peak areas.

3. Results

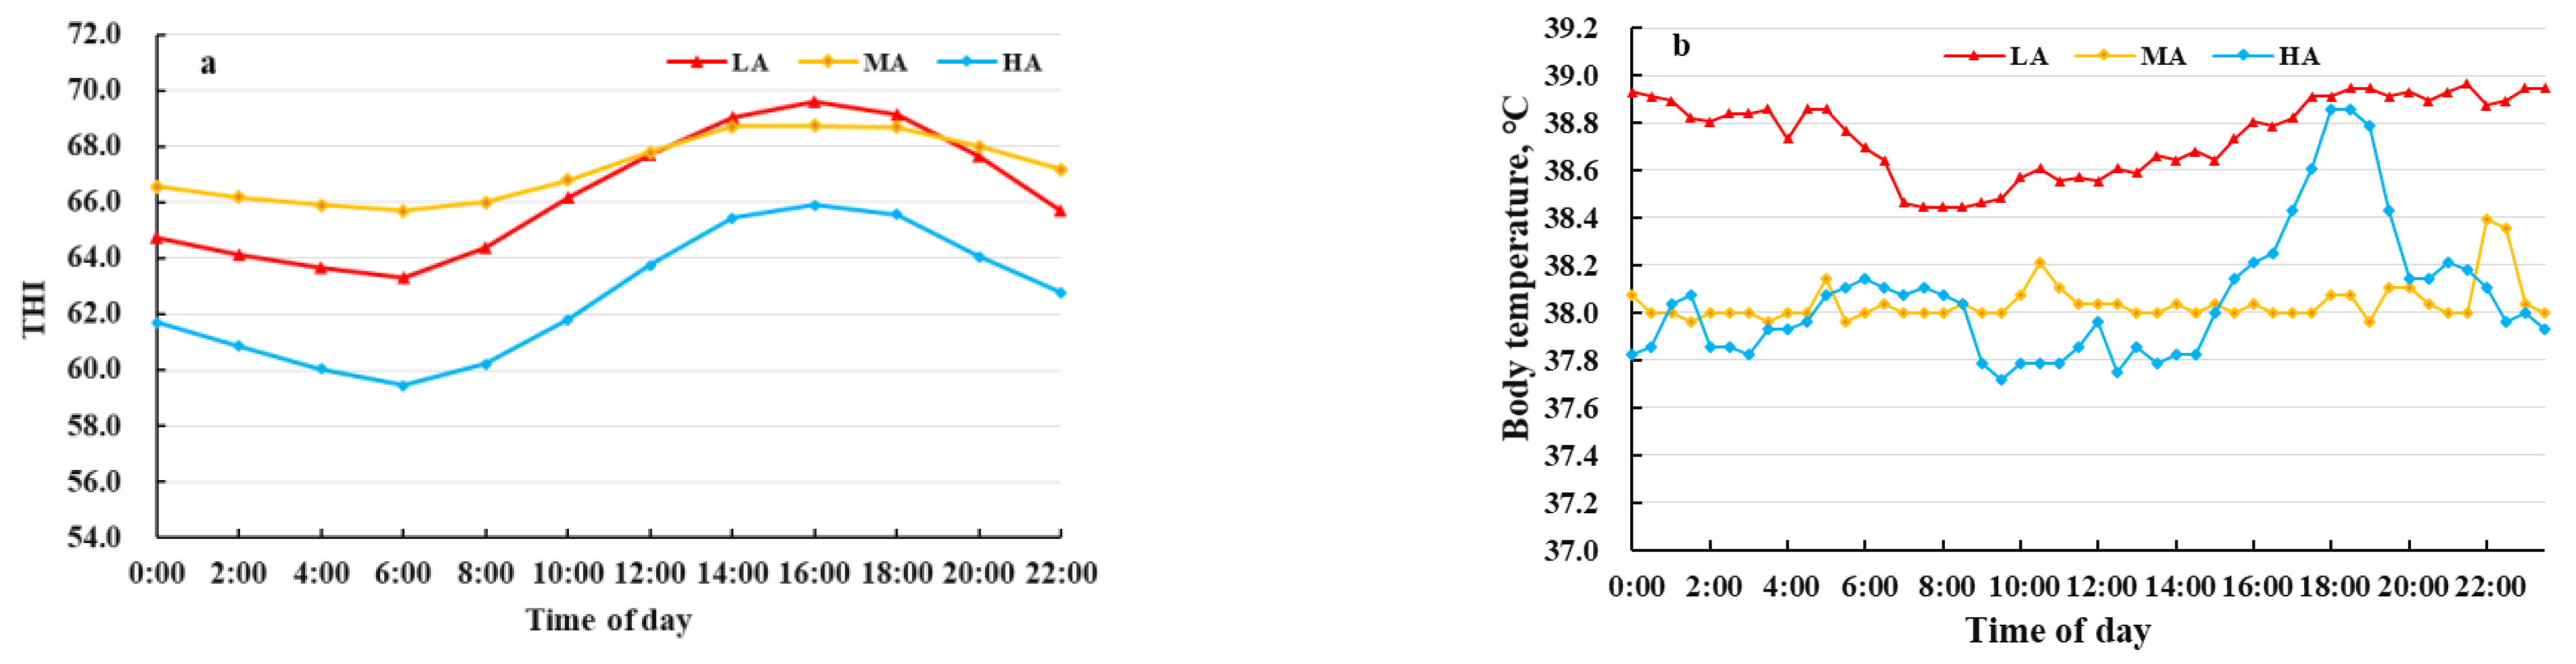
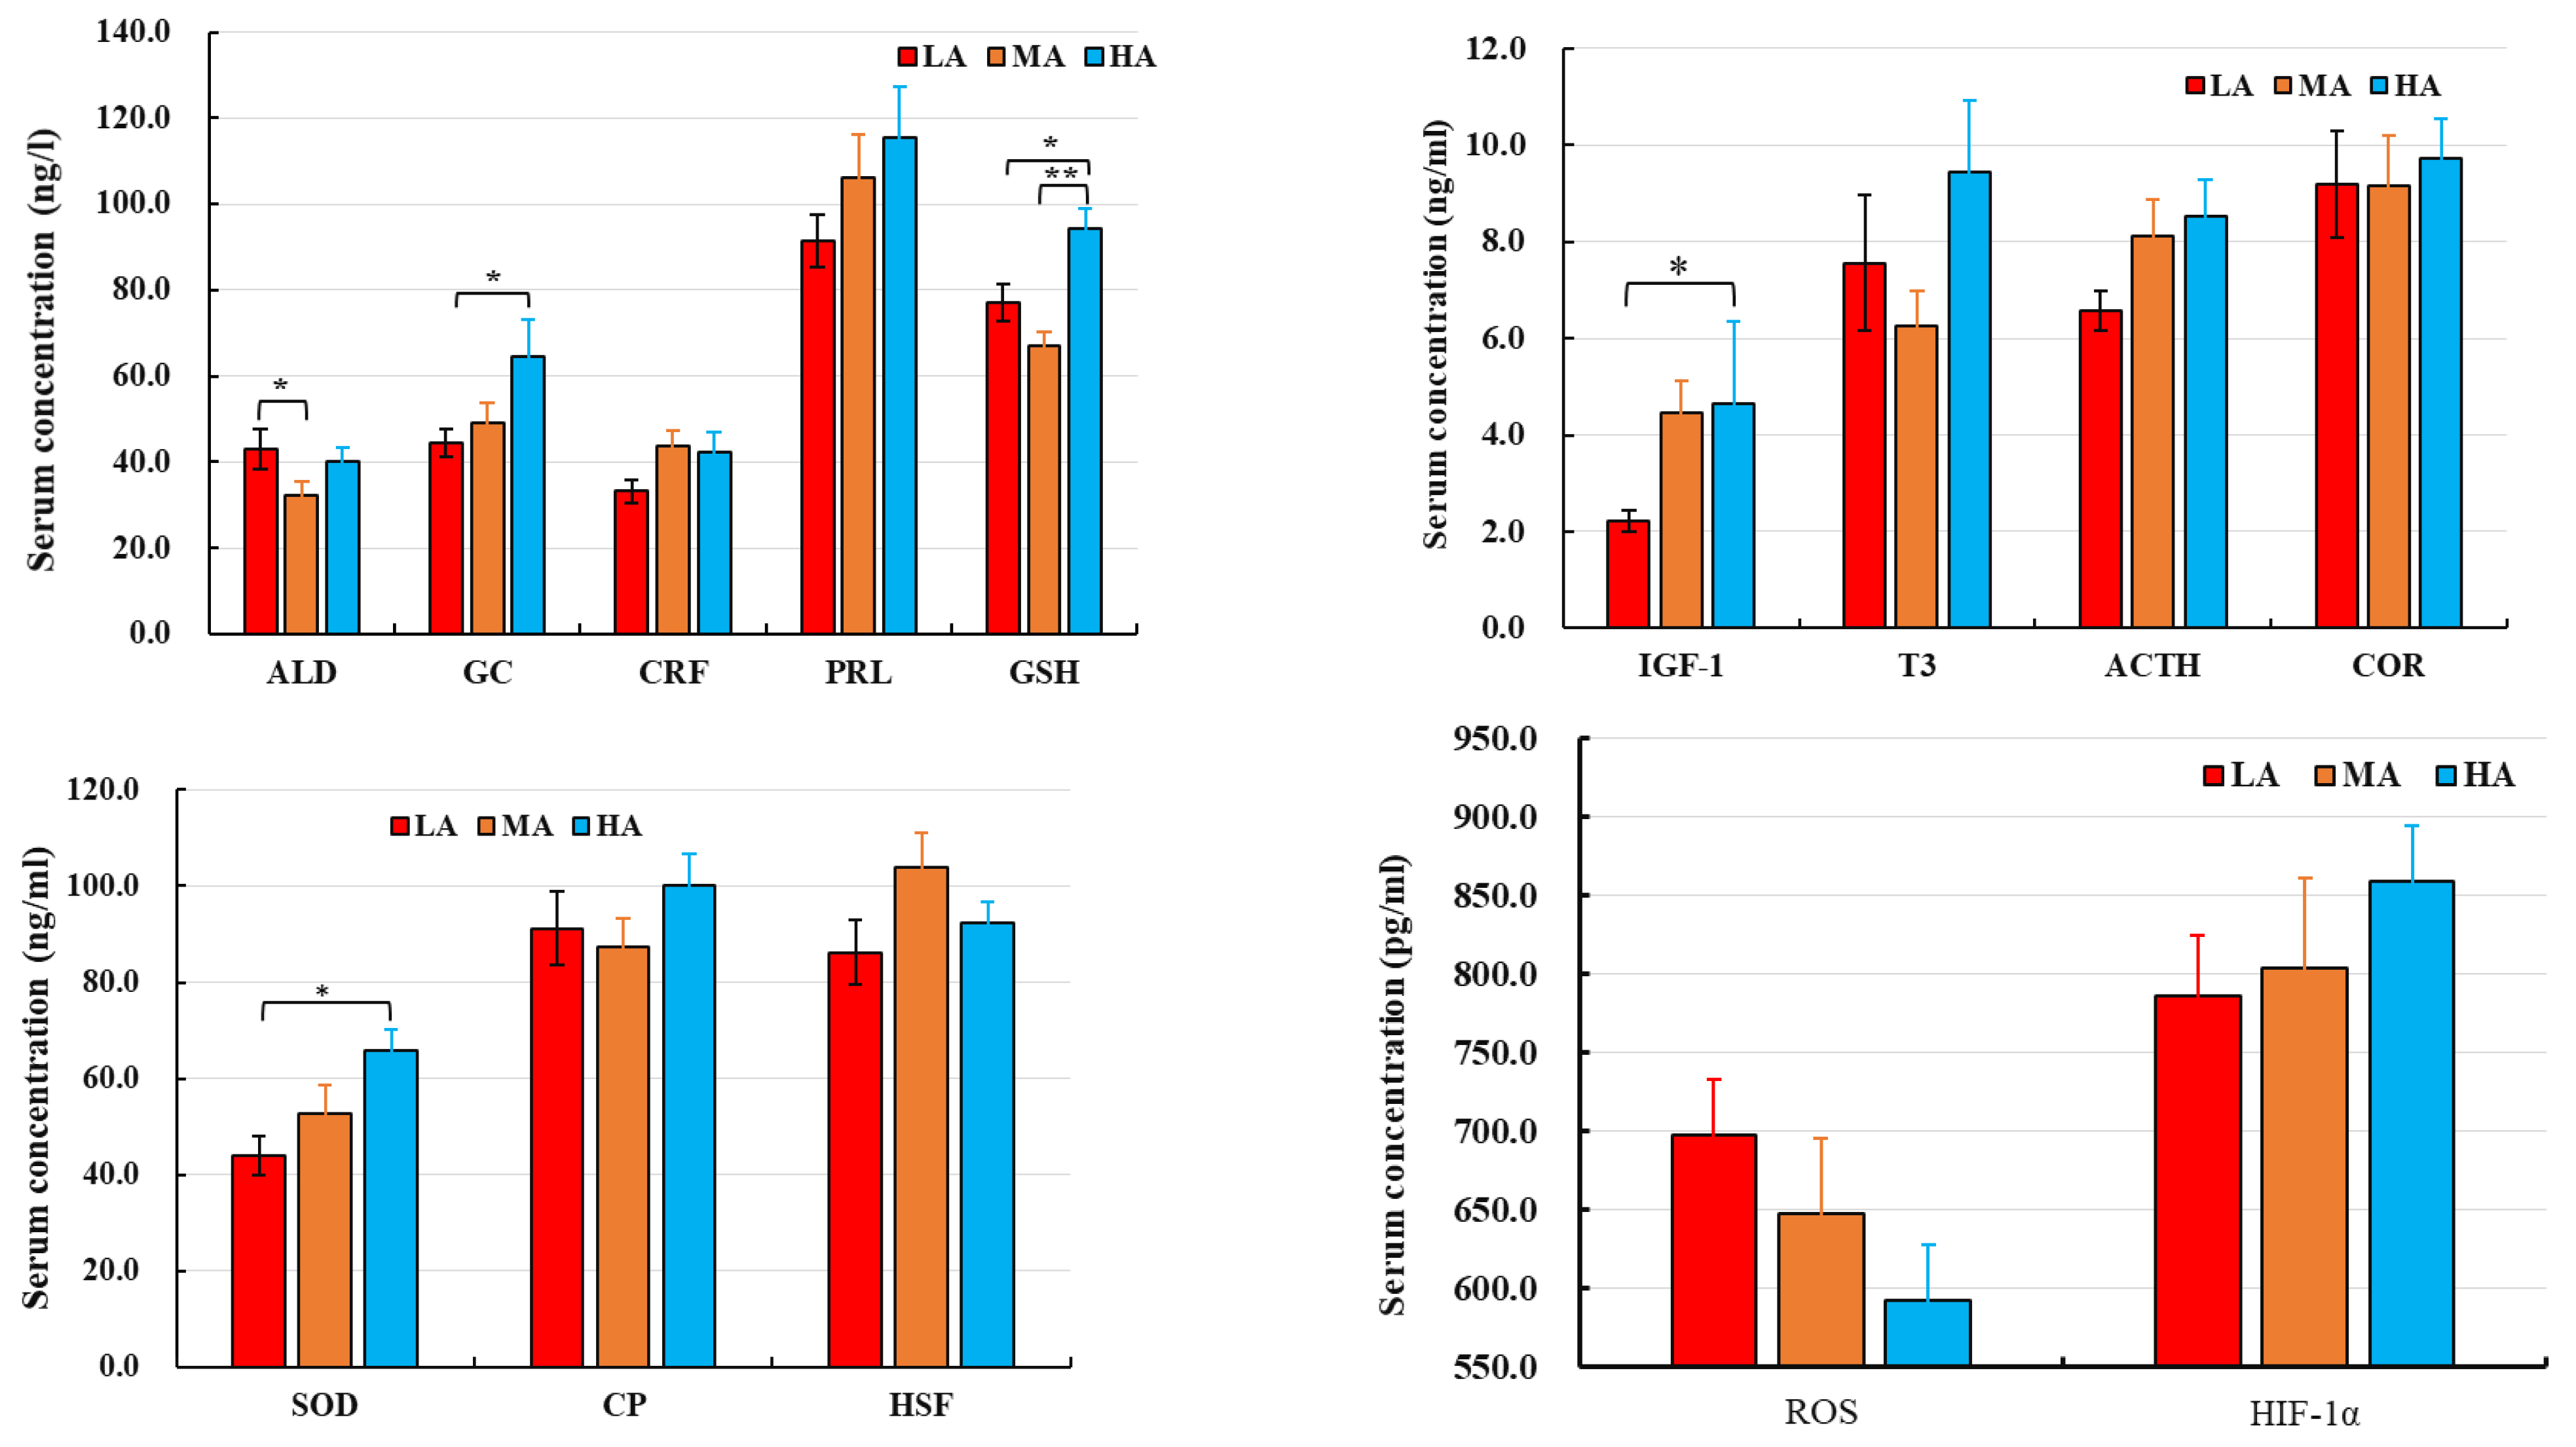
3.1. Physiological Parameters of Buffalo Raised at Different Altitudes

The THI values and buffalo body temperatures are shown in Figure 1. The THI values of LA and MA buffalo (66.3 and 67.2, respectively) were higher than for HA buffalo (62.6). LA buffalo had significantly higher body temperature (38.8 °C) than MA and HA buffalo (38.0 and 38.1 °C, respectively). No significant differences were observed in the serum levels of CRF, PRL, T3, ACTH, COR, CP, HSF, ROS, and HIF-1α in buffalo raised at different altitudes. In contrast, HA buffalo had higher levels of IGF-1, GSH and SOD and lower levels of ROS as compared to LA and MA buffalo (Figure 2).

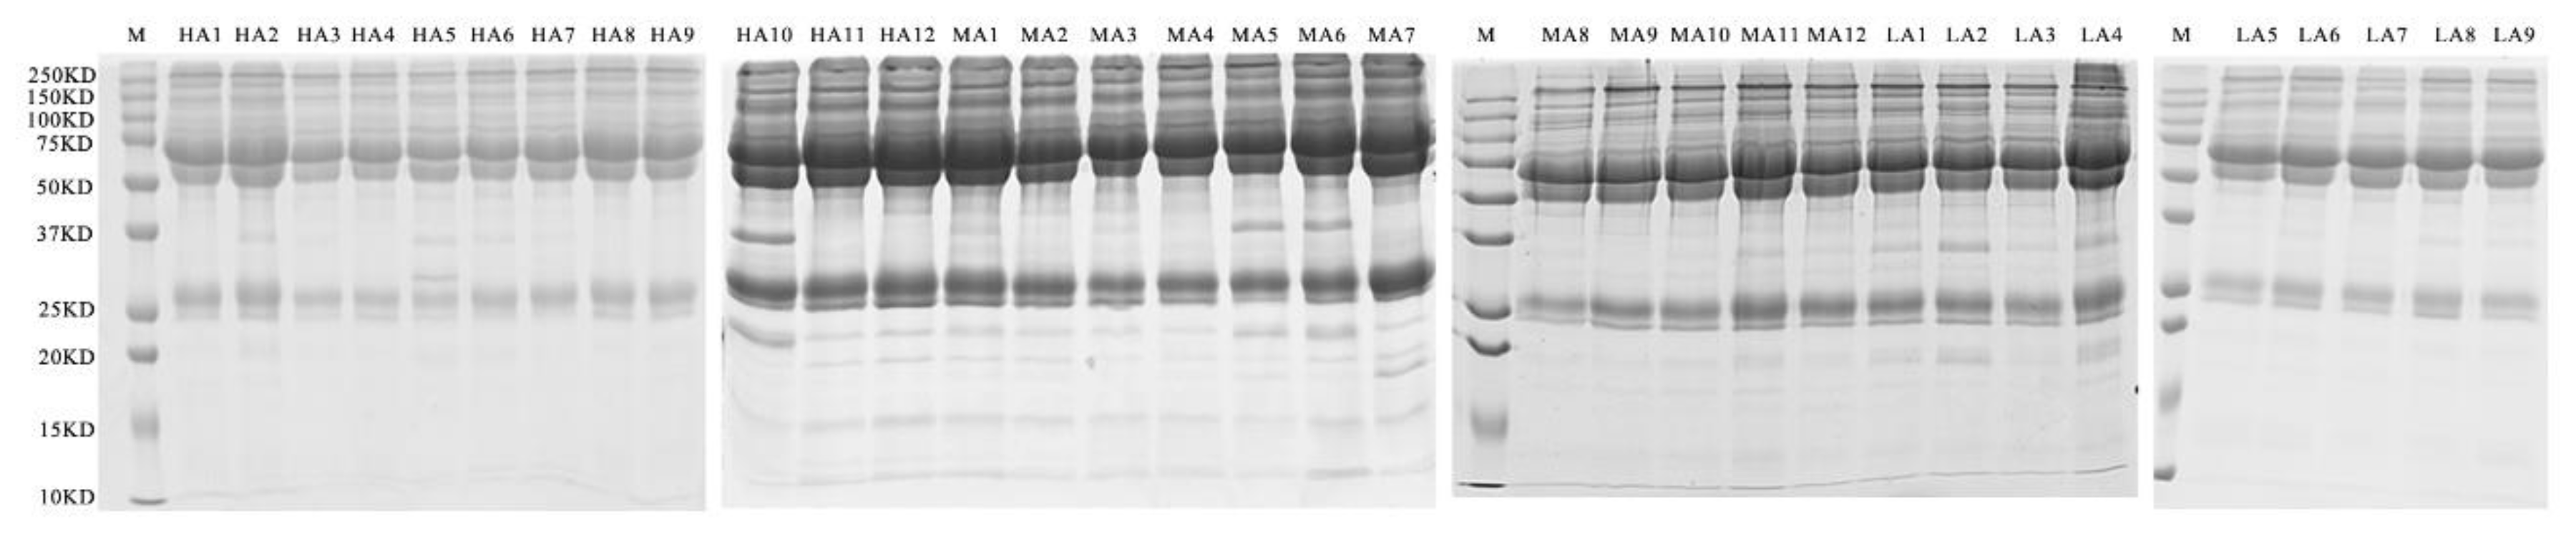
3.2. Spectral Library Construction of DIA Proteomics

The SDS-PAGE gel assay with Coomassie blue staining indicated that the proteins had good consistency in the serum samples (Figure 3). The BCA protein assay showed differences in the amount of total protein (10.36, 10.44 and 11.82 μg μL−1 for LA, MA, and HA buffalo, respectively), so the same amount of protein was used for further analyses of all the samples (Supplemental Table S2). The samples were digested with the in-solution digestion method and identified using the DIA proteomic technique. The DDA library from Maxquant 1.5.3.17 had 509 protein groups and 3990 peptides, while the DIA library from Spectronaut Pulsar 12.0.20491.4 had 535 protein groups and 3790 peptides. When these libraries were merged, the resulting spectral library had 749 protein groups and 5388 peptides.

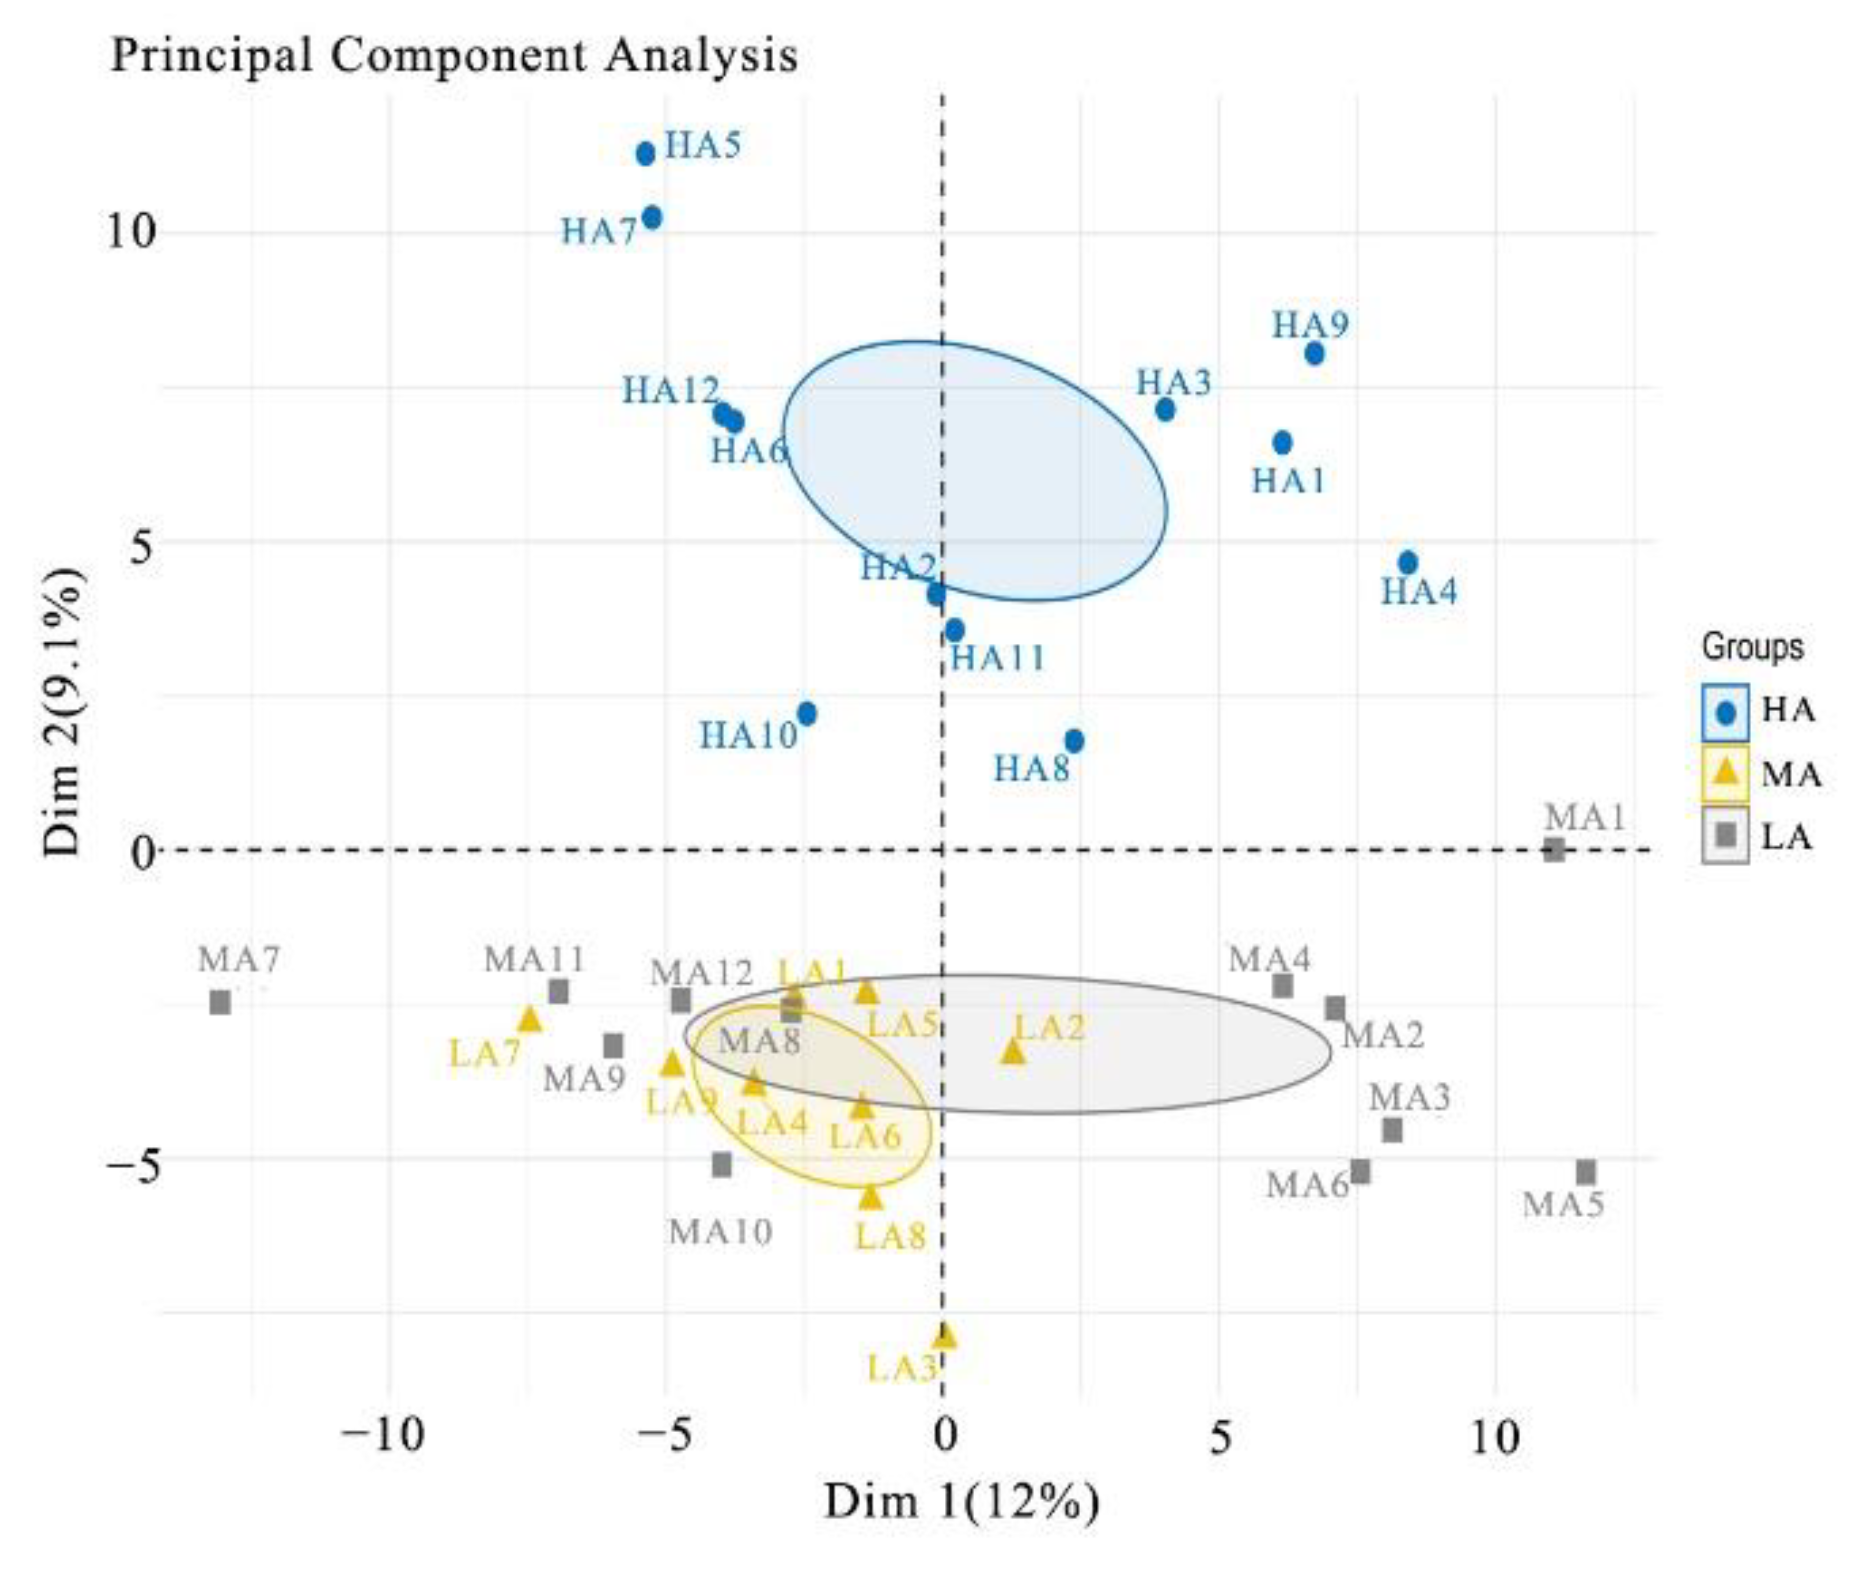
3.3. Data Reliability and Principal Component Analysis

Spectronaut™ Pulsar X was used to evaluate the correlations in the quantitative data from the protein expression analyses. During data acquisition, there was an average of 7.4 data points per chromatographic peak, which was adequate for accurate quantification. The average peak capacity was 503.2, reflecting the highly efficient chromatographic separation achieved by the DIA analysis. The elution times of the 11 standard peptides indicated the high stability of the chromatographic analysis. False-positive proteins were filtered at a 1% protein FDR threshold so that only proteins with high credibility were kept and all of the average CScore values were greater than 1. The principal component analysis of the quantified proteins provided a visualisation of the relationships between the samples in this study. The biological replicates clustered appropriately and could be distinguished to display the dataset with reasonable reproducibility (Figure 4).

3.4. Differential Protein Identification

There were 8476 peptides identified in the serum, which corresponded to 666 high-confidence proteins in the Spectronaut Pulsar X search engine. The results from the protein quantitative analyses and differential expression analyses are shown in Supplemental Table S3. Analysis of variance revealed 60 proteins that were relevant to adaptation to environmental stresses that were significantly differentially abundant in the serum of buffalo raised at different altitudes (Table 1). These differentially expressed proteins in the serum were selected for further analysis based on the fold-change (≥1.50 or <0.67) and p-value < 0.05 (Supplemental Table S3). The serum proteins were displayed in a volcano plot (Supplemental Figure S1), and hierarchical clustering showed they could be grouped according to their differential abundance (Supplemental Figure S2). Functional analysis showed that these differentially expressed proteins were involved in immunoregulation, lipoprotein metabolism, the regulation of blood coagulation, oxygen binding and delivery, and antioxidant stresses (Table 2).

3.5. Gene Ontology Analysis

The GO terms that were highly enriched in the 60 differentially expressed proteins were identified by DIA proteomics (Table 2). In a pairwise comparison of LA and MA buffalo, 10 GO terms were mainly related to major histocompatibility complex (MHC) protein, oxygen binding and delivery. Eight GO terms were mainly and significantly related to oxygen binding and delivery in a pairwise comparison of MA and HA buffalo. In another pairwise comparison of LA and HA buffalo, 20 GO terms were significantly related to the regulation of immune cells, lipoprotein lipid oxidation, blood coagulation and protein ubiquitination. In the three pairwise comparisons (LA vs. MA, MA vs. HA, and LA vs. HA), buffalo shared two GO terms: GO 0002376-immune system process and GO 0050896-response to environmental stress (Supplemental Figure S3, Supplemental Table S4).

3.6. Quantitative Analysis of Targeted Proteins with Parallel Reaction Monitoring

Twenty-five of the 60 differentially expressed proteins from the DIA analyses relating to immunoregulation, lipoprotein metabolism, and the regulation of blood coagulation were selected for PRM analysis. Based on the identification of peptides for which FDR < 30%, 12 target peptides of seven proteins were selected for quantitative PRM analysis. As shown in Table 3, there were 2.06- and 2.48-fold changes in the levels of alpha-1 acid glycoprotein (D2U6V0) in LA buffalo compared to MA and HA buffalo, respectively (p < 0.05). No significant differences were detected in the levels of lipoprotein lipase (E1ACW2) and beta-casein (B7VGH4) between LA and HA buffalo, but there were significantly higher levels of both proteins in LA and HA buffalo compared to MA buffalo (p < 0.05). The levels of apolipoprotein C-III (Fragment; L8IHQ3) and kappa-casein (A0A1L6BP00) were significantly higher in LA buffalo than in MA buffalo (p < 0.01), but there were no differences in the two pairwise comparisons of LA and HA buffalo or MA and HA buffalo.

4. Discussion

4.1. Blood Physiological Parameters of Buffalo

The temperature–humidity index is widely used to evaluate the level of heat stress [18], with 72 being the threshold for dairy cows [3]. The threshold of heat stress, however, may be lower than 72 for dairy buffalo due to black skin, sparser hair, and fewer sweat glands compared to dairy cows [6,19]. LA buffalo may suffer from chronic heat stress, causing oxidative stress with an imbalance between oxidants and antioxidants. To reduce heat load from the ambient environment with the decrease in temperature gradient between internal organs and external environment [20], LA buffalo had significantly higher body temperature than MA and HA buffalo.
ROS at low levels play important roles in immune function and redox regulation [21], but excessive ROS that are not scavenged under long-term heat or oxidative stress induce lipid peroxidation and oxidative damage to protein [22,23,24]. SOD and GSH are important cellular antioxidants for scavenging ROS. In our study, increased production of ROS was detected, which suppressed the levels of serum antioxidants [25]. Lower levels of GSH and SOD were present in LA buffalo as compared to MA and HA buffalo. HA buffalo live in a comfortable thermal environment (17.5 °C and THI 62.6) and had higher levels of GSH than the LA and MA buffalo. HA buffalo also showed higher serum levels of HIF-1α, but this increase was not significantly different compared to LA and MA buffalo.

4.2. Blood Immunoglobulins of Buffalo

Heat stress suppresses the immune function and antioxidant capacity of farm animals [26,27], and increased susceptibility to diseases was observed in heat-stressed animals [28]. Complement pathways and blood coagulation are important natural antibacterial systems [29], and complement proteins play important roles in the elimination of pathogens with complement pathways [30]. We detected that the serum levels of immunoglobulins, including complement factor H, complement component C8 alpha chain, complement factor I, complement factor H-related protein 3 (Fragment), complement component C6, complement factor B, complement C5, and properdin were lower in LA and MA buffalo than in HA buffalo (Table 1). Complement factor H is a member of the complement regulator and plays an important role in complement activation pathways [31].
Most of the serum immunoglobulins were at lower levels in LA buffalo than in MA and HA buffalo, which indicated that buffalo raised at low altitudes suffered from heat stress. Alpha-1 acid glycoprotein, an acute-phase protein produced by the liver and peripheral tissues, which plays a role in immune system regulation [32], was at higher levels in LA buffalo than in MA and HA buffalo. Beta-casein, which regulates the innate and adaptive immune responses in ruminants [33], showed higher levels in LA buffalo than in MA and HA buffalo. Selenoprotein P plays an important role in the transportation of selenium and is one of the main blood antioxidants [34], and glutathione peroxidase is also an important antioxidant [35,36,37]. Both selenoprotein P and glutathione peroxidase were at higher levels in LA and HA buffalo than in MA buffalo. It was inferred that the impact of oxidative stress resulting from heat stress at low altitude or hypoxia at high altitude on the immune responses of buffaloes could be mediated with high levels of serum antioxidants.

4.3. Blood Oxygen–Delivery Proteins of Buffalo

As a metalloprotein and the most abundant haem-containing protein in red blood cells, haemoglobin is responsible for blood oxygen delivery. Haemoglobin subunit alpha-1, haemoglobin subunit alpha-2, haemoglobin foetal subunit beta, haemoglobin subunit beta-A, haemoglobin subunit alpha-I/II and haemoglobin beta were present at higher levels in LA and HA buffalo than in MA buffalo. Unexpectedly, there were no differentially abundant proteins or significantly enriched GO terms related to blood oxygen delivery when comparing LA and HA buffalo (Table 2). Buffalo raised at low altitudes with high ambient temperature and relative humidity in summer may suffer from chronic heat stress, and HA buffalo adapt to hypoxia with highly efficient blood oxygen delivery. Heat stress induces local tissue hypoxia due to blood flow redistribution for increased skin heat dissipation [38,39,40], and it was reasonable that no significantly enriched GO terms related to blood oxygen delivery were detected between LA and HA buffalo.
HA buffalo showed higher levels of haemogen, haemopexin, lactoferrin, and serotransferrin, which possibly increased the amount of blood oxygen to meet the physiological demands. HA buffalo also had higher levels of coagulation factors V and IX compared to LA buffalo. Kallikrein and plasminogen were at higher levels in HA buffalo than in LA buffalo, which have roles in the renin-angiotensin system by converting prorenin into renin and in blood coagulation [41].
Vitamin K-dependent protein S, which circulates in the blood, functions as a cofactor and is important for the inactivation of coagulation factors V and VIII on membrane surfaces [42]. Buffalo raised at high altitudes had higher levels of vitamin K-dependent protein S with anticoagulant properties [43,44], and this higher abundance of vitamin K-dependent protein S may play a role in increasing blood flow to meet the blood oxygen supply of dairy buffalo raised at high altitudes. Heat stress induces oxidative stress and hypoxia [39]. To satisfy the requirements of oxygen delivery for internal organs, an increase in blood flow is necessary for dairy buffalo under chronic heat stress. A higher abundance of vitamin K-dependent protein Z was detected in LA and HA buffalo compared to MA buffalo. As a cofactor, vitamin K-dependent protein Z inhibits coagulation factor Xa on phospholipid surfaces to avoid thrombosis and the coagulation response, thereby promoting smooth blood flow [45]. This indicated that buffalo adapt to hypoxia at high altitudes and heat-stress-induced hypoxia at low altitudes through a high blood oxygen delivery capacity.

4.4. Serum Apolipoproteins of Buffalo

Apolipoproteins are involved in the combination and transportation of lipids [46]. A lower abundance of apolipoprotein C-IV and apolipoprotein F (Fragment) was detected in LA and HA buffalo than in MA buffalo. The trend for phospholipid transfer protein and proactivator polypeptide, which are involved in lipoprotein metabolism and the regulation of lipid metabolic processes, was similar [47]. However, HA buffalo were higher levels of apolipoprotein D, which regulates the protection from oxidative stress and increases stress resistance [46,48]. The HA buffalo also had higher levels of vitamin D binding protein than LA and MA buffalo. Vitamin D binding proteins are the major carriers of vitamin D [49,50], which is involved in the regulation of fatty acid β-oxidation and energy metabolism [51], inhibiting the activation of stress-activated protein kinases [52].

5. Conclusions

Our study indicated that low-altitude buffalo adapted to heat stress-induced oxidative stress with high levels of alpha-1 acid glycoprotein and apolipoproteins, whereas high-altitude buffalo adapted to hypoxia-induced oxidative stress with high complement protein levels for immunological enhancement. In summary, buffalo adopted similar adaptation strategies to oxidative stress induced by heat stress or hypoxia with high levels of serum antioxidants, immunological enhancement, the inhibition of lipid oxidation, and high efficiency of blood oxygen delivery. The research findings may be beneficial to improve the health and welfare of buffaloes with feed additives that enhance immune function and cutaneous circulation.

Supplementary Materials

The following supporting information can be downloaded at: https://www.mdpi.com/article/10.3390/metabo12100909/s1, Figure S1: Volcano plot of the proteins identified as differentially abundant in the three pairwise comparisons of serum; Figure S2: Hierarchical clustering of serum proteins identified as differentially abundant; Figure S3: Pairwise comparisons of the gene ontologies (GO) of the serum proteins between the three farms; Table S1: Nutrient content of feed samples (%); Table S2: The same amount of proteins (μg) with different volumes (μl) for further analysis; Table S3 Protein identification and Protein quantitative; Table S4 Buffalo share two common GO enrichment.

Author Contributions

Writing—review & editing, project administration, Z.G.; Software and formal analysis, Z.C.; Field experiment, Q.L. and X.Y. All authors have read and agreed to the published version of the manuscript.

Funding

This research was supported by young and middle-aged academic and technical leaders reserve talents of Yunnan province, China (202205AC160078).

Informed Consent Statement

Not applicable.

Data Availability Statement

The data presented in this study are available in article and Supplementary materials.

Acknowledgments

We thank Wei Fan and Heng Li of Shanghai Applied Protein Technology Co., Ltd. for their technical assistance.

Conflicts of Interest

The authors declare no conflict of interest.

References

  1. Ménard, O.; Ahmad, S.; Rousseau, F.; Briard-Bion, V.; Gaucheron, F.; Lopez, C. Buffalo vs. cow milk fat globules: Size distribution, zeta-potential, compositions in total fatty acids and in polar lipids from the milk fat globule membrane. Food Chem. 2010, 120, 544–551. [Google Scholar] [CrossRef]
  2. Khedkar, C.D.; Kalyankar, S.D.; Deosarkar, S.S. Buffalo milk. In Encyclopedia of Food and Health; Caballero, B., Finglas, P., Toldrá, F., Eds.; Academic Press: Cambridge, MA, USA, 2016; Volume 1, pp. 522–528. [Google Scholar]
  3. Lallo, C.H.O.; Cohen, J.; Rankine, D.; Taylor, M.; Cambell, J.; Stephenson, T. Characterizing heat stress on livestock using the temperature humidity index (THI)—Prospects for a warmer Caribbean. Reg. Environ. Chang. 2018, 18, 2329–2340. [Google Scholar] [CrossRef]
  4. Desalegn, K. The climate change impacts on livestock production: A Review. Glob. Vet. 2016, 16, 206–212. [Google Scholar]
  5. Chanda, T.; Debnath, G.K.; Khan, K.I.; Rahman, M.M.; Chanda, G.C. Impact of heat stress on milk yield and composition in early lactation of Holstein Friesian crossbred cattle. Bangladesh J. Anim. Sci. 2017, 46, 192–197. [Google Scholar] [CrossRef]
  6. Marai, I.F.M.; Haeeb, A.A.M. Buffalo’s biological functions as affected by heat stress-a review. Livest. Sci. 2010, 127, 89–109. [Google Scholar] [CrossRef]
  7. Payne, W.J.A. Cattle and Buffalo Meat Production in the Tropic; Intermediate Tropical Agriculture Series; Longman Scientific & Technical: Harlow, UK, 1990. [Google Scholar]
  8. De Rensis, F.; Scaramuzzi, R.J. Heat stress and seasonal effects on reproduction in the dairy cow—A review. Theriogenology 2003, 60, 1139–1151. [Google Scholar] [CrossRef]
  9. Chauhan, S.S.; Celi, P.; Leury, B.J.; Clarke, I.J.; Dunshea, F.R. Dietary antioxidants at supranutritional doses improve oxidative status and reduce the negative effects of heat stress in sheep. J. Anim Sci. 2014, 92, 4897–4908. [Google Scholar] [CrossRef]
  10. Dosek, A.; Ohno, H.; Acs, Z.; Taylor, A.W.; Radak, Z. High altitude and oxidative stress. Respir. Physiol. Neurobiol. 2017, 158, 128–131. [Google Scholar] [CrossRef]
  11. Gaur, P.; Prasad, S.; Kumar, B.; Sharma, S.K.; Vats, P. High-altitude hypoxia induced reactive oxygen species generation, signaling, and mitigation approaches. Int. J. Biometeorol. 2021, 65, 601–615. [Google Scholar] [CrossRef]
  12. Qiao, G.H.; Yu, C.Q.; Li, J.H.; Yang, X.; Zhu, X.Q.; Zhou, X.H. Effect of high altitude on nutrient digestibility, rumen fermentation and basal metabolism rate in Chinese Holstein cows on the Tibetan plateau. Anim. Prod. Sci. 2013, 53, 240–246. [Google Scholar] [CrossRef]
  13. Agarwal, S.; Ganesh, S. Perinuclear mitochondrial clustering, increased ROS levels, and HIF1 are required for the activation of HSF1 by heat stress. J. Cell Sci. 2020, 133, 245589. [Google Scholar] [CrossRef]
  14. Muriithi, N.J.; Maina, G.S.; Maina, M.B.; Kiambi, M.J.; Eliud, N.M. Determination of hematological effects of methanolic leaf extract of Vernonia lasiopus in normal mice. J. Blood. Lymph. 2015, 5, 139. [Google Scholar]
  15. Sidorenko, S.V.; Ziganshin, R.H.; Luneva, O.G.; Deev, L.I.; Alekseeva, N.V.; Maksimov, G.V.; Grygorczyk, R.; Orlovabe, S.N. Proteomics-based identification of hypoxia-sensitive membrane-bound proteins in rat erythrocytes. J. Proteomics. 2018, 30, 25–33. [Google Scholar] [CrossRef]
  16. Searle, B.C.; Pino, L.K.; Egertson, J.D.; Ting, Y.S.; Lawrence, R.T.; MacLean, B.X.; Villen, J.; MacCross, M.J. Chromatogram libraries improve peptide detection and quantification by data independent acquisition mass spectrometry. Nat. Commun. 2018, 9, 5128. [Google Scholar] [CrossRef]
  17. Tucker, C.B.; Rogers, A.R.; Schütz, K.E. Effect of solar radiation on dairy cattle behaviour: Use of shade and body temperature in a pasture-based system. Appl. Anim. Behav. Sci. 2008, 109, 141–154. [Google Scholar] [CrossRef]
  18. Morignat, E.; Gay, E.; Vinard, J.L.; Calavas, D.; Hénaux, V. Quantifying the influence of ambient temperature on dairy and beef cattle mortality in France from a time-series analysis. Environ Res. 2015, 140, 524–534. [Google Scholar] [CrossRef] [PubMed]
  19. Gorniak, T.; Meyer, U.; Südekum, K.H.; Dänicke, S. Impact of mild heat stress on dry matter intake, milk yield and milk composition in mid-lactation Holstein dairy cows in a temperate climate. Arch. Anim. Nutr. 2014, 5, 358–369. [Google Scholar] [CrossRef] [PubMed]
  20. Giraffa, G.; Rossetti, L.; Mucchetti, G.; Addeo, F.; Neviani, E. Influence of the temperature gradient on the growth of thermophilic lactobacilli used as natural starters in grana cheese. J. Dairy Sci. 1998, 81, 31–36. [Google Scholar] [CrossRef]
  21. Lefaki, M.; Papaevgeniou, N.; Chondrogianni, N. Redox regulation of proteasome function. Redox Biol. 2017, 13, 452–458. [Google Scholar] [CrossRef]
  22. Ray, P.D.; Huang, B.W.; Tsuji, Y. Reactive oxygen species (ROS) homeostasis and redox regulation in cellular signaling. Cell. Signal. 2012, 24, 981–990. [Google Scholar] [CrossRef]
  23. Akbarian, A.; Michiels, J.; Degroote, J.; Majdeddin, M.; Golian, A.; De Smet, S. Association between heat stress and oxidative stress in poultry; mitochondrial dysfunction and dietary interventions with phytochemicals. J. Anim. Sci. Biotechnol. 2016, 7, 37. [Google Scholar] [CrossRef] [PubMed]
  24. Holmström, K.M.; Finkel, T. Cellular mechanisms and physiological consequences of redox-dependent signalling. Nat. Rev. Mol. Cell Biol. 2014, 15, 411–421. [Google Scholar] [CrossRef] [PubMed]
  25. Lee, S.R. Critical role of zinc as either an antioxidant or a prooxidant in cellular systems. Oxid. Med. Cell. Longev. 2018, 15, 9156285. [Google Scholar] [CrossRef] [PubMed]
  26. Shi, L.; Xu, Y.; Mao, C.; Wang, Z.; Shi, B. Effects of heat stress on antioxidant status and immune function and expression of related genes in lambs. Int. J. Biometeorol. 2020, 64, 2093–2104. [Google Scholar] [CrossRef]
  27. Peli, A.; Scagliarini, L.; Bergamini, P.F.; Prosperi, A.; Pietra, M. Influence of heat stress on the immunity in growing beef cattle. Large Anim. Rev. 2013, 19, 215–218. [Google Scholar]
  28. Berman, A. Invited review: Are adaptations present to support dairy cattle productivity in warm climates? J. Dairy Sci. 2011, 94, 2147–2158. [Google Scholar] [CrossRef]
  29. Dahlbäck, B. C4b-binding protein: A forgotten factor in thrombosis and hemostasis. Semin. Thromb. Hemos. 2011, 37, 355–361. [Google Scholar] [CrossRef]
  30. Blom, A.M.; Villoutreix, B.O.; Dahlback, B. Functions of human complement inhibitor C4b-binding protein in relation to its structure. Arch. Immunol. Ther. Exp. Engl. Ed. 2004, 2, 83–95. [Google Scholar]
  31. Huang, X.F.; Wang, Y.Q.; Li, F.F.; Lin, D.; Dai, M.L.; Wang, Q.F.; Jin, Z.B. CFHR2-rs2986127 as a genetic protective marker for acute anterior uveitis in Chinese. J. Gene Med. 2016, 18, 193–198. [Google Scholar] [CrossRef]
  32. Ceciliani, F.; Lecchi, C. The immune functions of α1 acid glycoprotein. Curr. Protein. Pept. Sci. 2019, 20, 505–524. [Google Scholar] [CrossRef]
  33. Wong, C.W.; Seow, H.F.; Ai, H.L.; Husband, A.J.; Watson, D.L. Modulation of immune responses by bovine beta-casein. Immunol. Cell. Biol. 1996, 74, 323–329. [Google Scholar] [CrossRef]
  34. Rayman, M.P. Selenium and human health. Lancet 2012, 379, 1256–1268. [Google Scholar] [CrossRef]
  35. Dai, J.; Wei, H.; Tian, C.; Damron, F.; Zhou, J.; Qiu, D. An extracytoplasmic function sigma factor-dependent periplasmic glutathione peroxidase is involved in oxidative stress response of Shewanella Oneidensis. BMC Microbiol. 2015, 15, 1–12. [Google Scholar] [CrossRef]
  36. Higuchi, A.; Takahashi, K.; Hirashima, M.; Kawakita, T.; Tsubota, K.; Chakravarti, S. Selenoprotein p controls oxidative stress in cornea. PLoS ONE 2010, 5, e9911. [Google Scholar] [CrossRef]
  37. Lubos, E.; Loscalzo, J.; Handy, D.E. Glutathione peroxidase-1 in health and disease: From molecular mechanisms to therapeutic opportunities. Antioxid. Redox. Sign. 2011, 15, 1957–1997. [Google Scholar] [CrossRef]
  38. Haffor, A.S.; Al-Johany, A.M. Effect of heat stress, hypoxia and hypoxia-hyperoxia on free radical production in mice mus musculus. J. Med. Sci. 2005, 5, 89–94. [Google Scholar] [CrossRef]
  39. Liu, P.; Guo, L.L.; Mao, H.M.; Gu, Z.B. Serum proteomics analysis reveals the thermal fitness of dairy buffalo to chronic heat stress. J. Therm. Biol. 2020, 89, 1–5. [Google Scholar] [CrossRef]
  40. Srikandakumar, A.; Johnson, E.H. Effect of heat stress on milk production, rectal temperature, respiratory rate and blood chemistry in Holstein, Jersey and Australian Milking Zebu cows. Trop. Anim. Health Prod. 2004, 36, 685–692. [Google Scholar] [CrossRef]
  41. Derkx, F.H.M.; Bouma, B.N.; Tan-Tjiong, H.L.; Veld, A.J.M.I.; Schalekamp, M.A.D.H. Plasma Kallikrein as an Activator of Inactive Renin (“Prorenin”)—Studies In-Vitro and In-Vivo. In Hypertension: Mechanisms and Management. International Boehringer Mannheim Symposia; Philipp, T., Distler, A., Eds.; Springer: Berlin/Heidelberg, Germany, 1980; pp. 149–162. [Google Scholar]
  42. Dahlbäck, B.; Wiedmer, T.; Sims, P.J. Binding of anticoagulant vitamin K-dependent proteins to platelet-derived microparticles. Biochemistry 1992, 31, 12769–12777. [Google Scholar] [CrossRef]
  43. Baker, M.E.; French, F.S.; Joseph, D.R. Vitamin K-dependent protein S is similar to rat androgen-binding protein. Biochemistry 1987, 243, 293–296. [Google Scholar] [CrossRef]
  44. Dahlbäck, B. Vitamin K-dependent protein S: Beyond the protein C pathway. Semin, Thromb. Hemost. 2017, 44, 176–184. [Google Scholar] [CrossRef]
  45. Yin, Z.F.; Huang, Z.F.; Cui, J. Prothrombotic phenotype of protein Z deficiency. Proc. Natl. Acad. Sci. USA 2000, 97, 6734–6738. [Google Scholar] [CrossRef]
  46. Zhou, Y.; Luo, G. Apolipoproteins, as the carrier proteins for lipids, are involved in the development of breast cancer. Clin. Transl. Oncol. 2022, 22, 1952–1962. [Google Scholar] [CrossRef]
  47. Greevenbroek, V.; Marleen, M.J. Lipid metabolism: Pleiotropic effects of high-density lipoproteins. Curr. Opin. Lipidol. 2006, 17, 363–365. [Google Scholar] [CrossRef] [PubMed]
  48. Ganfornina, M.D.; Carmo, S.D.; Lora, J.M.; Torres-Schumann, S.; Vogel, M.; Allhorn, M.; González, C.; Bastiani, M.J.; Rassart, E.; Sanchez, D. Apolipoprotein D is involved in the mechanisms regulating protection from oxidative stress. Aging Cell 2008, 7, 506–515. [Google Scholar] [CrossRef] [PubMed]
  49. Bouillon, R.; Pauwels, S. The Vitamin D-Binding Protein, Vitamin D, 4th ed.; Academic Press: Cambridge, MA, USA, 2018; Volume 1, pp. 97–115. [Google Scholar]
  50. Chou, C.H.; Chuang, L.Y.; Lu, C.Y.; Guh, J.Y. Vitamin D-binding protein is required for the protective effects of vitamin D in renal fibroblasts and is phosphorylated in diabetic rats. Mol. Cell. Endocrinol. 2015, 411, 67–74. [Google Scholar] [CrossRef] [PubMed]
  51. Wong, K.E.; Kong, J.; Zhang, W.; Szeto, F.L.; Ye, H.; Deb, D.K.; Matthew, J.B.; Yan, C.L. Targeted expression of human vitamin D receptor in adipocytes decreases energy expenditure and induces obesity in mice. J. Biol. Chem. 2011, 286, 33804–33810. [Google Scholar] [CrossRef]
  52. Ravid, A. Vitamin D inhibits the activation of stress-activated protein kinases by physiological and environmental stresses in keratinocytes. J. Endocrinol. 2002, 173, 525. [Google Scholar] [CrossRef]
Figure 1. Rhythms of vaginal temperature for dairy buffaloes. (a) temperature humidity indexes (THI), (b) body temperatures (measured vaginally). LA, MA and HA indicated buffaloes raised at low, medium, and high altitude, respectively.
Metabolites 12 00909 g001
Figure 2. Serum parameters of dairy buffaloes raised at different altitudes. LA, MA, and HA are indicated buffaloes raised at low, medium, and high altitude, respectively. *p < 0.05, and **p < 0.01.
Metabolites 12 00909 g002
Figure 3. SDS-PAGE of the serum proteins in LA, MA, and HA buffaloes. M, protein marker (10–250 kD); LA, MA, and HA are indicated buffaloes raised at low, medium, and high altitude, respectively.
Metabolites 12 00909 g003
Figure 4. Principal component analysis of proteome profiles. LA, MA, and HA samples are marked with yellow triangle, gray square, and blue circle, respectively. LA, MA, and HA are indicated buffaloes raised at low, medium, and high altitude, respectively.
Metabolites 12 00909 g004
Table 1. Distinct serum proteins of buffaloes raised at different altitudes.
Protein IDProtein NameLAMAHA
Q28085Complement factor H5,911,034.4 b5,846,954.6 b8,003,723.2 a
L8I2Z1Complement component C8 alpha chain822,025.5 b916,592.3 b1,185,262.4 a
L8IHJ7Complement factor I5,073,044.5 b5,423,548.3 b6,754,342.4 a
L8IE64Properdin (Fragment)520,308.3 b518,567.5 b669,974.8 a
L8IGE2Complement factor H-related protein 3 (Fragment)43,900.4 b38,432.8 b67,400.8 a
Q2UVX4Complement C323,107,853.3 ab21,185,578.8 b26,465,504.0 a
F1MM86Complement component C6704,760.6 ab642,334.4 b911,150.4 a
P81187Complement factor B9,508,441.3 b10,024,967.0 ab11,490,473.8 a
L8J0E1Complement C51,908,360.9 b2,204,806.2 a2,240,134.3 a
P17697Clusterin regulation of complement activation997,871.7 b1,381,123.9 a1,311,446.6 a
L8HKR7Ig gamma-3 chain C region (Fragment)122,983,076.8 b272,235,860.9 ab287,926,333.6 a
L8HP94Ig alpha-1 chain C region (Fragment)63,903.4 ab78,224.1 a55,975.5 b
Q7M3F3Alpha-lactalbumin10,190.8 a3491.5 b9000.8 ab
V5RKP7Beta lactoglobulin (Fragment)23,405,971.6 ab47,755,768.4 a8,275,413.5 b
C3W955Beta-lactoglobulin184,142.0 a66,021.5 b118,728.6 ab
F1MHC3CD44 antigen70,788.3 a57,362.6 ab44,820.5 b
B7VGH4Beta-casein310,429.6 a113,776.7 b147,863.8 ab
K9ZS80K-casein (Fragment)24,306.4 a11,099.1 ab7056.9 b
A0A1L6BP00Kappa-casein24,079.1 ab50,215.8 a19,399.3 b
Q3YJI8MHC class I antigen (Fragment)459,090.4 b1,910,361.4 a1,304,512.7 ab
D2U6V0Alpha-1 acid glycoprotein6,132,936.6 a4,486,339.8 ab3,510,769.9 b
Q2KJF1Alpha-1B-glycoprotein6073654.1 a3,382,706.8 b5,714,935.8 ab
I6SJ59Selenoprotein P39,427.8 a16,819.0 b25,330.5 a
F8UTU9Glutathione peroxidase (Fragment)152,540.5 a76,484.9 b117,009.8 ab
A2VE03ITCH protein13,480,011.6 b10,037,581.9 b70,279,200.0 a
A7MBB0VCAM1 protein53,086.1 ab34,630.1 b70,988.3 a
L8J552Microfibril-associated glycoprotein 4 (Fragment)6731.8 b19,358.0 a12,106.7 b
F1MKS5Histidine-rich glycoprotein3,266,560.6 a2,577,096.9 b2,840,214.9 ab
L8IJH2Leucine-rich alpha-2-glycoprotein3,057,520.8 a2,452,175.9 b2,764,774.9 ab
G1K1X9Vitamin K-dependent protein Z445,107.1 a421,009.4 b351,618.1 a
L8IQM7Vitamin K-dependent protein S795,398.2 b792,676.4 b921,083.0 a
Q3MHN5Vitamin D-binding protein7,839,167 ab7,718,252.2 b9,062,119.1 a
E1BJN3Amine oxidase83,957.7 ab78,938.2 b134,389.1 a
L8HRL7Amine oxidase (Fragment)179,222.3 ab150,927.4 b243,629.0 a
L8HTY4Amine oxidase (Fragment)2,291,499.2 b2,849,165.4 a2,660,405 ab
Q29437“Primary amine oxidase, liver isozyme”757,429.0 b1,052,047.6 a973,569.0 a
L8IJ46Serum amyloid A protein264,612.5 b484,433.4 a411,107.2 ab
L8IP29Hepatocyte growth factor activator44,423.2 b48,712.5 b59,188.6 a
L8IUV1Hepatocyte growth factor-like protein82,650.3 b73,035.3 b100,062.1 a
F1MMK9Protein AMBP3,690,957.5 ab3,457,769.0 b4,323,694.5 a
A8E196Adult beta-globin7,859,566.5 a1,420,398.8 b5,154,006.6 ab
F1MDA4Hemogen153,398.1 b145,803.7 b210,144.2 a
D4QBF4Haemoglobin beta373,158.7 a36,534.2 b132,260.7 b
P04346Haemoglobin subunit beta-A638,496.4 a159,891.8 b544,179.7 a
P09423Haemoglobin subunit alpha-I/II8,726,628.5 a1,434,904.3 b4,482,615.4 ab
Q9TSN7Haemoglobin subunit alpha-11,123,791.6 a193,289.1 b878,525.5 ab
Q9TSN8Haemoglobin subunit alpha-27,920,238.3 a1,293,871.4 b5,010,340.8 a
L8HVY9Hemopexin17,375,065.6 ab17,231,204.0 b22,307,675.4 a
G9DAR3Lactoferrin44,437,656.0 b51,004,339.7 b62,055,141.0 a
L8HWR0Serotransferrin78,140,829.8 b90,942,537.7 ab104,291,760.7 a
L8IA26Plasminogen (Fragment)2,852,684.3 ab2,415,660.0 b3,391,240.3 a
Q2KJ63Plasma kallikrein472,927.9 b461,005.8 b609,854.1 a
F1MSZ6Antithrombin-III3,855,682.9 a3,194,585.3 ab2,450,037.3 b
L8I612Coagulation factor V79,479.8 b97,967.3 a93,141.4 ab
L8IH10Coagulation factor IX402,115.3 b477,317.8 a469,924.1 a
L8IA55Apolipoprotein C-IV498,024.1 ab644,042.3 a361,942.8 b
L8I3W2Apolipoprotein F (Fragment)160,853.6 ab238,038.9 a105,477.5 b
F1MS32Apolipoprotein D845,238.8 b877,878.2 b1,551,254.0 a
Q58DL9Phospholipid transfer protein60,817.3 ab71,999.2 a53,606.6 b
L8IXW5Proactivator polypeptide10,898.0 b36,197.7 a20,660.7ab
F1MNM2Phosphatidylinositol-glycan-specific phospholipase D46,791.9 ab59,825.0 a44,146.0 b
Data are the MS2 peak area of proteins; ANOVA statistical test was used to acquire distinct proteins; LA, buffalo at low altitude; MA, buffalo at medium altitude; HA, buffalo at high altitude; Row values with different lowercase superscripts a, b are significantly different at p < 0.05.
Table 2. GO enrichments of the differentially abundant proteins.
GO_IDGene Ontology TermsProtein IDp-Value
LA vs.MA
0005344Oxygen carrier activityA8E196, D4QBF4, P04346, P09423, Q9TSN7, Q9TSN83.25 × 10−7
0019825Oxygen binding
0140104Molecular carrier activity9.39 × 10−7
0020037Heme binding2.78 × 10−5
0046906Tetrapyrrole binding6.87 × 10−5
0005833Haemoglobin complex3.25 × 10−7
0005215Transporter activity0.003
0005506Iron ion bindingP09423, Q9TSN7, Q9TSN80.038
0042612MHC class I protein complexQ3YJI80.046
0042611MHC protein complex
MA vs. HA
0019825Oxygen bindingA8E196, D4QBF4, P04346, P09423, Q9TSN7, Q9TSN86.38 × 10−9
0005344Oxygen carrier activity
0140104Molecular carrier activity2.76 × 10−8
0020037Heme binding2.15 × 10−6
0046906Tetrapyrrole binding6.62 × 10−6
0005215Transporter activity0.005
0005833Haemoglobin complex6.38 × 10−9
0005506Iron ion bindingP09423, Q9TSN7, Q9TSN80.044
LA vs. HA
0032682Negative regulation of chemokine productionF1MS320.038
0032642Regulation of chemokine production
0071637Regulation of monocyte chemotactic protein-1 production
0032602Chemokine production
0071605Monocyte chemotactic protein-1 production
0002686Negative regulation of leukocyte migration
2000402Negative regulation of lymphocyte migration
2000405Negative regulation of T cell migration
0034439Lipoprotein lipid oxidation
0060588Negative regulation of lipoprotein lipid oxidation
0060587Regulation of lipoprotein lipid oxidation
0006629Lipid metabolic processL8IXW5, A6QLW1, F1MS320.036
0033554Cellular response to stressA6QLW1, A2VE030.042
0003796Lysozyme activityA0A0C5ADR00.038
2000266Regulation of blood coagulationF1MSZ6
0019787Ubiquitin-like protein transferase activityA2VE030.038
0061659Ubiquitin-like protein ligase activity
0090085Regulation of protein deubiquitination
LA, buffalo at low altitude; MA, buffalo at medium altitude; HA, buffalo at high altitude.
Table 3. Quantification results of DIA and PRM in buffalo serum proteins.
DIA Results PRM Results
Protein IDProtein NameLAMAHALAMAHA
D2U6V0Alpha-1 acid glycoprotein6,132,936.6 a4,486,339.8 a3,510,769.9 b0.01275 a0.00619 b0.00515 b
F1MSZ6Antithrombin-III3,855,682.9 a3,194,585.3 a2,450,037.3 b0.072930.113030.08698
E1ACW2Lipoprotein lipase172,129.6 ab271,667.7 a79,035.1 b0.1019 a0.03868 b0.08046 a
B7VGH4Beta-casein310,429.6 a113,776.7 b147,863.8 b7.50464 a4.04234 b6.80145 a
L8IHQ3Apolipoprotein C-III (Fragment)10,570,906.6 a14,212,911.3 a8,912,108.0 b0.07345 a0.04655 b0.05991 ab
A0A1L6BP00Kappa-casein24,079.1 b50,215.8 a19,399.3 b9.73609 a5.85045 b7.12996 ab
DIA results are the MS2 peak area of proteins, and PRM results are the peak area of target peptide segments after internal standard correction; Row values with different lowercase superscripts a, b are significantly different at p < 0.05.
Publisher’s Note: MDPI stays neutral with regard to jurisdictional claims in published maps and institutional affiliations.

