Article

Enhancing the Production of the Phenolic Extracts of Asparagus Using an Advanced Green Process

by
Lucía López-Salas
1,
Isabel Borrás-Linares
2,*,
Rosa Quirantes-Piné
3,
Tatiana Emanuelli
4,
Antonio Segura-Carretero
2 and
Jesús Lozano-Sánchez
1
1
Department of Food Science and Nutrition, University of Granada, Campus Universitario s/n, 18071 Granada, Spain
2
Department of Analytical Chemistry, Faculty of Sciences, Avda Fuentenueva s/n, University of Granada, 18071 Granada, Spain
3
Research and Development Functional Food Centre (CIDAF), Health Science Technological Park, Avenida del Conocimiento 37, EdificioBioRegión, 18016 Granada, Spain
4
Department of Food Technology and Science, Center of Rural Sciences, Federal University of Santa Maria, Camobi, Santa Maria 97105-900, Brazil
*
Author to whom correspondence should be addressed.
Metabolites 2022, 12(10), 951; https://doi.org/10.3390/metabo12100951
Submission received: 27 July 2022 / Revised: 25 September 2022 / Accepted: 4 October 2022 / Published: 6 October 2022
(This article belongs to the Special Issue Advances in Metabolic Studies in Plant Extraction)

Abstract

:
Asparagus officinalis L. is a common vegetable widely consumed due to its high consumer acceptance. In addition to its flavor, green asparagus contains a high amount of bioactive compounds with health-promoting effects. In this sense, the growing concern of the public health system to promote a diet with a higher consumption of vegetables makes research on phytochemicals from this food of interest. In order to study the content of bioactive compounds from plant matrices, the combination of advanced extraction and analytical techniques within the context of green chemistry is an indispensable working model in today’s research. In the present experimental work, the composition of the phytochemicals of green asparagus from the Protected Geographical Indication (PGI) located in Huétor Tájar, Granada (Spain), was evaluated by environmentally friendly extraction techniques. In order to carry out this work, the recovery of bioactive compounds was evaluated by pressurized liquid extraction (PLE) using GRAS (Generally Recognized As Safe) solvents (mixtures of water and ethanol). The extraction was optimized using a Response Surface Methodology (RSM) based on a 24 factorial Central Composite Design (CCD). The experimental model was followed by high-performance liquid chromatography coupled to electrospray ionization time-of-flight mass spectrometry (HPLC–ESI-TOF-MS) analytical methodology for a comprehensive characterization. The optimized methodology was compared with conventional solid–liquid extraction protocols using ethanol and water. The results highlighted the potential of advanced PLE techniques compared to conventional systems for the recovery of green asparagus phytochemicals. Moreover, the analytical characterization allowed the identification and quantitation of major phenolic compounds belonging to phenolic acids and flavonoids families. Therefore, an easy, fast, and novel methodology to optimize the extraction of bioactive compounds from green asparagus has been optimized, using Green and GRAS methodology, which enables a better understanding of the bioactive composition of this widely consumed food.

1. Introduction

Epidemiological studies show a relationship between the consumption of vegetables and the reduction of chronic diseases, pointing out that phytochemicals present in vegetables are the components responsible for this protective effect [1]. These bioactive properties have been partly related to high antioxidant activity, and the main compounds responsible for this function are polyphenols [2,3]. Therefore, in the current society, where pathologies associated with an unhealthy diet are becoming a global concern, the study of the presence of bioactive compounds in foods, and concretely their phenolic composition, is interesting due to their beneficial effects.
For this purpose, in recent years the scientific community has developed novel research lines within a green chemical model regarding extraction methodologies in order to obtain bioactive-enriched products of interest from different organic matrices, i.e., supercritical fluids, microwave-assisted, ultrasound-assisted or pressurized fluid extraction [4,5,6,7]. Among these advanced technologies, extraction using pressurized fluids (PLE) is a very useful technique in the case of food samples, facilitating and improving the extraction of polar compounds from plant matrices. The most important advantages of this novel technique include high yields, reduced extraction time, low solvent consumption, and the use of cheap and environmentally friendly solvents, such as water and ethanol. All of these advantages explain why many authors have applied PLE as the extraction technique in their research. Woloszyn et al., applied PLE to obtain antioxidant extracts from Mentha pulegium, Equisetum giganteum, and Sida cordifolia, for evaluating the yield, total phenolic content (TPC), and flavonoid content [8]. In the same way, Ho et al., optimized the PLE methodology for TPC, gallic acid, and p-hydroxybenzoic acid (PHBA) from Pseuderanthemum palatiferum (Nees) Radlk. leaves using response surface methodology [9]. Furthermore, Dobroslavić et al. conducted research to determine optimal conditions for the PLE of laurel leaf polyphenols, and the extract obtained under optimal PLE conditions showed flavonols as the most abundant compounds [10]. Katsinas et al. carried out PLE of supercritical defatted olive pomace [11]. In this study, the authors were able to increase the extraction of phenolic compounds such as decarboxymethyl oleuropein aglycone, hydroxytyrosol, and tyrosol compared to conventional extraction methods. Moreover, Barrales et al. recovered phenolic compounds from citrus by-products using pressurized liquids, and the results showed nine flavonoids, with three that were glycosylated and two hydroxybenzoic acids [12]. Those previous results pointed out the potential of PLE to recover phenolic compounds from vegetable food matrices and supports its choice for the present study.
The Asparagus officinalis L. variety from the Huétor Tajar region (Granada, Spain) was registered under Protected Geographical Indication (PGI) through the European Union Regulation [13]. This asparagus were obtained from native varieties selected in the area since the beginning of the last century. This vegetable belongs to the Asparagaceae family, being commonly consumed around the world due to its high nutritional value and high mineral content, vitamin, amino acid, and dietary fiber contents [14]. In addition to these well-known nutritional properties, it can also help to prevent numerous pathologies such as cancer, cardiovascular or inflammatory diseases [15]. Concretely, asparagus sprouts are known to contain large amounts of rutin, a flavonoid with remarkable anti-inflammatory, anti-tumor, antibacterial, and antiviral activities [16,17]. Therefore, a better understanding of the bioactive composition and peculiarities of this PGI asparagus variety, which is exported and consumed in numerous countries, especially those of the European Union, including northern countries, will help to promote its consumption among this population due to its potentially beneficial bioactive content.
In this scenario, PLE green technology could provide a new standpoint to study the bioactive composition of this widely consumed food from the Huétor Tajar region. Therefore, the present work was focused on the study of the phenolic compounds in green asparagus, optimizing the PLE methodology and comparing it with conventional solid–liquid extraction. The obtained extracts were characterized by high-performance liquid chromatography coupled to electrospray ionization time-of-flight mass spectrometry (ES) for a comprehensive characterization of its bioactive chemical profile.

2. Materials and Methods

2.1. Plant Material and Sample Treatment

2.1.1. Plant Material

Plant material used in this study consisted of samples of green asparagus from the Andalusian cooperative Centro Sur S.C.A (Huétor-Tájar, Granada, Spain). Samples of the Asparagus officinalis L. variety were collected in three geographical regions within the Huétor-Tájar PGI area (Huétor Tájar, Íllora, and Loja locations) during the collection campaign (April 2021). To carry out the experiments, a homogeneous sample of the three geographical areas was obtained and refrigerated until processing.

2.1.2. Freeze-Drying and Grinding

Prior to the lyophilization process, asparagus samples were cut into pieces of an approximate size of 2 cm. Then, they were lyophilized using a SP Scientific Virtis AdVantage 2.0 BenchTop Freeze Dryer lyophilizer, with an ice condensation capacity of 4 L in 24-h cycles. The total freeze-drying process was 92.5 h.
Once the samples were lyophilized, they were subjected to grinding to reduce the particle size and increase the contact surface with the solvent, improving the efficiency of the extraction process. Simultaneous grinding and sieving of the samples were carried out in a ZM 200 ultracentrifugal mill (Retsch, Spain). The grinding was carried out using a 1 mm sieve to obtain a sample with an optimal particle size for the selected extraction technique, as 80% of the total ground sample reached a size less than half of the mesh opening of the used annular sieve. The ground and sieved samples were stored at room temperature and were protected from light and humidity until the extraction procedure.

2.2. Reagents

All reagents used during the development of this work were of analytical reagent grade. For extraction processes, water used as a solvent was purified by a Milli-Q system from Millipore (Bedford, MA, USA), and ethanol was purchased from VWR Chemicals (Radnor, PA, USA). Sand and cellulose filters were obtained from Fisher Chemicals (Waltham, MA, USA). Acetic acid and acetonitrile for the HPLC analysis were purchased from Sigma–Aldrich (Steinheim, Germany) and Fisher Chemicals (Waltham, MA, USA), respectively. The standards for the calibration curves (chlorogenic acid, quinic acid, ferulic acid, quercetin-3-rutinoside, and quercetin-3-glucoside) were acquired from Sigma Aldrich (Steinheim, Germany).

2.3. Phenolic Compound Extraction

The extraction of phenolic compounds was carried out using two different methodologies: (a) Conventional Solid–liquid extraction (SLE); and (b) Pressurized fluid extraction (PLE).

2.3.1. Conventional Solid–Liquid Extraction (SLE)

In order to carry out the SLE extraction, 1 g of lyophilized sample was mixed with 15 mL of the solvent mixture (ethanol:water, 70:30, v/v). Samples were shaken in darkness in an orbital shaker for a total time of 30 min at a shaking speed of 350 min−1. After that, the samples were sonicated for 15 min under refrigerated conditions at atmospheric pressure and then centrifuged at 12,500 rpm for 15 min at 4 °C. The supernatants were collected and filtered through 0.2 µm regenerated cellulose filters. Solvents were evaporated at room temperature under vacuum on a SpeedVac Savant vacuum concentrator (Thermo Scientific, Waltham, MA, USA). The extraction process was carried out in triplicate to ensure the reproducibility of the process.

2.3.2. Pressurized Liquid Extraction (PLE)

The optimization of the extraction process using pressurized fluids was carried out through a response surface experimental design using the Statgraphics Centurion XV software, version 15.1.02. The applied model was a 24 factorial composite central design. The four factors established as independent variables were the extraction temperature (in a range of 60–160 °C), the extraction time (10–30 min), percentage of ethanol in the extraction solvent (20–80%), and the sand–sample ratio (2–5, w/w). For each variable, two levels were considered, maximum and minimum. Additional experiments, called star or axial points, were located below and above these maximum and minimum values, allowing the determination of the response surface curvature for each of the factors. The generated experimental design consisted of a total of 25 experiments that were performed in a randomized order (Table S1). The response variables were the extraction yield and the phenolic composition of the extracts determined by HPLC–ESI-TOF-MS.
The equipment used for PLE was an ASE ™ 350 from Dionex (Sunnyvale, CA, USA). Solvents were sonicated prior to extraction to remove dissolved air to prevent any possible degradation of compounds through oxidation reactions. In all experiments, the extraction was performed in static mode at 1500 psi, with a variable extraction time and temperature indicated in Table S1. To carry out the extraction process, a 34 mL extraction cell was prepared using a sandwich configuration: 15× g of sand + 1 g of sample plus the corresponding amount of sand according to the sand:sample ratio (w/w) of each experimental point (Table S1) +20 g of sand on the top of the cell. Cellulose filters were placed in both the upper and lower part of the cell to prevent possible blockage of the system. Once the extracts were obtained, the same procedure was applied as described in the previous section for conventional solid–liquid extracts consisting of centrifugation and evaporation steps.

2.4. HPLC–ESI-TOF-MS Analysis

The analyses of the SLE and PLE extracts were carried out with a RRLC 1200 series liquid chromatograph (Agilent Technologies, Palo Alto, CA, USA), equipped with a vacuum degasser, a binary pump, an autosampler, a thermostatted column compartment, and a diode array detector (DAD).
The analytical column used for separation was a Zorbax Eclipse Plus C18 1.8 μm, 150 × 4.6 mm, (Agilent Technologies, Palo Alto, CA, USA). The used mobile phase was water with 0.5% acetic acid as eluent A and acetonitrile as eluent B. The flow rate was set at 0.5 mL min−1, the injection volume was 10 µL, and the column temperature was kept at 25 °C. The total analysis run was 50 min, using the following multi-step linear gradient: 0 min, 5% B; 40 min 100% B; 45 min 5% B; and finally, a conditioning cycle of 5 min with the initial conditions (5% B) before the next injection to equilibrate the system.
The HPLC system was coupled to a Bruker Daltonik GmbH (Bremen, Germany) microTOF time-of-flight mass spectrometer equipped with an ESI interface (G1607 model from Agilent Technologies, Palo Alto, CA, USA). To achieve a stable spray at the interface, the effluent from the HPLC column was reduced using a “T” type splitter before entering the mass spectrometer (1:3 division ratio). Thus, the flow that reached the TOF-MS detector was 125 μL min−1.
The analyses were carried out under negative polarity considering a mass range of 50–1000 m/z. The values of the source parameters were as follows: capillary voltage of +4.5 kV; drying gas temperature, 190 °C; drying gas flow, 9 L min−1; and nebulizer gas pressure, 2.0 bar. The values for the transfer parameters were as follows: capillary output voltage, −150 V; skimmer voltage 1, −50 V; hexapole voltage 1, −23 V; hexapole radio frequency, 100 Vpp; and skimmer 2 voltage, −22.5 V.
The instrument was externally calibrated with a Cole Palmer 74,900–00-05 syringe pump (Vernon Hills, IL, USA) that was connected directly to the interface and contained a 10 mM sodium acetate solution. The mixture was injected at the beginning of each analysis, and all spectra were calibrated prior to the identification of compounds. The exact mass data of the molecular ions were processed through DataAnalysis 4.0 software (Bruker Daltonics, Bremen, Germany), which provided a list of possible elemental formulas using the Generate-Molecular Formula Editor.
To carry out the identification and quantification of the detected analytes in all of the asparagus extracts (SLE and PLE), the samples were prepared at a concentration of 10 mg/L using the corresponding hydro-alcoholic mixture used for their extraction as a solvent. Triplicate injections were made of each extraction condition. To carry out a quantitative analysis, calibration curves were prepared from seven commercially available standards, some of them present in the extracts and others with similar structures to other identified compounds: chlorogenic acid, quinic acid, ferulic acid, quercetin-3-rutinoside, and quercetin-3-glucoside.
Stock solutions of each of these standards were prepared at a concentration of 1000 mg/L. Table S2 summarizes the calibration curves and parameters. All standards showed good linearity between the different concentration ranges. The concentration of phenolic compounds was calculated using the individual area in the chromatogram of each compound with interpolation using the corresponding calibration curve of the commercial standard.

3. Results

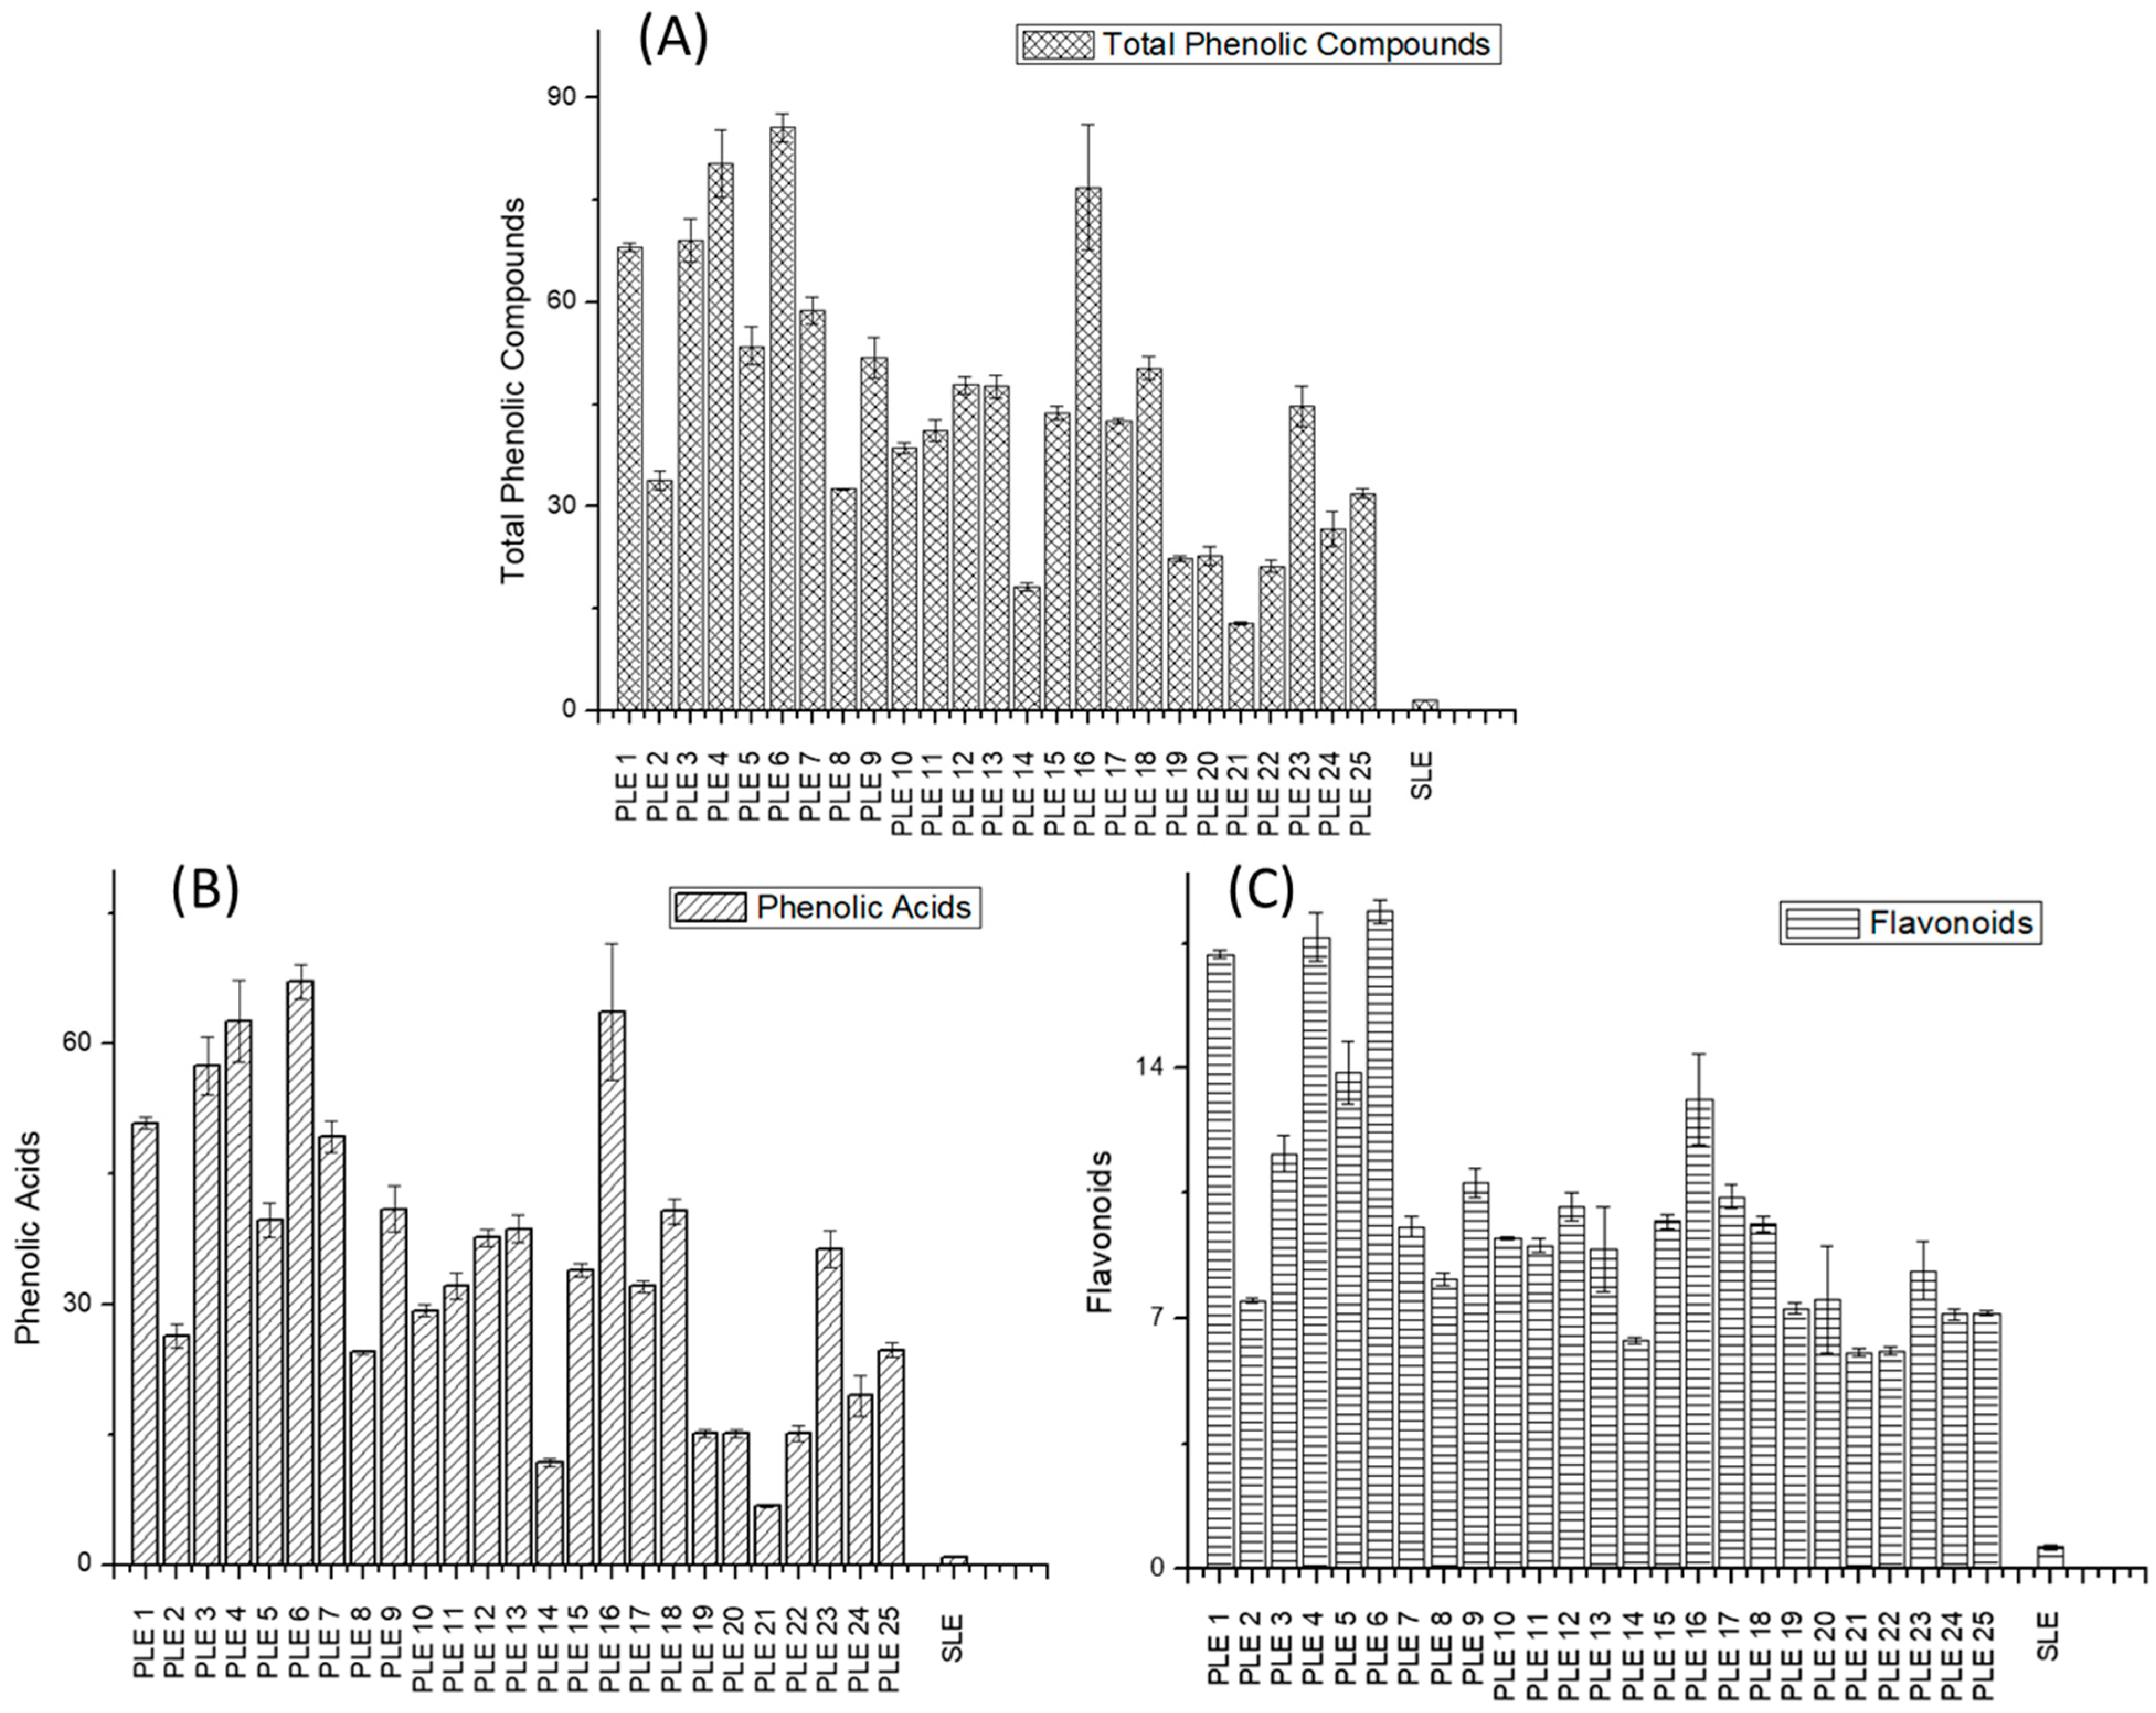
3.1. Characterization and Quantification of Phenolic Compounds in PLE and SLE Extracts by HPLC–ESI-TOF-MS

Representative base peak chromatograms of the analyzed extracts are shown in Figure 1. The detected peaks are numbered according to their retention time.
Once the analysis of the samples was carried out, the detected polar compounds were tentatively identified by comparing their retention time and mass spectra with the available commercial standards or by means of the information reported in databases and bibliography. A total of 20 compounds were identified in the samples, with the majority being phenolic acids and flavonoids, whereas four of them remain unknown despite efforts for their identification (UK1-4).
The observed peaks in the chromatogram of Figure 1 correspond to those putatively identified in Table 1, in which the tentatively identified compounds are proposed with their retention time, experimental and theoretical m/z, error, mSigma value, and molecular formula.
As can be observed in Figure 1, the intensity of the peaks in the SLE extract (intens. ×105) was much lower than that in the PLE (intens. ×106). Likewise, it can be seen that many of the compounds detected in the PLE could not be detected in the SLE sample, highlighting the advantages of pressurized fluid extraction compared to conventional extraction in order to recover polyphenols. The HPLC–ESI-TOF-MS analysis of the SLE extracts pointed out that all compounds detected in the SLE extraction were also identified in the PLE extracts.
Most of the detected compounds have been previously described in asparagus [3,18,19,20,21]. With regard to phenolic acids, seven compounds were characterized. Peak 2, with molecular formula C16H18O9, was identified as chlorogenic acid. Peak 3, with a retention time of 10.5 min, was proposed as coumaroylquinic acid. This compound was not able to be extracted by all PLE conditions, being not detected in PLE 20 (160 °C, 20% ethanol, 30 min and 2 S–S) with SLE extraction. Peak 4 yielded a deprotonated molecule at m/z 367 and was characterized as feruloylquinic acid. Peak 6, with a retention time of 11.5 min and with m/z 355, was identified as feruloyl hexose. This peak was detected under all extraction conditions except for PLE 20 (160 °C, 20% ethanol, 30 min and 2 S–S), PLE 21 (160 °C, 20% ethanol, 10 min and 2 S–S), and PLE 22 (160 °C, 20% ethanol, 10 min and 5 S–S). Peak 16, with m/z 383 and molecular formula C21H20O7, was described as dicoumaroylglycerol; whereas peak 17, with a retention time of 21.6 min, was characterized as coumaroylferuloyl glycerol. Finally, peak 18, with a retention time of 21.9 min and m/z 443 was proposed to be diferuloyl glycerol.
Furthermore, five compounds were tentatively identified as flavonoids. Peak 9, with m/z 771, was characterized as quercetin glucosyl rutinoside. Peak 10, eluted at 13.2 min and m/z 609, putatively corresponded to rutin. Peak 11, with molecular formula C21H20O12, was proposed as quercetin glucoside; while peak 12, eluting at 14.1 min and with the molecular formula C27H30O15, was identified as kaempferol rutinoside. Peak 13, with a retention time of 14.2 min, corresponded to isorhamnetin rutinoside.
Other non-phenolic compounds identified in extracts were peaks 1, 15, 19, and 20. Peak 1, with a retention time of 3.00 min and m/z 191, was identified as quinic acid. Furthermore, peak 15 was identified as trihydroxy octadecaenoic acid (oxylipin) and finally, peaks 19 and 20 were identified as linolenic and linoleic acids (fatty acids), respectively.
Regarding the quantification of these phytochemicals, Figure 2 depicted the total phenolic, total phenolic acid, and total flavonoid contents under each PLE and SLE conditions. The concentrations were calculated as the sum of the individual phenolic compounds (Table S4) and expressed in mg of compound per gram of extract as the mean ± standard deviation value (X ± SD). Differences between the two extraction techniques in terms of the recovery capacity of phenolic compounds were very marked, as the SLE extraction recovered fewer compounds in all cases. For example, feruloylquinic acid, feruloyl hexose, and rutin were the most abundant compounds in all PLE extracts. However, the extraction of these compounds by conventional extraction was very low (up to 10 times lower). A similar behavior could be observed in the other compounds when comparing the two extraction techniques. Coumaroylquinic acid was not detected in SLE extracts while it was extracted under practically all PLE conditions.
In regards to the total phenolic compounds of the Asparagus officinalis L. PLE extracts, the PLE 6 (60 °C, 80% ethanol, 10 min and 5 S–S), PLE 4 (60 °C, 80% ethanol, 30 min and 5 S–S), and PLE 16 (110 °C, 94.48% ethanol, 20 min and 3.50 S–S) conditions showed the highest concentration. According to the present results, a high percentage of ethanol in aqueous mixtures, both long and short extraction times, as well as a moderate to high extraction temperature and sand–sample ratio, enhanced the extraction of these compounds. In general, extraction conditions with the most extreme temperatures above 160 °C (PLE 18–25) were able to recover a lower content of phenolic compounds, except for the PLE 18 and PLE 23 conditions. This decrease in the concentration of phenolic compounds may be due to the degradation of these types of compounds as a consequence of the high extraction temperatures.
The analysis of the total phenolic acid composition indicated that the highest recovery was obtained under the conditions PLE 6 (60 °C, 80% ethanol, 10 min and 5 S–S), PLE 16 (110 °C, 94.48% ethanol, 20 min and 3.50 S–S), and PLE 4 (60 °C, 80% ethanol, 30 min and 5 S–S). These conditions are in agreement with those that provided the highest concentration of total phenolic compounds, as indicated above.
On the other hand, the analysis of the total flavonoid content showed that PLE 6 (60 °C, 80% ethanol, 10 min and 5 S–S), PLE 4 (60 °C, 80% ethanol, 30 min and 5 S–S), and PLE 1 (35.87 °C, 50% ethanol, 20 min and 3.50 S–S) were the best conditions for this family of compounds. The best two conditions considering the extraction of flavonoids were the same as those for the total phenolic compounds. However, the third best condition with the highest extraction of these compounds was PLE 1, which is not considered among the top three for total phenolic compounds or phenolic acids.
From the quantitative composition point of view, as mentioned before, it is important to highlight that when comparing this extraction methodology with the values reported in Table S4 for the PLE extracts, all of the phenolic compounds were recovered in a lower concentration. The content of total phenolic compounds of the SLE was 1.52 ± 0.04 mg compounds/g extract, a much lower value than that obtained for all PLE extracts. The same phenomenon could be observed for the values obtained for phenolic acid (0.91 ± 0.02 mg compounds/g extract), and flavonoid (0.61 ± 0.06 mg compounds/g extract) families (Table S4). Those results also pointed out the potential for the recovery of bioactive compounds from green asparagus compared to conventional procedures.

3.2. PLE Optimization of Green Asparagus

PLE methodology was optimized following the procedure described in Section 2.3.2. Table 2 summarizes the statistical analysis of the proposed model including linear, quadratic, and interactions effects of independent variables (X1: Temperature, X2: %EtOH, X3: Extraction time and X4: S–S, sand–sample ratio) on the variable responses: extraction yield (Y1), total phenolic compounds (Y2), phenolic acids (Y3), and flavonoids (Y4).
The extraction yield was calculated as the weight of collected asparagus dry extract per lyophilized asparagus material used in the extraction procedure (w/w, in grams).
The lack-of-fit test verified the fitting quality of the applied model, showing that the model was fitted for all response variables, as the value of this test was not significant (p-value higher than 0.05). The R2 values for each variable indicated that the adjusted model explained 71.9%, 91.9%, 90.9%, and 89.1% of the variability in yield, total polyphenols, total phenolic acids, and total flavonoids, respectively. As the model was satisfactory, it was used to generate the regression equations and for the creation of surface response graphs (Figure 3).
Significant effects were showed by those independent variables or interactions, which had a p-value equal to or less than 0.05. Therefore, for yield, the linear variables with a significant effect were extraction temperature and time, while the significant quadratic variables were ethanol–ethanol, the ethanol–sand sample, the time–sand sample, and the sand sample–sand sample.
Taking into consideration the phenolic composition, for all chemical families, temperature and ethanol percentage were significant. With regard to the other independent variables, the analysis of the results pointed out that only the quadratic effect of the ethanol–sand sample ratio had statistical significance for flavonoid recovery. The fitted equations of the model for each response variable are described by Equations (1)–(4).
Y 1 = 89.979   + 0.195133   X 1   0.923551   X 2   0.684708   X 3   28.849   X 4   +   0.00430331   X 2     2 + 0.126381   X 2 X 4 + 0.305976   X 3 X 4 +   2.23455   X 4     2
Y 2 = 47.0122 0.267797   X 1   + 0.461685   X 2   + 0.0848633     X 3   + 0.737174   X 4  
Y 3 = 34.9672 0.217163   X 1   + 0.402736   X 2   + 0.103295     X 3   + 0.471984   X 4  
  Y 4 = 18.6407   0.0529933   X 1   0.0710436   X 2   0.028264     X 3   1.46456   X 4   +   0.0361349     X 2 X 4
Equations of the fitted model: (a) extraction yield (Y1); (b) content of total phenolic compounds (Y2); (c) content of phenolic acids (Y3); and (d) content of flavonoids (Y4).
By replacing the values of the independent variables in the equation, it was possible to estimate the theoretical value for each response variable. Table 3 shows the comparison between experimental results and predicted values for PLE. A low value (<10%) of the coefficient of variance (CV) indicates a good reproducibility of the investigated systems, whereas CV values between 11 and 20% indicates an acceptable variation [22]. Therefore, most of the obtained CV values showed good or acceptable reproducibility, and only a few of them exceeded the 20% threshold.
The optimization of extraction conditions to maximize the response variables was evaluated. Table 4 shows the theoretical values of the independent variables that maximized the response variables provided by the model. The optimum conditions of PLE yield from Asparagus officinalis L. were found at 184 °C, 94.5% ethanol, 35 min and a sand–sample ratio of 5.7, with a yield of 89.5%.
In all cases, optimum PLE conditions for recovering phenolic compounds were about 36 °C, between 94.1 and 94.5% ethanol, and a sand–sample ratio between 5.2 and 5.7. Only in the case of the extraction time could a clear difference be observed with flavonoids (5.8 min) by comparing this variable with both phenolic acids and total phenolic compounds (approximately 30 min). The optimum temperature for phenolic compound extraction was much lower than the one proposed to optimize the extraction yield, which can be explained by the thermolabile behavior of phenolic compounds and the possible co-extraction of other kind of compounds at higher temperatures that increase the extraction yield [23]. The optimum values for the rest of the variables (% ethanol, time, and sand–sample ratio) were similar for both response variables, extraction yield, and the recovery of phenolic compounds.
Finally, the theoretical values that jointly maximized the response variables of yield and total phenolic compounds were 67.7 °C, 93% ethanol, 34.8 min, and a sand–sample ratio of 5.7. The optimum theoretical yield and total phenolic compounds were 66.4% and 78.94 mg/g, respectively. These values of the independent variables were more or less similar to those applied under the PLE 4 condition (60 °C, 80% ethanol, 30 min, and 5 S–S), which resulted in a yield of 50.25% and 80 mg/g of phenolic compounds.
By comparing the multiple response values with individual optimum values for yield and total phenolic compounds, it was found that temperature was the most critical parameter. To achieve a balance and maximize both responses, it would be necessary to apply an intermediate temperature between the optimum of each response variable. Therefore, a high yield would be obtained without destroying thermolabile compounds, such as the target compounds. The rest of the multiple response values (% ethanol, time, and S–S ratio) were very similar to the optimum value for both yield and total phenolic compounds.
Despite that the well-known main crucial factor that affects the extraction of phenolic compounds is the matrix that contains them, it should be highlighted that the present results for the PLE optimization of total phenolic compound recovery were in agreement with those obtained for other vegetable matrices. Indeed, the optimum temperature and ethanol percentage for the recovery of phenolic compounds from buriti (Mauritia flexuosa L.) shell were 71.21 °C and 92.43% of ethanol in aqueous mixture [24]. Although the optimum temperature for phenolic compound extraction from this matrix was double that compared to asparagus, both were within the range considered to be low extraction temperatures (below 100 °C). Furthermore, 71.21 °C is similar to 67.6 °C, which was proposed to maximize the multiple responses in asparagus samples. Concerning ethanol percentages, in both cases, the value was very high. It is important to note that the experimental temperature and ethanol percentages evaluated by these authors ranged from 28.79 °C to 71.21 °C and from 7.57% to 92.43%, respectively. However, neither the extraction time nor the sample–sand ratios were taken into account. In addition, another study on the PLE of phenolic compounds in Passiflora leaves showed similar results, and the optimum extraction conditions were 80 °C and 64% ethanol [25]. The temperatures and hydroalcoholic mixtures considered in this study were 40, 60, and 80 °C and 40, 70, and 50% ethanol. The obtained results were also compared to other studies that used different extraction conditions with no optimization step. For example, the recovery of phenolic compounds from citrus peel using PLE was evaluated through absolute ethanol and hydroalcoholic mixtures (75% and 50% ethanol) with PLE solvent at temperatures of 45, 55, and 65 °C [12]. The authors concluded that the best extraction conditions were 65 °C and 75%.
On the other hand, the obtained results for the PLE of green asparagus were compared to those obtained for conventional extraction. Figure 4 and Table S3 show the extraction yield obtained by PLE and SLE. This variable reached an equal or higher value than 50% for PLE 19 (160 °C, 20% ethanol, 30 min, and 5 S–S), PLE 20 (160 °C, 20% ethanol, 30 min, and 2 S–S), PLE 21 (160 °C, 20% ethanol, 10 min, and 2 S–S), and PLE 24 (160 °C, 80% ethanol, 10 min, and 2 S–S). Among these, condition PLE 19 was the one that showed the highest yield (70.01%). The extraction yield for the SLE condition was 30% (Figure 4, Table S3). This value was two times lower than the best condition of PLE 19.
Under the same behavior, the obtained values pointed out that these results were in agreement with those described for the PLE technique in the case of other vegetables matrices. For example, extraction yields were similar to those obtained for the PLE of Lippia citriodora leaves and passion fruit rinds [26,27]. According to the obtained results, a higher extraction temperature enhances the extraction of these compounds. This fact could be explained by the increase of solvent diffusivity with increasing temperature, enhancing the extraction of several compounds from plant matrices [28]. However, it was not possible to establish a relationship between the percentage of ethanol, extraction time, and S–S with the extraction yield. These results highlighted the potential of PLE for the recovery of green asparagus phytochemicals, which is in concordance with the results reported by other authors.

4. Conclusions

In view of the obtained results, the potential of PLE as a procedure to obtain Asparagus officinalis L. phenolic compound-enriched extracts from the Granadian PGI was demonstrated compared to conventional SLE. The proposed surface response model for PLE optimization showed the effect of the independent variables (temperature, time, percentage of ethanol, and S–S ratio) on the response variables (yield, total phenolic compounds, total phenolic acids, and total flavonoid content). Statistical analysis of the results confirmed that the proposed model was fitted, being appropriate for explaining the obtained results. Finally, the estimated optimum theoretical values of independent variables to maximize the response variables were calculated based on optimum extraction conditions. The chemical characterization of these extracts allowed the detection of 20 compounds, mainly belonging to phenolic acid and flavonoid families. The extraction yield found for the SLE was two times lower than the best PLE experimental condition, and a much lower value of phenolic compounds was reported for SLE than that obtained for all PLE extracts (up to 10 times lower in some comparisons). Coumaroylquinic acid was the only phenolic compound not recovered by conventional extraction.
It can be concluded that the optimized PLE for green asparagus is a powerful methodology for the recovery of the wide range of phytochemicals present in this Huétor Tájar PGI asparagus.

Supplementary Materials

The following supporting information can be downloaded at www.mdpi.com/article/10.3390/metabo12100951/s1, Table S1: Experimental conditions of pressurized fluid extraction. Table S2: Calibration parameters. Table S3: Extraction yield of different PLE experiments (1–25) and SLE extraction. Table S4: Total and individual contents of phenolic compounds from the PLE and SLE extracts. Values are expressed as X ± SD in mg of compound/g extract.

Author Contributions

Conceptualization, J.L.-S., I.B.-L. and R.Q.-P.; methodology, J.L.-S. and I.B.-L.; software, J.L.-S. and L.L.-S.; validation, J.L.-S. and L.L.-S.; formal analysis, L.L.-S.; investigation, L.L.-S., I.B.-L., J.L.-S. and R.Q.-P.; resources, J.L.-S. and A.S.-C.; data curation, L.L.-S., I.B.-L. and T.E.; writing—original draft preparation, L.L.-S.; writing—review and editing, J.L.-S., I.B.-L., R.Q.-P., T.E. and A.S.-C.; visualization, J.L.-S., I.B.-L., R.Q.-P., T.E. and A.S.-C.; supervision, J.L.-S. and I.B.-L.; project administration, J.L.-S., I.B.-L. and A.S.-C.; funding acquisition, J.L.-S. and A.S.-C. All authors have read and agreed to the published version of the manuscript.

Funding

This research was funded by the University of Granada, grant number PPJI2017-08. The author Lopez-Salas gratefully acknowledges the Spanish Ministry of Universities for the FPU grant (FPU20/03144).

Institutional Review Board Statement

Not applicable.

Informed Consent Statement

Not applicable.

Data Availability Statement

Not applicable.

Acknowledgments

The authors thank cooperative Centro Sur S.C.A (Huétor-Tájar, Granada, Spain) for providing samples.

Conflicts of Interest

The authors declare no conflict of interest.

References

  1. Rodríguez, R.; Jaramillo, S.; Rodríguez, G.; Espejo, J.A.; Guillén, R.; Fernández-Bolaños, J.; Heredia, A.; Jiménez, A. Antioxidant activity of ethanolic extracts from several asparagus cultivars. J. Agric. Food Chem. 2005, 53, 5212–5217. [Google Scholar] [CrossRef] [PubMed]
  2. Zhang, H.; Birch, J.; Pei, J.; Mohamed Ahmed, I.A.; Yang, H.; Dias, G.; Abd El-Aty, A.M.; Bekhit, A.E.-D. Identification of Six Phytochemical Compounds from Asparagus officinalis L. Root Cultivars from New Zealand and China Using UAE-SPE-UPLC-MS/MS: Effects of Extracts on H2O2-Induced Oxidative Stress. Nutrients 2019, 11, 107. [Google Scholar] [CrossRef] [PubMed] [Green Version]
  3. Ku, Y.G.; Bae, J.H.; Namieśnik, J.; Barasxh, D.; Nemirovski, A.; Katrich, E.; Gorinstein, S. Detection of Bioactive Compounds in Organically and Conventionally Grown Asparagus Spears. Food Anal. Methods 2018, 11, 309–318. [Google Scholar] [CrossRef]
  4. Chiriac, E.R.; Chiţescu, C.L.; Geană, E.I.; Gird, C.E.; Socoteanu, R.P.; Boscencu, R. Advanced analytical approaches for the analysis of polyphenols in plants matrices—A review. Separations 2021, 8, 65. [Google Scholar] [CrossRef]
  5. Villalva, M.; Santoyo, S.; Salas-Pérez, L.; Siles-Sánchez, M.d.l.N.; Rodríguez García-Risco, M.; Fornari, T.; Reglero, G.; Jaime, L. Sustainable Extraction Techniques for Obtaining Antioxidant and Anti-Inflammatory Compounds from the Lamiaceae and Asteraceae Species. Foods 2021, 10, 2067. [Google Scholar] [CrossRef]
  6. Kwiatkowski, M.; Kravchuk, O.; Skouroumounis, G.K.; Taylor, D.K. Microwave-assisted and conventional phenolic and colour extraction from grape skins of commercial white and red cultivars at veraison and harvest. J. Clean. Prod. 2020, 275, 122671. [Google Scholar] [CrossRef]
  7. Fuentes, J.A.M.; López-Salas, L.; Borrás-Linares, I.; Navarro-Alarcón, M.; Segura-Carretero, A.; Lozano-Sánchez, J. Development of an Innovative Pressurized Liquid Extraction Procedure by Response Surface Methodology to Recover Bioactive Compounds from Carao Tree Seeds. Foods 2021, 10, 398. [Google Scholar] [CrossRef]
  8. Woloszyn, N.; Krabbe, R.D.; Fischer, B.; Bernardi, J.L.; Duarte, P.F.; Puton, B.M.S.; Cansian, R.L.; Paroul, N.; Junges, A. Use of pressurized liquid extraction technique to obtain extracts with biological and antioxidant activity from Mentha pulegium, Equisetum giganteum and Sida cordifolia. Chem. Pap. 2022, 76, 5775–5788. [Google Scholar] [CrossRef]
  9. Ho, T.C.; Kiddane, A.T.; Khan, F.; Cho, Y.J.; Park, J.S.; Lee, H.J.; Kim, G.D.; Kim, Y.M.; Chun, B.S. Pressurized liquid extraction of phenolics from Pseuderanthemum palatiferum (Nees) Radlk. leaves: Optimization, characterization, and biofunctional properties. J. Ind. Eng. Chem. 2022, 108, 418–428. [Google Scholar] [CrossRef]
  10. Dobroslavić, E.; Garofulić, I.E.; Šeparović, J.; Zorić, Z.; Pedisić, S.; Dragović-Uzelac, V. Pressurized Liquid Extraction as a Novel Technique for the Isolation of Laurus nobilis L. Leaf Polyphenols. Molecules 2022, 27, 5099. [Google Scholar] [CrossRef]
  11. Katsinas, N.; Bento da Silva, A.; Enríquez-de-Salamanca, A.; Fernández, N.; Bronze, M.R.; Rodríguez-Rojo, S. Pressurized Liquid Extraction Optimization from Supercritical Defatted Olive Pomace: A Green and Selective Phenolic Extraction Process. ACS Sustain. Chem. Eng. 2021, 9, 5590–5602. [Google Scholar] [CrossRef]
  12. Barrales, F.M.; Silveira, P.; Menezes Barbosa, P.P.M.; Roggia Ruviaro, A.; Paulino, B.N.; Pastores, G.M.; Alves Macedo, G.; Martinez, J. Recovery of phenolic compounds from citrus by-products using pressurized liquids—An application to orange peel. Food Bioprod. Process. 2018, 112, 9–21. [Google Scholar] [CrossRef]
  13. Regulation, European Commission, (EC). No. 547/2000 (2000). Supplementing the Annex to Regulation (EC) No 2400/96 on the entry of certain names in the ‘Register of protected designations of origin and protected geographical indications’ provided for in Council Regulation (EEC) No 2081/92 on the protection of geographical indications and designations of origin for agricultural products and foodstuffs. Off. J. Eur. Union 2000, L67/8, 1–4. Available online: https://op.europa.eu/en/publication-detail/-/publication/a8716468-0703-48fe-9cfc-dd09a1d44c26/language-en/format-PDF/source-search (accessed on 1 May 2022).
  14. Yu, Q.; Li, J.; Fan, L. Effect of Drying Methods on the Microstructure, Bioactivity Substances, and Antityrosinase Activity of Asparagus Stems. J. Agric. Food Chem. 2019, 67, 1537–1545. [Google Scholar] [CrossRef]
  15. Bataglion, G.A.; Da Silva, F.M.A.; Eberlin, M.N.; Koolen, H.H.F. Determination of the phenolic composition from Brazilian tropical fruits by UHPLC-MS/MS. Food Chem. 2015, 180, 280–287. [Google Scholar] [CrossRef]
  16. Park, M. Sucrose delays senescence and preserves functional compounds in Asparagus officinalis L. Biochem. Biophys. Res. Commun. 2016, 480, 241–247. [Google Scholar] [CrossRef] [Green Version]
  17. Motoki, S.; Kitazawa, H.; Maeda, T.; Suzuki, T.; Chiji, H.; Nishihara, E.; Shinohara, Y. Effects of various asparagus production methods on rutin and protodioscin contents in spears and cladophylls. Biosci. Biotechnol. Biochem. 2012, 76, 1047–1050. [Google Scholar] [CrossRef] [PubMed]
  18. Jiménez-Sánchez, C.; Lozano-Sánchez, J.; Rodríguez-Pérez, C.; Segura-Carretero, A.; Fernández-Gutiérrez, A. Comprehensive, untargeted, and qualitative RP-HPLC-ESI-QTOF/MS2 metabolite profiling of green asparagus (Asparagus officinalis). J. Food Compos. Anal. 2016, 46, 78–87. [Google Scholar] [CrossRef]
  19. Jiménez-Sánchez, C.; Pedregosa, F.; Borrás-Linares, I.; Lozano-Sánchez, J.; Segura-Carretero, A. Identification of bioactive compounds of Asparagus officinalis L.: Permutation test allows differentiation among “triguero” and hybrid green varieties. Molecules 2021, 26, 1640. [Google Scholar] [CrossRef]
  20. Solana, M.; Boschiero, I.; Dall’Acqua, S.; Bertucco, A. A comparison between supercritical fluid and pressurized liquid extraction methods for obtaining phenolic compounds from Asparagus officinalis L. J. Supercrit. Fluids 2015, 100, 201–208. [Google Scholar] [CrossRef]
  21. Chen, X.H.; Ma, L.H.; Dong, Y.W.; Song, H.; Pu, Y.; Zhou, Q.Y. Evaluation of the differences in phenolic compounds and antioxidant activities of five green asparagus (Asparagus officinalis L.) cultivars. Qual. Assur. Saf. Crop. Foods 2017, 9, 479–487. [Google Scholar] [CrossRef]
  22. Liyana-Pathirana, C.; Shahidi, F. Optimization of extraction of phenolic compounds from wheat using response surface methodology. Food Chem. 2005, 93, 47–56. [Google Scholar] [CrossRef]
  23. Figueroa, J.G.; Borrás-Linares, I.; Lozano-Sánchez, J.; Quirantes-Piné, R.; Segura-Carretero, A. Optimization of drying process and pressurized liquid extraction for recovery of bioactive compounds from avocado peel by-product. Electrophoresis 2018, 39, 1908–1916. [Google Scholar] [CrossRef] [PubMed]
  24. Rudke, A.R.; Mazzutti, S.; Andrade, K.S.; Vitali, L.; Ferreira, S.R.S. Optimization of green PLE method applied for the recovery of antioxidant compounds from buriti (Mauritia flexuosa L.) shell. Food Chem. 2019, 298, 125061. [Google Scholar] [CrossRef] [PubMed]
  25. Gomes, S.V.F.; Portugal, L.A.; dos Anjos, J.P.; de Jesus, O.N.; de Oliveira, E.J.; David, J.P.; Davida, J.M. Accelerated solvent extraction of phenolic compounds exploiting a Box-Behnken design and quantification of five flavonoids by HPLC-DAD in Passiflora species. Microchem. J. 2017, 132, 28–35. [Google Scholar] [CrossRef]
  26. Leyva-Jiménez, F.J.; Lozano-Sánchez, J.; Borrás-Linares, I.; Arráez-Román, D.; Segura-Carretero, A. Comparative study of conventional and pressurized liquid extraction for recovering bioactive compounds from Lippia citriodora leaves. Food Res. Int. 2018, 109, 213–222. [Google Scholar] [CrossRef]
  27. Viganó, J.; Brumer, I.Z.; Braga, P.A.C.; Silva, J.K.; Júnior, M.R.M.; Reyes, F.G.R.; Martínez, J. Pressurized liquids extraction as an alternative process to readily obtain bioactive compounds from passion fruit rinds. Food Bioprod. Process. 2016, 100, 382–390. [Google Scholar] [CrossRef]
  28. Herrero, M.; Castro-Puyana, M.; Mendiola, J.A.; Ibañez, E. Compressed Fluids for the Extraction of Bioactive Compounds. Trends Anal. Chem. 2013, 43, 67–83. [Google Scholar] [CrossRef]
Figure 1. Representative base peak chromatogram of the HPLC–ESI-TOF-MS analysis of phenolic extracts from asparagus: (A) PLE 6, (B) SLE.
Metabolites 12 00951 g001
Figure 2. Total content of phenolic compounds (A), phenolic acids (B), and flavonoids (C) of the PLE and SLE extracts. Values expressed in mg compounds/g extract as X ± SD.
Metabolites 12 00951 g002
Figure 3. Surface response graphs: (A) extraction yield; (B) total phenolic compounds; (C) phenolic acids; (D) flavonoids, and (E) optimization of multiple responses (yield and total phenolic compounds).
Metabolites 12 00951 g003
Figure 4. Extraction yield of different PLE experiments (1–25) and SLE extraction.
Metabolites 12 00951 g004
Table 1. Tentatively identified compounds in the analyzed asparagus extracts.
PeakRT 1 (min)m/z (Exp)m/z (Theor)Error (ppm)mSigmaMolecular FormulaProposed CompoundPLE and SLE Extracts
13191.0571191.0561−4.37.9C7H12O6Quinic acidPLE *, SLE
29.2353.0883353.0878−1.422.1C16H18O9Chlorogenic acidPLE *, SLE
310.5337.0915337.09296.91.5C16H18O8Coumaroylquinic acidPLE 1,2,3,4,5,6,7,8,9,
10,11,12,13,14,15,16,17,
18,19,21,22,23,24,25
411367.1039367.10351.121C17H20O9Feruloylquinic acidPLE *, SLE
511.2311.0007311.00281.46.8C18H30O4UK 1PLE *
611.5355.101355.10355.942C16H20O9Feruloyl hexosePLE 1,2,3,4,5,6,7,8,9,
10,11,12,13,14,15,16,17,
18,19,23,24,25, SLE
711.8311.0263311.0256−1.763.5C9H12O12UK 2PLE *
812.3311.0005311.0031−1.416.5C18H30O4UK 3PLE *
912.6771.2017771.1989−2.228.9C33H40O21Quercetin glucosyl rutinosidePLE *, SLE
1013.2609.1562609.1555−0.225.6C27C31O16RutinPLE *, SLE
1113.9463.0883463.08820.410.3C21H20O12Quercetin-glucosidePLE *, SLE
1214.1593.1525593.1512−0.622.1C27H30O15Kaempferol-rutinosidePLE *, SLE
1314.2623.1619623.16180.719.4C28H32O16Isorhamnetin-rutinosidePLE *, SLE
1416523.3837523.27605.332.9C24H44O12UK 4PLE *
1521.1329.2326329.23333.712.5C18H34O5Trihydroxy-octadecaenoic acidPLE *
1621.3383.1128383.11364.21.1C21H20O7DicoumaroylglycerolPLE *, SLE
1721.6413.1239413.12424.222.5C22H22O8Coumaroylferuloyl glycerolPLE *, SLE
1821.9443.1325443.13485.97.9C23H24O9Diferuloyl glycerolPLE *, SLE
1941.1277.2161277.21733.862.4C18H30O2Linolenic acidPLE *
2043.7279.2536279.2540428.2C18H32O2Linoleic acidPLE *
1 RT, retention time. UK, unknown compound. * All PLE extracts.
Table 2. Analysis of Variance (ANOVA) of the proposed regression models.
Y1
VariableSum of squaresd.f.Mean SquareF-Ratiop-Value
X1: Temperature1748.2711748.273793.990.0103
X2: % EtOH49.8912149.8912108.270.061
X3: Extraction time265.0381265.038575.170.0265
X4: S–S20.6204120.620444.750.0945
X2X2140.2931140.293304.450.0364
X2X346.6476146.6476101.230.0631
X2X4487.7921487.7921058.580.0196
X3X344.17144.1795.850.0648
X3X4321.161321.16696.960.0241
X4X4236.3441236.344512.90.0281
Lack-of-fit1416.0913108.93236.390.0502
Pure error0.460810.4608
Total (corr.)5048.7724
R20.719427
Y2
VariableSum of squaresd.f.Mean SquareF-Ratiop-Value
X1: Temperature3725.0713725.07275.520.0383
X2: % EtOH2980.1512980.15220.430.0428
X3: Extraction time0.35619910.3561990.030.8976
X4: S–S79.0719179.07195.850.2496
X1X111.8109111.81090.870.5215
X1X287.9975187.99756.510.2378
X1X320.6351120.63511.530.4332
X1X4145.531145.5310.760.1883
X2X23.14735 × 10−513.14735 × 10−500.999
X2X3120.9931120.9938.950.2054
X2X4851.391851.3962.970.0798
X3X319.0035119.00351.410.4461
X3X41.0548811.054880.080.8266
X4X411.0446111.04460.820.5321
Lack-of-fit750.45983.38336.170.2992
Pure error13.52113.52
Total (corr.)9538.2424
R20.919905
Y3
VariableSum of squaresd.f.Mean SquareF-Ratiop-Value
X1: Temperature2446.9112446.91221.540.0427
X2: % EtOH2294.9312294.93207.780.0441
X3: Extraction time1.0133211.013320.090.8128
X4: S–S40.7444140.74443.690.3056
X1X11.2165111.216510.110.796
X1X230.1739130.17392.730.3464
X1X311.1687111.16871.010.4982
X1X4146.5991146.59913.270.1705
X2X21.066911.06690.10.8082
X2X3105.2171105.2179.530.1995
X2X4517.4191517.41946.850.0924
X3X35.1416315.141630.470.6188
X3X44.3807714.380770.40.6422
X4X48.9106318.910630.810.5341
Lack-of-fit603.555967.06176.070.3014
Pure error11.045111.045
Total (corr.)6793.2524
R20.909528
Y4
VariableSum of squaresd.f.Mean SquareF-Ratiop-Value
X1: Temperature135.1951135.1951081.560.0194
X2: % EtOH44.5893144.5893356.710.0337
X3: Extraction time2.497712.497719.980.1401
X4: S–S6.5461616.5461652.370.0874
X1X15.7008615.7008645.610.0936
X1X214.8228114.8228118.580.0583
X1X31.5331511.5331512.270.1771
X1X40.0032470910.003247090.030.8983
X2X21.1127711.112778.90.2059
X2X30.4964310.496433.970.2961
X2X441.479141.479331.830.0349
X3X34.7453414.7453437.960.1024
X3X41.1548311.154839.240.2023
X4X40.12579110.1257911.010.499
Lack-of-fit32.361193.5956828.770.1418
Pure error0.12510.125
Total (corr.)299.8324
R20.891652
Table 3. Comparison between experimental results and predicted values for PLE.
Y1Y2Y3Y4
RunPredictedExp.CVPredictedExp.CVPredictedExp.CVPredictedExp.CV
PLE 117.8020.038.364.868 ± 0.63.451.050.8 ± 0.70.313.817.2 ± 0.110.3
PLE 234.5523.8625.946.434 ± 117.335.526 ± 116.39.57.49 ± 0.0612.5
PLE 326.0815.635.670.269 ± 31.156.157 ± 31.712.311.6 ± 0.54.8
PLE 442.8750.2511.274.180 ± 55.659.663 ± 53.516.117.7 ± 0.75.7
PLE 540.5143.85.542.554 ± 316.232.040 ± 215.212.313.9 ± 0.98.0
PLE 625.9721.6113.072.486 ± 211.857.567 ± 211.016.618.4 ± 0.35.1
PLE 739.0546.2912.044.259 ± 220.434.049 ± 217.011.79.6 ± 0.310.8
PLE 817.6523.1119.044.732.6 ± 0.117.033.424.5 ± 0.216.610.08.1 ± 0.211.4
PLE 924.6223.642.971.952 ± 323.058.241 ± 319.511.810.8 ± 0.45.4
PLE 1032.2735.617.044.938.5 ± 0.710.834.929.3 ± 0.712.49.99.24 ± 0.053.5
PLE 1126.54296.343.741.2 ± 1.64.133.432 ± 22.710.39.0 ± 0.27.0
PLE 1245.0335.5816.643.348 ± 17.033.938 ± 17.59.110.1 ± 0.46.1
PLE 1337.9937.520.946.248 ± 22.236.539 ± 24.29.59 ± 111.1
PLE 1443.0434.2416.124.418.2 ± 0.615.817.011.8 ± 0.520.17.46.4 ± 0.17.9
PLE 1532.2736.578.844.943.7 ± 0.91.934.934.0 ± 0.71.99.99.7 ± 0.22.0
PLE 1638.5239.662.165.577 ± 911.352.864 ± 813.212.413 ± 18.6
PLE 1741.6143.292.846.642.5 ± 0.46.536.032.1 ± 0.78.110.710.4 ± 0.32.9
PLE 1845.4850.327.145.650 ± 26.935.841 ± 19.011.39.6 ± 0.28.6
PLE 1954.0670.0118.219.622.4 ± 0.39.313.715.1 ± 0.56.84.27.3 ± 0.223.9
PLE 2058.5661.723.717.423 ± 113.412.315.1 ± 0.510.16.48 ± 118.4
PLE 2160.0258.342.015.712.9 ± 0.214.110.36.8 ± 0.222.37.06.0 ± 0.17.6
PLE 2237.1630.2214.617.921 ± 111.811.715.1 ± 0.918.24.76.1 ± 0.111.7
PLE 2362.3850.9314.347.345 ± 34.037.936 ± 22.910.88.3 ± 0.815.5
PLE 2445.5961.6921.243.427 ± 328.034.420 ± 233.17.07.1 ± 0.21.8
PLE 2546.7333.3823.625.131.9 ± 0.711.518.824.8 ± 0.813.06.07.15 ± 0.078.7
Exp. = Experimental. CV = coefficient of variation. Y1 = Extraction yield (%); Y2 = Total phenolic compounds (mg compound/g extract); Y3 = Phenolic acids (mg compound/g extract); Y4 = Flavonoids (mg compound/g extract).
Table 4. Theoretical values of independent variables to maximize the response variables provided by the model.
FactorsTemperature
X1 (°C)
EtOH
X2 (%)
Time
X3 (min)
Sand—Sample Ratio X4 (w/w)Theoretical
Optimum
Variable
Response
Yield184.194.534.75.789.5%
TPC35.994.529.05.287.30 mg/g
Phenolic acids35.994.131.55.771.02 mg/g
Flavonoids36.194.55.85.721.00 mg/g
Multiple
response
67.692.934.85.7Yield = 66.4%
TPC = 78.94 mg/g
TPC: total phenolic compounds, mg/g extract.
Publisher’s Note: MDPI stays neutral with regard to jurisdictional claims in published maps and institutional affiliations.

