Article

Changes of Hematological and Hemorheological Parameters in Rabbits with Hypercholesterolemia

1
Department of Operative Techniques and Surgical Research, Faculty of Medicine, University of Debrecen, Moricz Zsigmond u. 22, H-4032 Debrecen, Hungary
2
Doctoral School of Clinical Medicine, University of Debrecen, Nagyerdei krt. 98, 4032 Debrecen, Hungary
3
Department of Pharmacology and Pharmacotherapy, Faculty of Medicine, University of Debrecen, Nagyerdei krt. 98, 4032 Debrecen, Hungary
*
Author to whom correspondence should be addressed.
Metabolites 2021, 11(4), 249; https://doi.org/10.3390/metabo11040249
Submission received: 20 March 2021 / Revised: 15 April 2021 / Accepted: 16 April 2021 / Published: 17 April 2021
(This article belongs to the Special Issue Hemorheology and Metabolism)

Abstract

:
Hypercholesterolemia plays an important role in the development of atherosclerosis, leading to endothelial dysfunction, ischemic events, and increased mortality. Numerous studies suggest the pivotal role of rheological factors in the pathology of atherosclerosis. To get a more detailed hematological and hemorheological profile in hypercholesterolemia, we carried out an experiment on rabbits. Animals were divided into two groups: the control group (Control) was kept on normal rabbit chow, the high-cholesterol diet group (HC) was fed with special increased cholesterol-containing food. Hematological parameters (Sysmex K-4500 automate), whole blood and plasma viscosity (Hevimet-40 capillary viscometer), red blood cell (RBC) aggregation (Myrenne MA-1 aggregometer), deformability and mechanical stability (LoRRca MaxSis Osmoscan ektacytometer) were tested. The white blood cell and platelet count, mean corpuscular volume, and mean corpuscular hemoglobin were significantly higher in the HC group, while the RBC count, hemoglobin, and hematocrit values were lower than the Control data. Viscosity values corrected to 40% hematocrit were higher in the HC group. The RBC aggregation significantly increased in the HC vs. the Control. The HC group showed significantly worse results both in RBCs’ deformability and membrane stability. In conclusion, the atherogenic diet worsens the hematological and macro- and micro-rheological parameters, affecting blood flow properties and microcirculation.

1. Introduction

Atherosclerosis is a generalized disease of the arterial wall, characterized by thickening of the intimal layer and accumulation of fat, partly caused by hyperlipidemia (high concentration of lipids and/or lipoproteins) and lipid oxidation (as low-density lipoprotein [LDL] oxidation) [1]. An increasing number of international multi-center studies (Edinburgh Artery Study, Puerto Rico Study, Caerphilly and Speedwell Study, Northwick Park Heart Study) have shown that the development of atherosclerosis and thrombotic predisposition is associated with changes in hemorheological factors [2,3,4,5]. There are several mechanisms by which hemorheological factors can promote atherogenesis. These include the hypercoagulability, which predisposes to thrombosis, the decreased blood flow due to rheological changes, and the increased concentration of fibrinogen and its metabolites [6,7].
The rabbit is a widely used animal model for the study of human metabolic diseases [8]. The lipid metabolism of rabbits makes these animals particularly suitable for the study of the pathophysiology of lipoprotein metabolism, atherosclerosis, and metabolic syndromes [9,10,11,12]. Furthermore, this species’ cardiac physiology (actin-myosin structure, ion channel characteristics) [13,14] is comparable to humans, defining the rabbit as an ideal model to study heart diseases as cardiac arrhythmia, myocardial infarction, heart failure, ischemic heart disease. A considerable number of articles have presented data about atherosclerotic rabbits [10,11], but the number of papers presenting detailed hematological and hemorheological data of healthy [15,16] and atherosclerotic [17] rabbits is relatively few.
The aim of our research was to evaluate how the atherogenic diet affects hematological, macro-rheological (whole blood cell and plasma viscosity) and micro-rheological (erythrocytes’ aggregation, deformability, and mechanical membrane stability) parameters in a rabbit model of cardiovascular disease.

2. Results

2.1. Bodyweight Changes

The bodyweight of the animals before starting the follow-up period with diet was 2898 ± 111 g in the Control and 2923 ± 133 g in the HC group. At the time of the blood sampling the weight of Control group animals was 3087 ± 56 g (p = 0.004 vs. base), and 4131 ± 61 g in the HC group (p = 0.002 vs. base, p < 0.001 vs. Control).

2.2. Hematological Parameters

Table 1 summarizes the hematological results. The white blood cell count, the mean corpuscular volume and platelet count were significantly higher in the HC group than in the Control group. Mean corpuscular hemoglobin did not differ significantly. The red blood cell count, the hemoglobin value and the mean corpuscular hemoglobin concentration significantly decreased in HC group versus to the Control group.

2.3. Hemorheological Parameters

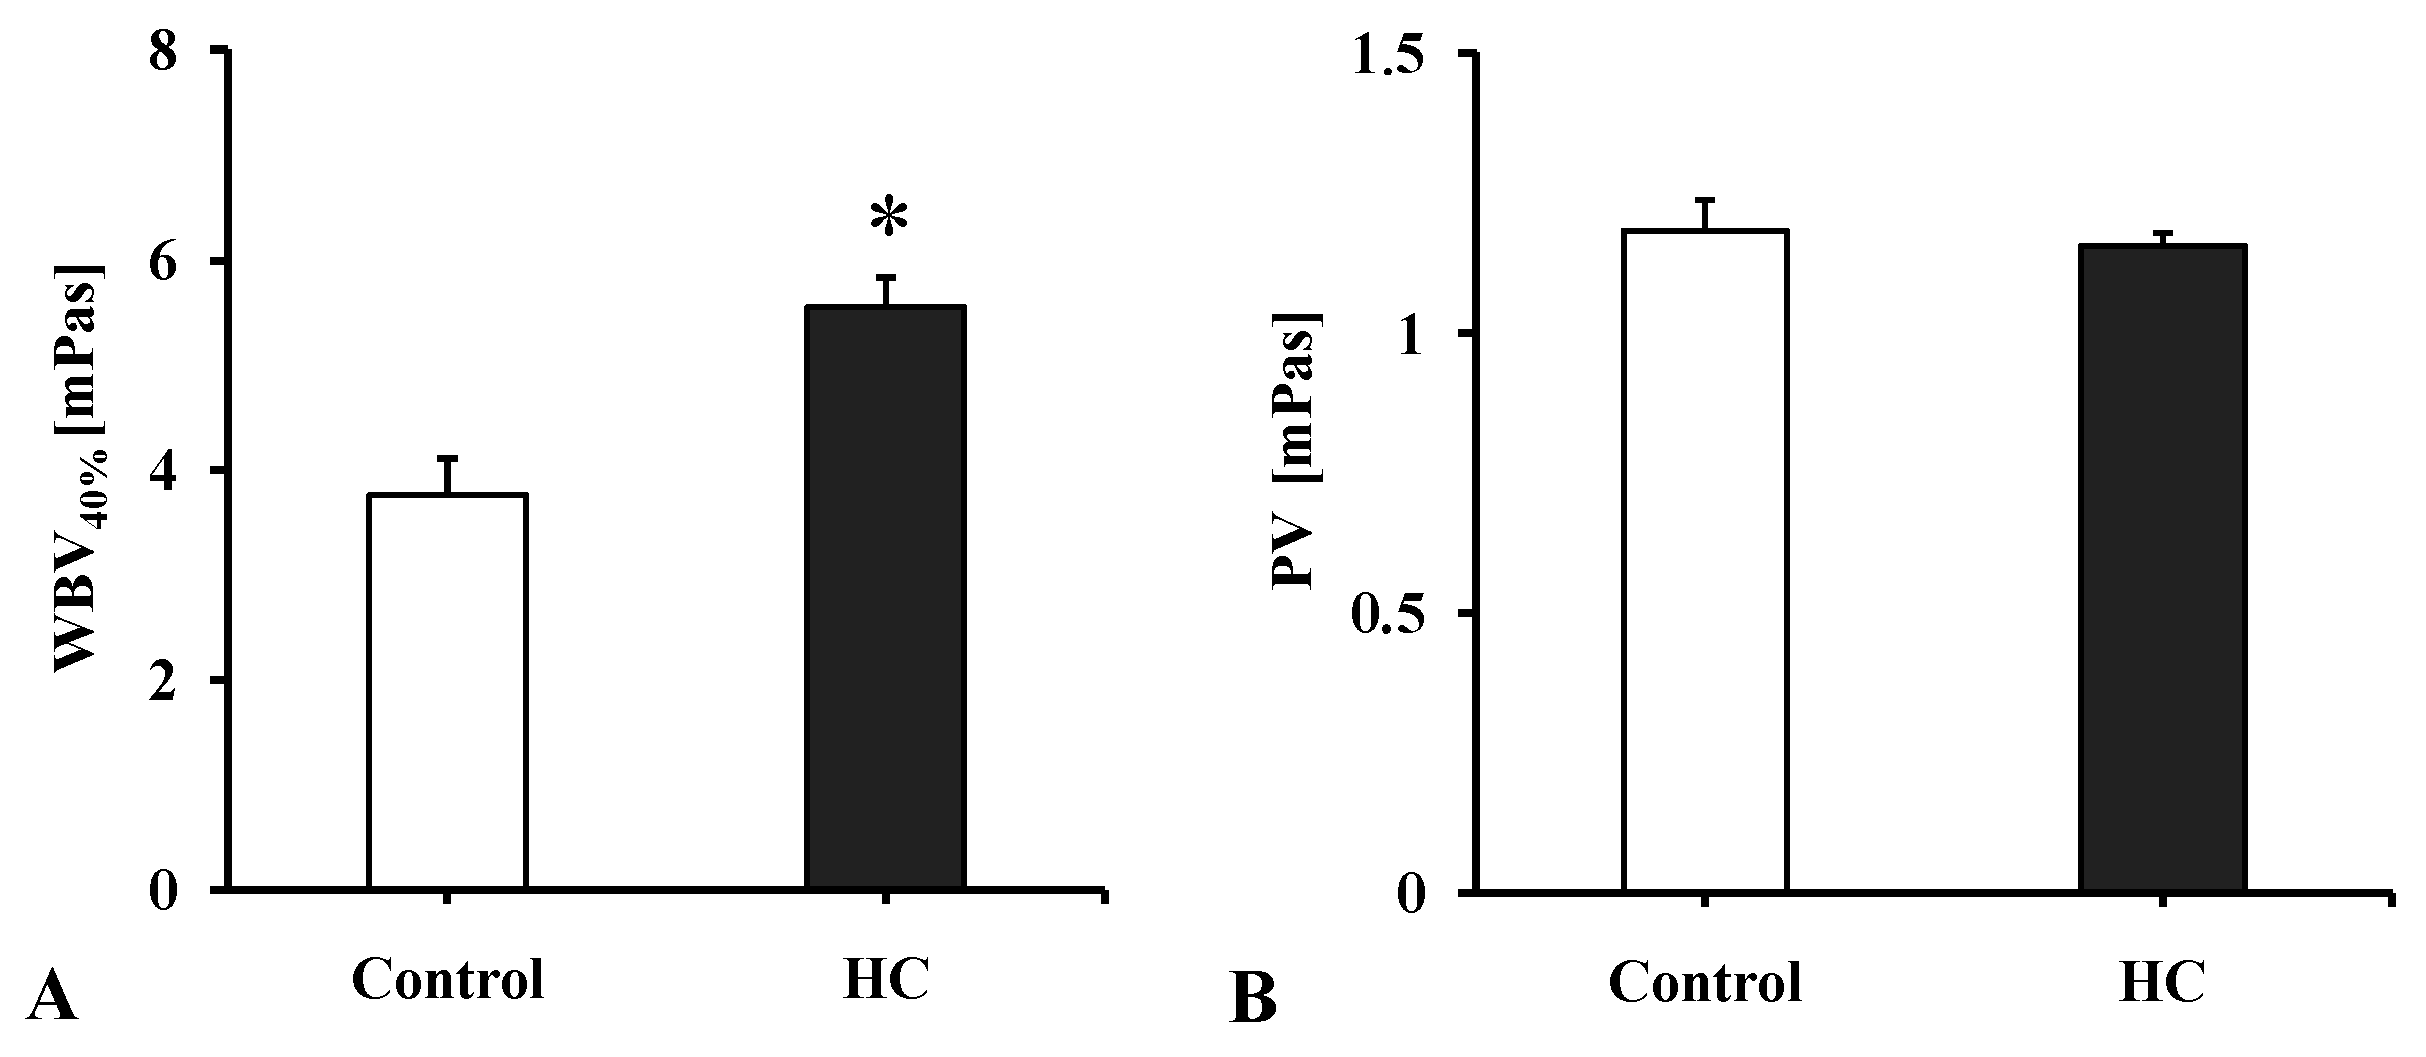
2.3.1. Whole Blood and Plasma Viscosity

The whole blood viscosity values corrected to 40% hematocrit were significantly increased vs. the Control group’s data (p = 0.0051). In the plasma viscosity no considerable changes were detected (Figure 1).

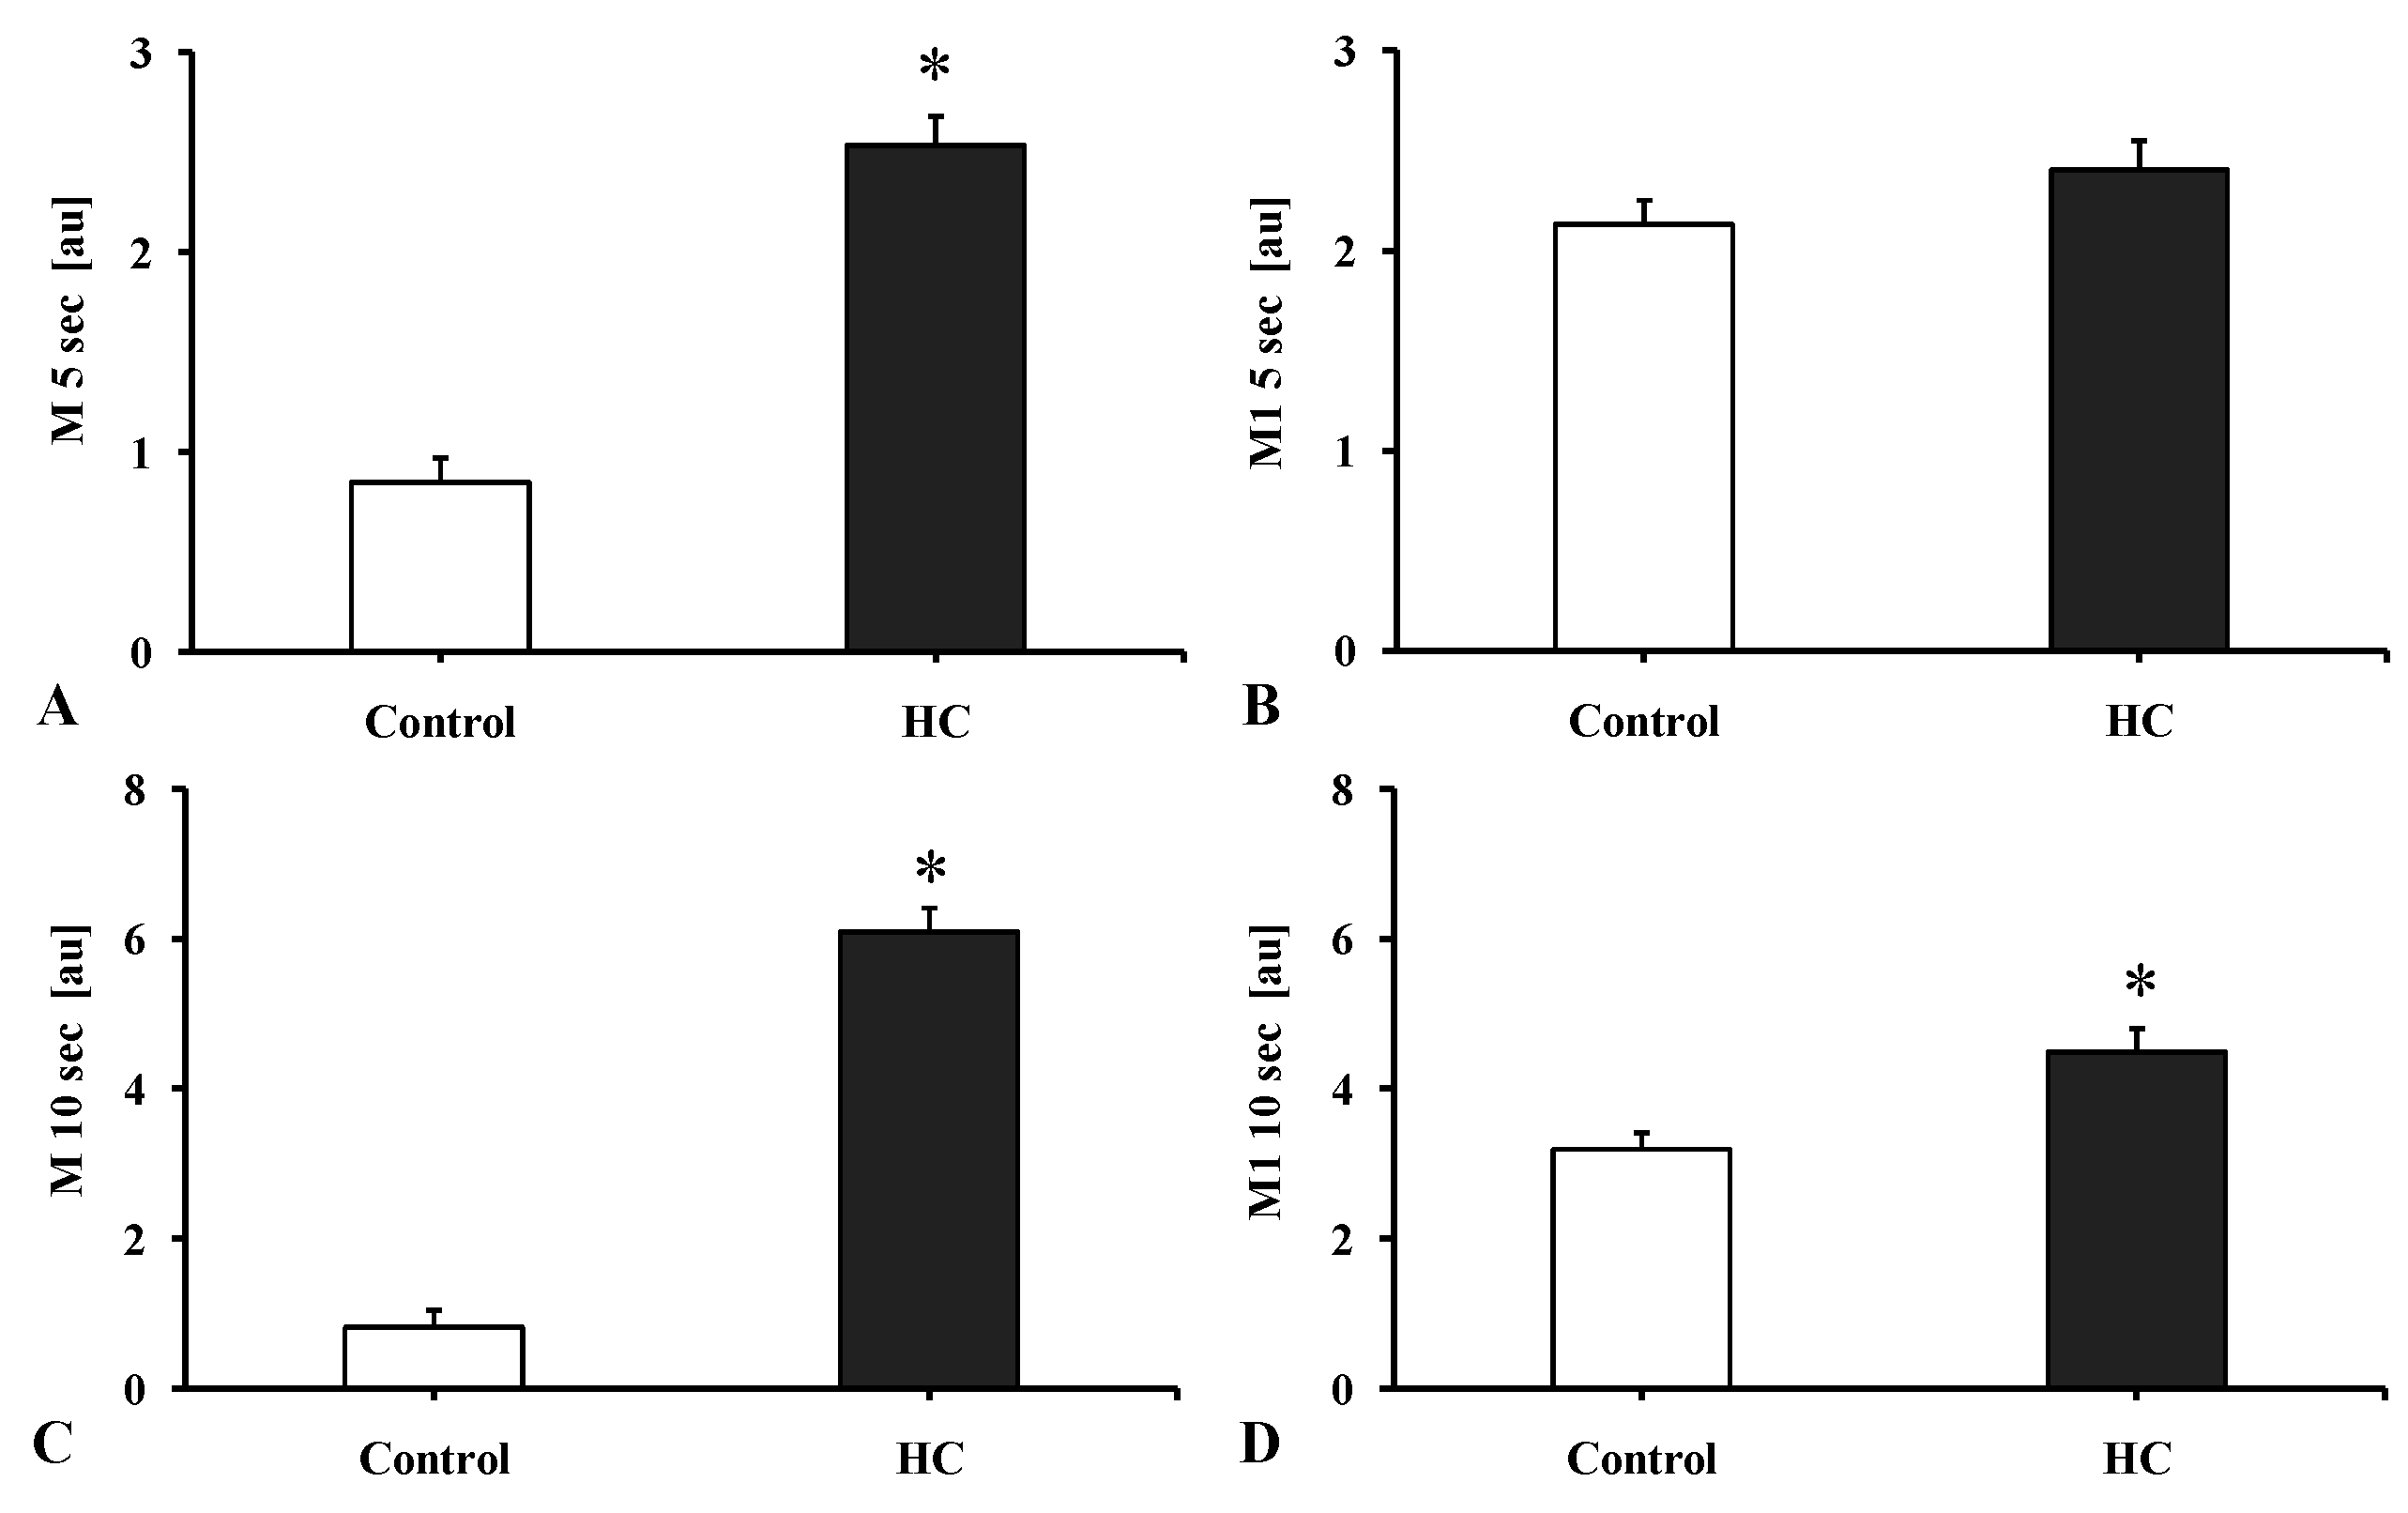
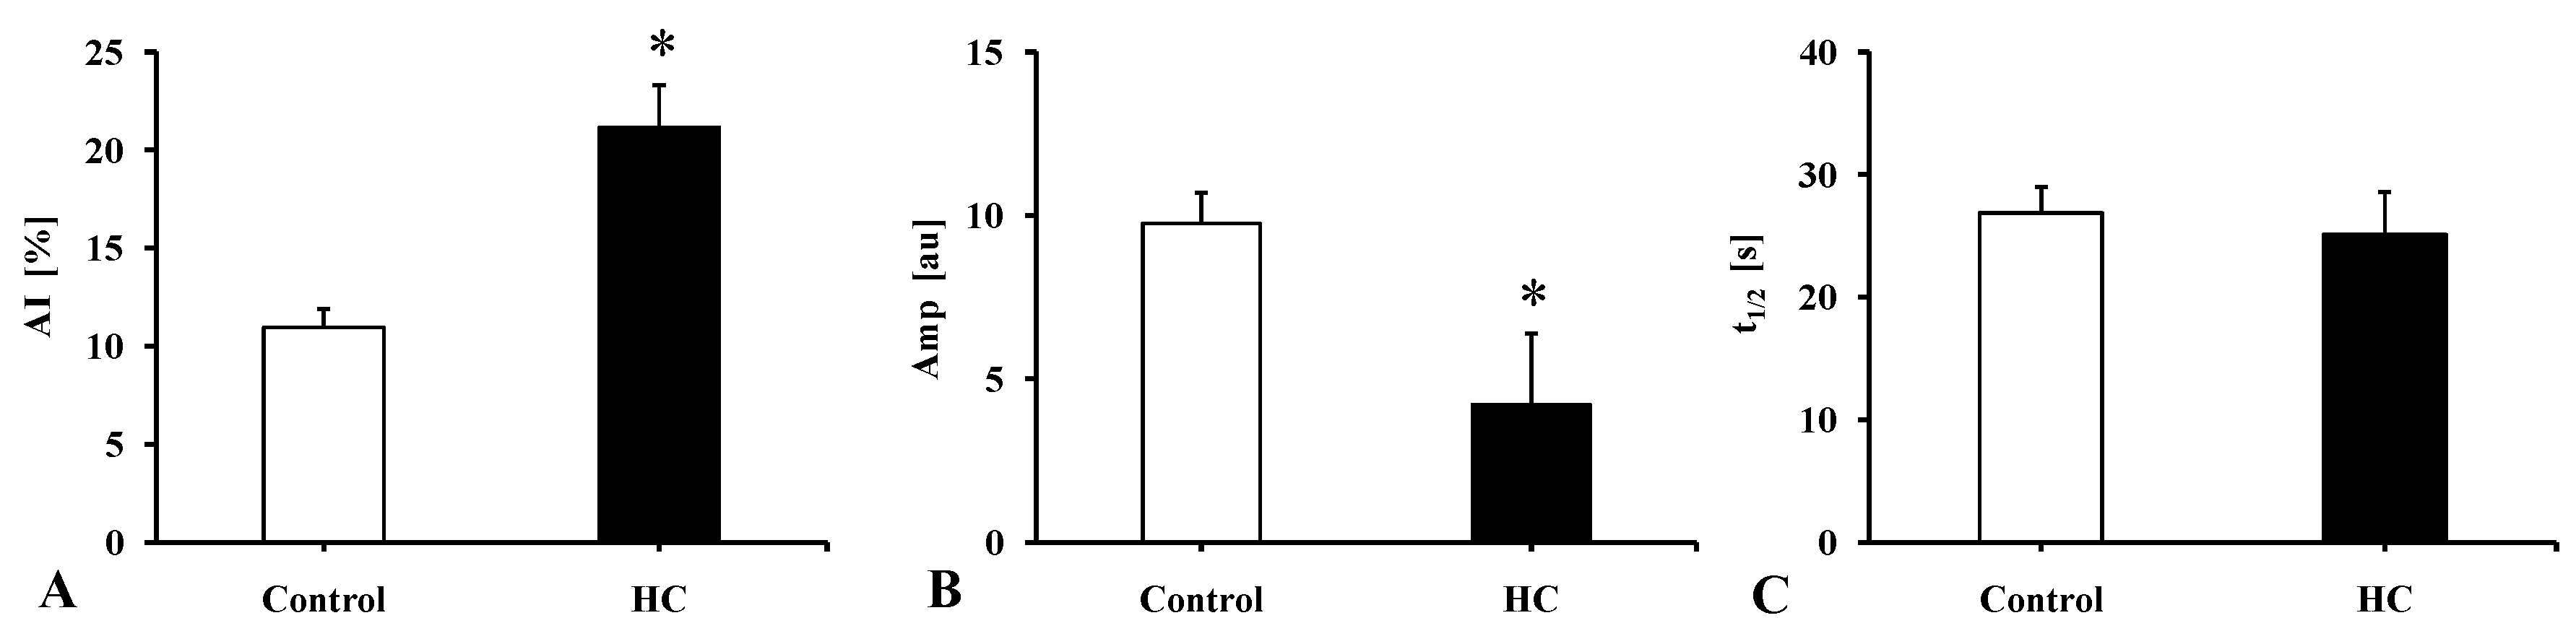
2.3.2. Red Blood Cell Aggregation

In the HC group all the aggregation index values increased. The changes were significant at stasis (M 5 s: p < 0.001, M 10 s: p < 0.001) and at low shear rate (3 s−1, M1 10 s: p = 0.0251) (Figure 2).
Figure 3 shows the changes in erythrocyte aggregation values determined by the LoRRca device. The difference in aggregation index (AI [%]) values was highly significant (p = 0.0003) between Control vs. HC groups. The amplitude values (Amp [au]) were lower in the HC group than in the Control group (p < 0.0001). The t1/2 [s], which describes the kinetics of RBC aggregation, in the HC group values presented a non-significant decrease compared to the Control group.

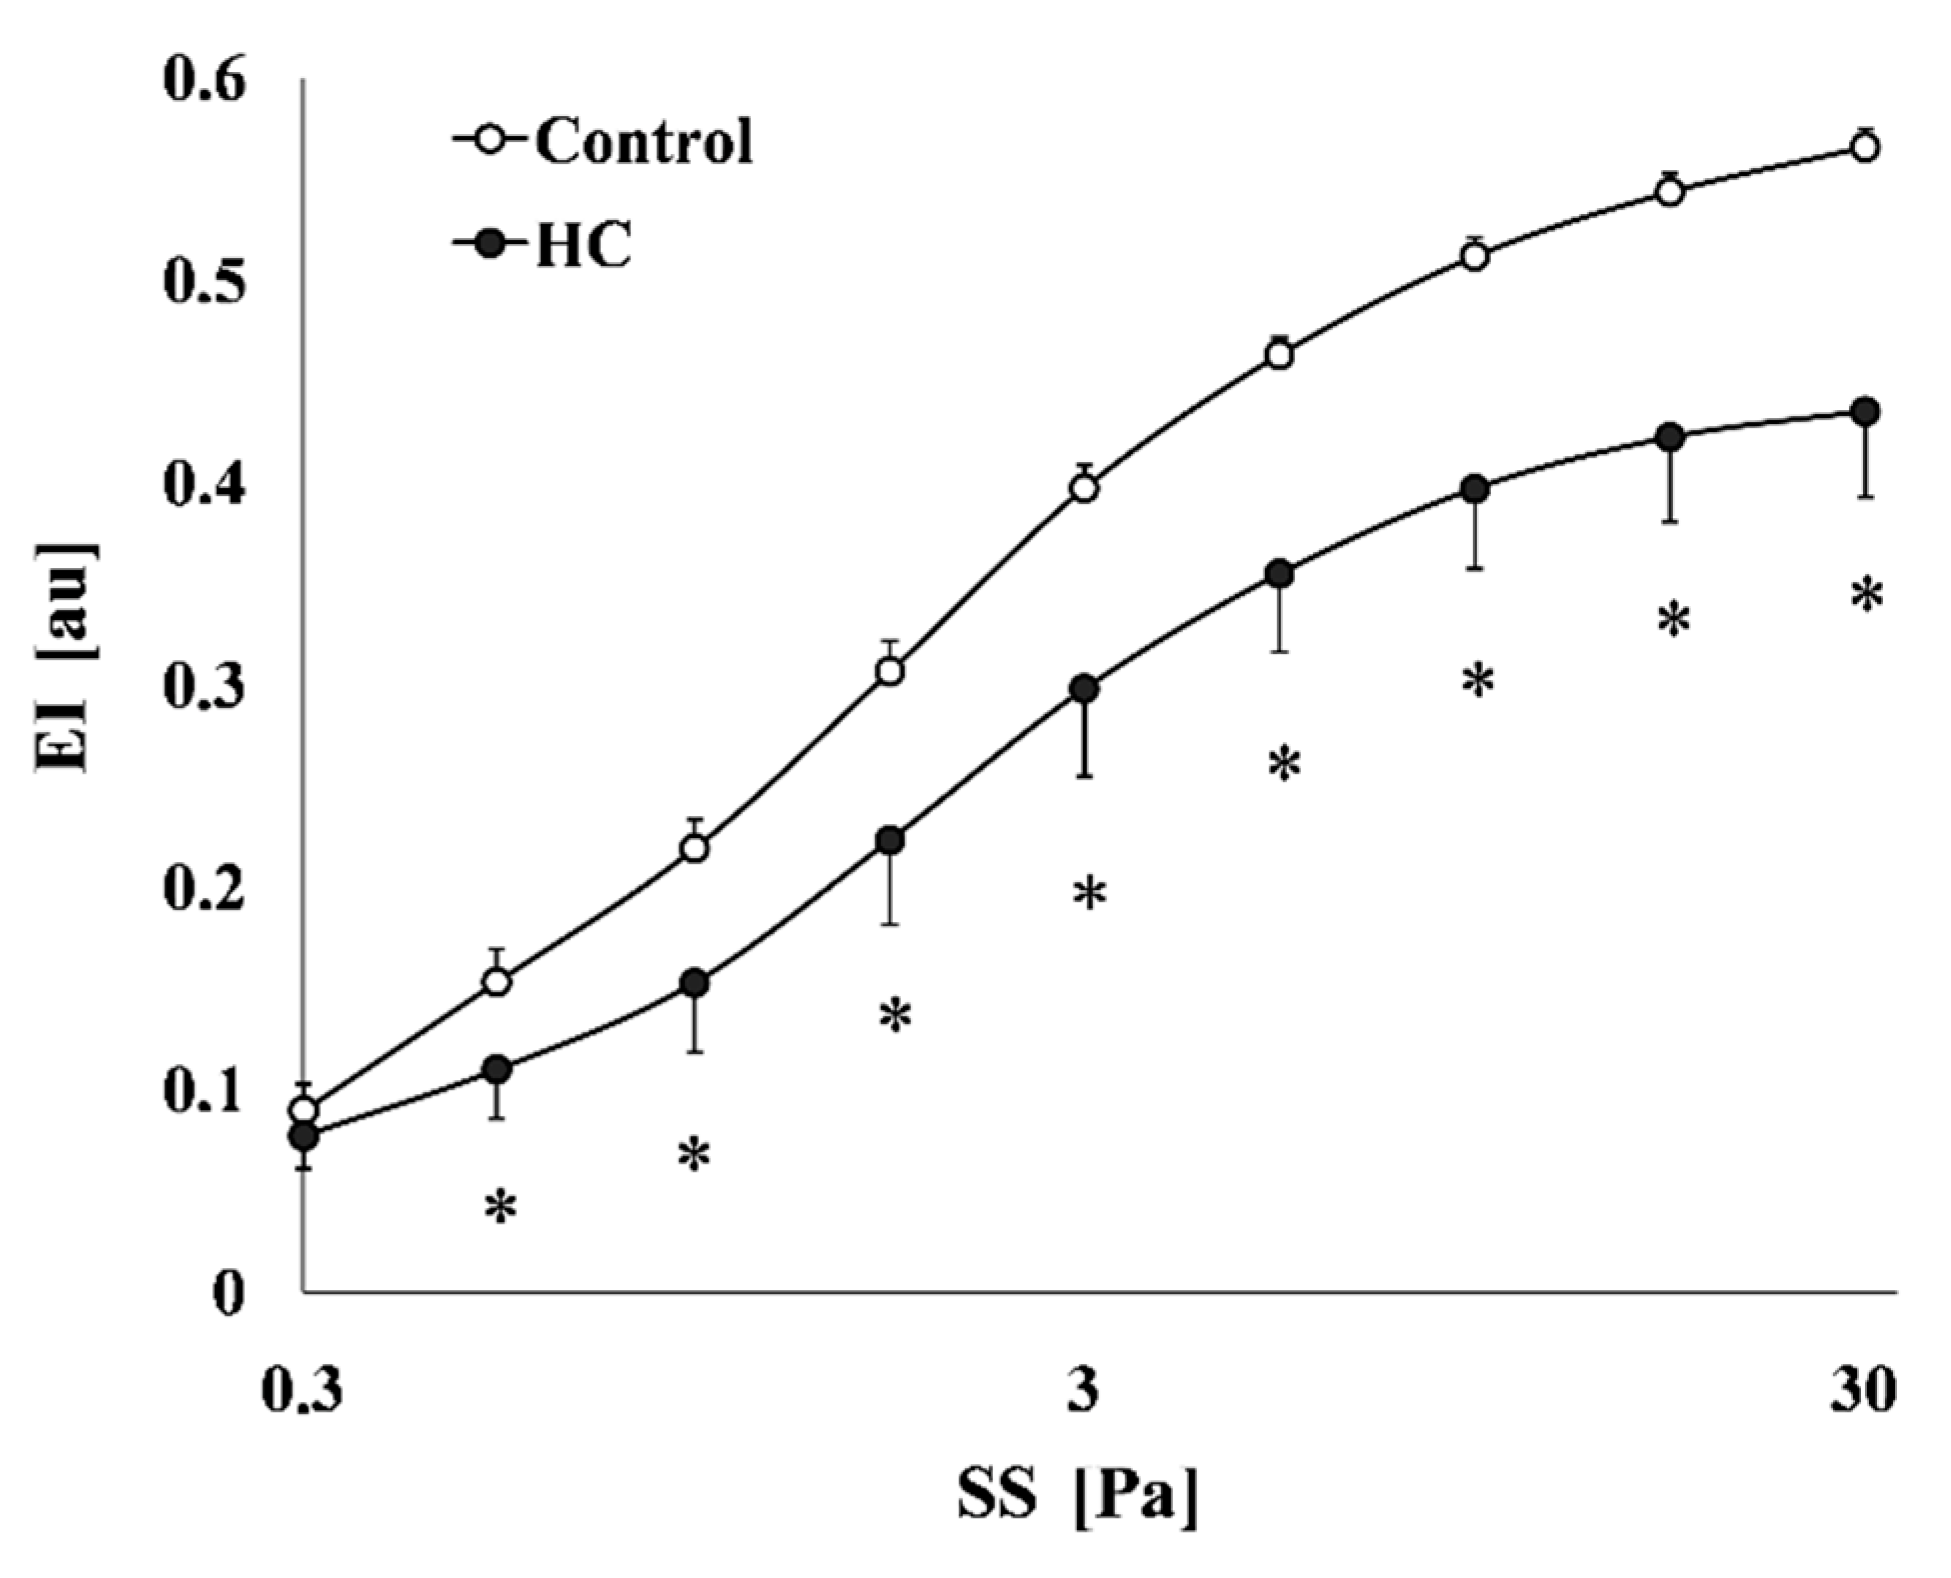
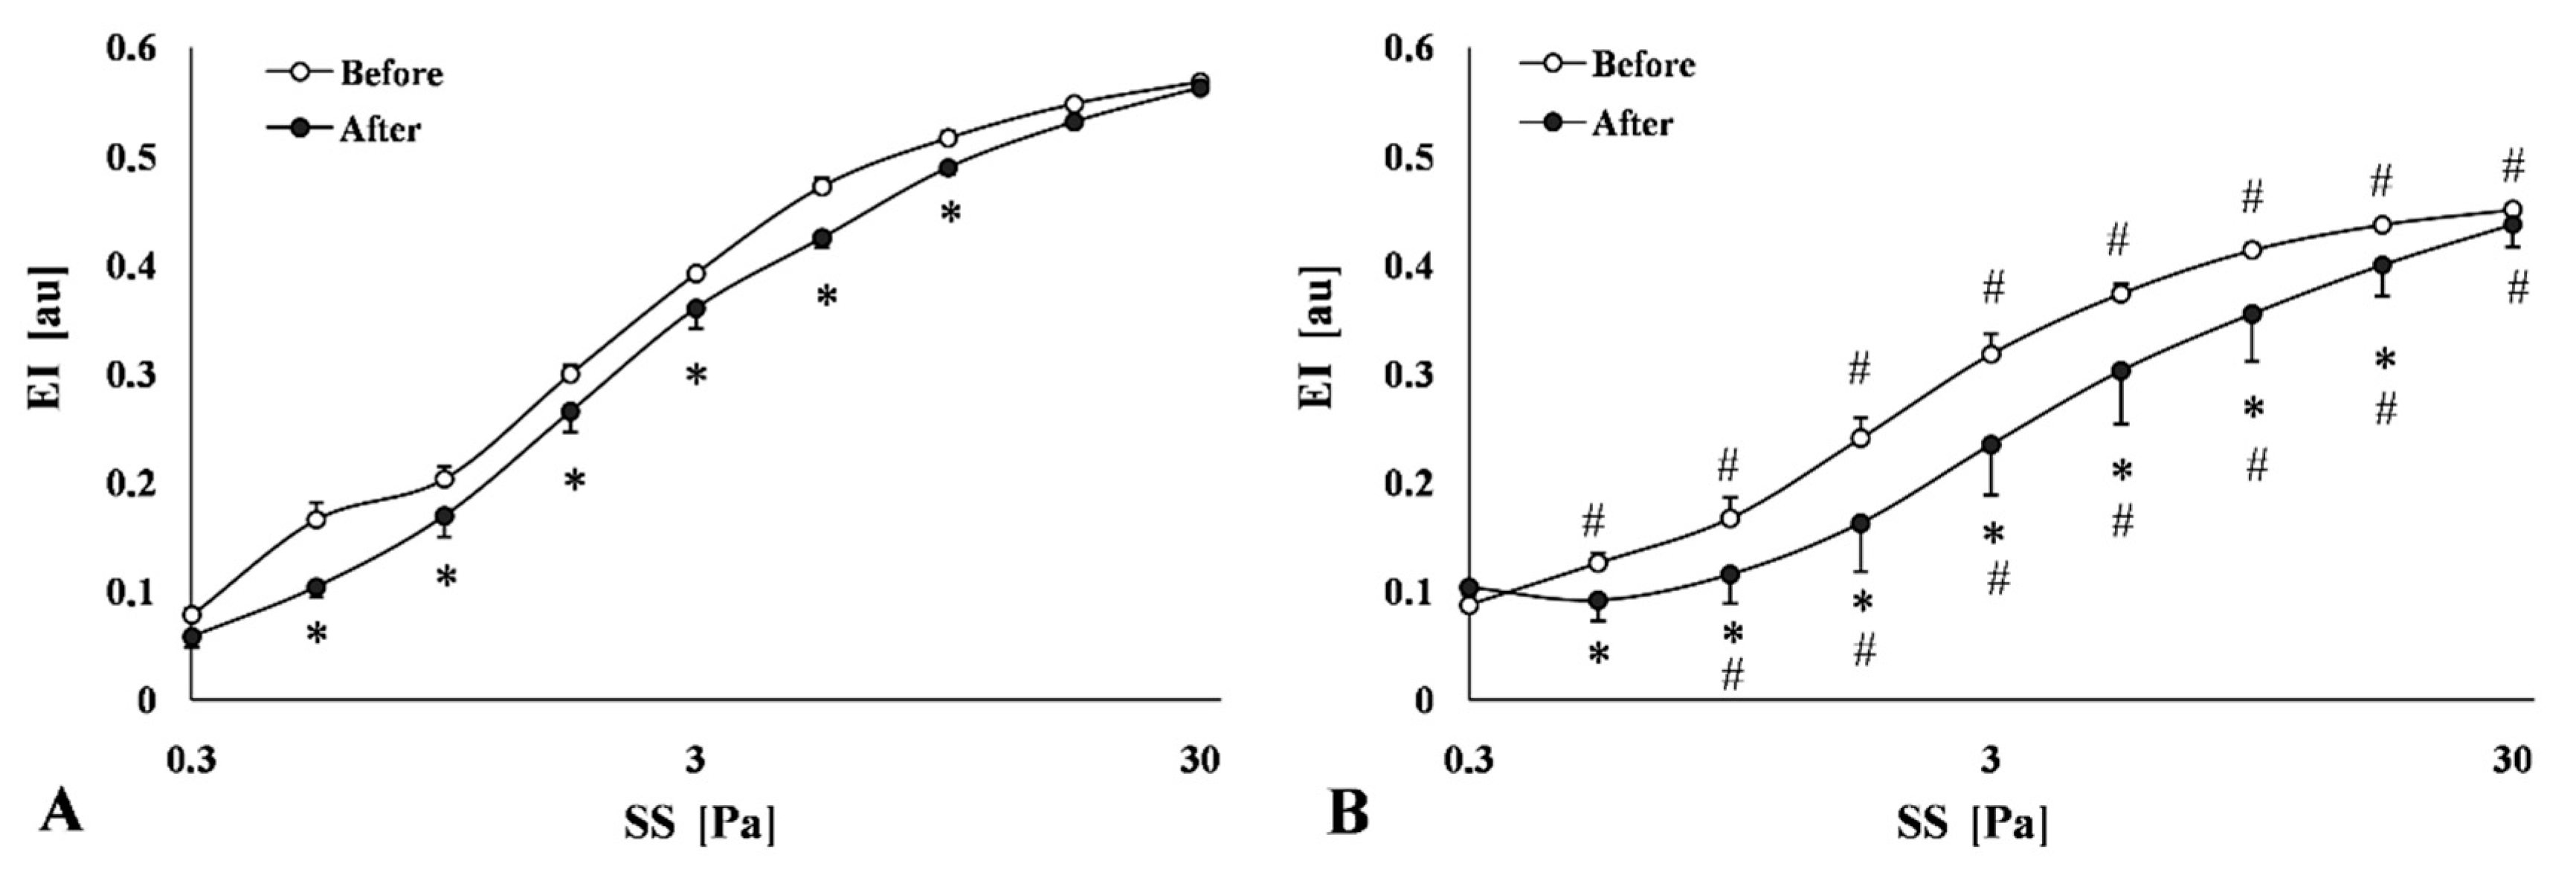
2.3.3. Red Blood Cell Deformability

The deformability of red blood cells was impaired in the HC group. The elongation index (EI)—shear stress (SS) curves showed remarkable differences, as the EI values of the HC groups were significantly lower compared to the Control group (Figure 4).
The calculated parameters from the individual EI-SS curves also expressed the differences. The EImax data were higher in the Control group and the differences were significant versus the HC group. EI values at 3 Pa were significantly lower in the HC group. SS1/2 values were significantly increased in the HC group, while the EImax/SS1/2 ratio values of the HC group were lower than in the Control animals (Table 2).

2.3.4. Red Blood Cell Membrane (Mechanical) Stability

The EI-SS curves obtained before and after applied mechanical stress (100 Pa for 300 s) on the samples presented remarkable changes. Firstly, as the conventional deformability tests showed (see above), the HC group presented significantly lower EI values versus the Control with lower EImax and higher SS1/2 values. Secondly, after the mechanical stress, the decrease in EI values was more expressed in the HC group. The decrease in EI and EImax values, as well as the increase in SS1/2 values, were significant, compared to the Control group (Figure 5A,B, Table 3).

3. Discussion

The hypercholesterolemic rabbit model is a preferred model to study human atherosclerosis and lipoprotein metabolism [18,19]. It is well-known that rabbits are sensitive to dietary cholesterol and rapidly develop severe hypercholesterolemia which drives aortic atherosclerosis. The hepatic LDL receptors in both humans and rabbits are down-regulated according to the level of cholesterol uptake in the liver. Very-low-density lipoprotein (VLDL) receptors are highly expressed in macrophages, this is also a similarity between rabbits and humans [11]. The larger arteries compared to the small rodent models allow the clinical evaluation: using MRI and ultrasound (echocardiography), morphological (plaque composition and structure) and functional changes (systolic, diastolic dysfunction) can be detected [18,19]. The atherosclerotic rabbit model is considered suitable to investigate numerous human diseases, however, it presents several limitations: e.g., the laboratory rabbits do not develop spontaneous atherosclerosis on a standard diet, because they have low cholesterol levels. The severe pathological changes, such as worsened ejection fraction and general deterioration of cardiac functions, with increased atherosclerotic plaque formation, infarct size, and increased mortality, develop only in rabbits receiving high cholesterol diets for a long period of time [20]. When feeding the rabbits with high-cholesterol-containing food, aortic lesions can develop, first in the aortic arch and then in the thoracic aorta. The abdominal aortic lesions, characteristic for humans, appear only when the whole aortic lesions are severe. Coronary atherosclerosis is also observed in cholesterol-fed rabbits (with predilection in the left arterial trunks). Another disadvantage is that the advanced lesion as fibrosis, hemorrhage, ulceration, or aortic aneurysms are not seen; the rabbits’ plaque is characterized by foam cells with a fatty streak and they are rich in macrophages [11,18]. The so-called advanced lesions can develop following prolonged cholesterol feeding, but due to low hepatic lipase activity, this leads to increased hepatotoxicity [18].
In our study the used rabbit model was characterized by significant morphological, functional, and serological alterations. The area of the left atrium was enlarged; the weight of the left ventricle and relative wall thickness was increased. During the histological analysis, a foamy atherosclerotic plaque was observed on aortic sections, while in myocardial tissue interstitial fibrosis was determined. Symptoms of diastolic dysfunction were detected too. The serum lipid parameters, the atherogenic index, and ApoB/ApoA ratio were increased significantly in rabbits fed with additional 1% cholesterol and 1% saturated fat [19]. However, the limitations of the study include the low case number and the inter-species differences as mentioned above.
The atherogenic diet has affected numerous hematological parameters in our study. The red blood cell and the hemoglobin count were considerably decreased. This alteration was reported in experimental rabbits with high total cholesterol and increased LDL levels [21]. The low RBC and hemoglobin can appear even after 6 weeks of the experiment in rabbits, together with MCV, MCH, and MCHC changes [22,23]. In our investigation, in the HC group, the significantly increased MCV, unchanged MCH, and significantly decreased MCHC count show the signs of macrocytic hypochromic regenerative anemia. Anemia causes hypoxia due to decreased hemoglobin level, and there are several hemodynamic and non-hemodynamic compensatory mechanisms. The clinical and hemodynamic changes as a result of acute anemia are reversible, but chronic anemia drives progressive cardiac enlargement and left ventricular hypertrophy [24,25,26]. This cardiac alteration was detected in our rabbits, too [19]. The elevated MCV can be associated with the severity of atherosclerotic alterations and deficiency of vitamins related to atherosclerotic diseases as well [27].
Hypercholesterolemia stimulates platelet biogenesis through megakaryopoiesis, and leukocytosis by myelopoiesis, and increases platelet activation, by promoting platelet production and by direct impact on platelets [28,29,30,31]. The increased cholesterol level enhances the hyperaggregability of thrombocytes, too. Activated platelets can form aggregates with neutrophils and monocytes, and the subsequent crosstalk between platelets and leukocytes also plays an important role in the production of inflammatory cytokine, in the biosynthesis of leukotrienes and reactive oxygen species (ROS) [28]. The ROS can induce the production of inflammatory mediators such as C-reactive protein (CRP), which can activate the pro-thrombotic factors and platelets [32,33]. In our experimental animals, we detected significantly increased white blood cell and platelet count and CRP level [19]. These markers have shown the inflammatory character of atherosclerosis.
The high cholesterol level has direct effects on blood flow; this includes the growth of atherosclerotic plaques in the arterial system, reducing the lumen of coronary arteries, causing endothelial inflammation, and impaired endothelium-dependent vasorelaxation [34]. All together, these lead to an impairment of myocardial circulation and tissue perfusion [35]. Indirect effects of hypercholesterolemia involve blood rheology: a high level of cholesterol may increase whole blood viscosity by promoting the elevation of white blood cell and platelet count [29,36].
Remarkable changes in red blood cell aggregation using light-transmittance and syllectometry methods were observed. With light-transmittance, we detected that the HC group has significantly increased aggregation index values in each measuring mode (M and M1). Using the syllectometry method, in the HC group an increased aggregation index was accompanied by decreased aggregation amplitude, with unchanged time values. A similar tendency in aggregation index and syllectogram amplitude was reported in a clinical trial, performed with the same measuring method, on obese diabetic patients with hypercholesterolemia [37,38]. This study revealed that the total cholesterol level is correlated positively with the RBC aggregation index and negatively with aggregation half-time.
Red blood cell aggregation under low shear conditions is the main cause of increased blood viscosity [39,40,41,42]. The blood flow resistance during aggregation may decrease due to a reduced hematocrit but can increase at the same time by redistribution of red blood cells. Diminished blood flow can be caused by adhesion reactions between the blood cells and the endothelium of capillaries, such as the adhesion of white blood cells during inflammatory processes. Narrowing of the vessels due to atherosclerotic plaque can also adversely affect and increase cellular adhesion and flow resistance [43,44,45]. The increased aggregation can stimulate the axial migration of red blood cells which promotes plasma skimming. In this environment, a lower tissue hematocrit may cause decreased local viscosity at the marginal zone of blood vessels and could reduce the frictional resistance with the endothelium [46,47,48,49]. The axial migration promotes the phenomenon called margination described in white blood cells and platelets. The rigid RBC increases platelet marginalization which increases the tendency for thrombosis. Munn and Dupin [47] showed that the rouleaux formation of aggregating RBC is a more productive way to push the WBC to the vascular wall compared to a loosely associated group of cells. The WBC margination depends on the flow properties, axial migration of RBCs and RBC aggregates, local hematocrit as well as on blood cell deformability [48,49].
The mechanical stability of erythrocytes is essential to complete their function and to survive in the blood circulation. Several physiological and pathophysiological changes can affect the determining parameters of red blood cell deformability [45,50,51]. The stability of erythrocytes is directly related to LDL-cholesterol levels [52]. An excessive increase in the quantity of cholesterol in the erythrocyte membrane increases the rigidity and decreases the membrane deformability. This rigidity is correlated to the increase in relative cholesterol/phospholipid ratio [53]. The changes in cholesterol/phospholipid ratio can also affect RBCs’ phosphatidylserine by reducing the exposure on the external surface of the cell in patients with hypercholesterolemia and spur cell anemia (in vitro study [54]. In high-fat diet fed mice, the levels of membrane cholesterol and phosphatidylserine externalization were increased, promoting erythrocytes-macrophage inflammatory interactions, and promoting macrophage phagocytosis in vitro [55]. Impairment of red blood cell deformability in hypercholesterolemia has been shown in clinical cases as well [56]. The phosphatidylserine serves as a trigger for macrophage recognition for senescent cells and plays an important role in erythrocyte’s membrane stability [54,57].
Erythrocytes with excessively rigid membrane are less stable and more susceptible to lysis by mechanical forces especially when passing through narrow vessels (capillaries, spleen) [58,59]. In comparison to normal erythrocytes, the rigid ones are unable to deform well under shear stress, so the higher viscosity caused by increased shear force can also be attributed to impaired erythrocyte deformability [60]. Our result supports these findings: impaired deformability of red blood cells was accompanied by dramatically decreased membrane stability in the HC group. The examined sensitive parameters well expressed the differences in deformability (EI, EImax, SS1/2, and their ratio) and mechanical stability (before and after shear stress) deterioration of red blood cells [51]. The degradation of erythrocytes’ deformability in the HC group was confirmed by the parameterization of EI-SS curves and was manifested in a decrease of maximal RBC elongation index and higher SS1/2, and decreased SS1/2/EImax values. The worsening of membrane stability was represented by EI-SS curves compared before and after mechanical stress application. We must remark that the HC group elongation index and the maximum of elongation have deteriorated significantly even before the application of the shear stress and this tendency exacerbates after the applied mechanical stress. This worsening was well presented by impaired SS1/2/EImax ratio, too.

4. Materials and Methods

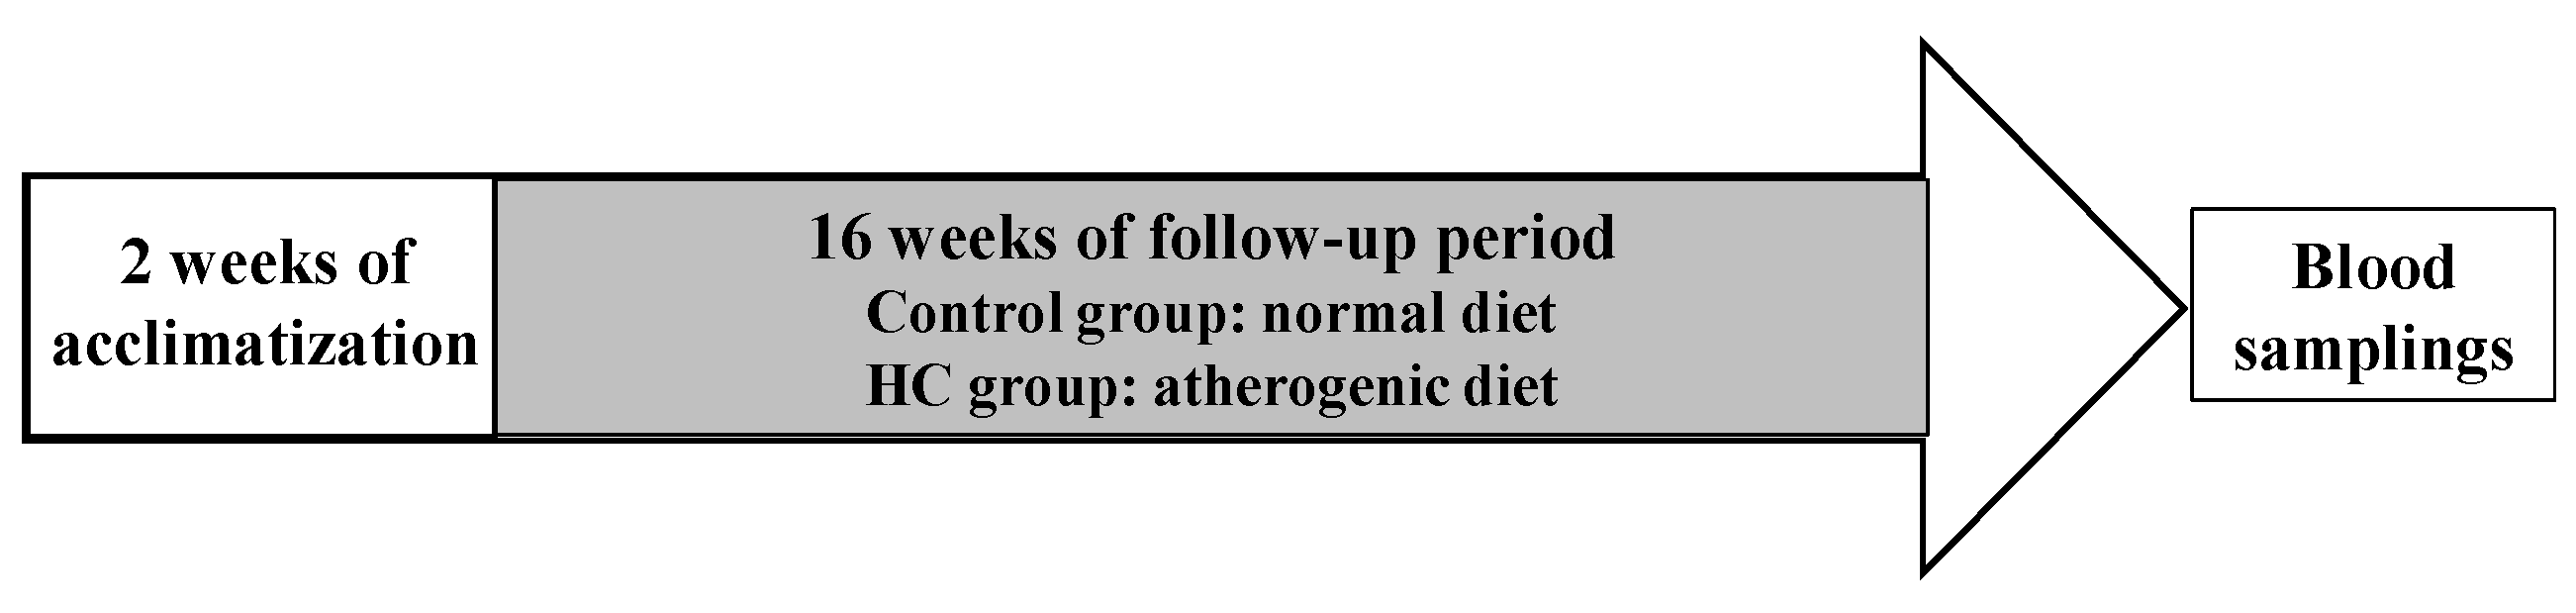
4.1. Experimental Animals

The animal experiments were approved by the University of Debrecen Committee of Animal Welfare and by the National Food Chain Safety Office (registration Nr.25/2013 UDCAW) in accordance with the national (Act XXVIII of 1998 on the protection and sparing of animals) and EU (Directive 2010/63/EU) regulations.
Male Californian-New Zealand hybrid (CAL/NZW) rabbits (n = 12), age 20 weeks and 2700–3000 g bodyweight, were involved in this study. The animals were kept in a conventional experimental animal facility, under a 12 h-12 h light-dark cycle. The rabbits (Jurasko Ltd., Debrecen, Hungary) received during the first two weeks of the adaptation (acclimatization) period commercial laboratory rabbit chow. After the acclimatization period the animals were randomly divided into Control (n = 6) and high-cholesterol diet (HC), atherogenic group (n = 6). During the next 16 weeks, the animals of the Control group were fed with standard rabbit chow, while a special “atherogenic” chow (additional 1% cholesterol and 1% saturated fat, formulated in the Department of Pharmaceutical Technology, Faculty of Pharmacy, University of Debrecen) were given in the HC group [19,61]. At the end of the follow-up period, blood samples were taken (Figure 6).

4.2. Collection of Blood Samples

The blood samples were obtained from the marginal ear vein, with Vacutainer™-system, into a 3 mL BD Vacutainer® tube containing 1.8 mg/mL K3-EDTA as anticoagulant (Becton, Dickinson and Company, Franklin Lake, NJ, USA) 2 mL blood samples per animal, and kept on 20 °C for further lab analysis. All laboratory measurements were completed within 2 h.

4.3. Laboratory Methods

4.3.1. Hematological Parameters

A Sysmex K-4500 automate (TOA Medical Electronics Co., Ltd., Kobe, Japan) was used to determine the hematological parameters: red blood cell count (RBC [1012/µL]), white blood cell count (WBC [109/µL]), hemoglobin concentration (Hgb [g/dL]), platelet count (Plt [109/µL]). The hematocrit (Hct [%]), mean corpuscular volume (MCV [fL]), mean corpuscular hemoglobin (MCH [pg]), and mean corpuscular hemoglobin concentration (MCHC [g/L] were calculated from the measured data.

4.3.2. Hemorheological Parameters

The changes in whole blood and plasma viscosity were measured by Hevimet-40 capillary viscometer (Hemorex Ltd., Budapest, Hungary) at 90 s−1 shear rates [16]. To calculate the whole blood viscosity the hematocrit count was normalized to 40% [62].
The erythrocytes’ aggregation was measured by light-transmittance method using Myrenne MA-1 erythrocyte aggregometer (Myrenne GmbH, Germany). After disaggregation (600 s−1) of 20 μL blood sample, at 5 or 10 s, the aggregation index values M mode (at a shear rate of 0 s−1) and M1 mode (at a shear rate of 3 s−1) were calculated [41,63]. The RBC aggregation was also tested with a LoRRca MaxSis Osmoscan ektacytometer (Mechatronics BV, The Netherlands). The device was operated with laser backscattering method. In the Couette-system, the blood sample is disaggregated by rotation, after this, the rotor stops promptly, and the changes in the intensity of the light reflected from the blood sample are measured [41,63]. The analyzed parameters were amplitude (Amp [au]), aggregation index (AI [%]) and half-amplitude time (t1/2 [s]). The test requires 1 mL of blood.
Using LoRRca MaxSis Osmoscan ektacytometer, for the deformability and membrane stability of erythrocytes, for each measuring, 10 μL of blood was diluted in 2 mL of polyvinyl-pyrrolidone (PVP)/phosphate-buffered saline (PBS) solution (viscosity: 36.1 mPas, osmolarity: 300, mOsm/kg, pH: 7.3). The elongation index (EI) values of red blood cells were tested in the function of shear stress (SS [Pa], range: 0.3–30 Pa) [41,63]. For the comparison of the EI-SS curves EI values at 3 Pa, maximal elongation index (EImax) and the shear stress belonging to the half of it (SS1/2, [Pa]) and their ratio (EImax/SS1/2) were used. These values were calculated using Lineweaver-Burk equation [64]. The cell membrane (mechanical) stability test was performed by comparing two deformability measurements before and after mechanical stress (100 Pa, for 300 s) [51,65].

4.4. Statistical Analysis

All data are presented as the average of the data on the group (mean) +/− standard error of the mean (SEM). The D’Agostino–Pearson normality test was used to determine Gaussian distribution, and statistical analysis was then performed using unpaired Student’s t-test or Mann–Whitney test (when normality test was not passed) between the groups, and two-way ANOVA was performed in case of the red blood cell deformability and membrane stability results. Analyses were carried out using GraphPad Prism software for Windows, version 8.0 (GraphPad Software Inc., La Jolla, CA, USA). Probability values (p) less than 0.05 were considered as statistically significantly different.

5. Conclusions

Macro- and micro-rheological parameters play an important role in determining tissue perfusion and shear stress-related endothelial functions and are influenced by numerous factors, involving metabolic changes too. Our study demonstrates that hypercholesterolemia can cause severe changes in hematological, macro-, and microrheological factors. The 16-week “atherogenic” diet altered not only the red blood cells’ number and hemoglobin content but also decreased the deformability and membrane stability of the erythrocytes. The aggregation indices of erythrocytes were characterized by a significant deterioration in the high cholesterol group, and this was proven by two different measuring techniques too. Our results may provide additional information to better understand the processes taking place in the vascular system during atherosclerosis and might contribute to optimizing the therapy.

Author Contributions

Conceptualization, A.D. and N.N.; sample preparation and laboratory investigation, B.T., V.S., M.B.; data analysis, B.T.; writing—original draft preparation, B.T., A.D.; writing—review and editing, A.D., B.J. and N.N.; visualization, B.T.; supervision, A.D.; funding acquisition, N.N. and B.J. All authors have read and agreed to the published version of the manuscript.

Funding

The work was supported by The National Research, Development and Innovation Fund, Hungary NKFIH-1150-6/2019 and TKP-2019, ED_18-1-2019-0028 and co-financed by the European Union and the European Regional Development Fund GINOP-2.3.4-15-2016-00002 project, and by the Bridging Fund of the Faculty of Medicine, University of Debrecen.

Institutional Review Board Statement

The animal experiments were approved by the University of Debrecen Committee of Animal Welfare and by the National Food Chain Safety Office (registration Nr.25/2013/UDCAW) in accordance with the national (Act XXVIII of 1998 on the protection and sparing of animals) and EU (Directive 2010/63/EU) regulations.

Informed Consent Statement

Not applicable.

Data Availability Statement

The data presented in this study are available on request from the corresponding author.

Acknowledgments

Authors are grateful to the staff of the Department of Operative Techniques and Surgical Research and the Department of Pharmacology and Pharmacotherapy, Faculty of Medicine, University of Debrecen.

Conflicts of Interest

The authors declare no conflict of interest.

References

  1. Rafieian-Kopaei, M.; Setorki, M.; Doudi, M.; Baradaran, A.; Nasri, H. Atherosclerosis: Process, indicators, risk factors and new hopes. Int. J. Prev. Med. 2014, 5, 927–946. [Google Scholar]
  2. Baker, I.A.; Pickering, J.; Elwood, P.C.; Bayer, A.; Ebrahim, S. Fibrinogen, viscosity and white blood cell count predict myocardial, but not cerebral infarction: Evidence from the Caerphilly and Speedwell cohort. Thromb. Haemost. 2002, 87, 421–425. [Google Scholar]
  3. Monsanto, H.A.; Renta-Muñoz, A.; Dones, W.; Comulada, A.; Cidre, C.; Orengo, J.C. The Puerto Rico Cardiovascular Risk-Estimation Study (PRCaRES): An exploratory assessment of new patients in physicians’ offices. P. R. Health Sci. J. 2014, 33, 58–64. [Google Scholar] [CrossRef] [Green Version]
  4. Pizzi, C.; De Stavola, B.L.; Meade, T.W. Long-term association of routine blood count (Coulter) variables on fatal coronary heart disease: 30-year results from the first prospective Northwick Park Heart Study (NPHS-I). Int. J. Epidemiol. 2009, 39, 256–265. [Google Scholar] [CrossRef] [PubMed] [Green Version]
  5. Tzoulaki, I.; Murray, G.D.; Lee, A.J.; Rumley, A.; Lowe, G.D.; Fowkes, F.G. Relative value of inflammatory, hemostatic, and rheological factors for incident myocardial infarction and stroke: The Edinburgh Artery Study. Circulation 2007, 115, 2119–2127. [Google Scholar] [CrossRef] [Green Version]
  6. Baskurt, O.K.; Meiselman, H.J. Blood rheology and hemodynamics. Semin. Thromb. Hemost. 2003, 29, 435–450. [Google Scholar] [PubMed] [Green Version]
  7. Koscielny, J.; Jung, E.M.; Mrowietz, C.; Kiesewetter, H.; Latza, R. Blood fluidity, fibrinogen, and cardiovascular risk factors of occlusive arterial disease: Results of the Aachen study. Clin. Hemorheol. Microcirc. 2004, 31, 185–195. [Google Scholar] [PubMed]
  8. Kolodgie, F.D.; Katocs, A.S., Jr.; Largis, E.E.; Wrenn, S.M.; Cornhill, J.F.; Herderick, E.E.; Lee, S.J.; Virmani, R. Hypercholesterolemia in the rabbit induced by feeding graded amounts of low-level cholesterol. Arterioscler. Thromb. Vasc. Biol. 1996, 16, 1454–1464. [Google Scholar] [CrossRef]
  9. Yan, R.T.; Fernandes, V.; Yan, A.T.; Cushman, M.; Redheuil, A.; Tracy, R.; Vogel-Claussen, J.; Bahrami, H.; Nasir, K.; Bluemke, D.A.; et al. Fibrinogen and left ventricular myocardial systolic function: The Multi-Ethnic Study of Atherosclerosis (MESA). Am. Heart J. 2010, 160, 479–486. [Google Scholar] [CrossRef] [Green Version]
  10. Dornas, W.C.; Oliveira, T.T.; Augusto, L.E.; Nagem, T.J. Experimental atherosclerosis in rabbits. Arq. Bras. Cardiol. 2010, 95, 272–278. [Google Scholar] [CrossRef] [PubMed] [Green Version]
  11. Fan, J.; Kitajima, S.; Watanabe, T.; Xu, J.; Zhang, J.; Liu, E.; Chen, Y.E. Rabbit models for the study of human atherosclerosis: From pathophysiological mechanisms to translational medicine. Pharmacol. Ther. 2014, 146, 104–119. [Google Scholar] [CrossRef] [Green Version]
  12. Lozano, W.M.; Arias-Mutis, O.J.; Calvo, C.J.; Chorro, F.J.; Zarzoso, M. Diet-induced rabbit models for the study of metabolic syndrome. Animals 2019, 9, 463. [Google Scholar] [CrossRef] [Green Version]
  13. Milani-Nejad, N.; Janssen, P.M. Small and large animal models in cardiac contraction research: Advantages and disadvantages. Pharmacol. Ther. 2014, 141, 235–249. [Google Scholar] [CrossRef] [PubMed] [Green Version]
  14. Conceição, G.; Heinonen, I.; Lourenço, A.P.; Duncker, D.J.; Falcão-Pires, I. Animal models of heart failure with preserved ejection fraction. Neth. Heart J. 2016, 24, 275–286. [Google Scholar] [CrossRef] [PubMed] [Green Version]
  15. Windberger, U.; Bartholovitsch, A.; Plasenzotti, R.; Korak, K.J.; Heinze, G. Whole blood viscosity, plasma viscosity and erythrocyte aggregation in nine mammalian species: Reference values and comparison of data. Exp. Physiol. 2003, 88, 431–440. [Google Scholar] [CrossRef] [Green Version]
  16. Nemeth, N.; Alexy, T.; Furka, A.; Baskurt, O.K.; Meiselman, H.J.; Furka, I.; Miko, I. Inter-species differences in hematocrit to blood viscosity ratio. Biorheology 2009, 46, 155–165. [Google Scholar] [CrossRef] [PubMed]
  17. Abdelhalim, M.A.K.; Al-Ayed, S.M.; Moussa, S.A.A.; Al-Mohy, Y.H. The changes in serum and whole blood rheological properties of rabbits during the progression of atherosclerosis. Pak. J. Pharm. Sci. 2016, 29, 1053–1057. [Google Scholar]
  18. Lee, Y.T.; Laxton, V.; Lin, H.Y.; Chan, Y.W.F.; Fitzgerald-Smith, S.; To, T.L.O.; Yan, B.P.; Liu, T.; Tse, G. Animal models of atherosclerosis. Biomed. Rep. 2017, 6, 259–266. [Google Scholar] [CrossRef] [PubMed] [Green Version]
  19. Priksz, D.; Bombicz, M.; Varga, B.; Kurucz, A.; Gesztelyi, R.; Balla, J.; Toth, A.; Papp, Z.; Szilvassy, Z.; Juhasz, B. Upregulation of myocardial and vascular phosphodiesterase 9a in a model of atherosclerotic cardiovascular disease. Int. J. Mol. Sci. 2018, 19, 2882. [Google Scholar] [CrossRef] [Green Version]
  20. Kertesz, A.; Bombicz, M.; Priksz, D.; Balla, J.; Balla, G.; Gesztelyi, R.; Varga, B.; Haines, D.D.; Tosaki, A.; Juhasz, B. Adverse impact of diet-induced hypercholesterolemia on cardiovascular tissue homeostasis in a rabbit model: Time-dependent changes in cardiac parameters. Int. J. Mol. Sci. 2013, 14, 19086–19108. [Google Scholar] [CrossRef] [Green Version]
  21. Abdelhalim, M.A.K.; Moussa, S.A.A. Biochemical changes of hemoglobin and osmotic fragility of red blood cells in high fat diet rabbits. Pak. J. Biol. Sci. 2010, 13, 73–77. [Google Scholar] [CrossRef]
  22. Króliczewska, B.; Miśta, D.; Zawadzki, W.; Wypchło, A.; Króliczewski, J. Effects of a skullcap root supplement on haematology, serum parameters and antioxidant enzymes in rabbits on a high-cholesterol diet. J. Anim. Physiol. Anim. Nutr. 2011, 95, 114–124. [Google Scholar] [CrossRef] [PubMed]
  23. Karbiner, M.S.; Sierra, L.; Minahk, C.; Fonio, M.C.; Bruno, M.P.; Jerez, S. The role of oxidative stress in alterations of hematological parameters and inflammatory markers induced by early hypercholesterolemia. Life Sci. 2013, 93, 503–508. [Google Scholar] [CrossRef]
  24. Mozos, I. Mechanisms linking red blood cell disorders and cardiovascular diseases. Biomed. Res. Int. 2015, 2015, 682054. [Google Scholar] [CrossRef]
  25. Metivier, F.; Marchais, S.J.; Guerin, A.P.; Pannier, B.; London, G.M. Pathophysiology of anaemia: Focus on the heart and blood vessels. Nephrol. Dial. Transplant. 2000, 15 (Suppl. 3), 14–18. [Google Scholar] [CrossRef] [PubMed] [Green Version]
  26. Felker, G.M.; Adams, K.F., Jr.; Gattis, W.A.; O’Connor, C.M. Anemia as a risk factor and therapeutic target in heart failure. J. Am. Coll. Cardiol. 2004, 44, 959–966. [Google Scholar] [CrossRef] [PubMed] [Green Version]
  27. Mueller, T.; Luft, C.; Haidinger, D.; Poelz, W.; Haltmayer, M. Erythrocyte mean corpuscular volume associated with the anatomical distribution in peripheral arterial disease. VASA 2002, 31, 81–85. [Google Scholar] [CrossRef]
  28. Wang, N.; Tall, A.R. Cholesterol in platelet biogenesis and activation. Blood 2016, 127, 1949–1953. [Google Scholar] [CrossRef] [Green Version]
  29. Tomaiuolo, G. Biomechanical properties of red blood cells in health and disease towards microfluidics. Biomicrofluidics 2014, 8, 051501. [Google Scholar] [CrossRef] [PubMed] [Green Version]
  30. Huo, Y.; Ley, K.F. Role of platelets in the development of atherosclerosis. Trends Cardiovasc. Med. 2004, 14, 18–22. [Google Scholar] [CrossRef]
  31. Barale, C.; Cavalot, F.; Frascaroli, C.; Bonomo, K.; Morotti, A.; Guerrasio, A.; Russo, I. Association between high on-aspirin platelet reactivity and reduced superoxide dismutase activity in patients affected by type 2 diabetes mellitus or primary hypercholesterolemia. Int. J. Mol. Sci. 2020, 21, 4983. [Google Scholar] [CrossRef]
  32. Zhang, Z.; Yang, Y.; Hill, M.A.; Wu, J. Does C-reactive protein contribute to atherothrombosis via oxidant-mediated release of pro-thrombotic factors and activation of platelets? Front. Physiol. 2012, 3, 433. [Google Scholar] [CrossRef] [PubMed] [Green Version]
  33. Braune, S.; Küpper, J.H.; Jung, F. Effect of prostanoids on human platelet function: An overview. Int. J. Mol. Sci. 2020, 21, 9020. [Google Scholar] [CrossRef]
  34. Krüger-Genge, A.; Blocki, A.; Franke, R.P.; Jung, F. Vascular endothelial cell biology: An update. Int. J. Mol. Sci. 2019, 20, E4411. [Google Scholar] [CrossRef] [Green Version]
  35. Buchwalow, I.B.; Cacanyiova, S.; Neumann, J.; Samoilova, V.E.; Boecker, W.; Kristek, F. The role of arterial smooth muscle in vasorelaxation. Biochem. Biophys. Res. Commun. 2008, 377, 504–507. [Google Scholar] [CrossRef] [PubMed]
  36. Ho, C.H. White blood cell and platelet counts could affect whole blood viscosity. J. Chin. Med. Assoc. 2004, 67, 394–397. [Google Scholar] [PubMed]
  37. Wiewiora, M.; Sosada, K.; Wylezol, M.; Slowinska, L.; Zurawinski, W. Red blood cell aggregation and deformability among patients qualified for bariatric surgery. Obes. Surg. 2007, 17, 365–371. [Google Scholar] [CrossRef]
  38. Krüger-Genge, A.; Sternitzky, R.; Pindur, G.; Rampling, M.; Franke, R.P.; Jung, F. Erythrocyte aggregation in relation to plasma proteins and lipids. J. Cell. Biotechnol. 2019, 5, 65–70. [Google Scholar] [CrossRef]
  39. Rampling, M.W. Hyperviscosity as a complication in a variety of disorders. Semin. Thromb. Hemost. 2003, 29, 459–465. [Google Scholar] [PubMed]
  40. Baskurt, O.K.; Yalcin, O.; Ozdem, S.; Armstrong, J.K.; Meiselman, H.J. Modulation of endothelial nitric oxide synthase expression by red blood cell aggregation. Am. J. Physiol. Heart Circ. Physiol. 2004, 286, H222–H229. [Google Scholar] [CrossRef] [Green Version]
  41. Baskurt, O.K.; Boynard, M.; Cokelet, G.C.; Connes, P.; Cooke, B.M.; Forconi, S.; Liao, F.; Hardeman, M.R.; Jung, F.; Meiselman, H.J.; et al. International Expert Panel for Standardization of Hemorheological Methods. New guidelines for hemorheological laboratory techniques. Clin. Hemorheol. Microcirc. 2009, 42, 75–97. [Google Scholar] [CrossRef] [PubMed] [Green Version]
  42. Baskurt, O.K.; Neu, B.; Meiselman, H.J. Determinants of red blood cell aggregation. In Red Blood Cell Aggregation; Baskurt, O.K., Neu, B., Meiselman, H.J., Eds.; CRC Press: Boca Raton, FL, USA, 2012; pp. 9–29. [Google Scholar]
  43. Geddes, J.B.; Carr, R.T.; Wu, F.; Lao, Y.; Maher, M. Blood flow in microvascular networks: A study in nonlinear biology. Chaos 2010, 20, 045123. [Google Scholar] [CrossRef] [Green Version]
  44. Lipowsky, H.H. Microvascular rheology and hemodynamics. Microcirculation 2005, 12, 5–15. [Google Scholar] [CrossRef] [PubMed]
  45. Baskurt, O.K. Mechanisms of blood rheology alterations. In Handbook of Hemorheology and Hemodynamics; Baskurt, O.K., Hardeman, M.R., Rampling, M.W., Meiselman, H.J., Eds.; IOS Press: Amsterdam, The Netherlands, 2007; pp. 170–190. [Google Scholar]
  46. Muravyov, A.V.; Tikhomirova, I.A.; Maimistova, A.A.; Bulaeva, S.V.; Mikhailov, P.V.; Kislov, N.V. Red blood cell aggregation changes are depended on its initial value: Effect of long-term drug treatment and short-term cell incubation with drug. Clin. Hemorheol. Microcirc. 2011, 48, 231–240. [Google Scholar] [CrossRef]
  47. Munn, L.L.; Dupin, M.M. Blood cell interactions and segregation in flow. Ann. Biomed. Eng. 2008, 36, 534–544. [Google Scholar] [CrossRef]
  48. Nash, G.B.; Watts, T.; Thornton, C.; Barigou, M. Red cell aggregation as a factor influencing margination and adhesion of leukocytes and platelets. Clin. Hemorheol. Microcirc. 2008, 39, 303–310. [Google Scholar] [CrossRef] [PubMed]
  49. Fedosov, D.; Gompper, G. White blood cell margination in microcirculation. Soft Matter 2014, 10, 2961–2970. [Google Scholar] [CrossRef] [Green Version]
  50. Pretini, V.; Koenen, M.H.; Kaestner, L.; Fens, M.H.A.M.; Schiffelers, R.M.; Bartels, M.; Van Wijk, R. Red Blood Cells: Chasing Interactions. Front. Physiol. 2019, 10, 945. [Google Scholar] [CrossRef] [Green Version]
  51. Nemeth, N.; Sogor, V.; Kiss, F.; Ulker, P. Interspecies diversity of erythrocyte mechanical stability at various combinations in magnitude and duration of shear stress, and osmolality. Clin. Hemorheol. Microcirc. 2016, 63, 381–398. [Google Scholar] [CrossRef] [PubMed] [Green Version]
  52. Holm, T.M.; Braun, A.; Trigatti, B.L.; Brugnara, C.; Sakamoto, M.; Krieger, M.; Andrews, N.C. Failure of red blood cell maturation in mice with defects in the high-density lipoprotein receptor SR-BI. Blood 2002, 99, 1817–1824. [Google Scholar] [CrossRef]
  53. Meurs, I.; Hoekstra, M.; van Wanrooij, E.J.; Hildebrand, R.B.; Kuiper, J.; Kuipers, F.; Hardeman, M.R.; Van Berkel, T.J.; Van Eck, M. HDL cholesterol levels are an important factor for determining the lifespan of erythrocytes. Exp. Hematol. 2005, 33, 1309–1319. [Google Scholar] [CrossRef] [PubMed]
  54. van Zwieten, R.; Bochem, A.E.; Hilarius, P.M.; van Bruggen, R.; Bergkamp, F.; Hovingh, G.K.; Verhoeven, A.J. The cholesterol content of the erythrocyte membrane is an important determinant of phosphatidylserine exposure. Biochim. Biophys. Acta 2012, 1821, 1493–1500. [Google Scholar] [CrossRef] [PubMed]
  55. Unruh, D.; Srinivasan, R.; Benson, T.; Haigh, S.; Coyle, D.; Batra, N.; Keil, R.; Sturm, R.; Blanco, V.; Palascak, M.; et al. Red blood cell dysfunction induced by high-fat diet: Potential implications for obesity-related atherosclerosis. Circulation 2015, 132, 1898–1908. [Google Scholar] [CrossRef] [Green Version]
  56. Koter, M.; Franiak, I.; Strychalska, K.; Broncel, M.; Chojnowska-Jezierska, J. Damage to the structure of erythrocyte plasma membranes in patients with type-2 hypercholesterolemia. Int. J. Biochem. Cell Biol. 2004, 36, 205–215. [Google Scholar] [CrossRef]
  57. Manno, S.; Takakuwa, Y.; Mohandas, N. Identification of a functional role for lipid asymmetry in biological membranes: Phosphatidylserine-skeletal protein interactions modulate membrane stability. Proc. Natl. Acad. Sci. USA 2002, 99, 1943–1948. [Google Scholar] [CrossRef] [Green Version]
  58. Lee, C.Y.; Kim, K.C.; Park, H.W.; Song, J.H.; Lee, C.H. Rheological properties of erythrocytes from male hypercholesterolemia. Microvasc. Res. 2004, 67, 133–138. [Google Scholar] [CrossRef] [PubMed]
  59. da Silva Garrote-Filho, M.; Bernardino-Neto, M.; Penha-Silva, N. Influence of erythrocyte membrane stability in atherosclerosis. Curr. Atheroscler. Rep. 2017, 19, 17. [Google Scholar] [CrossRef]
  60. Vayá, A.; Riveram, L.; de la Espriella, R.; Sanchez, F.; Suescun, M.; Hernandez, J.L.; Fácila, L. Red blood cell distribution width and erythrocyte deformability in patients with acute myocardial infarction. Clin. Hemorheol. Microcirc. 2015, 59, 107–114. [Google Scholar] [CrossRef] [PubMed]
  61. Maj, D.; Bieniek, J.; Łapa, P.; Sternstein, I. The effect of crossing New Zealand White with Californian rabbits on growth and slaughter traits. Arch. Anim. Breed. 2009, 52, 205–211. [Google Scholar] [CrossRef]
  62. Matrai, A.; Whittington, R.B.; Ernst, E. A simple method of estimating whole blood viscosity at standardized hematocrit. Clin. Hemorheol. 1987, 7, 261–265. [Google Scholar] [CrossRef]
  63. Hardeman, M.; Goedhart, P.; Shin, S. Methods in hemorheology. In Handbook of Hemorheology and Hemodynamics; Baskurt, O.K., Hardeman, M.R., Rampling, M.W., Meiselman, H.J., Eds.; IOS Press: Amsterdam, The Netherlands, 2007; pp. 242–266. [Google Scholar]
  64. Baskurt, O.K.; Hardeman, M.R.; Uyuklu, M.; Ulker, P.; Cengiz, M.; Nemeth, N.; Shin, S.; Alexy, T.; Meiselman, H.J. Parameterization of red blood cell elongation index--shear stress curves obtained by ektacytometry. Scand. J. Clin. Lab. Investig. 2009, 69, 777–788. [Google Scholar] [CrossRef] [PubMed]
  65. Sogor, V.; Tanczos, B.; Deak, A. Data interpretation of erythrocyte membrane mechanical stability test using the laser-assisted optical rotational cell analyzer. Ser. Biomech. 2016, 30, 27–34. [Google Scholar]
Figure 1. (A): whole blood viscosity corrected to 40% hematocrit (WBV [mPas]) and (B): plasma viscosity (PV [mPas]) values in the Control and the atherogenic groups (HC). Means ± SEM; * p < 0.05 vs. Control.
Metabolites 11 00249 g001
Figure 2. The red blood cell aggregation indices (A): M 5 s, (B): M1 5 s, (C): M 10 s, (D): M1 10 s [au]) measured by the Myrenne MA-1 aggregometer in the Control and the atherogenic group (HC). In M mode (shear rate = 0 s−1) and M1 mode (shear rate = 3 s−1) the index values are expressed at the 5th or at the 10th second of the aggregation. Means ± SEM; * p < 0.05 vs. Control.
Metabolites 11 00249 g002
Figure 3. The red blood cell aggregation parameters measured by LoRRca rotational ectacytometer in the Control and the atherogenic group (HC). (A): aggregation index (AI [%]), (B): amplitude (Amp [au]) of the aggregation syllectogram (maximal-minimal intensity), (C): t1/2 [s] representing the aggregation time at half Amp. Means ± SEM; * p < 0.05 vs. Control.
Metabolites 11 00249 g003
Figure 4. The red blood cell deformability describing elongation index (EI [au]) in the function of shear stress (SS [Pa]) of the Control and the atherogenic groups (HC); Means ± SEM; * p < 0.05 vs. Control.
Metabolites 11 00249 g004
Figure 5. Elongation index (EI [au])—shear stress (SS [Pa]) curves in the mechanical stability test: before and after applying mechanical stress (100 Pa for 300 s) on the samples of the Control (A) and the atherogenic (HC) group (B). Means ± SEM; * p < 0.05 vs. before mechanical stress; # p < 0.05 vs. Control.
Metabolites 11 00249 g005
Figure 6. The timeline of the study.
Metabolites 11 00249 g006
Table 1. Hematology parameters in the Control and the atherogenic groups (HC). Means ± SEM.
Hematological
Parameter
Control
(n = 6)
HC
(n = 6)
p Value
vs. Control
White blood cell count [×109/L]8.375 ± 0.27023.59 ± 4.7620.0042
Red blood cell count [×1012/L]6.863 ± 0.1253.758 ± 0.245<0.0001
Hemoglobin [g/dL]15.25 ± 0.2728.392 ± 0.558<0.0001
Hematocrit [%]46.37 ± 0.92929.38 ± 1.729<0.0001
Mean corpuscular volume [fL]67.58 ± 0.47278.88 ± 2.4260.0001
Mean corpuscular hemoglobin [pg]22.22 ± 0.25822.50 ± 0.757n.s.
Mean corpuscular hemoglobin
concentration [g/L]
32.90 ± 0.27028.82 ± 1.2700.0047
Platelet count [×109/L]254.8 ± 27.54481.5 ± 38.73<0.0001
Table 2. The red blood cell deformability measurements in the Control and the atherogenic groups (HC). EI at 3 Pa: elongation index at shear stress of 3 Pa, EImax: the maximal elongation index, SS1/2: shear stress belonging to the half of EImax. Mean ± SEM.
ParameterControlHCp Value vs. Control
EI at 3Pa0.591 ± 0.0090.448 ± 0.051<0.0001
EImax0.397± 0.0110.298 ± 0.043<0.0001
SS1/2 [Pa]1.544 ± 0.1722.125 ± 0.6330.0272
EImax/SS1/2 [Pa−1]0.387 ± 0.0440.228 ± 0.0690.0007
Table 3. Comparative parameters of red blood cell membrane stability test before and after applying the mechanical stress (100 Pa for 300 s). EI at 3 Pa: elongation index at shear stress of 3 Pa, EImax: maximal elongation index, SS1/2: shear stress belonging to the half of EImax. Mean ± SEM.
ParameterTestControlHCp Value vs. Control,
or vs. before (* Control, # HC)
EI at 3Pabefore (B)0.392 ± 0.0020.318 ± 0.0150.002
after (A)0.360 ± 0.008 *0.235 ± 0.019 #0.0015; * 0.002; # 0.006
ratio (A/B)0.919 ± 0.0190.734 ± 0.038<0.0001
EImaxbefore (B)0.592 ± 0.0030.461 ± 0.017<0.0001
after (A)0.595 ± 0.0040.458 ± 0.011<0.0001
ratio (A/B)1.005 ± 0.0070.999 ± 0.033ns
SS½ [Pa]before (B)1.690 ± 0.0811.977 ± 0.227ns
after (A)1.960 ± 0.1494.540 ± 0.875 #0.009; # 0.018
ratio (A/B)1.169 ± 0.0892.228 ± 0.2800.001
EImax/SS1/2 [Pa−1]before (B)0.355 ± 0.0210.249 ± 0.0280.012
after (A)0.311 ± 0.0190.124 ± 0.025 #0.0318; # 0.002
ratio (A/B)0.883 ± 0.0620.484 ± 0.062<0.0001
Publisher’s Note: MDPI stays neutral with regard to jurisdictional claims in published maps and institutional affiliations.

