
L-Carnitine Stimulates In Vivo Carbohydrate Metabolism in the Type 1 Diabetic Heart as Demonstrated by Hyperpolarized MRI

 ,
,  ,
, 
Abstract
:
1. Introduction
2. Results
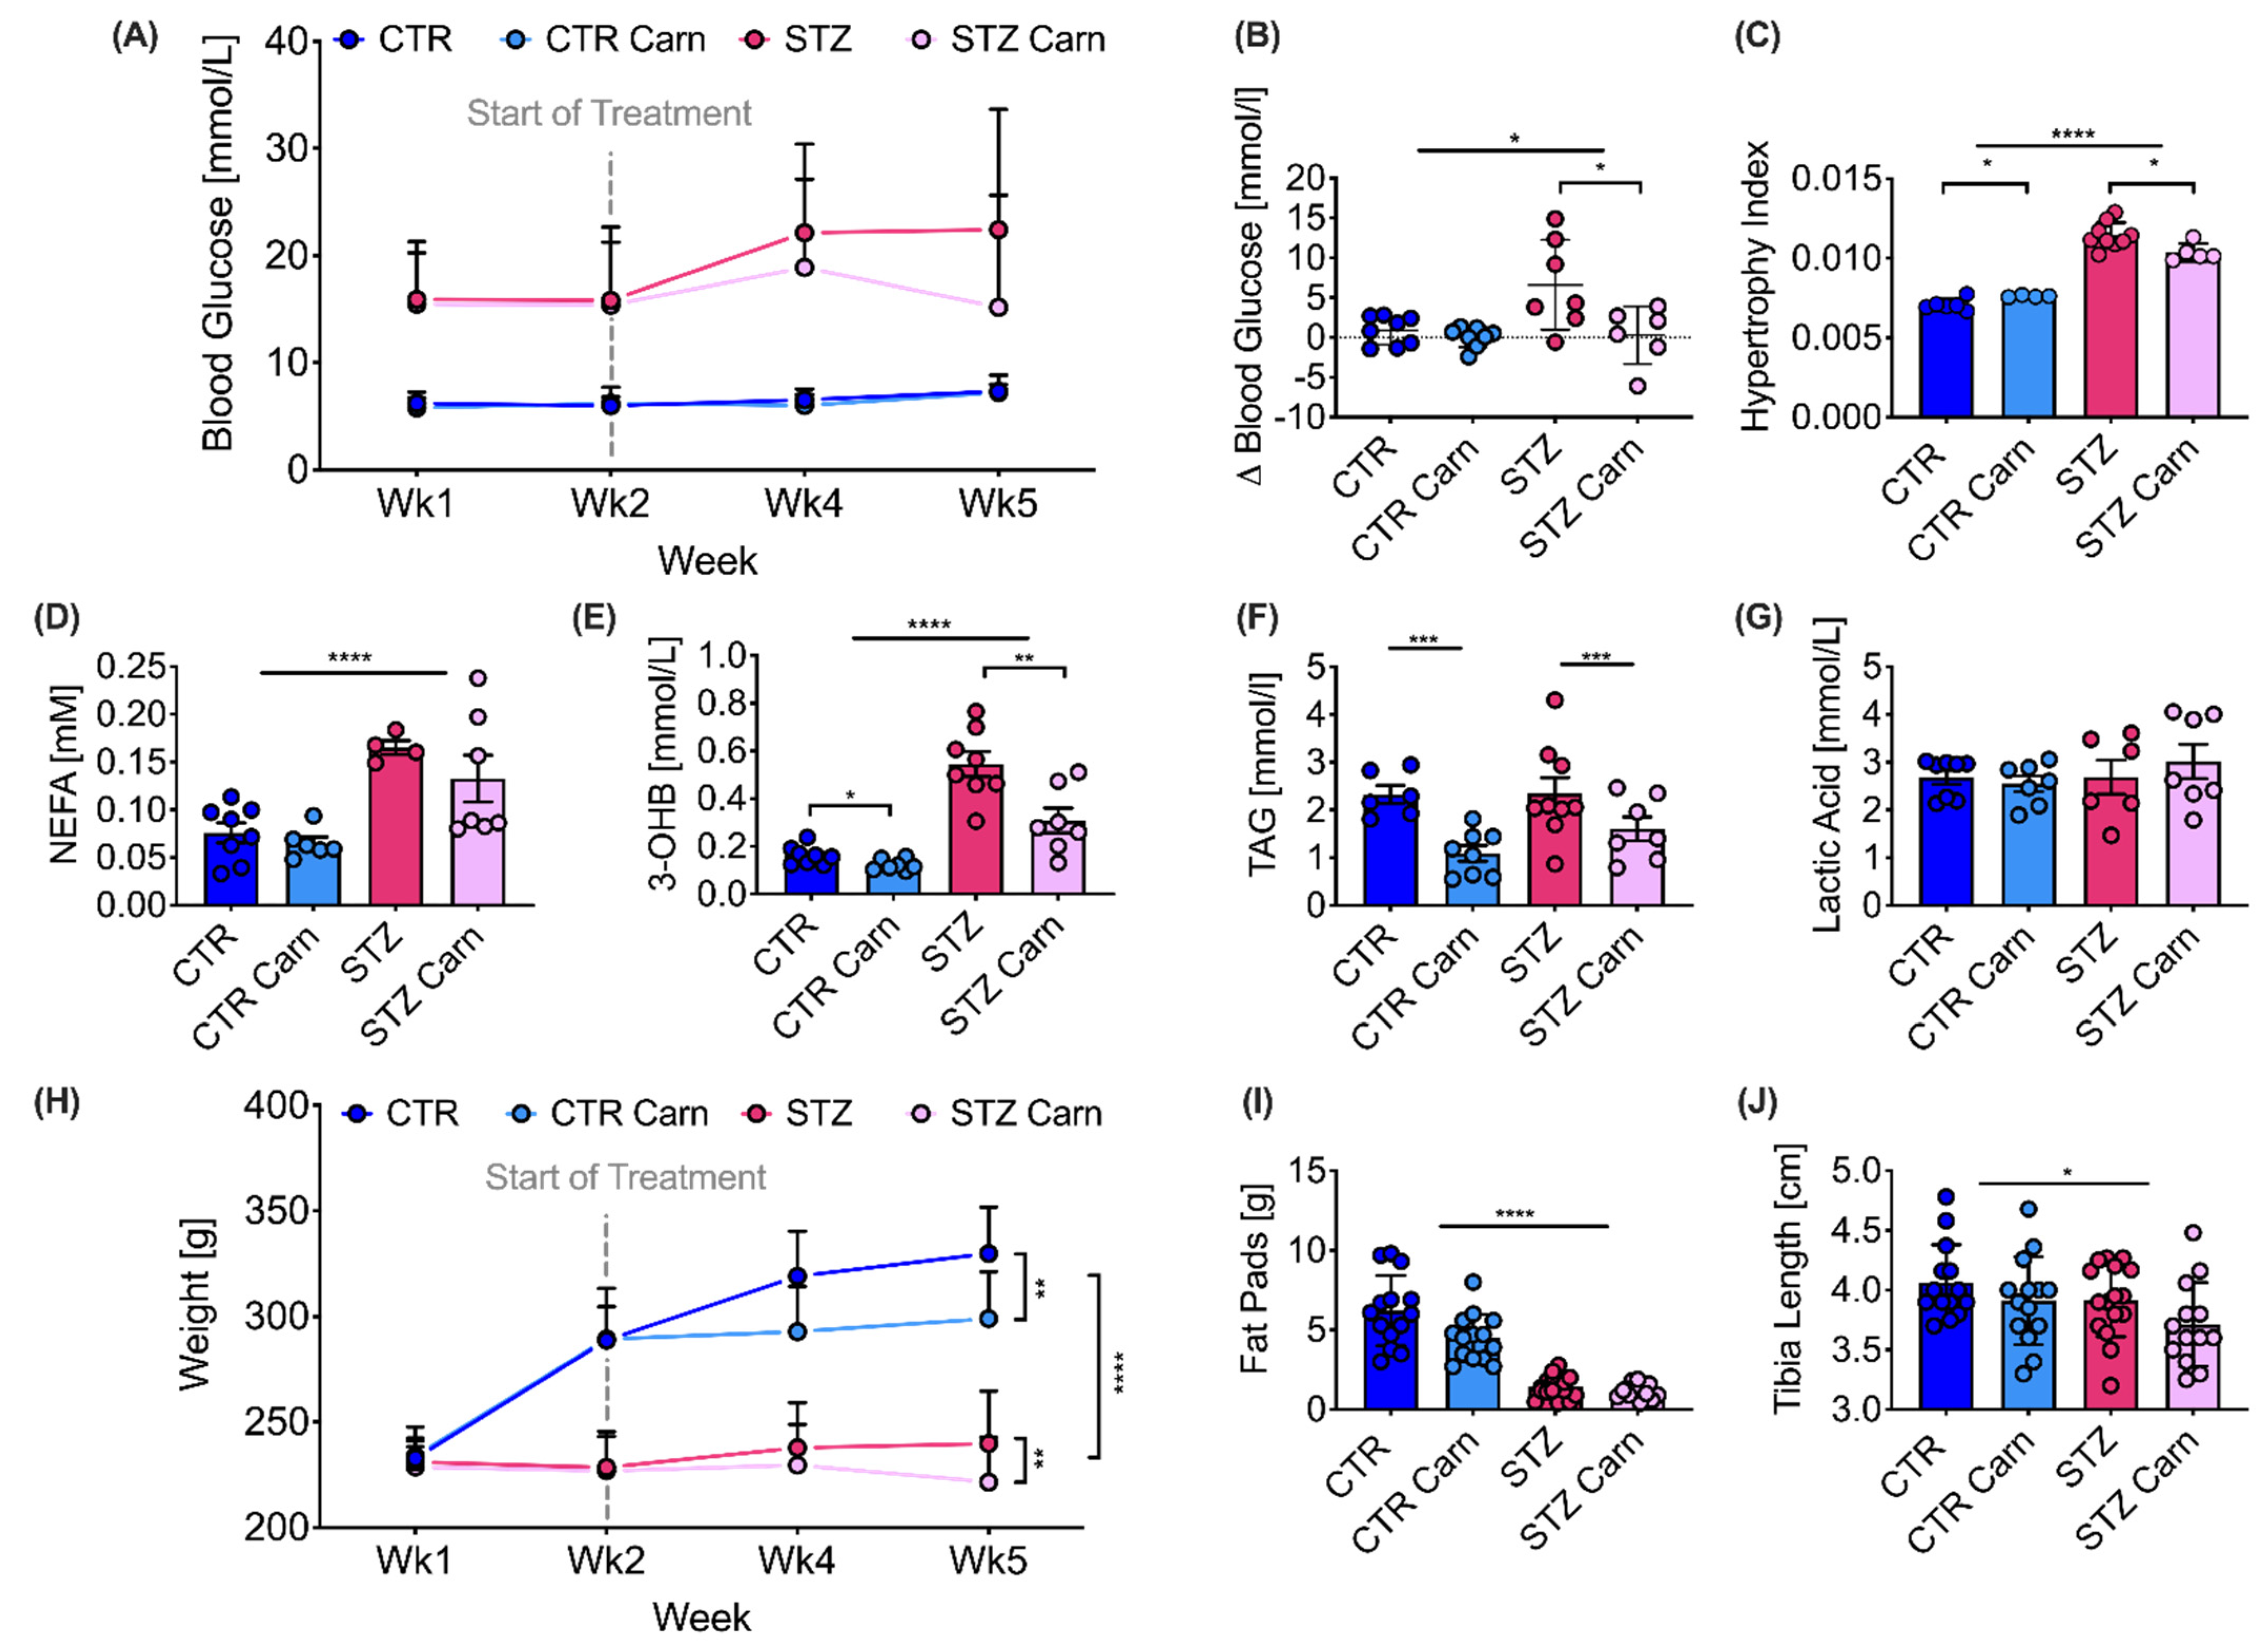
2.1. Animal Characterization
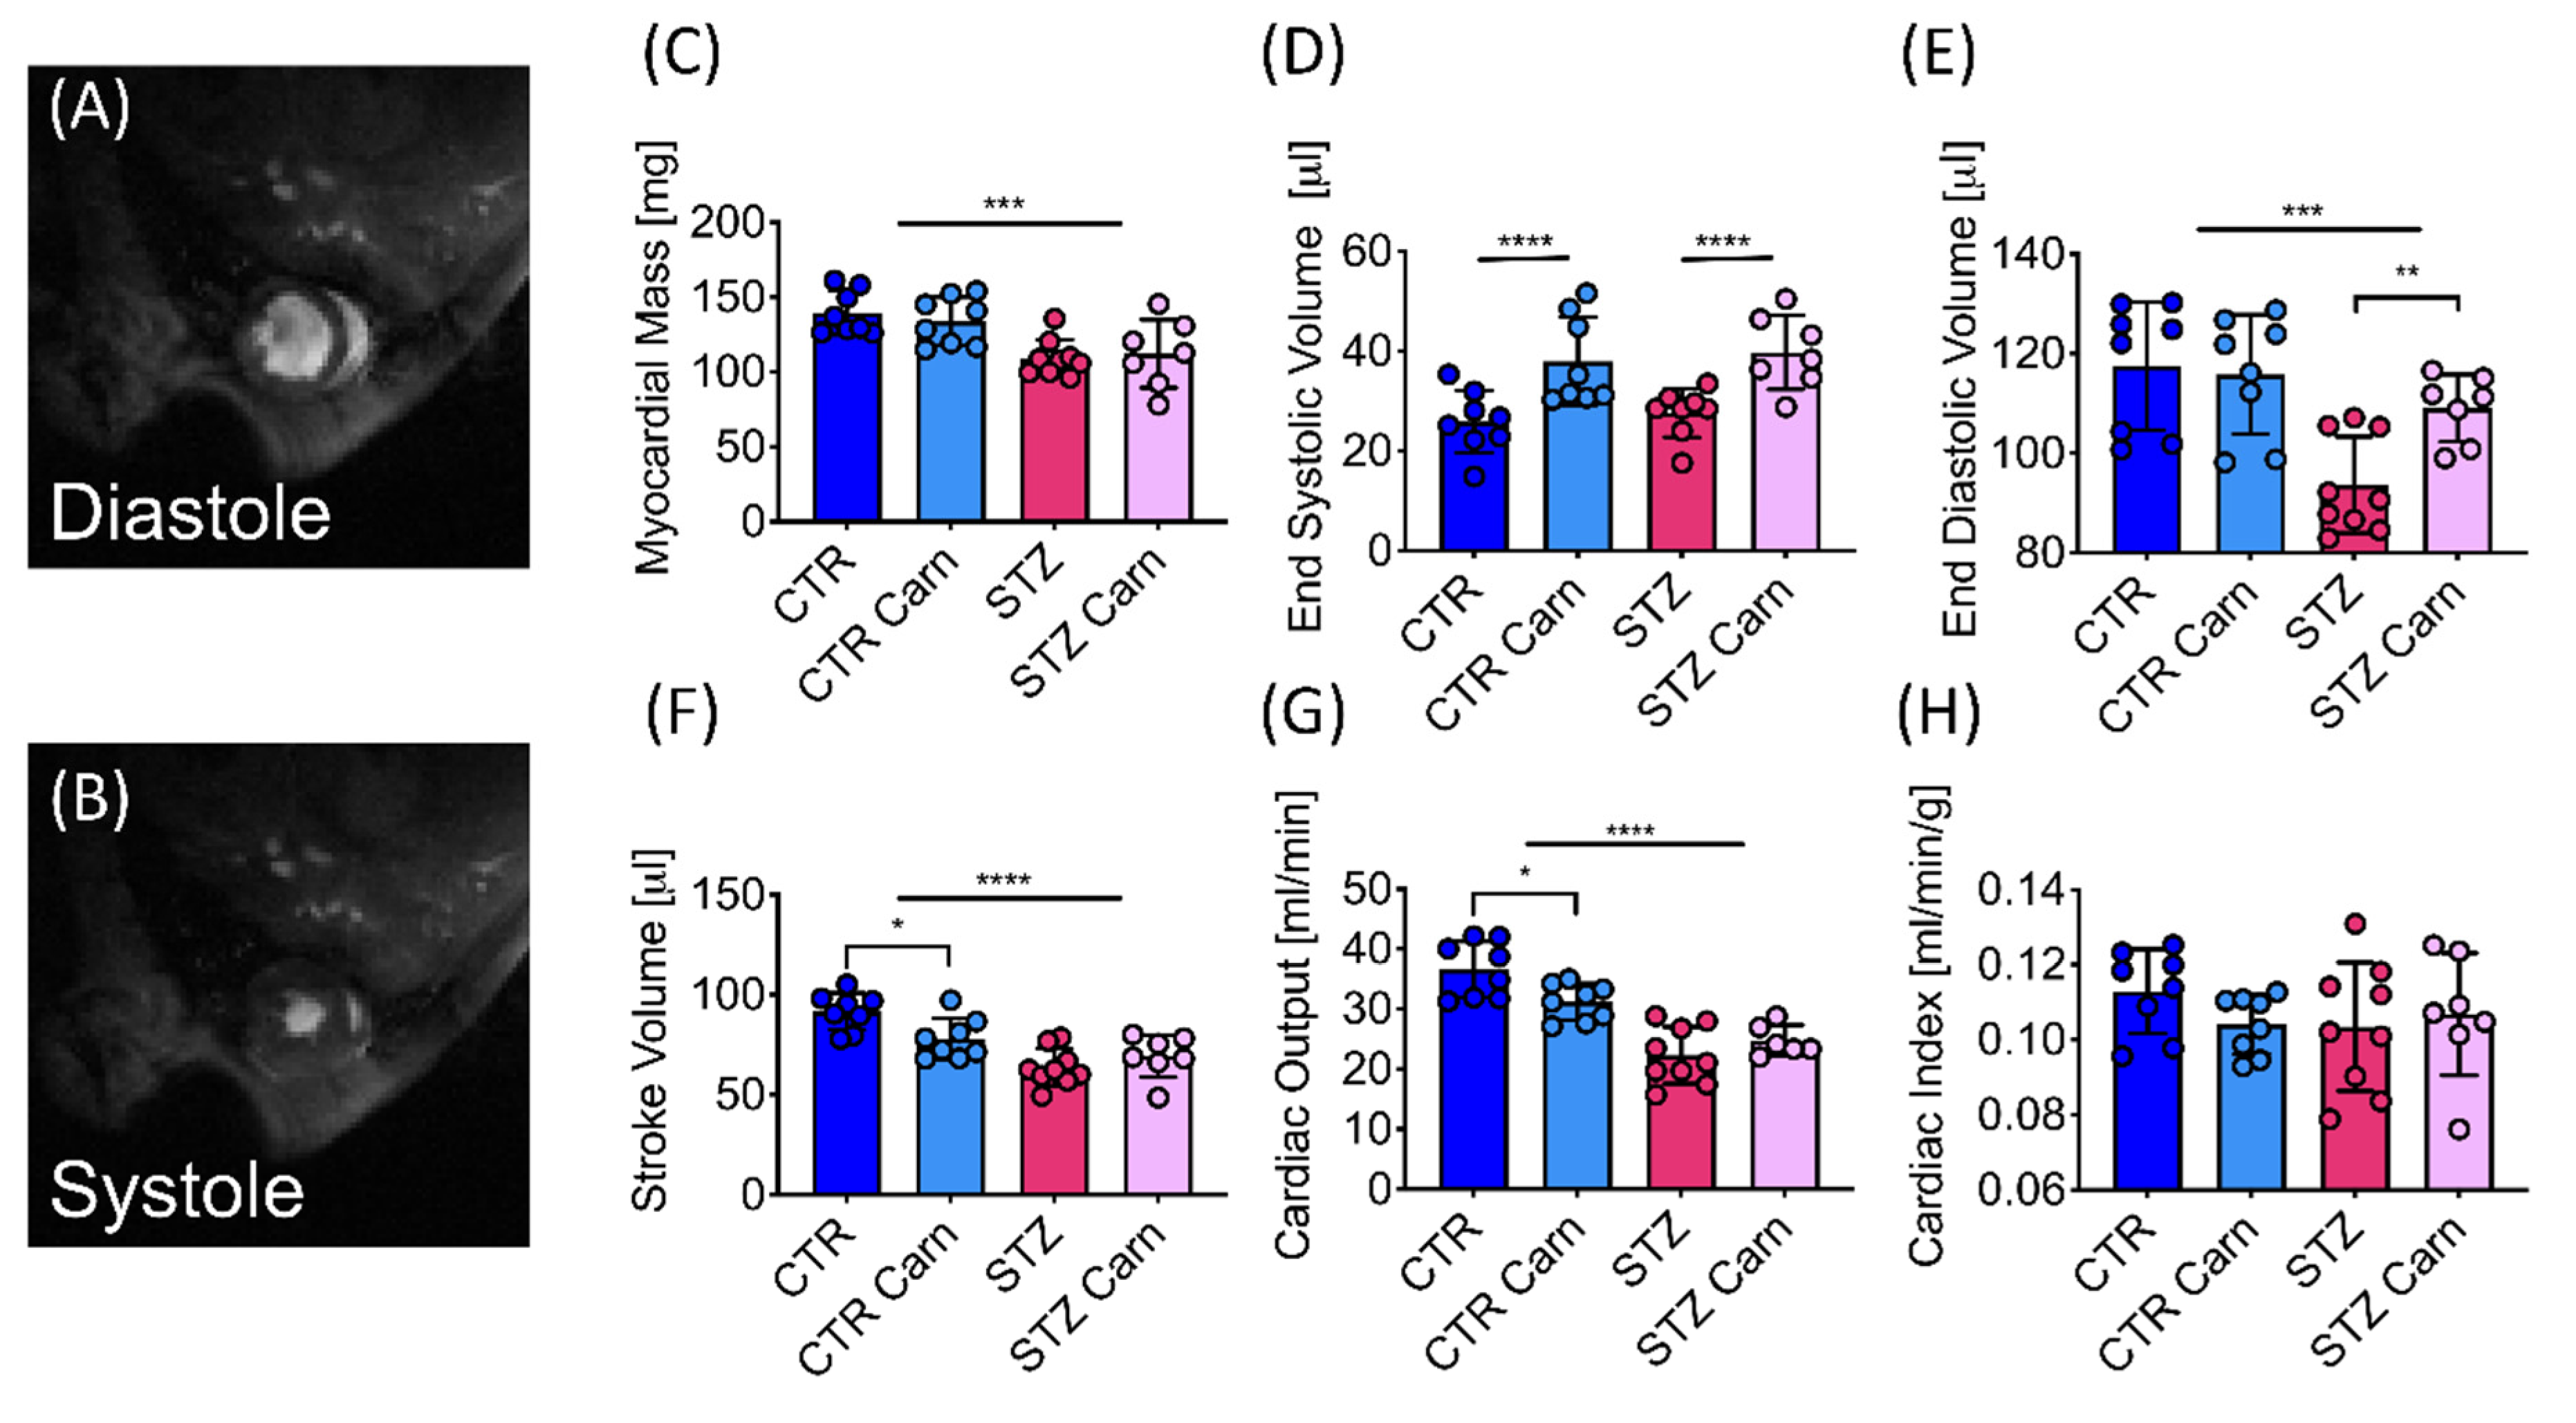
2.2. Cardiac Function
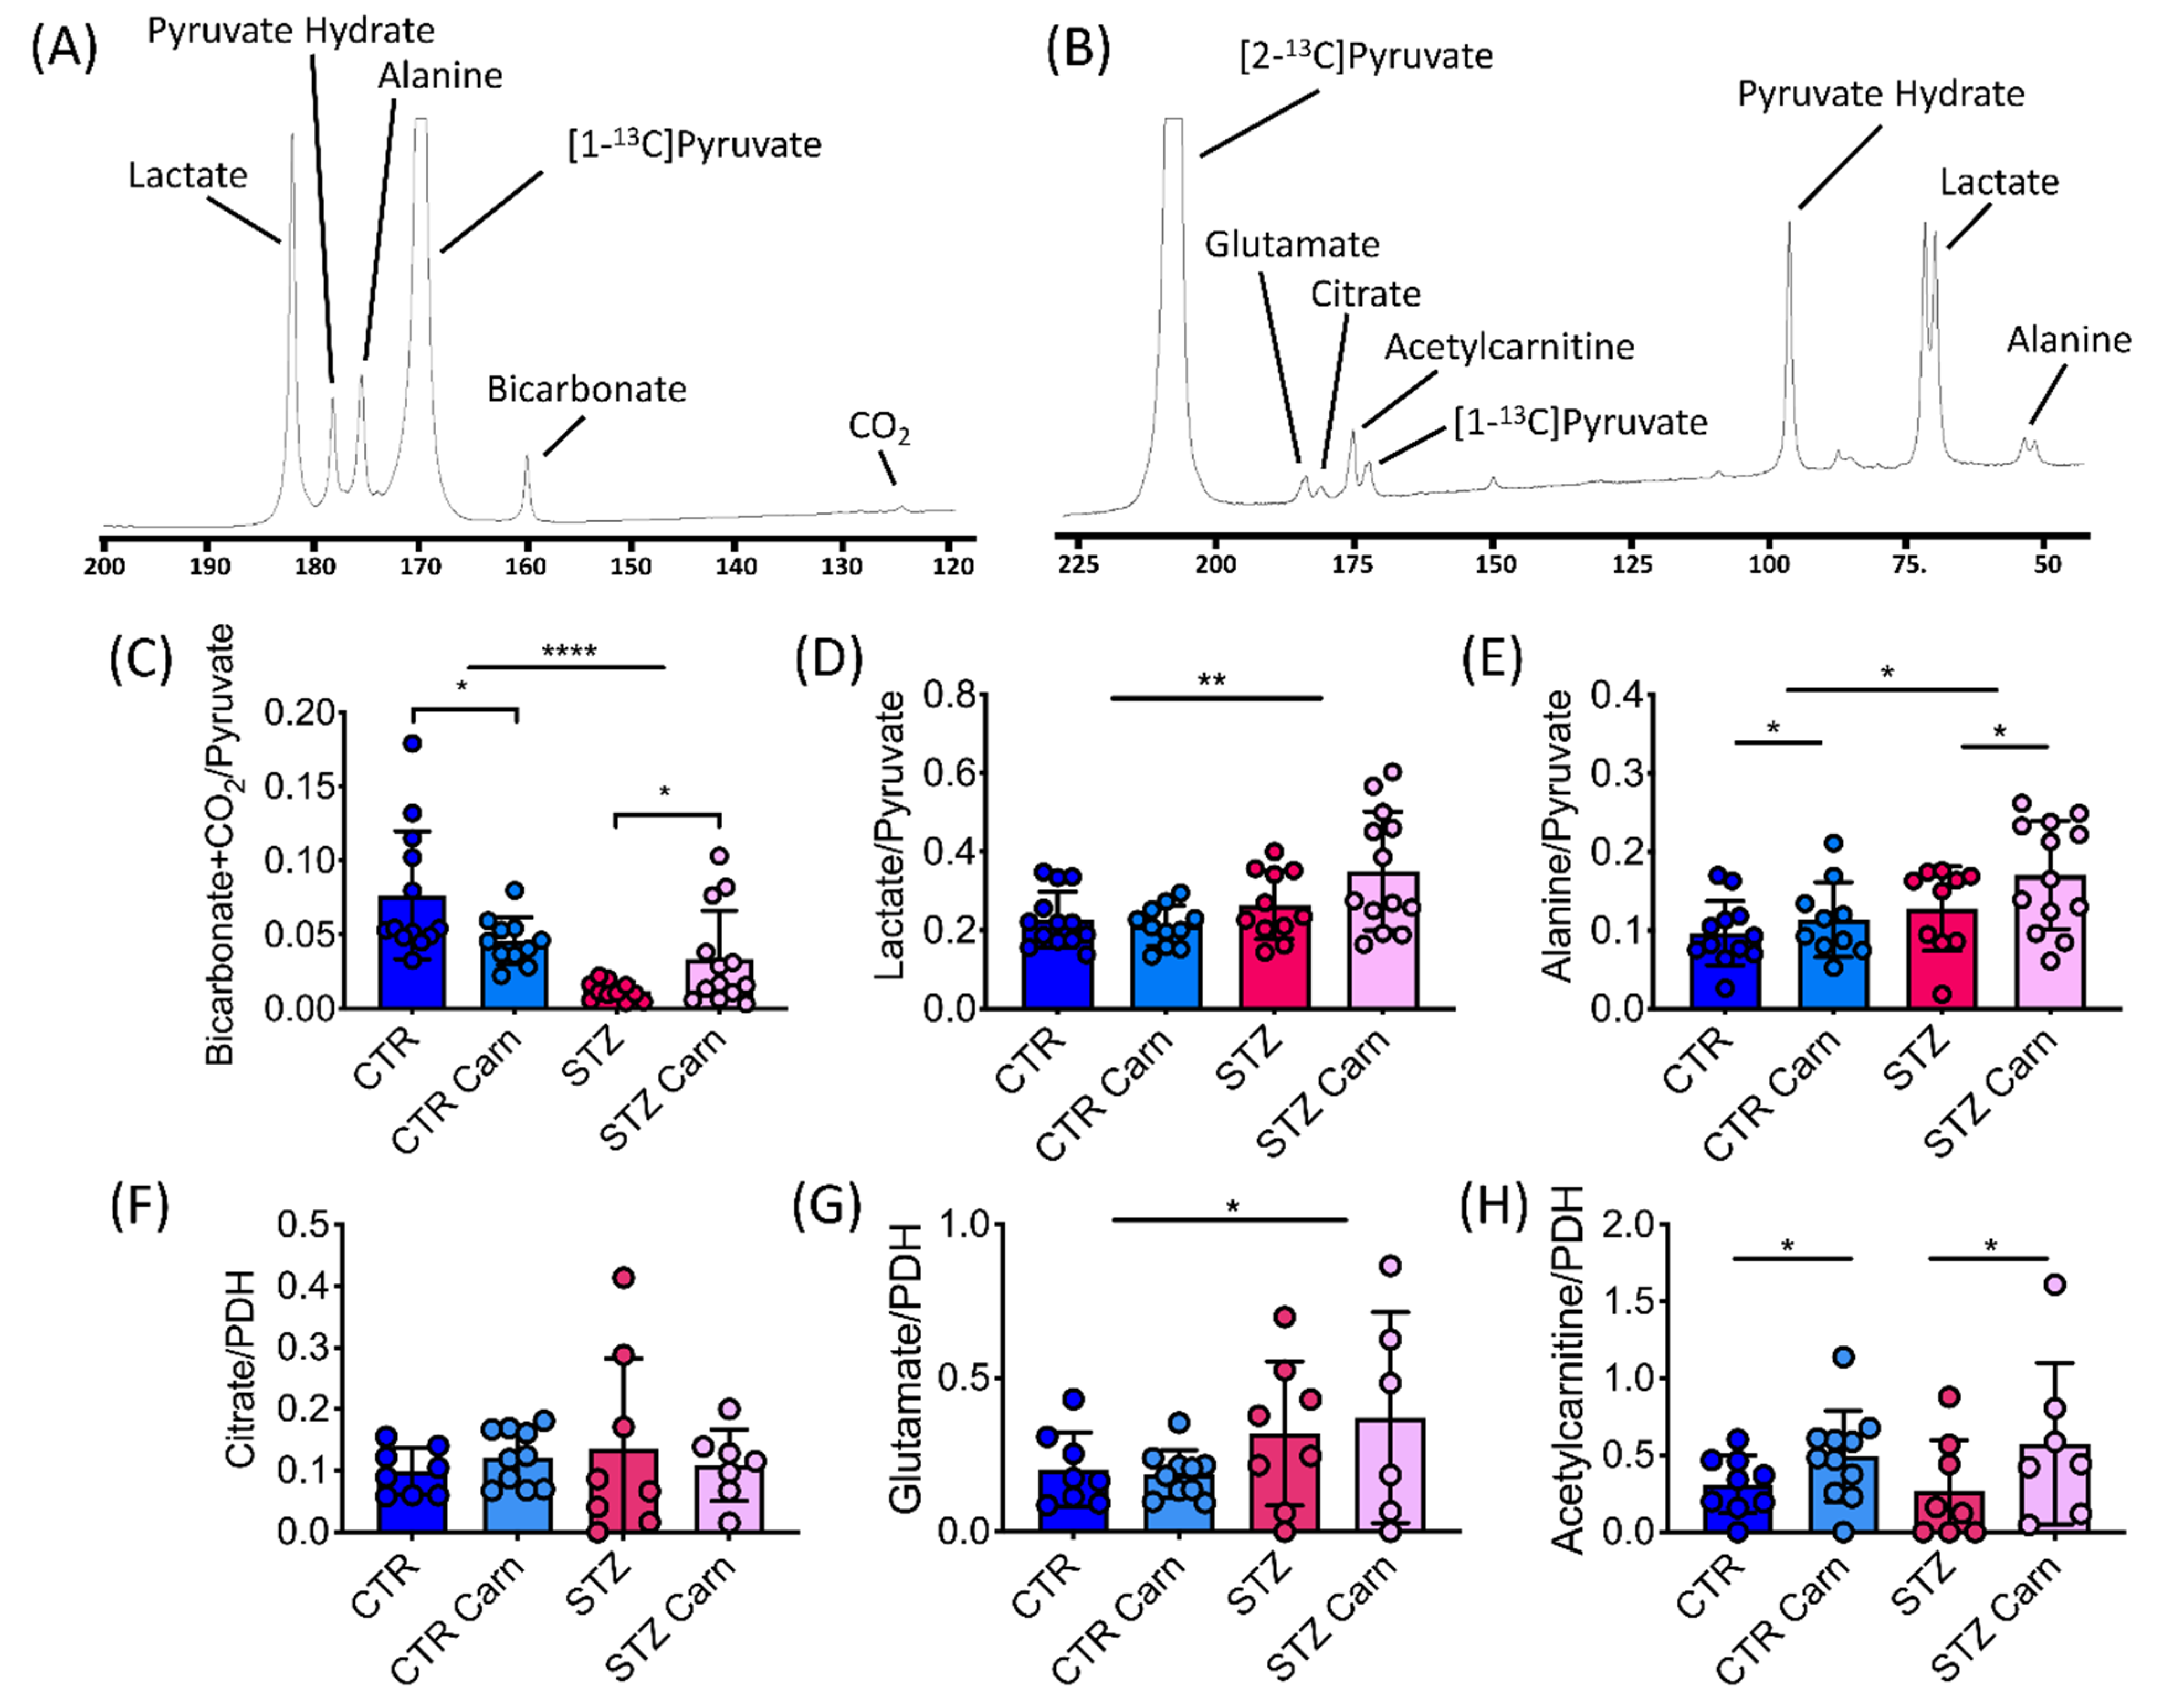
2.3. Cardiac Metabolism
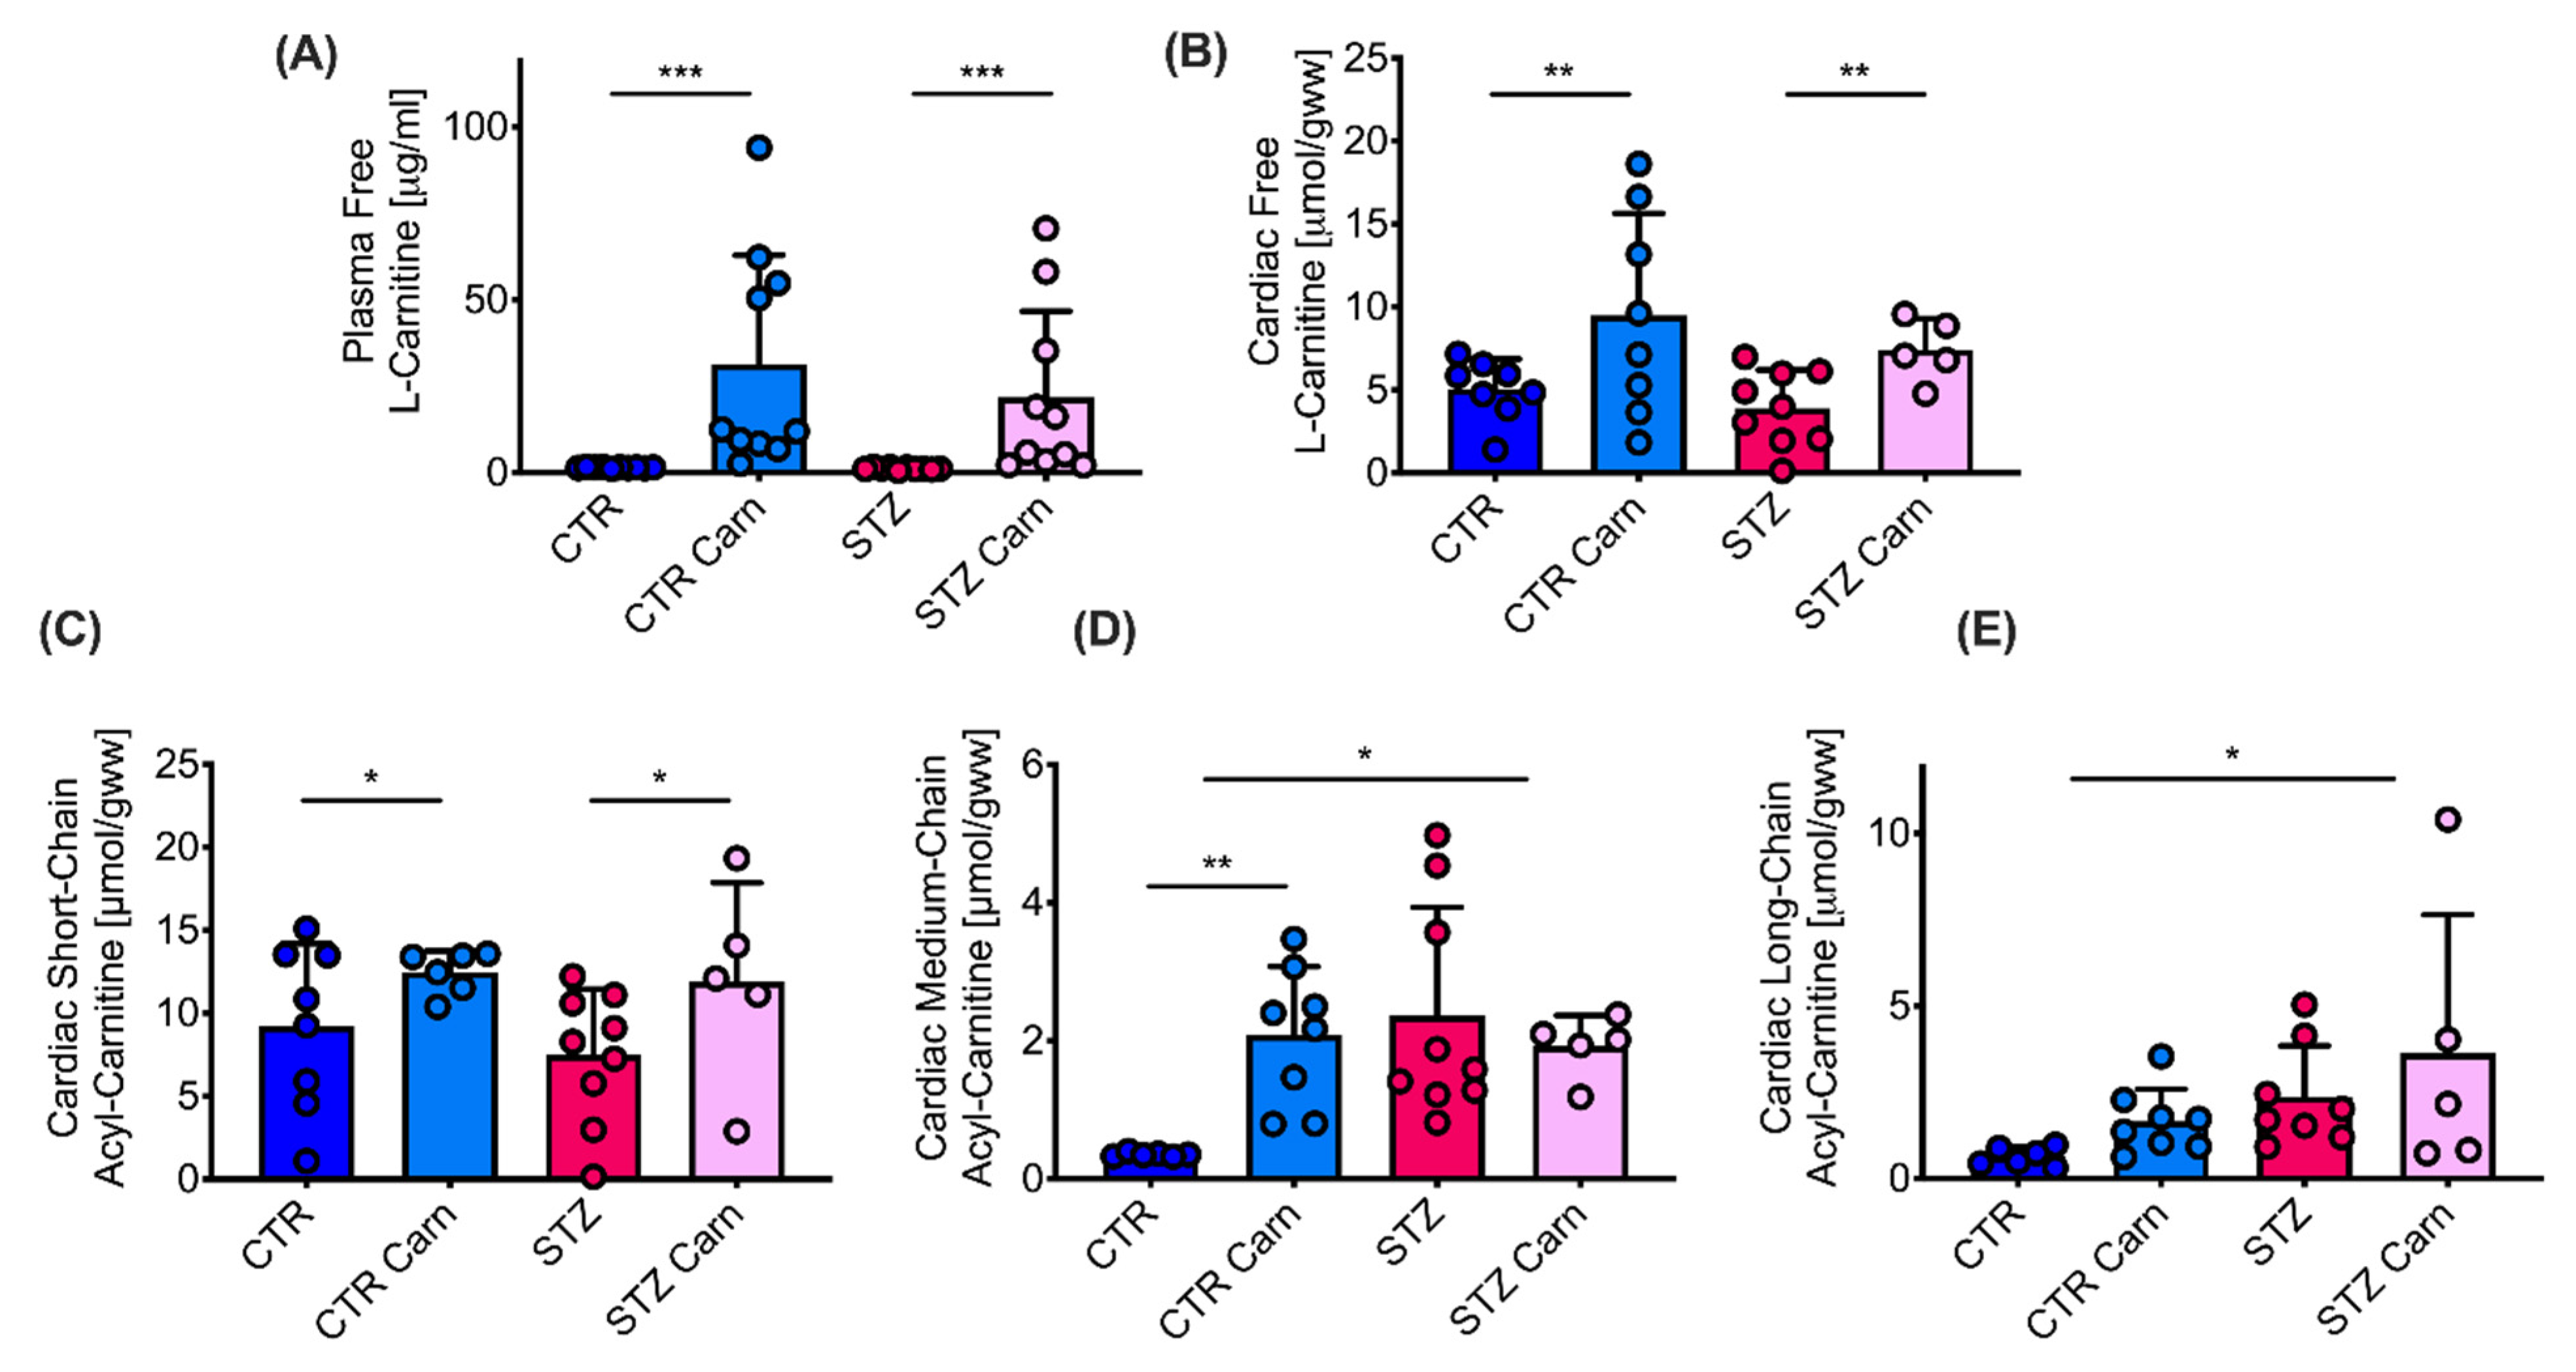
2.4. Carnitine/Acyl Carnitine Levels
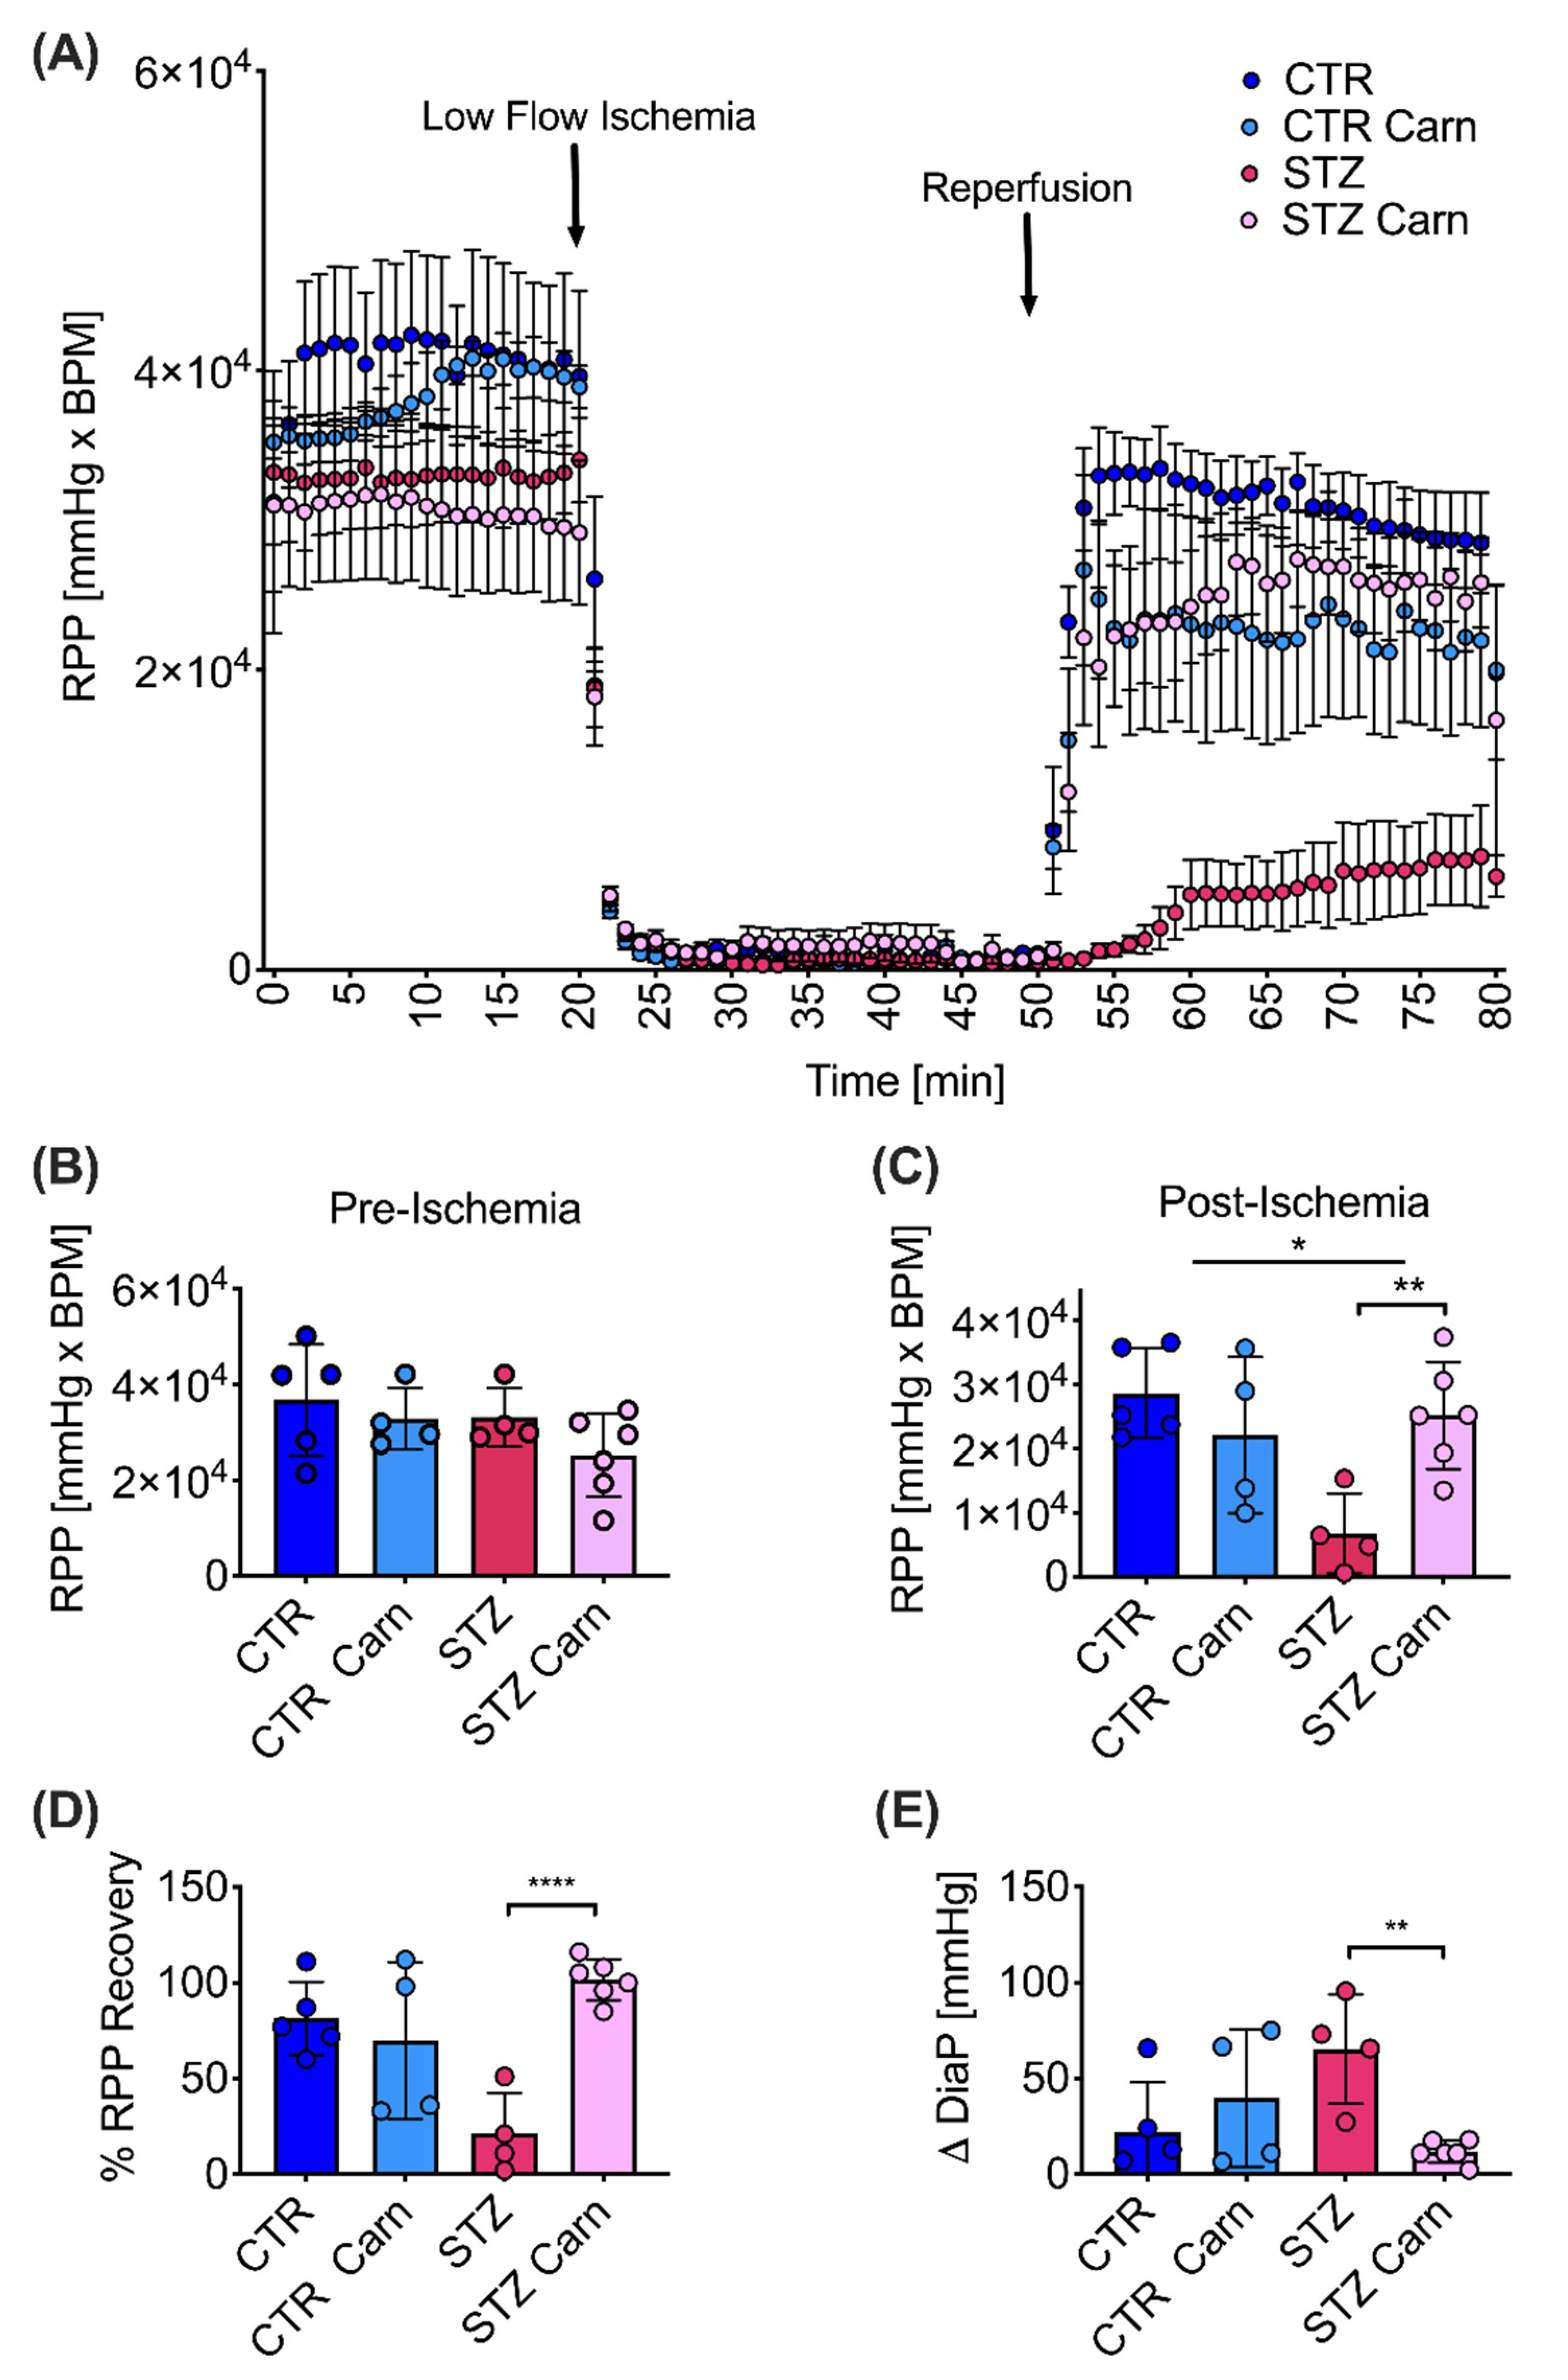
2.5. Post-Ischemic Recovery
3. Discussion
Study Limitations
4. Materials and Methods
4.1. Animal Protocol
4.2. CINE Magnetic Resonance Imaging (MRI)
4.3. Hyperpolarized Magnetic Resonance Spectroscopy (MRS)
4.4. Langendorff Perfusion
4.5. Blood Metabolites
4.6. Cardiac Tissue Metabolomics
4.7. Statistics
5. Conclusions
Author Contributions
Funding
Institutional Review Board Statement
Informed Consent Statement
Data Availability Statement
Acknowledgments
Conflicts of Interest
References
- Soedamah-Muthu, S.S.; Fuller, J.H.; Mulnier, H.E.; Raleigh, V.S.; Lawrenson, R.A.; Colhoun, H.M. High Risk of Cardiovascular Disease in Patients With Type 1 Diabetes in the U.K.: A cohort study using the General Practice Research Database. Diabetes Care 2006, 29, 798–804. [Google Scholar] [CrossRef] [Green Version]
- Leon, B.M. Diabetes and cardiovascular disease: Epidemiology, biological mechanisms, treatment recommendations and future research. World J. Diabetes 2015, 6, 1246–1258. [Google Scholar] [CrossRef]
- Isfort, M.; Stevens, S.C.W.; Schaffer, S.; Jong, C.J.; Wold, L.E. Metabolic dysfunction in diabetic cardiomyopathy. Heart Fail. Rev. 2013, 19, 35–48. [Google Scholar] [CrossRef] [PubMed] [Green Version]
- Scheuermann-Freestone, M.; Madsen, P.L.; Manners, D.; Blamire, A.M.; Buckingham, R.E.; Styles, P.; Radda, G.K.; Neubauer, S.; Clarke, K. Abnormal Cardiac and Skeletal Muscle Energy Metabolism in Patients With Type 2 Diabetes. Circulation 2003, 107, 3040–3046. [Google Scholar] [CrossRef]
- Murashige, D.; Jang, C.; Neinast, M.; Edwards, J.J.; Cowan, A.; Hyman, M.C.; Rabinowitz, J.D.; Frankel, D.S.; Arany, Z. Comprehensive quantification of fuel use by the failing and nonfailing human heart. Science 2020, 370, 364–368. [Google Scholar] [CrossRef]
- Doenst, T.; Nguyen, T.D.; Abel, E.D. Cardiac metabolism in heart failure: Implications beyond ATP production. Circ. Res. 2013, 113, 709–724. [Google Scholar] [CrossRef] [Green Version]
- Lopaschuk, G.D.; Ussher, J.R.; Folmes, C.D.L.; Jaswal, J.S.; Stanley, W.C. Myocardial metabolism of fatty acids. J. Clin. Investig. 1960, 39, 717–723. [Google Scholar]
- Schulze, P.C.; Drosatos, K.; Goldberg, I.J. Lipid Use and Misuse by the Heart. Circ. Res. 2016, 118, 1736–1751. [Google Scholar] [CrossRef] [Green Version]
- la Marca, G.; Malvagia, S.; Toni, S.; Piccini, B.; Di Ciommo, V.; Bottazzo, G.F. Children who develop type 1 diabetes early in life show low levels of carnitine and amino acids at birth: Does this finding shed light on the etiopathogenesis of the disease? Nutr. Diabetes 2013, 3, e94. [Google Scholar] [CrossRef] [PubMed]
- Mamoulakis, D.; Galanakis, E.; Dionyssopoulou, E.; Evangeliou, A.; Sbyrakis, S. Carnitine deficiency in children and adolescents with type 1 diabetes. J. Diabetes Complicat. 2004, 18, 271–274. [Google Scholar] [CrossRef]
- Savic, D.; Ball, V.; Holzner, L.; Hauton, D.; Timm, K.N.; Curtis, M.K.; Heather, L.C.; Tyler, D.J. Hyperpolarized magnetic resonance shows that the anti-ischemic drug meldonium leads to increased flux through pyruvate dehydrogenase in vivo resulting in improved post-ischemic function in the diabetic heart. NMR Biomed. 2021, 34, e4471. [Google Scholar] [CrossRef]
- DiNicolantonio, J.J.; Lavie, C.J.; Fares, H.; Menezes, A.R.; O’Keefe, J.H. L-Carnitine in the Secondary Prevention of Cardiovascular Disease: Systematic Review and Meta-analysis. Mayo Clin. Proc. 2013, 88, 544–551. [Google Scholar] [CrossRef] [Green Version]
- Wittels, B.; Bressler, R. Biochemical Lesion of Diphtheria Toxin in the Heart. J. Clin. Investig. 1964, 43, 630–637. [Google Scholar] [CrossRef] [PubMed]
- Mansor, L.S.; Fialho, M.D.L.S.; Yea, G.; Coumans, W.A.; West, J.A.; Kerr, M.; Carr, C.A.; Luiken, J.J.; Glatz, J.F.; Evans, R.D.; et al. Inhibition of sarcolemmal FAT/CD36 by sulfo-N-succinimidyl oleate rapidly corrects metabolism and restores function in the diabetic heart following hypoxia/reoxygenation. Cardiovasc. Res. 2017, 113, 737–748. [Google Scholar] [CrossRef] [PubMed]
- Kanter, J.E.; Kramer, F.; Barnhart, S.; Averill, M.M.; Vivekanandan-Giri, A.; Vickery, T.; Li, L.O.; Becker, L.; Yuan, W.; Chait, A.; et al. Diabetes promotes an inflammatory macrophage phenotype and atherosclerosis through acyl-CoA synthetase 1. Proc. Natl. Acad. Sci. USA 2012, 109, E715–E724. [Google Scholar] [CrossRef] [Green Version]
- Miguel-Carrasco, J.L.; Mate, A.; Monserrat, M.T.; Arias, J.L.; Aramburu, O.; Vázquez, C.M. The Role of Inflammatory Markers in the Cardioprotective Effect of L-Carnitine in L-NAME-Induced Hypertension. Am. J. Hypertens. 2008, 21, 1231–1237. [Google Scholar] [CrossRef] [PubMed] [Green Version]
- Duranay, M.; Akay, H.; Yilmaz, F.M.; Şeneş, M.; Tekeli, N.; Yücel, D. Effects of L-carnitine infusions on inflammatory and nutritional markers in haemodialysis patients. Nephrol. Dial. Transplant. 2006, 21, 3211–3214. [Google Scholar] [CrossRef] [PubMed]
- Iliceto, S.; Scrutinio, D.; Bruzzi, P.; D’Ambrosio, G.; Boni, A.; Di Biase, M.; Biasco, G.; Hugenholtz, P.; Rizzon, P. Effects of l-carnitine administration on left ventricular remodeling after acute anterior myocardial infarction: The l-Carnitine Ecocardiografia Digitalizzata Infarto Miocardico (CEDIM) trial. J. Am. Coll. Cardiol. 1995, 26, 380–387. [Google Scholar] [CrossRef] [Green Version]
- Rodrigues, B.; Xiang, H.; Mcneill, J.H. Effect of L-Carnitine Treatment on Lipid Metabolism and Cardiac Performance in Chronically Diabetic Rats. Diabetes 1988, 37, 1358–1364. [Google Scholar] [CrossRef]
- Ardenkjaer-Larsen, J.H.; Fridlund, B.; Gram, A.; Hansson, L.; Lerche, M.H.; Servin, R.; Thaning, M.; Golman, K. Increase in signal-to-noise ratio of >10,000 times in liquid-state NMR. Proc. Natl. Acad. Sci. USA 2003, 100, 10158–10163. [Google Scholar] [CrossRef] [Green Version]
- Schroeder, M.A.; Cochlin, L.E.; Heather, L.C.; Clarke, K.; Radda, G.K.; Tyler, D.J. In vivo assessment of pyruvate dehydrogenase flux in the heart using hyperpolarized carbon-13 magnetic resonance. Proc. Natl. Acad. Sci. USA 2008, 105, 12051–12056. [Google Scholar] [CrossRef] [Green Version]
- Paulson, D.J.; Schmidt, M.J.; Traxler, J.S.; Ramacci, M.T.; Shug, A.L. Improvement of myocardial function in diabetic rats after treatment with L-carnitine. Metabolism 1984, 33, 358–363. [Google Scholar] [CrossRef]
- Seymour, A.-M.L.; Chatham, J.C. The Effects of Hypertrophy and Diabetes on Cardiac Pyruvate Dehydrogenase Activity. J. Mol. Cell. Cardiol. 1997, 29, 2771–2778. [Google Scholar] [CrossRef] [PubMed]
- Rohm, M.; Savic, D.; Ball, V.; Curtis, M.K.; Bonham, S.; Fischer, R.; Legrave, N.; Macrae, J.I.; Tyler, D.J.; Ashcroft, F.M. Cardiac Dysfunction and Metabolic Inflexibility in a Mouse Model of Diabetes Without Dyslipidemia. Diabetes 2018, 67, 1057–1067. [Google Scholar] [CrossRef] [PubMed] [Green Version]
- Abdel-Aleem, S.; Sayed-Ahmed, M.; Nada, M.A.; Hendrickson, S.C.; St Louis, J.; Lowe, J.E. Stimulation of non-oxidative glucose utilization by L-carnitine in isolated myocytes. J. Mol. Cell Cardiol. 1995, 27, 2465–2472. [Google Scholar] [CrossRef] [PubMed] [Green Version]
- Broderick, T.; Quinney, H.; Lopaschuk, G. Carnitine stimulation of glucose oxidation in the fatty acid perfused isolated working rat heart. J. Biol. Chem. 1992, 267, 3758–3763. [Google Scholar] [CrossRef]
- Broderick, T.L.; Quinney, H.A.; Lopaschuk, G.D. L-carnitine increases glucose metabolism and mechanical function following ischaemia in diabetic rat heart. Cardiovasc. Res. 1995, 29, 373–378. [Google Scholar] [CrossRef]
- Uziel, G.; Garavaglia, B.; Di Donato, S. Carnitine stimulation of pyruvate dehydrogenase complex (PDHC) in isolated human skeletal muscle mitochondria. Muscle Nerve 1988, 11, 720–724. [Google Scholar] [CrossRef]
- Lewis, A.J.; Neubauer, S.; Tyler, D.J.; Rider, O.J. Pyruvate dehydrogenase as a therapeutic target for obesity cardiomyopathy. Expert Opin. Ther. Targets 2015, 20, 755–766. [Google Scholar] [CrossRef]
- Le Page, L.M.; Rider, O.J.; Lewis, A.J.; Ball, V.; Clarke, K.; Johansson, E.; Carr, C.A.; Heather, L.C.; Tyler, D.J. Increasing Pyruvate Dehydrogenase Flux as a Treatment for Diabetic Cardiomyopathy: A Combined13C Hyperpolarized Magnetic Resonance and Echocardiography Study. Diabetes 2015, 64, 2735–2743. [Google Scholar] [CrossRef] [Green Version]
- Pooyandjoo, M.; Nouhi, M.; Shab-Bidar, S.; Djafarian, K.; Olyaeemanesh, A. The effect of (L-)carnitine on weight loss in adults: A systematic review and meta-analysis of randomized controlled trials. Obes. Rev. 2016, 17, 970–976. [Google Scholar] [CrossRef]
- Jeukendrup, A.E.; Randell, R. Fat burners: Nutrition supplements that increase fat metabolism. Obes. Rev. 2011, 12, 841–851. [Google Scholar] [CrossRef]
- Zhang, J.-J.; Wu, Z.-B.; Cai, Y.-J.; Ke, B.; Huang, Y.-J.; Qiu, C.-P.; Yang, Y.-B.; Shi, L.-Y.; Qin, J. L-carnitine ameliorated fasting-induced fatigue, hunger, and metabolic abnormalities in patients with metabolic syndrome: A randomized controlled study. Nutr. J. 2014, 13, 110. [Google Scholar] [CrossRef] [PubMed] [Green Version]
- Bastiaansen, J.A.M.; Merritt, M.E.; Comment, A. Measuring changes in substrate utilization in the myocardium in response to fasting using hyperpolarized [1-13C]butyrate and [1-13C]pyruvate. Sci. Rep. 2016, 6, 25573. [Google Scholar] [CrossRef] [Green Version]
- Mikkelsen, E.F.R.; Mariager, C.Ø.; Nørlinger, T.; Qi, H.; Schulte, R.F.; Jakobsen, S.; Frøkiær, J.; Pedersen, M.; Stødkilde-Jørgensen, H.; Laustsen, C. Hyperpolarized [1-13C]-acetate Renal Metabolic Clearance Rate Mapping. Sci. Rep. 2017, 7, 16002. [Google Scholar] [CrossRef] [Green Version]
- Abdurrachim, D.; Woo, C.C.; Teo, X.Q.; Chan, W.X.; Radda, G.K.; Lee, P.T.H. A new hyperpolarized 13C ketone body probe reveals an increase in acetoacetate utilization in the diabetic rat heart. Sci. Rep. 2019, 9, 5532. [Google Scholar] [CrossRef] [PubMed]
- Habibuddin, M.; Daghriri, H.A.; Humaira, T.; Al Qahtani, M.S.; Hefzi, A.A.H. Antidiabetic effect of alcoholic extract of Caralluma sinaica L. on streptozotocin-induced diabetic rabbits. J. Ethnopharmacol. 2008, 117, 215–220. [Google Scholar] [CrossRef] [PubMed]
- Malatiali, S.; Francis, I.; Barac-Nieto, M. Phlorizin Prevents Glomerular Hyperfiltration but not Hypertrophy in Diabetic Rats. Exp. Diabetes Res. 2008, 2008, 1–7. [Google Scholar] [CrossRef] [Green Version]
- Lee, S.-I.; Kim, J.-S.; Oh, S.-H.; Park, K.-Y.; Lee, H.-G.; Kim, S.-D. Antihyperglycemic Effect of Fomitopsis pinicola Extracts in Streptozotocin-Induced Diabetic Rats. J. Med. Food 2008, 11, 518–524. [Google Scholar] [CrossRef]
- Chusyd, D.E.; Wang, D.; Huffman, D.M.; Nagy, T.R. Relationships between Rodent White Adipose Fat Pads and Human White Adipose Fat Depots. Front. Nutr. 2016, 3, 10. [Google Scholar] [CrossRef] [Green Version]
- Haase, A.; Frahm, J.; Matthaei, D.; Hanicke, W.; Merboldt, K.-D. FLASH imaging. Rapid NMR imaging using low flip-angle pulses. J. Magn. Reson. 1986, 67, 258–266. [Google Scholar] [CrossRef]
- Dodd, M.S.; Ball, V.; Bray, R.; Ashrafian, H.; Watkins, H.; Clarke, K.; Tyler, D.J. In vivo mouse cardiac hyperpolarized magnetic resonance spectroscopy. J. Cardiovasc. Magn. Reson. 2013, 15, 19. [Google Scholar] [CrossRef] [PubMed] [Green Version]
- Vanhammea, L.; Boogaart, A.V.D.; Van Huffel, S. Improved Method for Accurate and Efficient Quantification of MRS Data with Use of Prior Knowledge. J. Magn. Reson. 1997, 129, 35–43. [Google Scholar] [CrossRef] [PubMed] [Green Version]
- Heather, L.C.; Pates, K.M.; Atherton, H.J.; Cole, M.A.; Ball, D.R.; Evans, R.D.; Glatz, J.F.; Luiken, J.J.; Griffin, J.L.; Clarke, K. Differential Translocation of the Fatty Acid Transporter, FAT/CD36, and the Glucose Transporter, GLUT4, Coordinates Changes in Cardiac Substrate Metabolism During Ischemia and Reperfusion. Circ. Heart Fail. 2013, 6, 1058–1066. [Google Scholar] [CrossRef] [PubMed] [Green Version]
- Walsby-Tickle, J.; Gannon, J.; Hvinden, I.; Bardella, C.; Abboud, M.I.; Nazeer, A.; Hauton, D.; Pires, E.; Cadoux-Hudson, T.; Schofield, C.J.; et al. Anion-exchange chromatography mass spectrometry provides extensive coverage of primary metabolic pathways revealing altered metabolism in IDH1 mutant cells. Commun. Biol. 2020, 3, 247. [Google Scholar] [CrossRef] [PubMed]
- Sowell, J.; Fuqua, M.; Wood, T. Quantification of total and free carnitine in human plasma by hydrophilic interaction liquid chromatography tandem mass spectrometry. J. Chromatogr. Sci. 2011, 49, 463–468. [Google Scholar] [CrossRef] [Green Version]
- Wang, X.; West, J.A.; Murray, A.J.; Griffin, J.L. Comprehensive Metabolic Profiling of Age-Related Mitochondrial Dysfunction in the High-Fat-Fed ob/ob Mouse Heart. J. Proteome Res. 2015, 14, 2849–2862. [Google Scholar] [CrossRef]


| Control (CTR) | Streptozotocin (STZ) | STZ | Carn | Interaction | |||
|---|---|---|---|---|---|---|---|
| Saline | L-Carnitine | Saline | L-Carnitine | p-Value | p-Value | p-Value | |
| Myocardial mass/BW | 0.43 ± 0.06 | 0.45 ± 0.06 | 0.51 ± 0.07 | 0.52 ± 0.07 | 0.002 | 0.57 | 0.94 |
| Heart Rate (HR) | 408 ± 15 | 405 ± 41 | 353 ± 33 | 335 ± 40 | <0.0001 | 0.38 | 0.51 |
| End-Systolic Volume/BW | 0.08 ± 0.02 | 0.13 ± 0.03 | 0.13 ± 0.03 | 0.19 ± 0.06 | 0.0003 | 0.0002 | 0.49 |
| End-Diastolic Volume/BW | 0.36 ± 0.04 | 0.39 ± 0.04 | 0.42 ± 0.04 | 0.52 ± 0.05 | <0.0001 | 0.0003 | 0.018 |
| Stroke Volume/BW (Stroke Index) | 0.28 ± 0.02 | 0.26 ± 0.03 | 0.30 ± 0.04 | 0.32 ± 0.03 | 0.0008 | 0.87 | 0.024 |
| Ejection Fraction (EF) | 78 ± 4 | 67 ± 6 | 68 ± 8 | 63 ± 8 | 0.0057 | 0.0024 | 0.20 |
| Control (CTR) | Streptozotocin (STZ) | STZ | Carn | Interaction | |||
|---|---|---|---|---|---|---|---|
| Saline | L-Carnitine | Saline | L-Carnitine | p-Value | p-Value | p-Value | |
| C2 (μmol/gww) | 8.6 ± 4.9 | 11.3 ± 1.7 | 6.8 ± 3.8 | 10.1 ± 5.3 | 0.33 | 0.07 | 0.82 |
| C3 (μmol/gww) | 0.30 ± 0.11 | 0.73 ± 0.34 | 0.26 ± 0.14 | 1.09 ± 0.59 | 0.17 | <0.0001 | 0.10 |
| C4 (μmol/gww) | 0.11 ± 0.03 | 0.39 ± 0.17 | 0.20 ± 0.09 | 0.36 ± 0.18 | 0.56 | <0.0001 | 0.17 |
| C5 (μmol/gww) | 0.04 ± 0.02 | 0.12 ± 0.08 | 0.06 ± 0.04 | 0.24 ± 0.13 | 0.02 | <0.0001 | 0.11 |
| C5_1 (μmol/gww) | 0.007 ± 0.003 | 0.010 ± 0.004 | 0.005 ± 0.003 | 0.007 ± 0.005 | 0.10 | 0.05 | 0.88 |
| C6 (μmol/gww) | 0.009 ± 0.004 | 0.055 ± 0.033 | 0.054 ± 0.034 | 0.089 ± 0.042 | 0.002 | 0.002 | 0.61 |
| C8 (μmol/gww) | 0.002 ± 0.001 | 0.010 ± 0.003 | 0.018 ± 0.012 | 0.024 ± 0.011 | 0.0002 | 0.04 | 0.85 |
| C8_1 (μmol/gww) | 7.0 ± 1.5 × 10⁻⁵ | 4.9 ± 2.5 × 10⁻⁵ | 8.2 ± 4.2 × 10⁻⁵ | 10.9 ± 3.2 × 10⁻⁵ | 0.02 | 0.82 | 0.11 |
| C10 (μmol/gww) | 0.002 ± 0.001 | 0.008 ± 0.002 | 0.015 ± 0.007 | 0.018 ± 0.011 | <0.001 | 0.06 | 0.54 |
| C10_1 (μmol/gww) | 0.0002 ± 0.0001 | 0.0002 ± 0.0001 | 0.0003 ± 0.0001 | 0.0002± 0.0001 | 0.52 | 0.44 | 0.71 |
| Pre-Ischemia | |||||||
|---|---|---|---|---|---|---|---|
| Control (CTR) | Streptozotocin (STZ) | STZ | Carn | Interaction | |||
| Saline | L-Carnitine | Saline | L-Carnitine | P-Value | p-Value | p-Value | |
| RPP (×104 mmHg × bpm) | 3.7 ± 1.2 | 3.3 ± 0.6 | 3.3 ± 0.6 | 2.5 ± 0.9 | 0.19 | 0.17 | 0.63 |
| HR (bpm) | 290 ± 42 | 227 ± 41 | 221 ± 20 | 195 ± 38 | 0.010 | 0.021 | 0.30 |
| Developed Pressure (mmHg) | 132 ± 38 | 137 ± 12 | 149 ± 15 | 125 ± 31 | 0.87 | 0.48 | 0.29 |
| Systolic Pressure (mmHg) | 133 ± 33 | 141 ± 10 | 148 ± 19 | 134 ± 25 | 0.74 | 0.77 | 0.32 |
| Post-Ischemia | |||||||
| Control (CTR) | Streptozotocin (STZ) | STZ | Carn | Interaction | |||
| Saline | L-Carnitine | Saline | L-Carnitine | p-Value | p-Value | p-Value | |
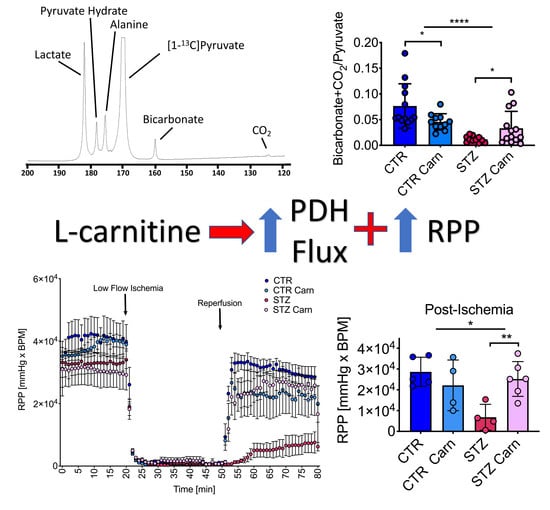
| RPP (×104 mmHg × bpm) | 2.9 ± 0.7 | 2.2 ± 1.2 | 0.7 ± 0.6 | 2.5 ± 0.8 | 0.034 | 0.16 | 0.0072 |
| HR (bpm) | 256 ± 50 | 201 ± 28 | 197 ± 103 | 253 ± 48 | 0.91 | 0.99 | 0.072 |
| Developed Pressure (mmHg) | 115 ± 34 | 106 ± 46 | 38 ± 43 | 106 ± 14 | 0.028 | 0.085 | 0.029 |
| Systolic Pressure (mmHg) | 137 ± 31 | 149 ± 18 | 102 ± 19 | 124 ± 12 | 0.0078 | 0.10 | 0.63 |
| Diastolic Pressure (mmHg) | 22 ± 24 | 43 ± 35 | 65 ± 30 | 14 ± 5 | 0.60 | 0.23 | 0.009 |
Publisher’s Note: MDPI stays neutral with regard to jurisdictional claims in published maps and institutional affiliations. |
© 2021 by the authors. Licensee MDPI, Basel, Switzerland. This article is an open access article distributed under the terms and conditions of the Creative Commons Attribution (CC BY) license (http://creativecommons.org/licenses/by/4.0/).
Share and Cite
Savic, D.; Ball, V.; Curtis, M.K.; Sousa Fialho, M.d.L.; Timm, K.N.; Hauton, D.; West, J.; Griffin, J.; Heather, L.C.; Tyler, D.J. L-Carnitine Stimulates In Vivo Carbohydrate Metabolism in the Type 1 Diabetic Heart as Demonstrated by Hyperpolarized MRI. Metabolites 2021, 11, 191. https://doi.org/10.3390/metabo11030191
Savic D, Ball V, Curtis MK, Sousa Fialho MdL, Timm KN, Hauton D, West J, Griffin J, Heather LC, Tyler DJ. L-Carnitine Stimulates In Vivo Carbohydrate Metabolism in the Type 1 Diabetic Heart as Demonstrated by Hyperpolarized MRI. Metabolites. 2021; 11(3):191. https://doi.org/10.3390/metabo11030191
Chicago/Turabian StyleSavic, Dragana, Vicky Ball, M. Kate Curtis, Maria da Luz Sousa Fialho, Kerstin N. Timm, David Hauton, James West, Julian Griffin, Lisa C. Heather, and Damian J. Tyler. 2021. "L-Carnitine Stimulates In Vivo Carbohydrate Metabolism in the Type 1 Diabetic Heart as Demonstrated by Hyperpolarized MRI" Metabolites 11, no. 3: 191. https://doi.org/10.3390/metabo11030191