Article

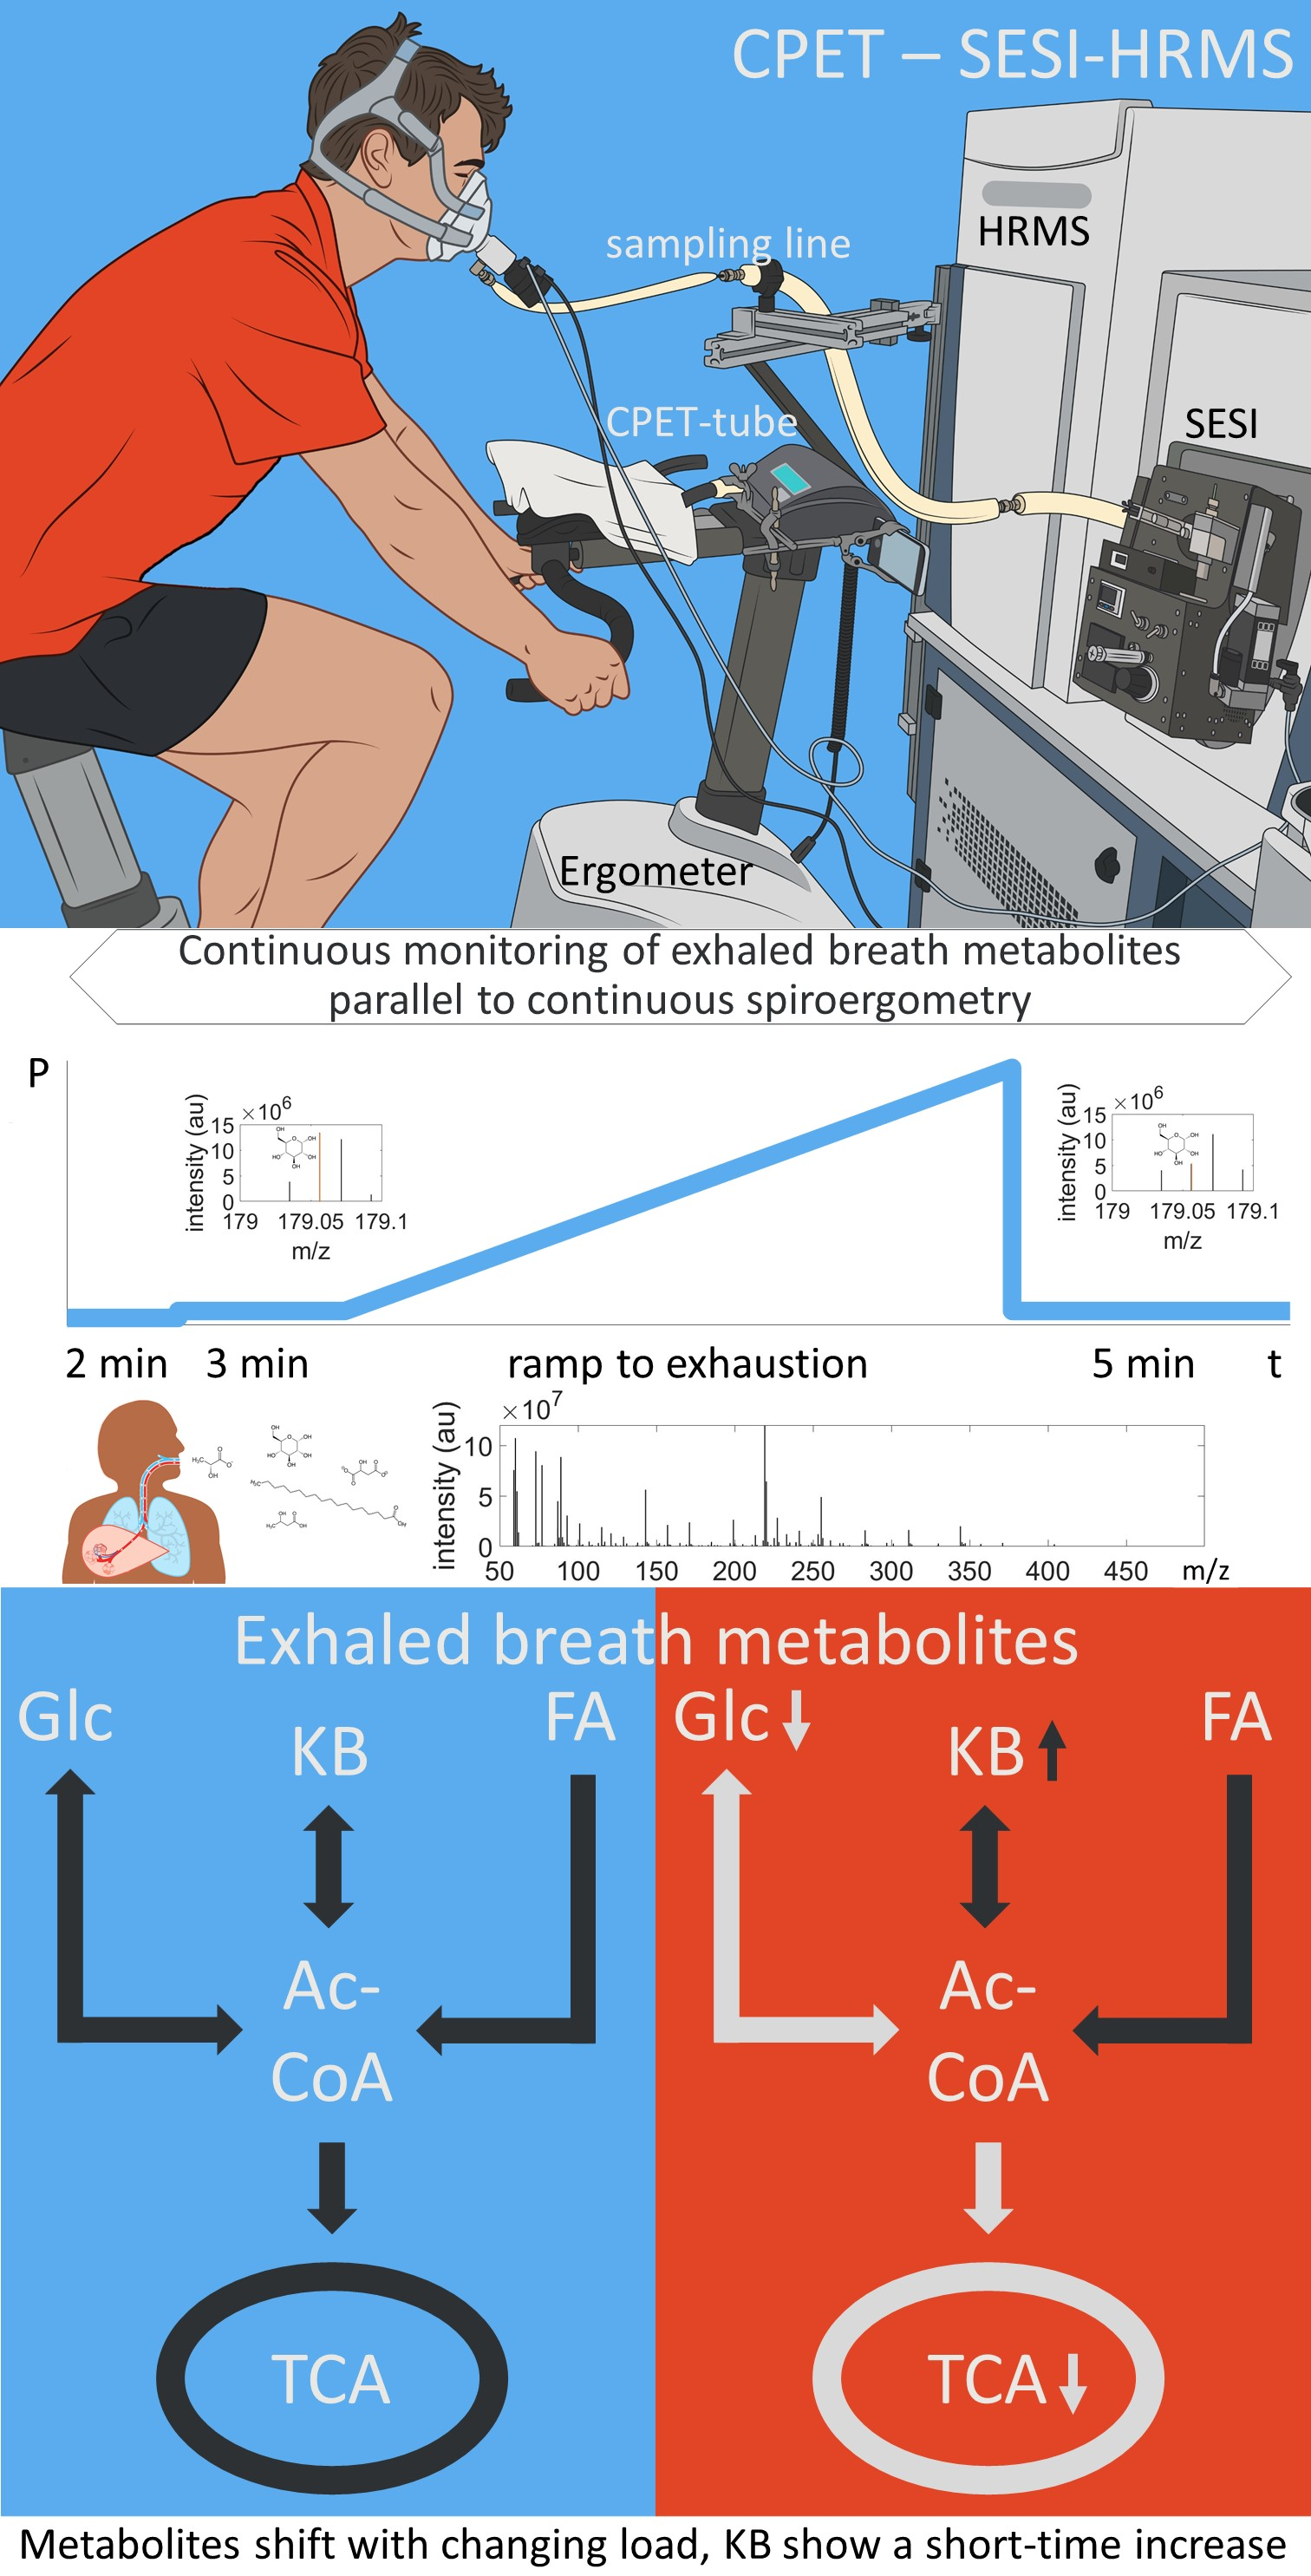
Real-Time Monitoring of Metabolism during Exercise by Exhaled Breath

1
Faculty of Medicine, University of Zürich, 8008 Zürich, Switzerland
2
Department of Pulmonology, University Hospital Zürich, 8091 Zürich, Switzerland
3
ETH Zürich, Department of Chemistry and Applied Biosciences, 8049 Zürich, Switzerland
4
Sports Medical Research Group, Department of Orthopaedics, Balgrist University Hospital, University of Zürich, 8008 Zürich, Switzerland
5
University Centre for Prevention and Sports Medicine, Department of Orthopaedics, Balgrist University Hospital, University of Zürich, 8008 Zürich, Switzerland
6
University Children’s Hospital Basel, 4056 Basel, Switzerland
7
Department of Biomedical Engineering, University of Basel, 4123 Allschwil, Switzerland
8
Human Performance Laboratory, North Carolina Research Campus, Appalachian State University, Kannapolis, NC 28081, USA
*
Authors to whom correspondence should be addressed.
These two authors contribute equally.
Metabolites 2021, 11(12), 856; https://doi.org/10.3390/metabo11120856
Submission received: 14 October 2021 / Revised: 29 November 2021 / Accepted: 4 December 2021 / Published: 8 December 2021
(This article belongs to the Special Issue Sports and Health Metabolism)

Abstract

:
Continuous monitoring of metabolites in exhaled breath has recently been introduced as an advanced method to allow non-invasive real-time monitoring of metabolite shifts during rest and acute exercise bouts. The purpose of this study was to continuously measure metabolites in exhaled breath samples during a graded cycle ergometry cardiopulmonary exercise test (CPET), using secondary electrospray high resolution mass spectrometry (SESI-HRMS). We also sought to advance the research area of exercise metabolomics by comparing metabolite shifts in exhaled breath samples with recently published data on plasma metabolite shifts during CPET. We measured exhaled metabolites using SESI-HRMS during spiroergometry (ramp protocol) on a bicycle ergometer. Real-time monitoring through gas analysis enabled us to collect high-resolution data on metabolite shifts from rest to voluntary exhaustion. Thirteen subjects participated in this study (7 female). Median age was 30 years and median peak oxygen uptake (VO2max) was 50 mL·/min/kg. Significant changes in metabolites (n = 33) from several metabolic pathways occurred during the incremental exercise bout. Decreases in exhaled breath metabolites were measured in glyoxylate and dicarboxylate, tricarboxylic acid cycle (TCA), and tryptophan metabolic pathways during graded exercise. This exploratory study showed that selected metabolite shifts could be monitored continuously and non-invasively through exhaled breath, using SESI-HRMS. Future studies should focus on the best types of metabolites to monitor from exhaled breath during exercise and related sources and underlying mechanisms.

Graphical Abstract

1. Introduction

The health benefits of regular exercise are well known and widely accepted. For example, regular exercise is effective in both preventing and treating cardiovascular, musculoskeletal, and metabolic diseases [1,2,3,4].
The physiological responses to acute exercise bouts have been studied extensively for a wide variety of exercise modes and workloads, but the underlying molecular mechanisms have not been fully described [5,6]. Muscles need to be supplied with energy from substrates via different pathways within a short time after initiating exercise. Carbohydrate, lipid, and protein substrate mobilization and utilization are precisely regulated to match the intensity and duration of exercise. For example, high energy demands during vigorous exercise bouts are met by increased utilization of intramuscular glycogen, and have typically been monitored with indirect calorimetry using ratios of oxygen uptake and carbon dioxide release, or in the blood by the increase in lactate concentration [7,8].
Advances in mass spectrometry technology now allow the simultaneous monitoring of hundreds of metabolites from blood, urine, and saliva samples periodically collected before, during, and after exercise. The rapidly expanding research area of exercise metabolomics has greatly improved our understanding of exercise-induced biological processes. During short-term graded exercise tests leading to peak oxygen uptake levels, for example, shifts in hundreds of plasma metabolites across multiple biochemical pathways have been reported, reflecting heightened anaerobic and aerobic metabolism including fatty acid oxidation, glycolysis products, release of Krebs cycle intermediates, inflammation, and oxidative stress [9,10].
Continuous monitoring of metabolites in exhaled breath has recently been introduced as an advanced method to allow non-invasive real-time monitoring of metabolite shifts during acute exercise bouts [11]. Little is known, however, about the types of metabolite that can be measured in expired breath samples during exercise [12,13], and how this profile differs when compared to metabolite shifts measured from blood samples [14,15,16,17]. Breath samples have been used previously for the monitoring of some volatile compounds using secondary electrospray high resolution mass spectrometry (SESI-HRMS) [18].
The purpose of this study was to measure metabolites continuously in exhaled breath samples with SESI-HRMS during a graded cycle ergometry cardiopulmonary exercise test (CPET). We also sought to advance the research area of exercise metabolomics by comparing metabolite shifts in exhaled breath samples with recently published data on plasma metabolite shifts during CPET [9,10].

2. Results

2.1. Participant Characteristics

Fourteen subjects (7 female and 7 male) were included in the study. Median (interquartile range (IQR)) age was 30 (27.0, 31.0) years, and median (IQR) maximum oxygen uptake (VO2max) was 50 (47.0, 53.0) mL/min/kg. One subject (male) had to stop the test due to psychological issues with the mask, and this subject was excluded from the analysis. The remaining thirteen subjects were healthy, non-smoking adults with regular physical activity/training. Ratings of perceived exertion (RPE) measured with the modified Borg scale indicated that all subjects reported voluntary exhaustion (a Borg value of 8–10) when the test was terminated. Furthermore, subjects had a significant increase in arterial blood lactate concentration during exercise testing, indicating maximal effort (see Figure S1 in the online data supplement). For further details regarding participant characteristics, see Table 1.

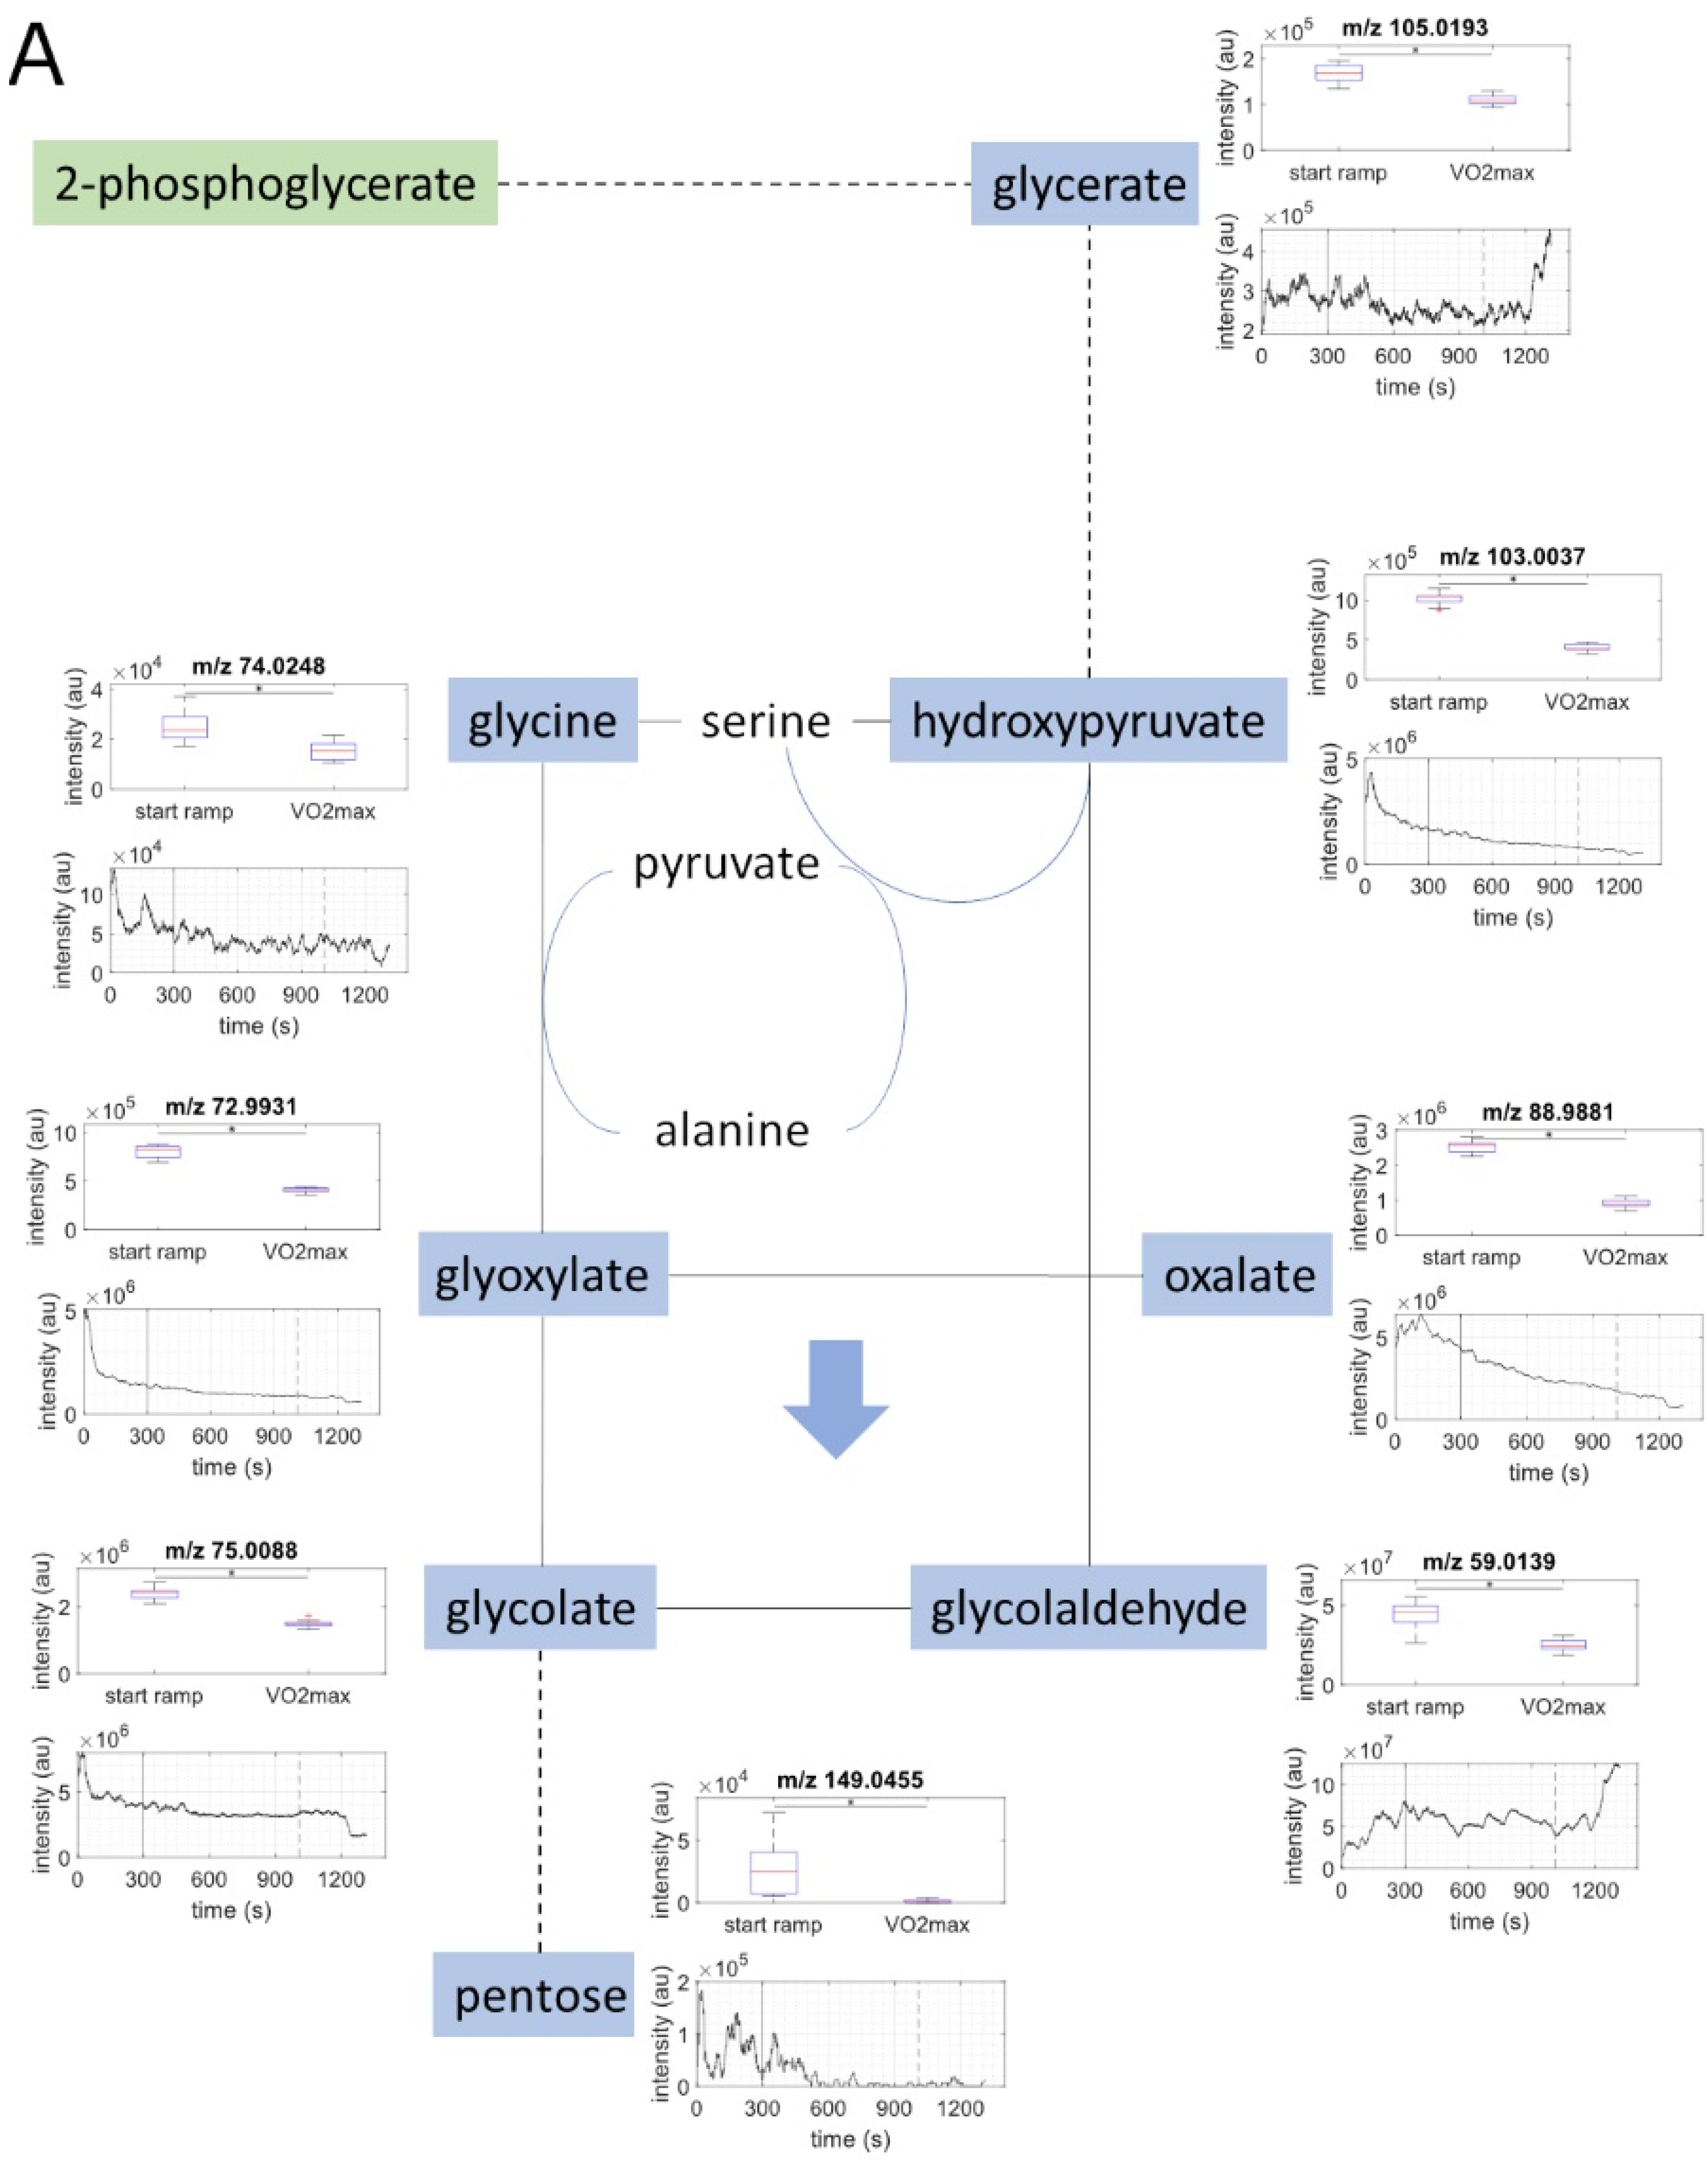
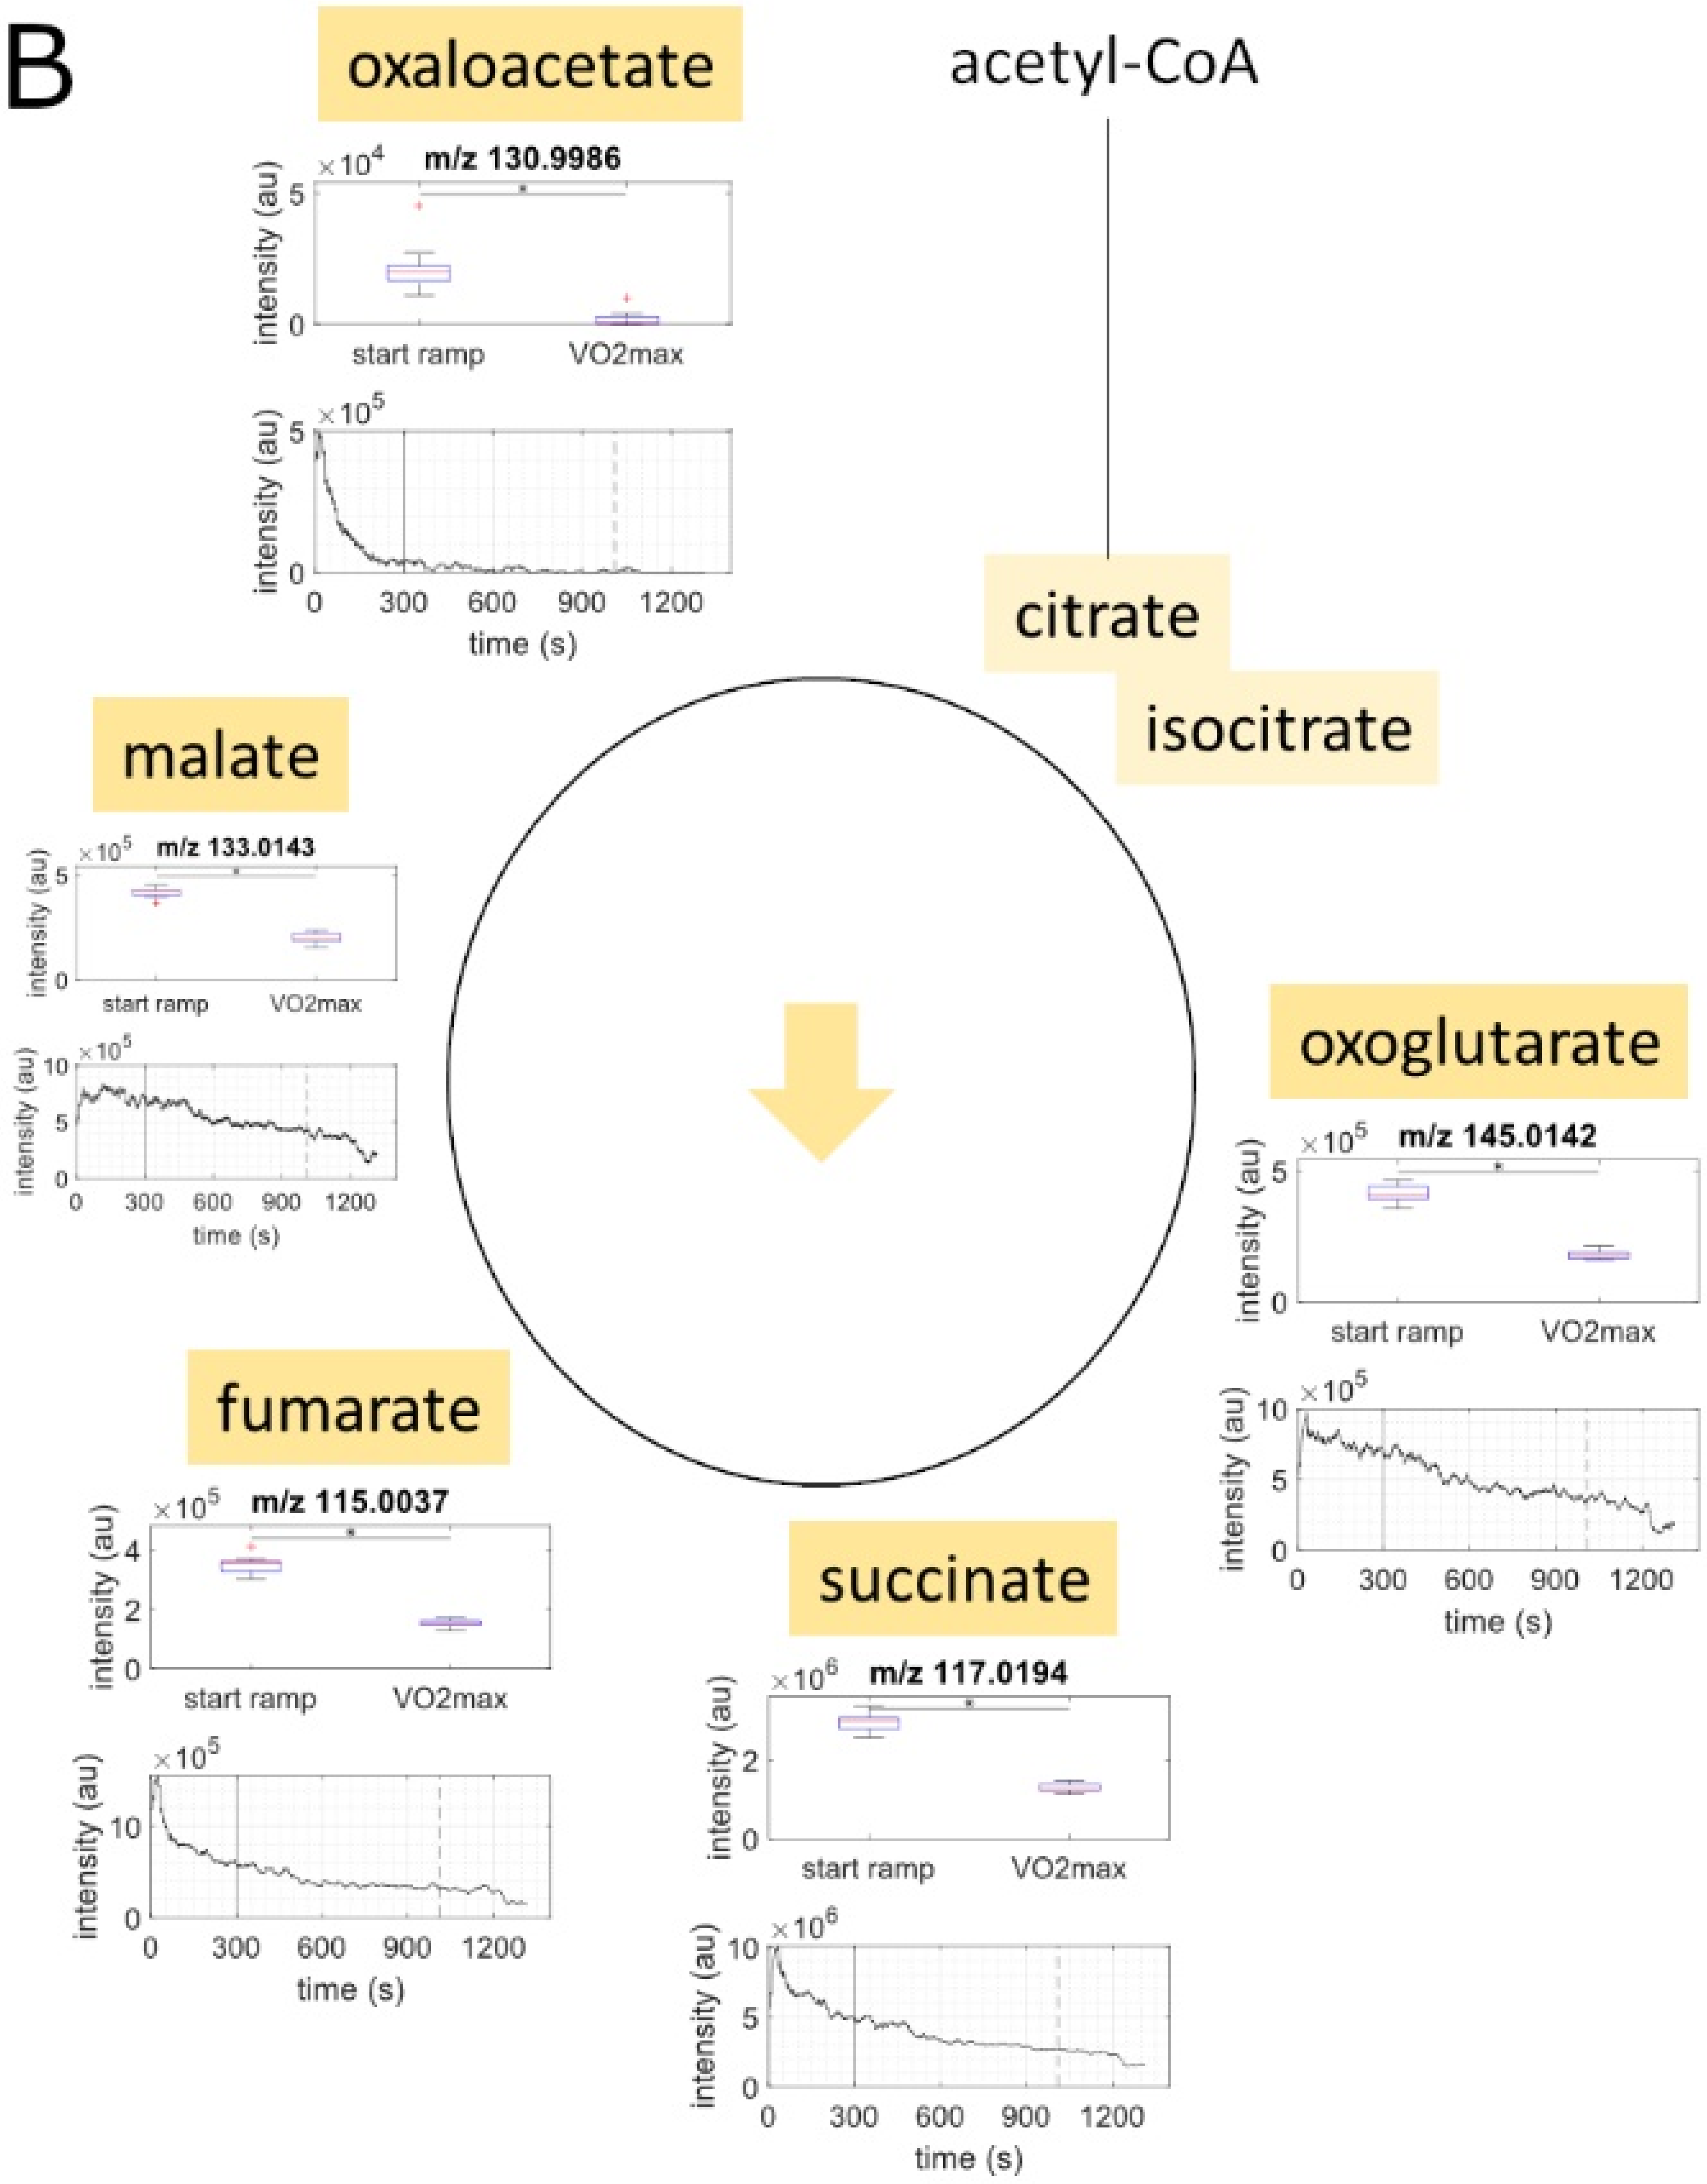
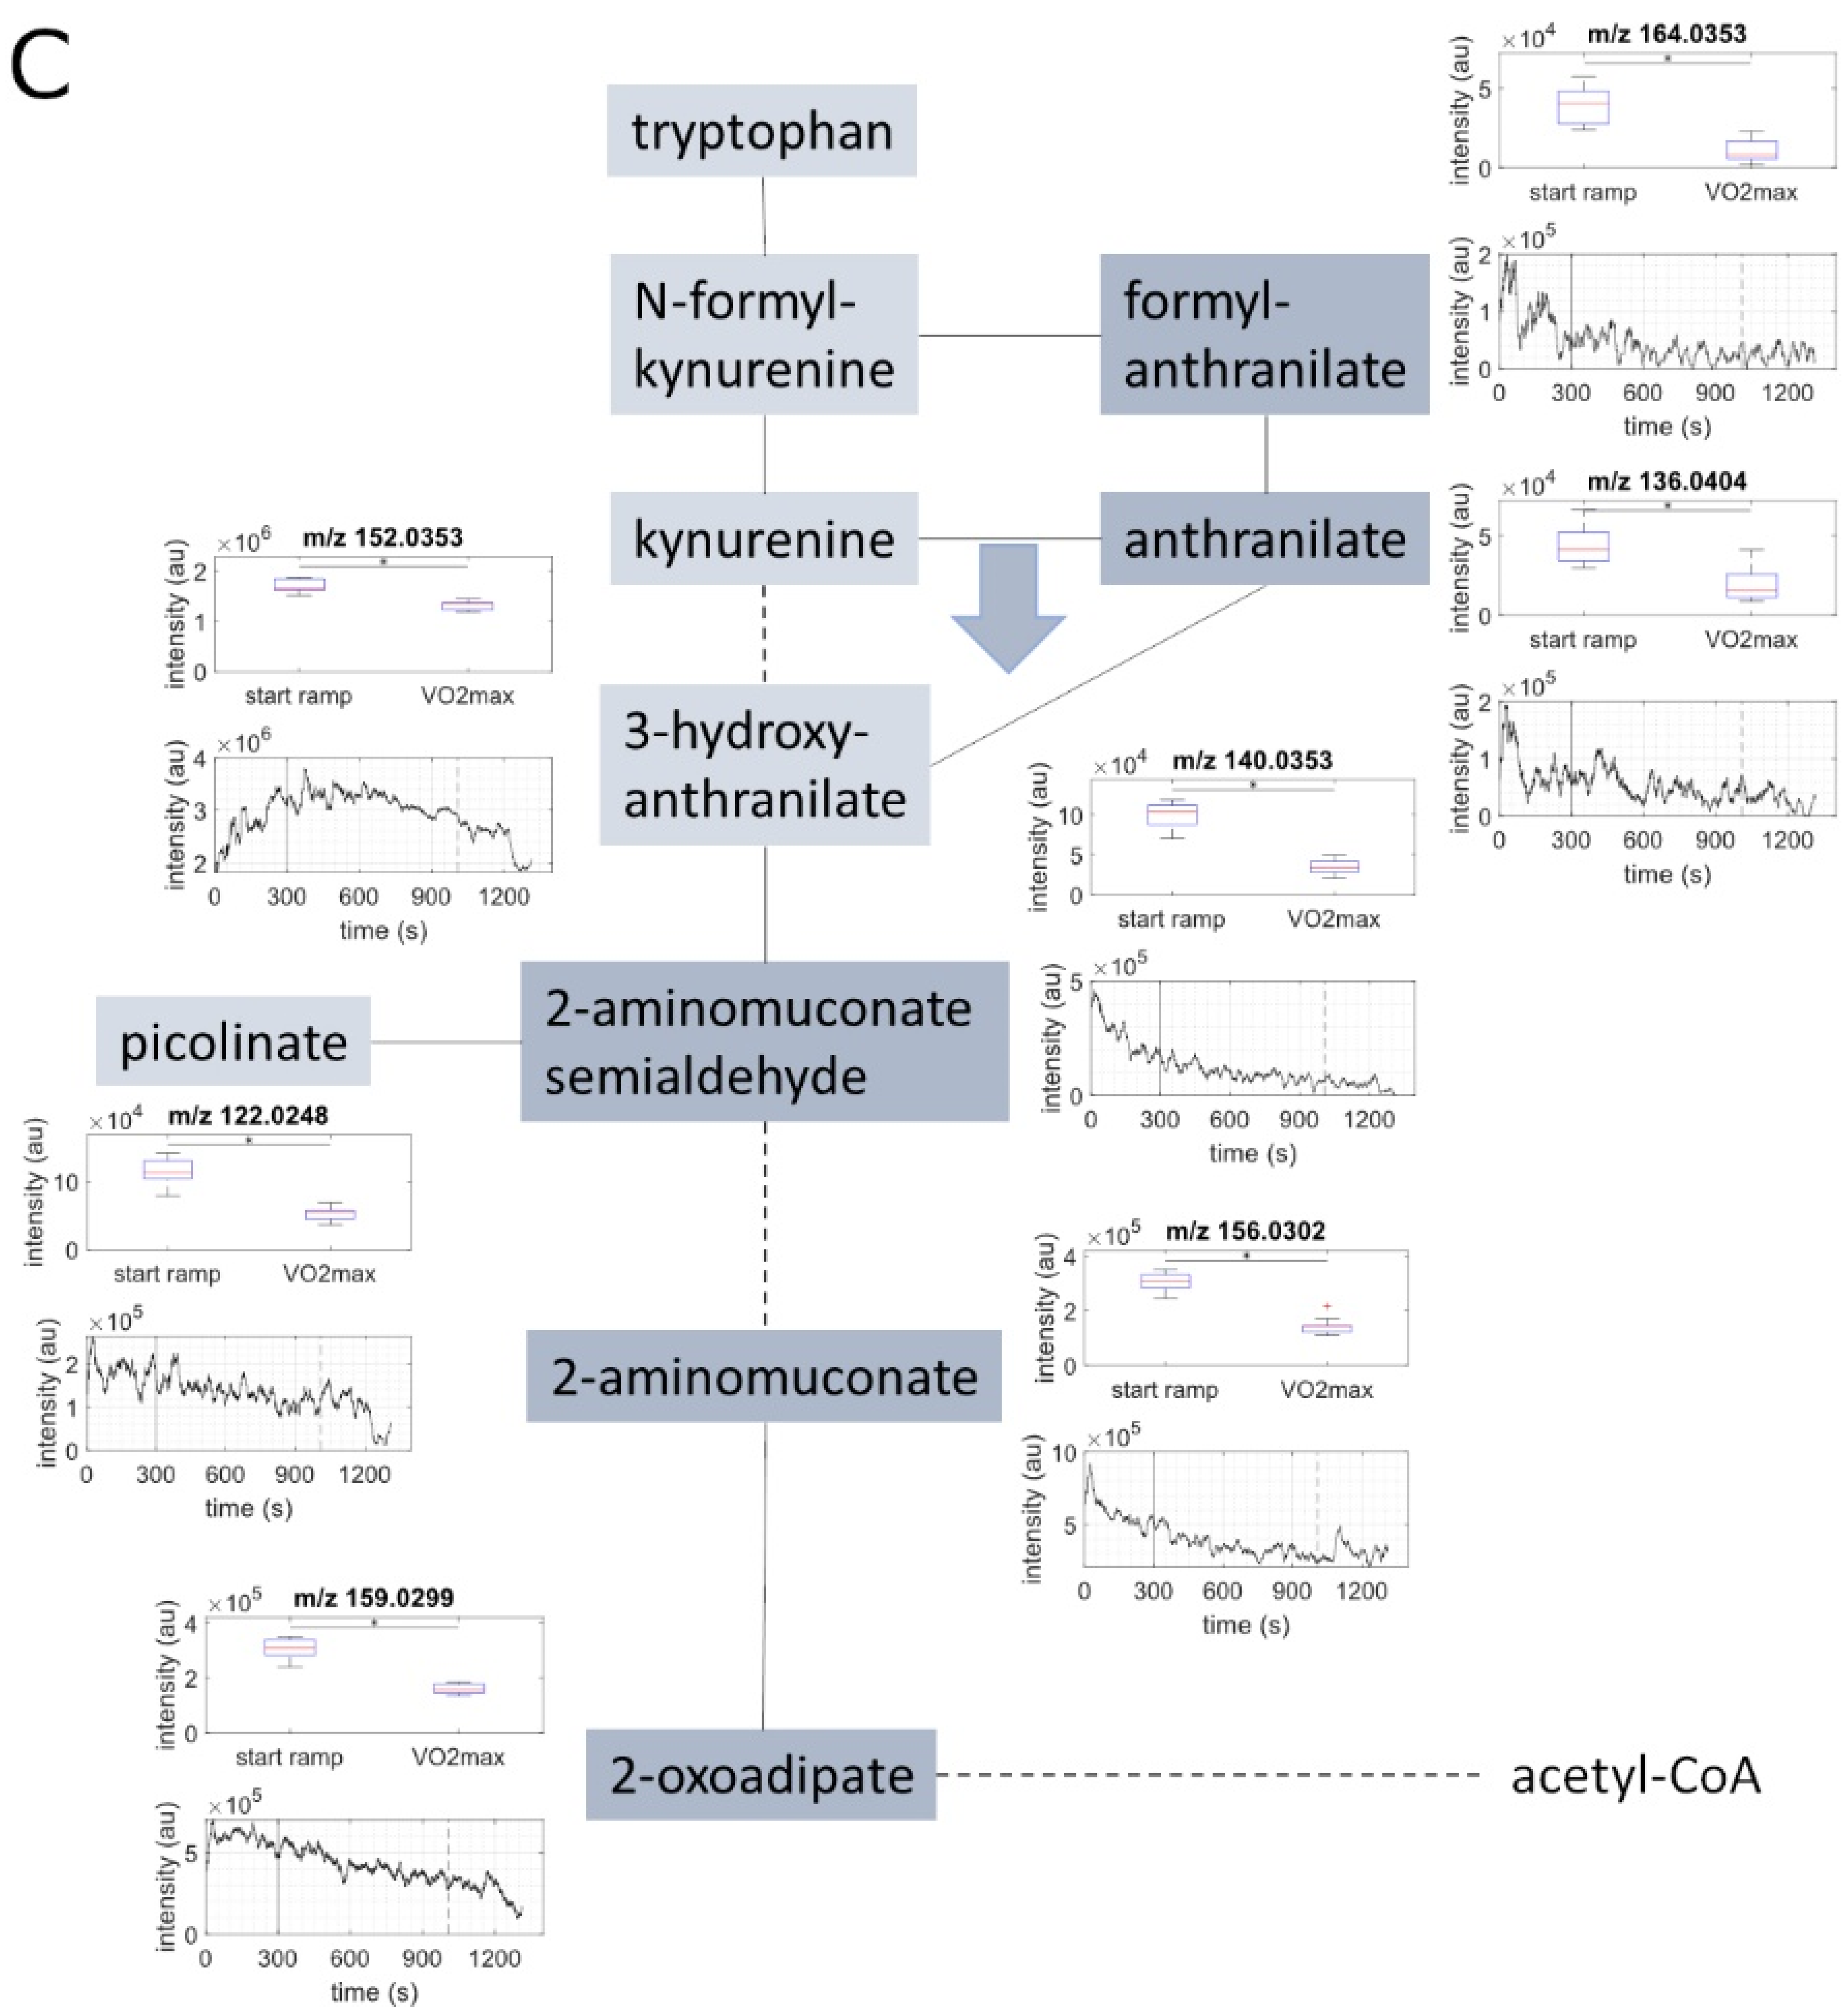
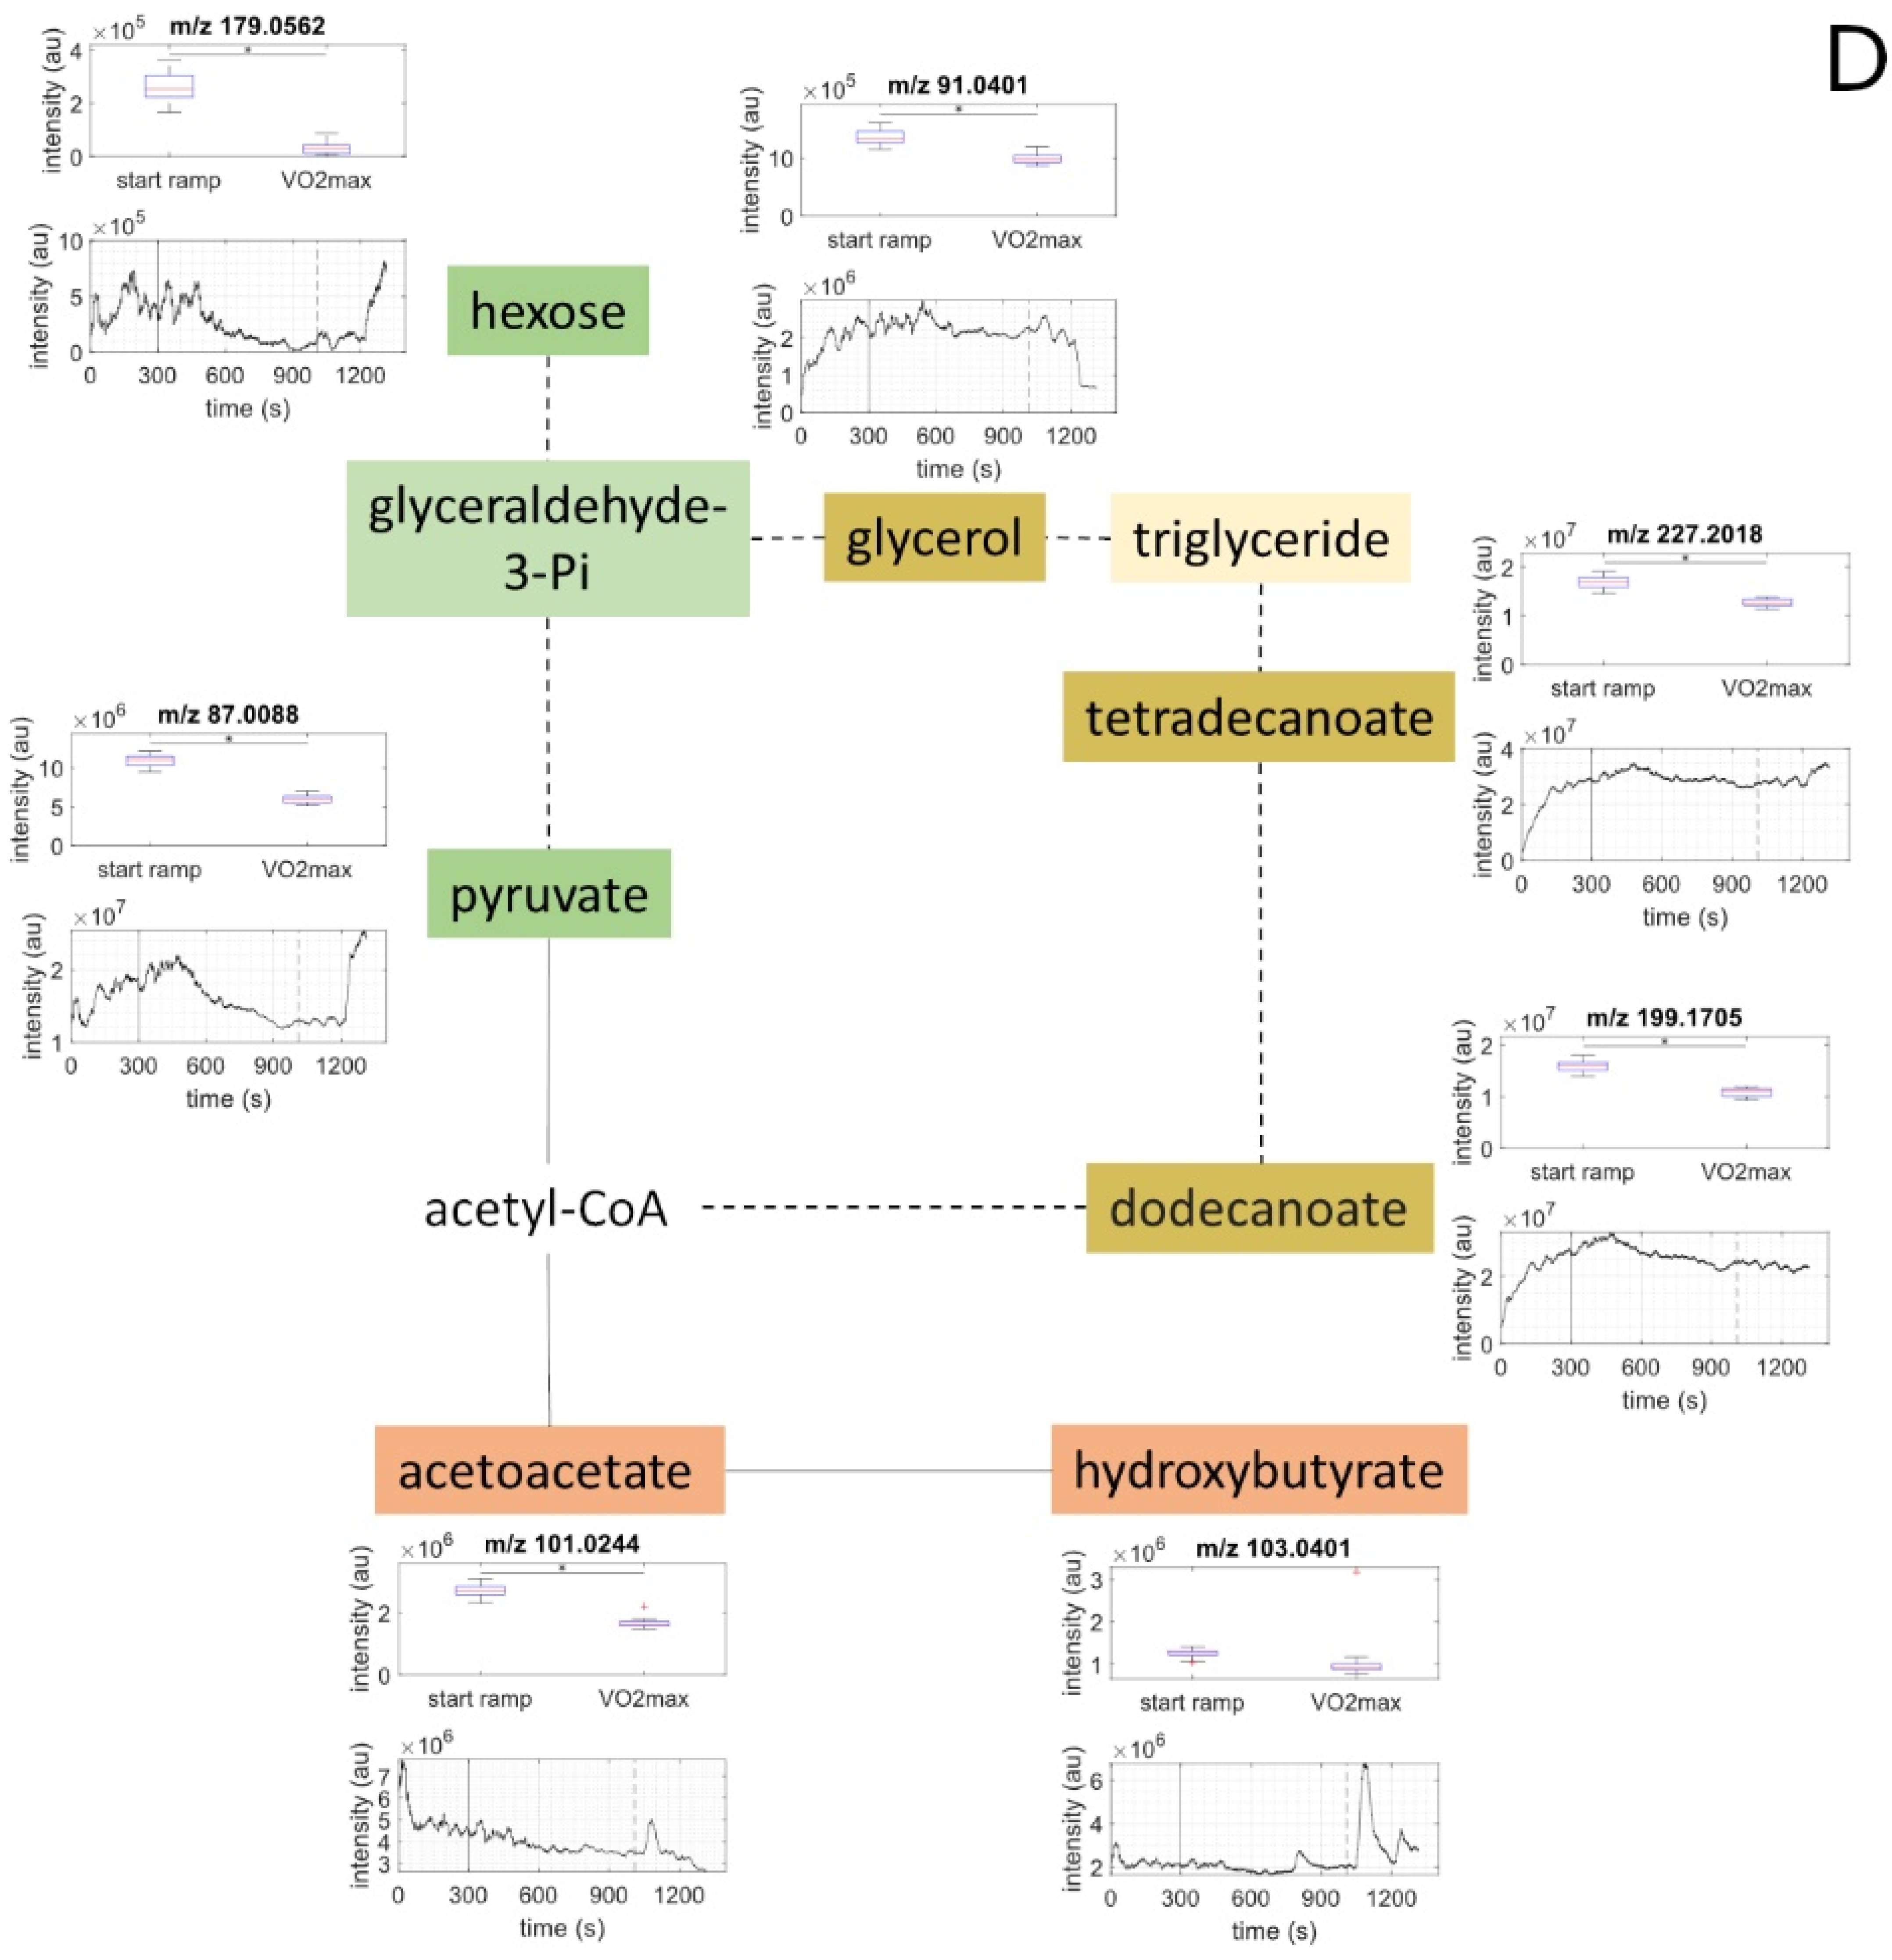
2.2. Metabolite Concentration of Several Pathways Decreased with Increasing Load

Significant changes were found in 32 out of 33 metabolites from several metabolic pathways, occurring between the start on the ramp and VO2max (Table 2, Figure 1A–D).
Decreases in exhaled breath metabolites were measured in glyoxylate and dicarboxylate (Figure 1A), tricarboxylic acid cycle (TCA) (Figure 1B), and tryptophan metabolic pathways (Figure 1C) during graded exercise (q = 0.001). The most marked decreases during the exercise bout occurred in five metabolites from the TCA, and these decreases began early in the CPET bout. The ketone body acetoacetate decreased during graded exercise, with no significant change in hydroxybutyrate (Figure 1D). Figure 2 compares changes in lipid- and carbohydrate-related metabolites using line graphs from one sample study participant. For individual protocol and metabolite intensities over time, see Figures S2–S4 in the online data supplement.

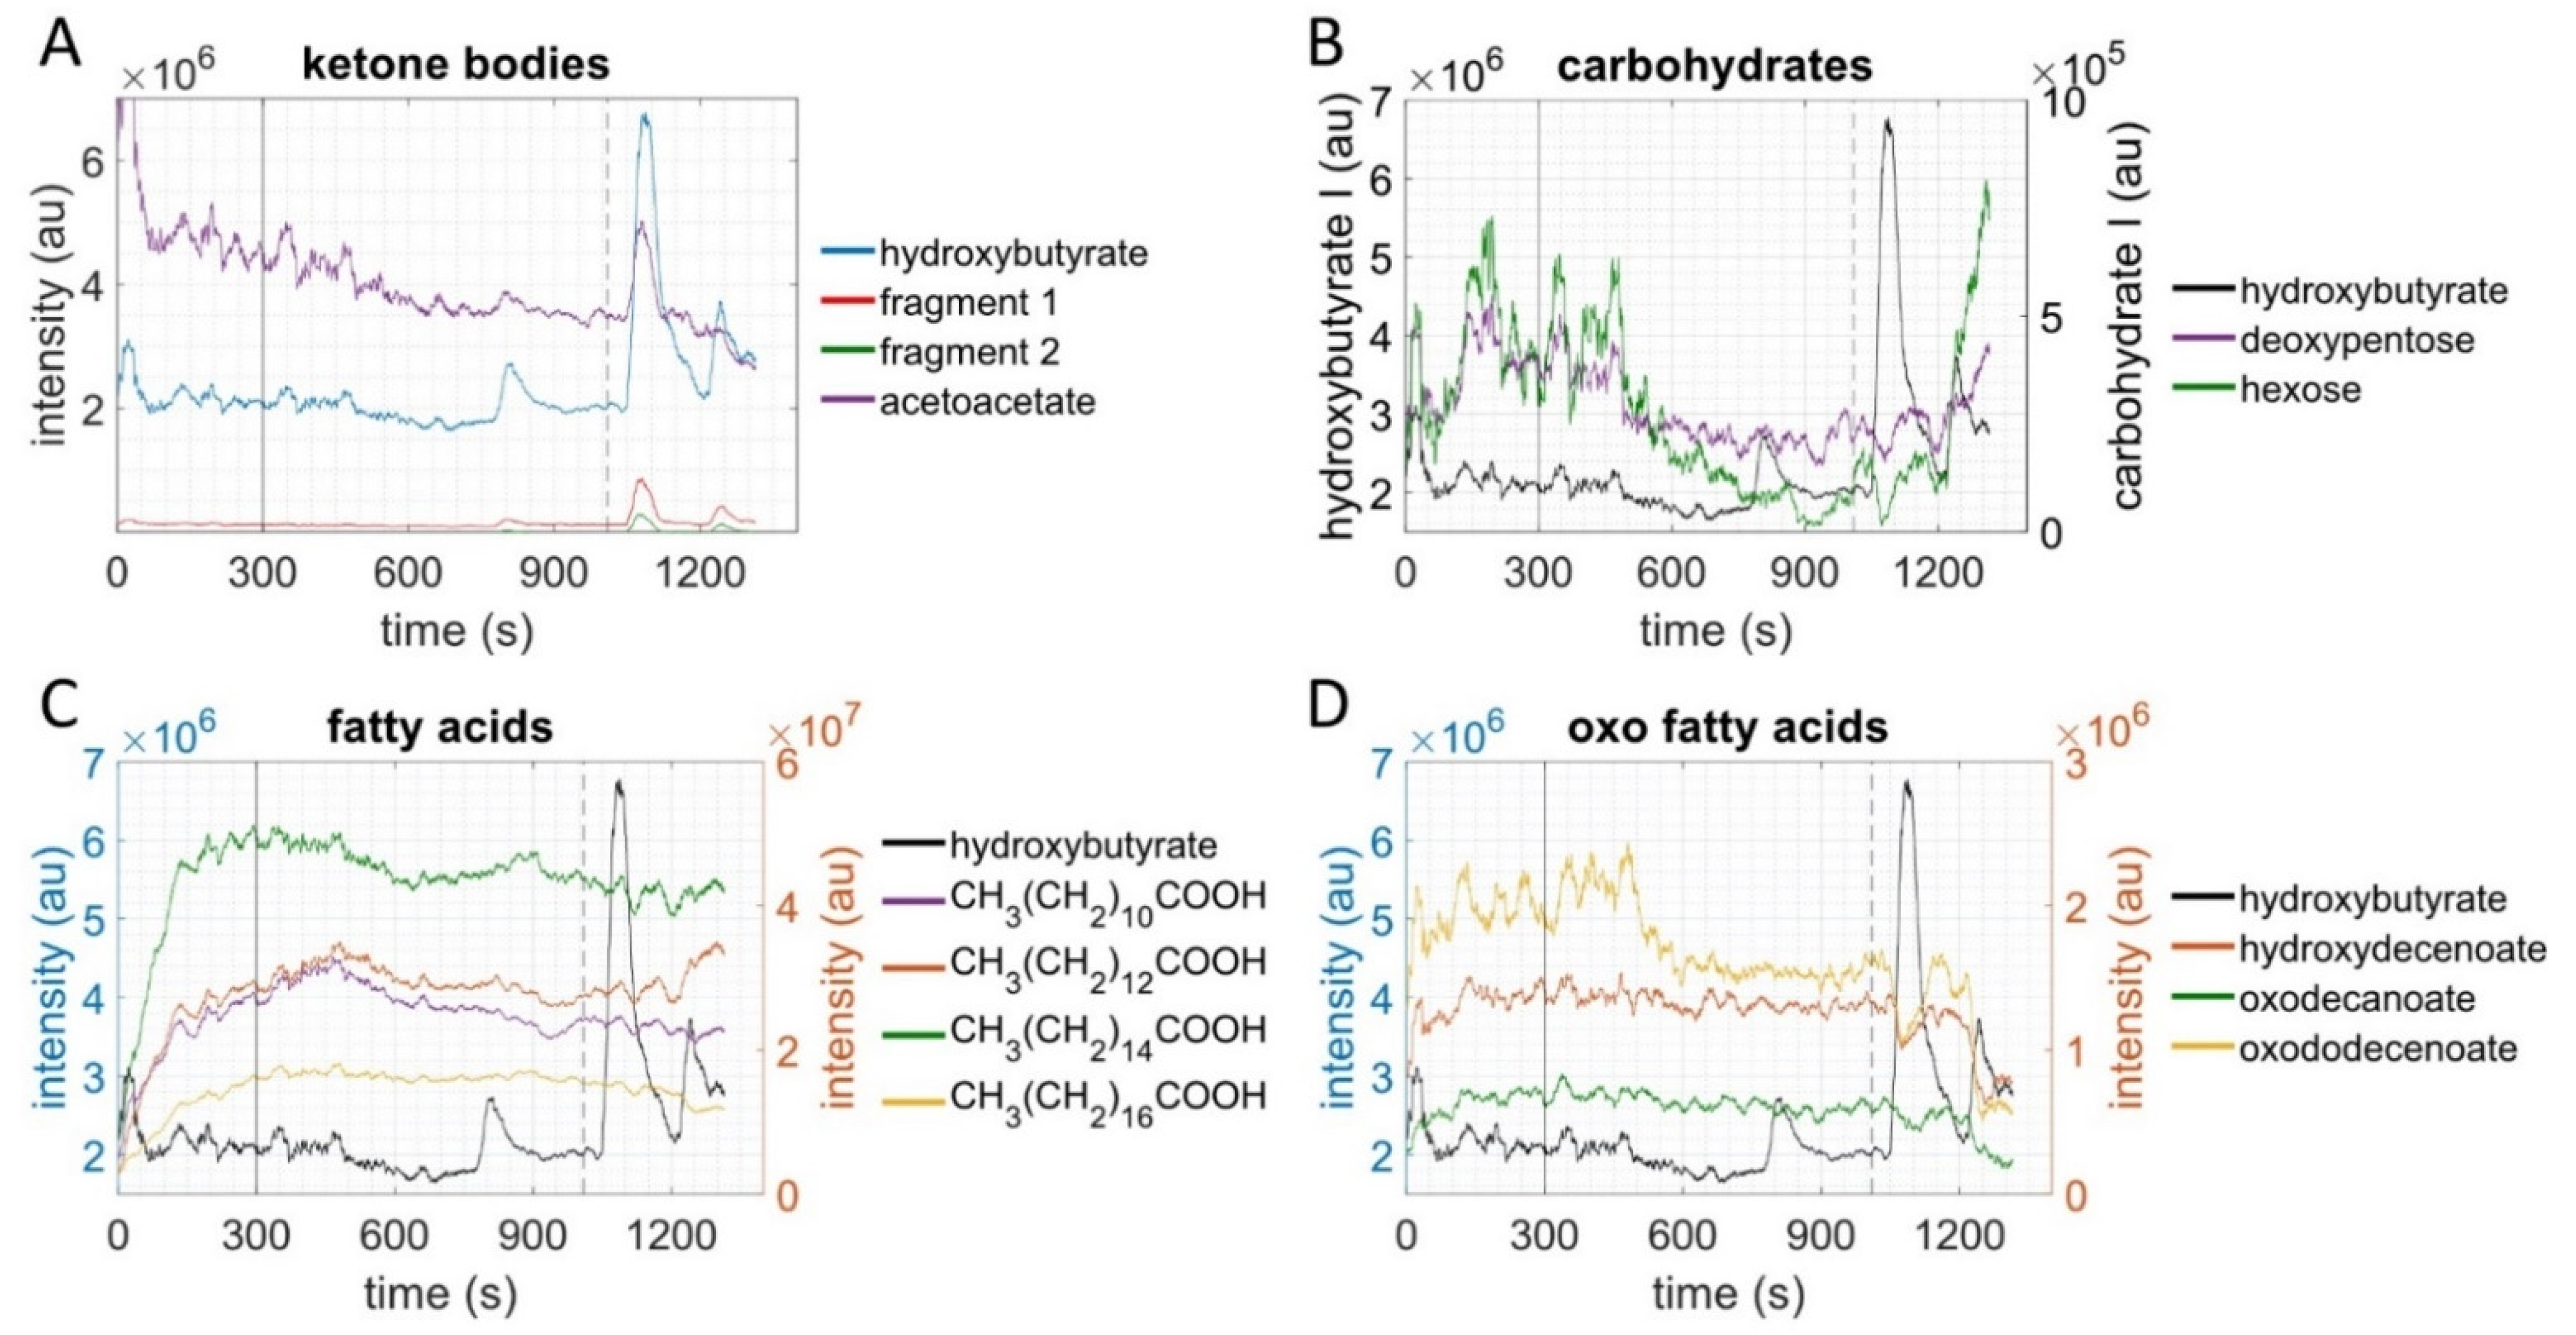
2.3. Metabolites of Glycolysis and Oxo Fatty Acids Showed Inverse Behavior to Ketone Bodies

Ketone bodies (acetoacetate (AcAc) and hydroxybutyrate (OHB)) showed a short-term increase in the recovery phase after VO2max was achieved, with concomitant decreases in carbohydrate-related metabolites and oxo fatty acids. Subjects with high exercise capacity (i.e., VO2max) showed a second increase of ketone bodies shortly after the first during recovery. In contrast to the first increase, the second increase was accompanied with an increase in carbohydrate-related metabolites and a decrease of oxo fatty acids.

2.4. Ketone Bodies Correlated with Performance

There was a strong negative correlation (r = −0.87, p = 0.0002) between the oxygen uptake at VO2max and the short-term increase of ketone bodies in the recovery phase. Subjects with a higher VO2max showed the first short-term increase of ketone bodies earlier in the recovery phase. Hexose intensity increased simultaneously and strongly with the second ketone body increase in the recovery phase. Intensities of the mass spectrometric monitoring reflect the Fourier transformation of the image of the current measured at the detector of the orbitrap in arbitrary units—not to be confused with the exercise intensity that reflects the power relative to the athlete.

2.5. Metabolic Aerobic Threshold was Associated with Decrease of Carbohydrates and Fatty Acids

After an initial increase in intensity, carbohydrate metabolites, saturated fatty acids, and oxo fatty acids began to decrease in the first half of the exercise testing (Figure 2). This decrease started at the point of the ventilatory aerobic threshold.

3. Discussion

The purpose of this study was to measure metabolites continuously in exhaled breath samples with SESI-HRMS during a graded cycle ergometry CPET in 13 trained young adults. A total of 33 metabolites from glyoxylate and dicarboxylate, tricarboxylic acid cycle (TCA), and tryptophan metabolic pathways were identified, and most of these decreased during the incremental exercise bout.
To our knowledge, this is the first metabolomics-based study that continuously monitored metabolite changes during graded exercise to voluntary exhaustion (CPET) and the immediate recovery period. Other studies have monitored plasma metabolite shifts in response to CPET using samples collected before and immediately after exercise, and then during short-term recovery [5,6,9,10,23]. However, the methods used were heterogeneous and hamper comparisons between different studies. The most recent studies using sophisticated mass spectrometry platforms reported increases and decreases in hundreds of plasma metabolites in response to CPET [9,10]. CPET-induced shifts included increases in TCA intermediates, pyruvate and lactate, acylcarnitines, numerous lipid-related metabolites, and metabolites related to immunity, inflammation, and oxidative stress. At the same time, decreases occurred in specific types of amino acids, bile acids, and gut-derived products such as hippurate. In general, shifts in plasma metabolites with CPET may reflect heightened anaerobic and aerobic metabolism.
Metabolite concentration of several pathways decreased with increasing load.
Comparing metabolic pathways between the start and end of the exercise testing revealed a significant enrichment in glyoxylate and dicarboxylate metabolism, TCA cycle, and tryptophan metabolism, respectively. With increasing load, energy fuels a shift from free fatty acids and glucose in blood, to substrates in the muscle itself, e.g., triglycerides and glucagon [8]. This may be the reason for the load-dependent decrease of these metabolites in our measurements. An accelerated uptake of TCA intermediates or a shift of substrate delivery from circulation to intramuscular metabolites may explain the decrease in TCA intermediates in exhaled breath. In accordance with prior research, intracellular TCA intermediates’ reservoir of molecules (pool size) increases with exercise intensity [24]. The measured decrease in exhaled TCA intermediates may represent a shift from extracellular to intracellular TCA intermediates. Another explanation, supported by prior plasma measurements [25], is that changes in breathing behavior may cause the decrease rather than a cellular concentration gradient. The cause for the measured changes remains subject to further investigations.
Tryptophan pathway metabolites decreased during exercise. Metabolites of this pathway are associated with energy homeostasis, anti-inflammatory functions, and neuroprotection [26]. However, the function of tryptophan metabolism and glyoxylate and decarboxylate metabolism during exercise remain unclear. Interpreting our results, we hypothesize that substrate changes with increasing exercise intensity are due to limited carbohydrate delivery and may be a sign of increasing cellular stress with consecutive adrenergic activation. A similar interaction has been seen in the brain [27]. Fatty acid intensity remains close to constant after the initial increase. This supports the theory that transporter availability rather than adipose tissue catabolism is the limiting factor for fatty acid energy production [28]. For central carbon metabolites, several transporters support crossing membranes [29,30,31]. Whether the measured decrease in carbohydrate intensity is due to an increased uptake or a limited carbohydrate supply to the liver remains to be addressed in future research. However, since the glycogen storage capacity of the liver is on average 80 g (equivalent to an energy amount of 320 kcal) [32], the theory of limited carbohydrate availability seems to be more likely.
Metabolites of glycolysis and oxo fatty acids showed inverse behavior to ketone bodies.
Ketone bodies (i.e., acetoacetate (AcAc) and hydroxybutyrate (OHB)) showed a short-term increase in the recovery phase. The role of ketone bodies as muscular energy sources remains unclear [33]. A recognized function of ketone body metabolism is the spill-over pathway from beta-oxidation [34]. Since ketone bodies need to be transformed back to acetyl-CoA before they can be used as energy substrate, they are an unlikely alternative energy source in anaerobic metabolism. However, beta-hydroxybutyrate has several regulatory functions. It lowers metabolic rate and reduces sympathetic tone [35], and glycolysis alters glycolytic activity at the level of pyruvate dehydrogenase and phosphofructokinase [36]. Furthermore, beta-hydroxybutyrate activates, for example, c-Myc, MyoD, and tumor suppressor gene p53 by inhibition of histone deacylases, which in turn causes, inter alia, an increase in their expression [37]. The increase of ketone bodies shown in the recovery phase could, therefore, have a regulatory purpose. It may be a signal to down-regulate metabolism after a high-intensity exercise.
Simultaneously with the short-term ketone body increase, carbohydrate metabolites decreased. During exercise, catecholamines increase [38] and may therefore cause the changes shown in glucose levels [39].
Oxo fatty acids originate from the omega-oxidation pathway. This subsidiary pathway to beta-oxidation has a role in diabetes and starvation [40]. Furthermore, it has been proposed that dicarboxylic acids produced in the omega-oxidation pathway can be metabolized more efficiently in beta-oxidation [40]. The simultaneous increase of ketone bodies with the decrease in oxo fatty acids is plausible in view of the role of fatty acids as precursor of ketone bodies. The change may be due to the higher oxygen availability in th recovery phase and, therefore, increase of fatty acid oxidation. Whether these changes and the changes in carbohydrates are directly regulated by oxygen availability or connected to regulatory hormones, as well as a potential immediate regulatory effect of beta-hydroxybutyrate, remains to be unraveled. With regard to CPET-induced shifts in metabolites measured continuously from exhaled breath samples, much remains to be investigated. In this exploratory study, 33 metabolites were identified, and most decreased during the CPET bout. For example, strong decreases were measured in exhaled breath during CPET for five TCA-related metabolites in contrast to increases typically reported for these metabolites in plasma samples. Some of the metabolites identified in exhaled breath during exercise (e.g., the aromatic acid anthranilate, and the carboxylic acid 2-oxoadipate) have not been reported previously in plasma samples. Modest decreases in glycerol, two fatty acids (myristic and lauric acids), and acetoacetate from exhaled breath samples following CPET differed from increases measured for many lipid-related metabolites in plasma samples [9,10,28,41,42,43].
We hypothesised that measured intensities correlate linearly with exhaled metabolite concentration. A linear correlation between slightly volatile metabolite concentrations in blood and exhaled breath samples has been reported [19,44]. The contrasting pre-to-post-exercise patterns in metabolites measured in breath versus plasma samples cannot be easily explained, and will require additional research. One potential explanation is that during CPET, ventilation rates increase and thus dilute the concentrations of low-volatility metabolites that are being translocated from the circulation into exhaled breath samples [26]. Another potential explanation is the change in salivary composition with exercise intensity [12,45]. Two ketone bodies, acetoacetate and hydroxybutyrate, showed a short-term increase in the recovery phase when ventilation rates dropped quickly, perhaps reflecting that rates of production and transference to exhaled air outstripped disappearance rates.
Human breath contains many types of endogenous volatile organic compounds (VOCs), and the non-invasive detection of these trace gases (breathomics) has the potential for use in monitoring disease, medication responses, environmental exposure, and changes in metabolic and physiological function [13,46]. Breath isoprene, for example, may emerge as a clinically important breath metabolite, but its putative metabolic origin is still being debated, hindering its acceptance as a diagnostic marker. King et al. [13] showed that during 15 min of moderate cycling with breath-by-breath monitoring of VOCs, both isoprene and methyl acetate in exhaled breath increased sharply within the first minute of exercise. However, due to the negative ionization used in our study we are not able to measure acetone and isoprene and compare the results. These types of VOCs may be sensitive indicators of fluctuations in blood and respiratory flow rates, but the underlying physiological sources and mechanisms remain speculative.

4. Materials and Methods

4.1. Study Design

This was an exploratory study that included a CPET combined with mass spectrometric breath monitoring. Fourteen trained, normal weight and healthy male and female young adult subjects were recruited. In order to standardize blood glucose content, subjects were asked to drink a carbohydrate drink (long energy, Sponser, Wollerau Switzerland) two hours before testing (1.5 g/kg body weight). Furthermore, subjects were asked to refrain from sports activities one day before testing, and from eating, drinking (except water), chewing gum, lozenge, brushing their teeth, and using facial cosmetics at least one hour prior to the test. We conducted this study in accordance with the ethical principles of the Declaration of Helsinki and the Business Administration System for Ethics Committees (BASEC 2019-0030). All participants provided written informed consent.

4.2. CPET and Spirometry

CPET was performed on a bicycle ergometer (Excalibur Sport, LODE, Groningen, The Netherlands) connected to MetaLyzer software (MetaLyzer 3B-R3, Cortex, Leipzip, Germany). Before the CPET started, all subjects performed a spirometry test. Subjects followed a CPET protocol adapted from the recommendations of Radtke, T. et al. [47], with a resting phase of 2 min, a warm-up phase of 3 min at 10 Watts, a ramp with continuously increasing load (female, 25 Watts per minute; male, 30 Watts per minute; cadence 80–90 per minute) until voluntary exhaustion, and a recovery phase of 5 min at 10 Watts. At the beginning of the CPET and right before the end of the ramp, arterial blood was taken to measure lactate with ABL90 Flex plus, (Radiometer, Denmark). Subjective exertion and dyspnea was assessed using an adapted Borg subjective assessment scale (0 = no dyspnea and no exhaustion responses, 10 = maximal dyspnea and exhaustion responses) [48].

4.3. SESI-HRMS

Subjects wore an adapted CPET facemask connected to both the turbine of the CPET and the SESI-HRMS. Air was sucked through an extended sampling line coated with SilcoNert 2000 (SilcoTek GmbH, Bad Homburg, Germany) to the secondary electrospray ionization source (SuperSESI, FIT, Madrid, Spain) and into the orbitrap mass spectrometer (QExative Plus, ThermoFisher, Waltham, MA, USA). The sampling line was heated to 130 °C to prevent adsorption or condensation. The spray solution consisted of 0.1% formic acid in water (LC-MS grade, Merck, Darmstadt, Germany). We used 20 µm diameter capillaries with a length of 50 cm (New Objectives, Littleton, CO, USA), and a starting pressure of 1.3 bar. The ion core was heated to 90 °C, exhaust flow rate was limited to 450 mL/min, and a current of 3.5 kV and no aux gas or sweep gas were used.
On the QExactive the following settings were used: resolution of 70,000 at 200 m/z, 1 micro scan, a range of 50–750 m/z, automatic gain control target 1 × 10⁶, maximum injection time 200 ms; and the ion transfer capillary was heated to 275 °C.
The monitoring frequency was three scans per second. The sample flow was determined by the vacuum pump and was approximately 1 L per minute. Acquisition was started and stopped simultaneously to CPET.

4.4. Data Analysis

The raw mass spectrometric data were converted to the open format *.mzXML by MSConvert (ProteoWizard) [49]. For the processing of the data, the functions “mzxmlread”, “mzxml2peaks” and “mspeaks” in Matlab R2020a (MathWorks) were used. The summed intensities of each peak within full width half maximum were used for further analysis. Exhalations were extracted using a homemade algorithm based on the feature m/z 60.9931, which showed reproducible behavior of the exhalations.
CPET data was exported to *.xlsx files. The continuous data was interpolated with “pchip” to steps of 0.3 s and matched to the closest time point of the mass spectrometric data. The key values (ventilatory threshold 1, ventilatory threshold 2, etc.) were set by blinded experts, imported, and used for further calculations. For time series cluster analysis, features with less than 50% zero values (present in at least 80% of the subjects) were included. The normalized moving mean of the time series of features were clustered using “clusterdata” algorithm. Functional analysis was done using mummichog algorithm of Metaboanalyst 5.0 [50]. For enrichment analysis, q-values were calculated from p-values with “fdr_bh” based on 659 features detected in negative ionization mass spectrometry [51]. p-values were calculated with Wilcoxon signed rank test by pairwise comparisons of the area under the curve within 50 scans at the start on the ramp and at VO2max. To determine significance in boxplots, q-values were calculated as mentioned above. Q-values of ≤0.001 were considered significant. In this study, we focused on negatively charged ions.
Metabolites were identified by exact mass, enrichment analysis, and previously known exhaled metabolites.

5. Conclusions

This exploratory study showed that continuous monitoring of metabolites in exhaled air at high time resolution (three spectra per second) with SESI-HRMS during graded exercise was feasible. We were able to observe significant changes in glyoxylate and dicarboxylate, tricarboxylic acid cycle (TCA), and tryptophan metabolic pathways. Our findings suggest that continuous monitoring of metabolite shifts from exhaled air during exercise should focus on monitoring platforms dedicated to volatile and slightly volatile metabolites.

Supplementary Materials

The following are available online at https://www.mdpi.com/article/10.3390/metabo11120856/s1, Figure S1: Arterial blood gas analysis of lactate, Figure S2: Heat maps of features, Figure S3: CPET protocol, Figure S4: Metabolite intensity for each subject.

Author Contributions

Conceptualization, M.O., J.S. (Jörg Spörri), J.S. (Johannes Scherr) and M.K.; methodology, M.O., J.S. (Jörg Spörri), J.S. (Johannes Scherr) and M.K.; formal analysis, M.O., N.N. and P.S.; investigation, M.O., D.K. and N.A.S.; data curation, M.O. and P.S.; writing—original draft preparation, M.O.; writing—review and editing, all; visualization, M.O.; supervision, D.N., N.A.S., J.S. (Johannes Scherr) and M.K.; project administration, M.O.; funding acquisition and resources, J.S. (Johannes Scherr) and M.K. All authors have read and agreed to the published version of the manuscript.

Funding

This project is part of the Zürich Exhalomics project, a flagship project of ‘‘University Medicine Zürich. The research received no external funding.

Institutional Review Board Statement

The study was conducted according to the guidelines of the Declaration of Helsinki, and approved by the Ethics Committee of the canton of Zürich (BASEC 2019-0030 and 2 August 2019).

Informed Consent Statement

Informed consent was obtained from all subjects involved in the study.

Data Availability Statement

Data supporting reported results can be found on the openly available repository Zora.

Conflicts of Interest

The authors declare no conflict of interest.

References

  1. WHO. Physical Activity. Available online: https://www.who.int/news-room/fact-sheets/detail/physical-activity (accessed on 7 May 2021).
  2. Yang, X.; Li, Y.; Ren, X.; Xiong, X.; Wu, L.; Li, J.; Wang, J.; Gao, Y.; Shang, H.; Xing, Y. Effects of exercise-based cardiac rehabilitation in patients after percutaneous coronary intervention: A meta-analysis of randomized controlled trials. Sci. Rep. 2017, 7, 44789. [Google Scholar] [CrossRef] [PubMed]
  3. Gordon, B.; Chen, S.; Durstine, J.L. The effects of exercise training on the traditional lipid profile and beyond. Curr. Sports Med. Rep. 2014, 13, 253–259. [Google Scholar] [CrossRef]
  4. World Health Organization. Global Recommendations on Physical Activity for Health; WHO: Geneva, Switzerland, 2010. [Google Scholar]
  5. Schranner, D.; Kastenmüller, G.; Schönfelder, M.; Römisch-Margl, W.; Wackerhage, H. Metabolite Concentration Changes in Humans After a Bout of Exercise: A Systematic Review of Exercise Metabolomics Studies. Sports Med. Open 2020, 6, 11. [Google Scholar] [CrossRef] [Green Version]
  6. Sakaguchi, C.A.; Nieman, D.C.; Signini, E.F.; Abreu, R.M.; Catai, A.M. Metabolomics-Based Studies Assessing Exercise-Induced Alterations of the Human Metabolome: A Systematic Review. Metabolites 2019, 9, 164. [Google Scholar] [CrossRef] [Green Version]
  7. Hargreaves, M.; Spriet, L.L. Skeletal muscle energy metabolism during exercise. Nat. Metab. 2020, 2, 817–828. [Google Scholar] [CrossRef]
  8. van Loon, L.J.; Greenhaff, P.L.; Constantin-Teodosiu, D.; Saris, W.H.; Wagenmakers, A.J. The effects of increasing exercise intensity on muscle fuel utilisation in humans. J. Physiol. 2001, 536, 295–304. [Google Scholar] [CrossRef] [PubMed]
  9. Contrepois, K.; Wu, S.; Moneghetti, K.J.; Hornburg, D.; Ahadi, S.; Tsai, M.-S.; Metwally, A.A.; Wei, E.; Lee-McMullen, B.; Quijada, J.V.; et al. Molecular Choreography of Acute Exercise. Cell 2020, 181, 1112–1130. [Google Scholar] [CrossRef]
  10. Nayor, M.; Shah, R.V.; Miller, P.E.; Blodgett, J.B.; Tanguay, M.; Pico, A.R.; Murthy, V.L.; Malhotra, R.; Houstis, N.E.; Deik, A.; et al. Metabolic Architecture of Acute Exercise Response in Middle-Aged Adults in the Community. Circulation 2020, 142, 1905–1924. [Google Scholar] [CrossRef] [PubMed]
  11. Amann, A.; Miekisch, W.; Schubert, J.; Buszewski, B.; Ligor, T.; Jezierski, T.; Pleil, J.; Risby, T. Analysis of Exhaled Breath for Disease Detection. Annu. Rev. Anal. Chem. 2014, 7, 455–482. [Google Scholar] [CrossRef] [PubMed]
  12. Smith, D.; Chippendale, W.E.T.; Dryahina, K.; Spanel, P. SIFT-MS Analysis of Nose-Exhaled Breath; Mouth Contamination and the Influence of Exercise. Curr. Anal. Chem. 2013, 9, 565–575. [Google Scholar] [CrossRef]
  13. King, J.; Kupferthaler, A.; Unterkofler, K.; Koc, H.; Teschl, S.; Teschl, G.; Miekisch, W.; Schubert, J.; Hinterhuber, H.; Amann, A. Isoprene and acetone concentration profiles during exercise on an ergometer. J. Breath Res. 2009, 3, 027006. [Google Scholar] [CrossRef]
  14. Heaney, L.M.; Lindley, M.R. Translation of exhaled breath volatile analyses to sport and exercise applications. Metab. Off. J. Metab. Soc. 2017, 13, 139. [Google Scholar] [CrossRef] [Green Version]
  15. Grapov, D.; Fiehn, O.; Campbell, C.; Chandler, C.J.; Burnett, D.J.; Souza, E.C.; Casazza, G.A.; Keim, N.L.; Newman, J.W.; Hunter, G.R.; et al. Exercise plasma metabolomics and xenometabolomics in obese, sedentary, insulin-resistant women: Impact of a fitness and weight loss intervention. Am. J. Physiol. Endocrinol. Metab. 2019, 317, E999–E1014. [Google Scholar] [CrossRef]
  16. Grapov, D.; Fiehn, O.; Campbell, C.; Chandler, C.J.; Burnett, D.J.; Souza, E.C.; Casazza, G.A.; Keim, N.L.; Hunter, G.R.; Fernandez, J.R.; et al. Impact of a weight loss and fitness intervention on exercise-associated plasma oxylipin patterns in obese, insulin-resistant, sedentary women. Physiol. Rep. 2020, 8, e14547. [Google Scholar] [CrossRef] [PubMed]
  17. Zhang, J.; Light, A.R.; Hoppel, C.L.; Campbell, C.; Chandler, C.J.; Burnett, D.J.; Souza, E.C.; Casazza, G.A.; Hughen, R.W.; Keim, N.L.; et al. Acylcarnitines as markers of exercise-associated fuel partitioning, xenometabolism, and potential signals to muscle afferent neurons. Exp. Physiol. 2017, 102, 48–69. [Google Scholar] [CrossRef] [Green Version]
  18. Bruderer, T.; Gaisl, T.; Gaugg, M.T.; Nowak, N.; Streckenbach, B.; Müller, S.; Moeller, A.; Kohler, M.; Zenobi, R. On-Line Analysis of Exhaled Breath. Chem. Rev. 2019, 119, 10803–10828. [Google Scholar] [CrossRef] [PubMed]
  19. Nowak, N.; Gaisl, T.; Miladinovic, D.; Marcinkevics, R.; Osswald, M.; Bauer, S.; Buhmann, J.; Zenobi, R.; Sinues, P.; Brown, S.A.; et al. Rapid and reversible control of human metabolism by individual sleep states. Cell Rep. 2021, 37, 109903. [Google Scholar] [CrossRef]
  20. Tejero Rioseras, A.; Singh, K.D.; Nowak, N.; Gaugg, M.T.; Bruderer, T.; Zenobi, R.; Sinues, P.M. Real-Time Monitoring of Tricarboxylic Acid Metabolites in Exhaled Breath. Anal. Chem. 2018, 90, 6453–6460. [Google Scholar] [CrossRef] [PubMed]
  21. Anokhina, T.N.; Anaev, E.K.; Revelsky, A.I.; Revelsky, I.A.; Chuchalin, A.G. Saturated fatty acids in exhaled breath condensate in COPD patients. Eur. Respir. J. 2012, 40, P2207. [Google Scholar]
  22. Gaugg, M.T.; Bruderer, T.; Nowak, N.; Eiffert, L.; Martinez-Lozano Sinues, P.; Kohler, M.; Zenobi, R. Mass-Spectrometric Detection of Omega-Oxidation Products of Aliphatic Fatty Acids in Exhaled Breath. Anal. Chem. 2017, 89, 10329–10334. [Google Scholar] [CrossRef]
  23. Schader, J.F.; Haid, M.; Cecil, A.; Schoenfeld, J.; Halle, M.; Pfeufer, A.; Prehn, C.; Adamski, J.; Nieman, D.C.; Scherr, J. Metabolite Shifts Induced by Marathon Race Competition Differ between Athletes Based on Level of Fitness and Performance: A Substudy of the Enzy-MagIC Study. Metabolites 2020, 10, 87. [Google Scholar] [CrossRef] [Green Version]
  24. Gibala, M.J.; MacLean, D.A.; Graham, T.E.; Saltin, B. Tricarboxylic acid cycle intermediate pool size and estimated cycle flux in human muscle during exercise. Am. J. Physiol. -Endocrinol. Metab. 1998, 275, E235–E242. [Google Scholar] [CrossRef] [PubMed]
  25. Lewis, G.D.; Farrell, L.; Wood, M.J.; Martinovic, M.; Arany, Z.; Rowe, G.C.; Souza, A.; Cheng, S.; McCabe, E.L.; Yang, E.; et al. Metabolic signatures of exercise in human plasma. Sci. Transl. Med. 2010, 2, 33ra37. [Google Scholar] [CrossRef] [PubMed] [Green Version]
  26. Martin, K.S.; Azzolini, M.; Lira Ruas, J. The kynurenine connection: How exercise shifts muscle tryptophan metabolism and affects energy homeostasis, the immune system, and the brain. Am. J. Physiol.-Cell Physiol. 2020, 318, C818–C830. [Google Scholar] [CrossRef]
  27. Lenard, N.R.; Gettys, T.W.; Dunn, A.J. Activation of β2- and β3-adrenergic receptors increases brain tryptophan. J. Pharmacol. Exp. Ther. 2003, 305, 653–659. [Google Scholar] [CrossRef]
  28. Horowitz, J.F.; Klein, S. Lipid metabolism during endurance exercise. Am. J. Clin. Nutr. 2000, 72, 558S–563S. [Google Scholar] [CrossRef] [Green Version]
  29. Poole, R.C.; Halestrap, A.P. Transport of lactate and other monocarboxylates across mammalian plasma membranes. Am. J. Physiol.-Cell Physiol. 1993, 264, C761–C782. [Google Scholar] [CrossRef] [PubMed]
  30. Kamp, F.; Hamilton, J.A. How fatty acids of different chain length enter and leave cells by free diffusion. Prostaglandins Leukot. Essent. Fat. Acids 2006, 75, 149–159. [Google Scholar] [CrossRef] [PubMed]
  31. Wright, E.M.; Loo, D.D.; Hirayama, B.A. Biology of human sodium glucose transporters. Physiol. Rev. 2011, 91, 733–794. [Google Scholar] [CrossRef] [PubMed] [Green Version]
  32. Murray, B.; Rosenbloom, C. Fundamentals of glycogen metabolism for coaches and athletes. Nutr. Rev. 2018, 76, 243–259. [Google Scholar] [CrossRef] [Green Version]
  33. Pinckaers, P.J.M.; Churchward-Venne, T.A.; Bailey, D.; van Loon, L.J.C. Ketone Bodies and Exercise Performance: The Next Magic Bullet or Merely Hype? Sports Med. 2017, 47, 383–391. [Google Scholar] [CrossRef] [Green Version]
  34. Puchalska, P.; Crawford, P.A. Multi-dimensional Roles of Ketone Bodies in Fuel Metabolism, Signaling, and Therapeutics. Cell Metab. 2017, 25, 262–284. [Google Scholar] [CrossRef] [Green Version]
  35. Kimura, I.; Inoue, D.; Maeda, T.; Hara, T.; Ichimura, A.; Miyauchi, S.; Kobayashi, M.; Hirasawa, A.; Tsujimoto, G. Short-chain fatty acids and ketones directly regulate sympathetic nervous system via G protein-coupled receptor 41 (GPR41). Proc. Natl. Acad. Sci. USA 2011, 108, 8030–8035. [Google Scholar] [CrossRef] [Green Version]
  36. Achanta, L.B.; Rae, C.D. β-Hydroxybutyrate in the Brain: One Molecule, Multiple Mechanisms. Neurochem. Res. 2017, 42, 35–49. [Google Scholar] [CrossRef] [PubMed]
  37. Glozak, M.A.; Sengupta, N.; Zhang, X.; Seto, E. Acetylation and deacetylation of non-histone proteins. Gene 2005, 363, 15–23. [Google Scholar] [CrossRef]
  38. Zouhal, H.; Jacob, C.; Delamarche, P.; Gratas-Delamarche, A. Catecholamines and the effects of exercise, training and gender. Sports Med. (Auckl. N. Z.) 2008, 38, 401–423. [Google Scholar] [CrossRef] [PubMed]
  39. Kjaer, M. Hepatic glucose production during exercise. Adv. Exp. Med. Biol. 1998, 441, 117–127. [Google Scholar]
  40. Miura, Y. The biological significance of ω-oxidation of fatty acids. Proc. Jpn. Acad. Ser. B 2013, 89, 370–382. [Google Scholar] [CrossRef] [Green Version]
  41. Evans, M.; Cogan, K.E.; Egan, B. Metabolism of ketone bodies during exercise and training: Physiological basis for exogenous supplementation. J. Physiol. 2017, 595, 2857–2871. [Google Scholar] [CrossRef] [PubMed] [Green Version]
  42. Danaher, J.; Gerber, T.; Wellard, R.M.; Stathis, C.G.; Cooke, M.B. The use of metabolomics to monitor simultaneous changes in metabolic variables following supramaximal low volume high intensity exercise. Metab. Off. J. Metab. Soc. 2015, 12, 7. [Google Scholar] [CrossRef] [Green Version]
  43. Zafeiridis, A.; Chatziioannou, A.C.; Sarivasiliou, H.; Kyparos, A.; Nikolaidis, M.G.; Vrabas, I.S.; Pechlivanis, A.; Zoumpoulakis, P.; Baskakis, C.; Dipla, K.; et al. Global Metabolic Stress of Isoeffort Continuous and High Intensity Interval Aerobic Exercise: A Comparative 1H NMR Metabonomic Study. J. Proteome Res. 2016, 15, 4452–4463. [Google Scholar] [CrossRef] [Green Version]
  44. Garcia-Gomez, D.; Gaisl, T.; Bregy, L.; Cremonesi, A.; Sinues, P.M.; Kohler, M.; Zenobi, R. Real-Time Quantification of Amino Acids in the Exhalome by Secondary Electrospray Ionization-Mass Spectrometry: A Proof-of-Principle Study. Clin. Chem. 2016, 62, 1230–1237. [Google Scholar] [CrossRef] [Green Version]
  45. Chicharro, J.L.; Lucía, A.; Pérez, M.; Vaquero, A.F.; Ureña, R. Saliva Composition and Exercise. Sports Med. 1998, 26, 17–27. [Google Scholar] [CrossRef]
  46. King, J.; Koc, H.; Unterkofler, K.; Mochalski, P.; Kupferthaler, A.; Teschl, G.; Teschl, S.; Hinterhuber, H.; Amann, A. Physiological modeling of isoprene dynamics in exhaled breath. J. Theor. Biol. 2010, 267, 626–637. [Google Scholar] [CrossRef] [PubMed] [Green Version]
  47. Radtke, T.; Crook, S.; Kaltsakas, G.; Louvaris, Z.; Berton, D.; Urquhart, D.S.; Kampouras, A.; Rabinovich, R.A.; Verges, S.; Kontopidis, D.; et al. ERS statement on standardisation of cardiopulmonary exercise testing in chronic lung diseases. Eur. Respir. Rev. 2019, 28, 180101. [Google Scholar] [CrossRef] [PubMed] [Green Version]
  48. Borg, G.A. Psychophysical bases of perceived exertion. Med. Sci. Sports Exerc. 1982, 14, 377–381. [Google Scholar] [CrossRef]
  49. Chambers, M.C.; Maclean, B.; Burke, R.; Amodei, D.; Ruderman, D.L.; Neumann, S.; Gatto, L.; Fischer, B.; Pratt, B.; Egertson, J.; et al. A cross-platform toolkit for mass spectrometry and proteomics. Nat. Biotechnol. 2012, 30, 918–920. [Google Scholar] [CrossRef]
  50. Xia, J.; Wishart, D.S. Web-based inference of biological patterns, functions and pathways from metabolomic data using MetaboAnalyst. Nat. Protoc. 2011, 6, 743–760. [Google Scholar] [CrossRef]
  51. David Groppe. MATLAB Central File Exchange. 2021. Available online: https://www.mathworks.com/matlabcentral/fileexchange/27418-fdr_bh (accessed on 8 December 2021).
Figure 1. Metabolic pathways map. Metabolites that were identified in exhaled breath are marked with dark colour, while lighter colors are used for unidentified metabolites that demarcate important points in the pathways. Pathways including metabolites that decreased significantly between the start of the ramp and VO2max are: (A): blue for glyoxylate metabolism; (B): yellow for TCA cycle; and (C): grey-blue for tryptophan metabolism. Trends for changes in metabolite intensities are marked with arrows. Furthermore, (D): glycolysis is marked in green, lipid metabolism in brown, and ketone pathway in red. Summary data for each identified metabolite are represented with box plots (with median, quartiles, maxima and outliers) using intensities for all subjects from the start on the ramp to VO2max. Continuous intensity data over time are represented from one sample subject (subject 6).
Metabolites 11 00856 g001aMetabolites 11 00856 g001bMetabolites 11 00856 g001cMetabolites 11 00856 g001d
Figure 2. Intensity data over time from one sample subject (subject 6). Solid vertical lines represent the start on the ramp, dashed vertical lines represent VO2max. The left y-axis represents the ketone bodies in (A) and hydroxybutyrate in (B,C), respectively. The right y-axis represents the other metabolites. (A): Hydroxybutyrate (OHB), acetoacetate, and fragments; (B): OHB, hexose and deoxypentose; (C): OHB, stearate, palmitate, myristate and laurate; (D): OHB, hydroxydecenoate, oxodecanoate and oxodecenoate.
Metabolites 11 00856 g002
Table 1. Participant characteristics.
CharacteristicSubjects (N = 13)
Sex = male (%)6 (46.2)
Age (median [IQR]), years30.0 [27.0, 31.0]
BMI (median [IQR]), kg/m222.8 [22.3, 24.0]
Weight (median [IQR]), kg70.0 [62.5, 77.7]
Smoking = no (%)13 (100.0)
Spirometry
FVC 1 (median [IQR]), L
5.3 [4.3, 6.4]
FVC 1 % predicted (median [IQR])124.0 [110.0, 128.0]
FEV1 2 (median [IQR])4.3 [3.7, 5.0]
FEV1 2 % predicted (median [IQR])110.0 [106.0, 120.0]
FEV1/FVC 3 (median [IQR])81.0 [76.0, 84.0]
Exercise per Week
Activity number (median [IQR])
4.5 [2.0, 6.0]
Activity duration (median [IQR]), min150.0 [120.0, 210.0]
Activity intensity 4 = moderate (%)13 (100.0)
Adapted Borg scale (0–10)
Dyspnea start (median [IQR])
0.0 [0.0, 0.5]
Legs start (median [IQR])1.0 [0.5, 1.0]
Dyspnea end (median [IQR])9.5 [9.0, 10.0]
Legs end (median [IQR])9.0 [7.5, 9.8]
Cardiopulmonary exercise test
HR 5 at VT1 6 (median [IQR]), beats per min
141.0 [123.0, 144.0]
HR 5 at VT2 7 (median [IQR]), beats per min168.5 [163.8, 179.0]
Maximal HR 5 (median [IQR]), beats per min185.0 [183.0, 190.0]
Power at VT1 6 (median [IQR]), W138.0 [88.0, 190.0]
Power at VT2 7 (median [IQR]), W234.5 [213.5, 296.2]
Maximal Power (median [IQR]), W290.0 [261.0, 366.0]
VO2max 8 (median [IQR]), mL/min/kg50.0 [47.0, 53.0]
1 FVC = forced vital capacity, 2 FEV1 = forced expiratory volume in 1 s, 3 FEV1/FVC = ratio of forced vital capacity to forced expiratory volume in 1 s, 4 Activity intensity = percent with a median subjective moderate activity intensity, 5 HR = heart rate, 6 VT1 = ventilatory threshold 1, 7 VT2 = ventilatory threshold 2, 8 VO2max = maximum oxygen consumption.
Table 2. Identification state of exhaled metabolites.
Sum FormulaCompound NameMeasured Mass
(M-H) 1
Exact Mass
(M-H) 1
Mass Error
(ppm) 2
Identified Based on Course of Metabolites during Exercise 3
C6H12O6hexose179.0562179.05563.56exact mass & pathway mapping,
and Nowak, N. et al. [19]
C5H10O4deoxypentose133.0507133.05014.63exact mass & pathway mapping
C5H10O5pentose149.0455149.04503.37exact mass & pathway mapping,
and Nowak, N. et al. [19]
C3H4O3pyruvate87.008887.00826.68exact mass & pathway mapping
C2H4O2glycolaldehyde59.013959.013310.09exact mass & pathway mapping
C3H6O4glycerate105.0193105.01884.92exact mass & pathway mapping
C3H4O4hydroxypyruvate103.0037103.00315.5exact mass & pathway mapping
C2H2O3glyoxylate72.993172.99267.28exact mass & pathway mapping
C2H2O4oxalate88.988188.98756.93exact mass & pathway mapping
C2H3O3glycolate75.008875.00827.75exact mass & pathway mapping
C2H4NO2glycine74.024874.02428.06exact mass & pathway mapping
C4H6O3acetoacetate
/oxobutyric acid
101.0244101.02395.26exact mass & pathway mapping
C4H8O3hydroxybutyrate103.0401103.03955.64exact mass & pathway mappingConstant
C4H4O5oxaloacetate130.9986130.99804.21exact mass & pathway mapping,
and Rioseras, A. et al. [20]
C4H6O5malate133.0143133.01374.52exact mass & pathway mapping,
and Rioseras, A. et al. [20]
C4H4O4fumarate115.0037115.00314.93exact mass & pathway mapping,
and Rioseras, A. et al. [20]
C4H6O4succinate117.0194117.01885.27exact mass & pathway mapping,
and Rioseras, A. et al. [20]
C5H6O5oxoglutarate145.0142145.01373.46exact mass & pathway mapping,
and Rioseras, A. et al. [20]
C6H7NO42-aminomuconate156.0302156.02973.32exact mass & pathway mapping
C6H8O5oxoadipate159.0299159.02933.47exact mass & pathway mapping
C8H7NO3formylanthranilate164.0353164.03483.24exact mass & pathway mapping
C7H7NO2anthranilate136.0404136.03994.02exact mass & pathway mapping
C6H7NO32-aminomuconate
semialdehyde
140.0353140.03483.8exact mass & pathway mapping
C7H7NO33-hydroxyanthranilate152.0353152.03483.5exact mass & pathway mapping
C6H5NO2picolinate122.0248122.02424.89exact mass & pathway mapping
C3H8O3glycerole91.040191.039526.38exact mass & pathway mapping
C12H24O2dodecanoic acid
/lauric acid
199.1705199.16983.49exact mass & pathway mapping
C14H28O2tetradecanoic acid
/myristic acid
227.2018227.20113.06exact mass & pathway mapping
C18H36O2octadecanoic acid283.2643283.26372.1exact mass, and
Anokhina, T.N. et al. [21]
C16H32O2hexadecanoic acid255.2329255.23241.94exact mass, and
Anokhina, T.N. et al. [21]
C10H20O3hyroxydecanoic acid187.1341187.13343.64exact mass and
Gaugg, M. et al. [22]
C10H16O3oxodecenoic acid183.1028183.10213.72exact mass
C12H20O3oxododecenoic acid211.1340211.13342.75exact mass
1 (M-H)—deprotonated molecule; 2 ppm—parts per million; 3 courses between start on ramp and maximal ventilatory oxygen uptake.
Publisher’s Note: MDPI stays neutral with regard to jurisdictional claims in published maps and institutional affiliations.

