Article

Tree Species and Epiphyte Taxa Determine the “Metabolomic niche” of Canopy Suspended Soils in a Species-Rich Lowland Tropical Rainforest

1
Global Change Research Institute of the Czech Academy of Sciences, The Czech Academy of Sciences, Bělidla 986/4a, CZ-60300 Brno, Czech Republic
2
Global Ecology Unit CREAF-CSIC-UAB, Consejo Superior de Investigaciones Científicas (CSIC), Bellaterra, 08193 Catalonia, Spain
3
CREAF, Cerdanyola del Vallès, 08193 Catalonia, Spain
4
Department of Zoology, College of Science, King Saud University, P.O. Box 2455, Riyadh 11451, Saudi Arabia
5
Centre of Microbiology and Environmental Systems Science, University of Vienna, Althanstrasse 14, 1090 Vienna, Austria
6
Department of Biology, University of Antwerp, BE-2610 Wilrijk, Belgium
7
Centre for Ecology and Conservation, University of Exeter, Penryn TR10 9FE, UK
8
AMAP, University Montpellier, CIRAD, CNRS, INRAE, IRD, 34000 Montpellier, France
9
ECOFOG, CNRS, CIRAD, AgroParisTech, INRAE, Université des Antilles, Université de Guyane, 97310 Kourou, France
*
Author to whom correspondence should be addressed.
Metabolites 2021, 11(11), 718; https://doi.org/10.3390/metabo11110718
Submission received: 29 July 2021 / Revised: 23 September 2021 / Accepted: 28 September 2021 / Published: 21 October 2021
(This article belongs to the Special Issue Metabolomics in Plant Environmental Physiology)

Abstract

:
Tropical forests are biodiversity hotspots, but it is not well understood how this diversity is structured and maintained. One hypothesis rests on the generation of a range of metabolic niches, with varied composition, supporting a high species diversity. Characterizing soil metabolomes can reveal fine-scale differences in composition and potentially help explain variation across these habitats. In particular, little is known about canopy soils, which are unique habitats that are likely to be sources of additional biodiversity and biogeochemical cycling in tropical forests. We studied the effects of diverse tree species and epiphytes on soil metabolomic profiles of forest floor and canopy suspended soils in a French Guianese rainforest. We found that the metabolomic profiles of canopy suspended soils were distinct from those of forest floor soils, differing between epiphyte-associated and non-epiphyte suspended soils, and the metabolomic profiles of suspended soils varied with host tree species, regardless of association with epiphyte. Thus, tree species is a key driver of rainforest suspended soil metabolomics. We found greater abundance of metabolites in suspended soils, particularly in groups associated with plants, such as phenolic compounds, and with metabolic pathways related to amino acids, nucleotides, and energy metabolism, due to the greater relative proportion of tree and epiphyte organic material derived from litter and root exudates, indicating a strong legacy of parent biological material. Our study provides evidence for the role of tree and epiphyte species in canopy soil metabolomic composition and in maintaining the high levels of soil metabolome diversity in this tropical rainforest. It is likely that a wide array of canopy microsite-level environmental conditions, which reflect interactions between trees and epiphytes, increase the microscale diversity in suspended soil metabolomes.

1. Introduction

Tropical rainforests are one of the world’s most biodiverse [1,2,3], yet threatened ecosystems [4,5], in which the origin and maintenance of high levels of local-scale tree species coexistence [3,6] have been explained by several factors, including heterogeneity of levels of disturbance [1] and soil traits and nutrients [2,7,8,9,10,11,12], micro-site singularities [13], topographical features [14] (such as slope aspect and steepness [15], and long-term divergences in species-specific defenses against herbivores [16]. Rainforest canopies host large numbers of floral and faunal specialists with evolved adaptations to niches that are distinct from those elsewhere in the rainforest ecosystem [17]. However, rainforest canopy communities remain poorly studied, despite their critical role in global climate function and cycling of carbon and nitrogen [18]. Investigating soils suspended in the canopy (i.e., suspended soils, epiphyte-associated soils) is particularly challenging, but it is believed that wide gradients in environmental conditions have led to the development, through biological adaptation processes, of distinct micro-habitats comprising characteristic species [19,20,21] to create within-ecosystem biodiversity hotspots. For example, although tropical rainforest suspended soils sustain a complex and diverse faunal trophic food web structure similar to that of forest floor soils [22], trophic positions tend to be occupied by contrasting species [23,24] that further boost the overall high levels of biodiversity of these ecosystems [25].
Suspended soils along tree trunks and branches retain nutrients and water essential for the development of epiphytic plants [26] that directly depend on these limited pools of available nutrients [27]. These plants are morphologically and physiologically adapted to facilitate the accumulation of leaf litter and water and to maximize atmospheric and invertebrate-mediated delivery of nutrients [15,28,29] in the physically harsh and variable environmental conditions that prevail within the canopy [30]. Epiphytes represent up to 35% of the vascular floral diversity of wet tropical forests [31,32], and studies of these plants have tended to focus on water and nutrient uptake strategies [33]. Epiphytes have evolved numerous remarkable adaptations to facilitate nutrient uptake. For example, certain members of the Bromeliaceae family form water and litter-storing phytotelmata and take up nutrients through leaf-absorbing trichomes [29,34,35], whilst Asplenium ferns intercept falling leaf litter, which is then stored as organic matter adjacent to the roots [27,36]. For both epiphytes, this accumulation of leaf litter leads to the formation of organic matter or epiphyte-associated soils that harbor characteristic levels of microbial diversity [37,38]. The extent of this harboring is not well understood, in part due to the difficulty of sampling this habitat, but also due to our inability to characterize the entire spectrum of the metabolome. Little is known about variation in the chemical composition of the organic matter in these suspended and epiphyte-associated soils, or about their association with canopy position or tree species [39].
The study of complex chemical and physiological traits of suspended soils is challenging, given that well established analytical methods tend to focus on individual or specific groups of compounds [40], such as chemical defensive molecules acting as toxins and deterrents [41]. The plant metabolome comprises a complex set of primary (sugars, amino acids, and nucleotides) and secondary metabolites (terpenoids and phenolics) that are synthesized by plants in response to specific environmental conditions [42]. The analysis of the whole soil metabolome has been demonstrated to reflect metabolic function across soil microbial, floral, and faunal communities [43] and may be used as a proxy for soil community composition and function [44,45]. Thus, the development of highly sensitive ecometabolomic techniques enables us to study metabolic responses to dynamic shifts and gradients in environmental conditions at a range of scales, from the plant to the ecosystem [40,46,47].
Tree diversity has been shown to influence soil heterogeneity in tropical forests [48], whereby the impacts of differences in litter species composition and their released leachate shapes both forest floor traits [49,50] and suspended canopy soils [24]. Thus, changes in soil traits and contrasting microbe community composition, nutrient status, and enzyme content of forest floor and suspended soils have been observed to depend on tree species [26,38,51]. Canopy soils have higher concentrations of organic matter than ground soils [17,52]. A recent study in a tropical mountain rainforest in Costa Rica revealed that canopy soils harbor very different symbiotic and fungi communities compared to ground soils and have much more enzymatic activity [26]. Here, we use metabolomic analyses to test the hypotheses that (i) tropical forest epiphyte-associated soil metabolome profiles vary depending on the epiphyte taxa, (ii) suspended soil and epiphyte-associated soil metabolomes differ in their composition, and (iii) these differences are shaped by tree species creating a wide array of distinct metabolome niches. We expect that canopy soil metabolomes contrast with those of the forest floor, and that the differences will depend on the organic matter acquisition strategies of epiphytes or of microbes, within-canopy niche position, microclimate conditions [53], and host tree species characteristics [24].

2. Results

Soil metabolomes differed as a result of their sample location (forest floor versus canopy) and their association with other plants (host tree and epiphyte species) (Table 1 and Table 2). These findings were revealed by their separation along the first two axes of the corresponding PLSDA biplots for soil type (Figure 1), tree species (Figure 2), and epiphyte-associated and suspended soils (Figure 3 and Figure 4), accounting for 24, 10, and 13% of the variation in metabolome, respectively. Overall, an abundance of 2496 of the 2757 metabolite signals were higher in suspended soils than in forest floor soils, particularly for groups that include phenolic, aliphatic, and polycyclic aromatic compounds; unsaturated fatty acids; terpenes; most sugars; organic and amino acids associated with the Krebs cycle (succinic, lactic, malic, citric, chlorogenic, pyruvic, jasmonic, and abscisic acids); and those with nitrogenous bases (adenosine, guanosine, guanine, thymine, cytosine, and cytidine). The concentrations of 690 compounds were greater in soils associated with epiphytes than those without (Figure 1). Analysis of the metabolome of suspended soils and epiphyte-associated soils showed separation of that of Bromeliaceae and Orchidaceae along axes 1 and 2, respectively (Figure 3).

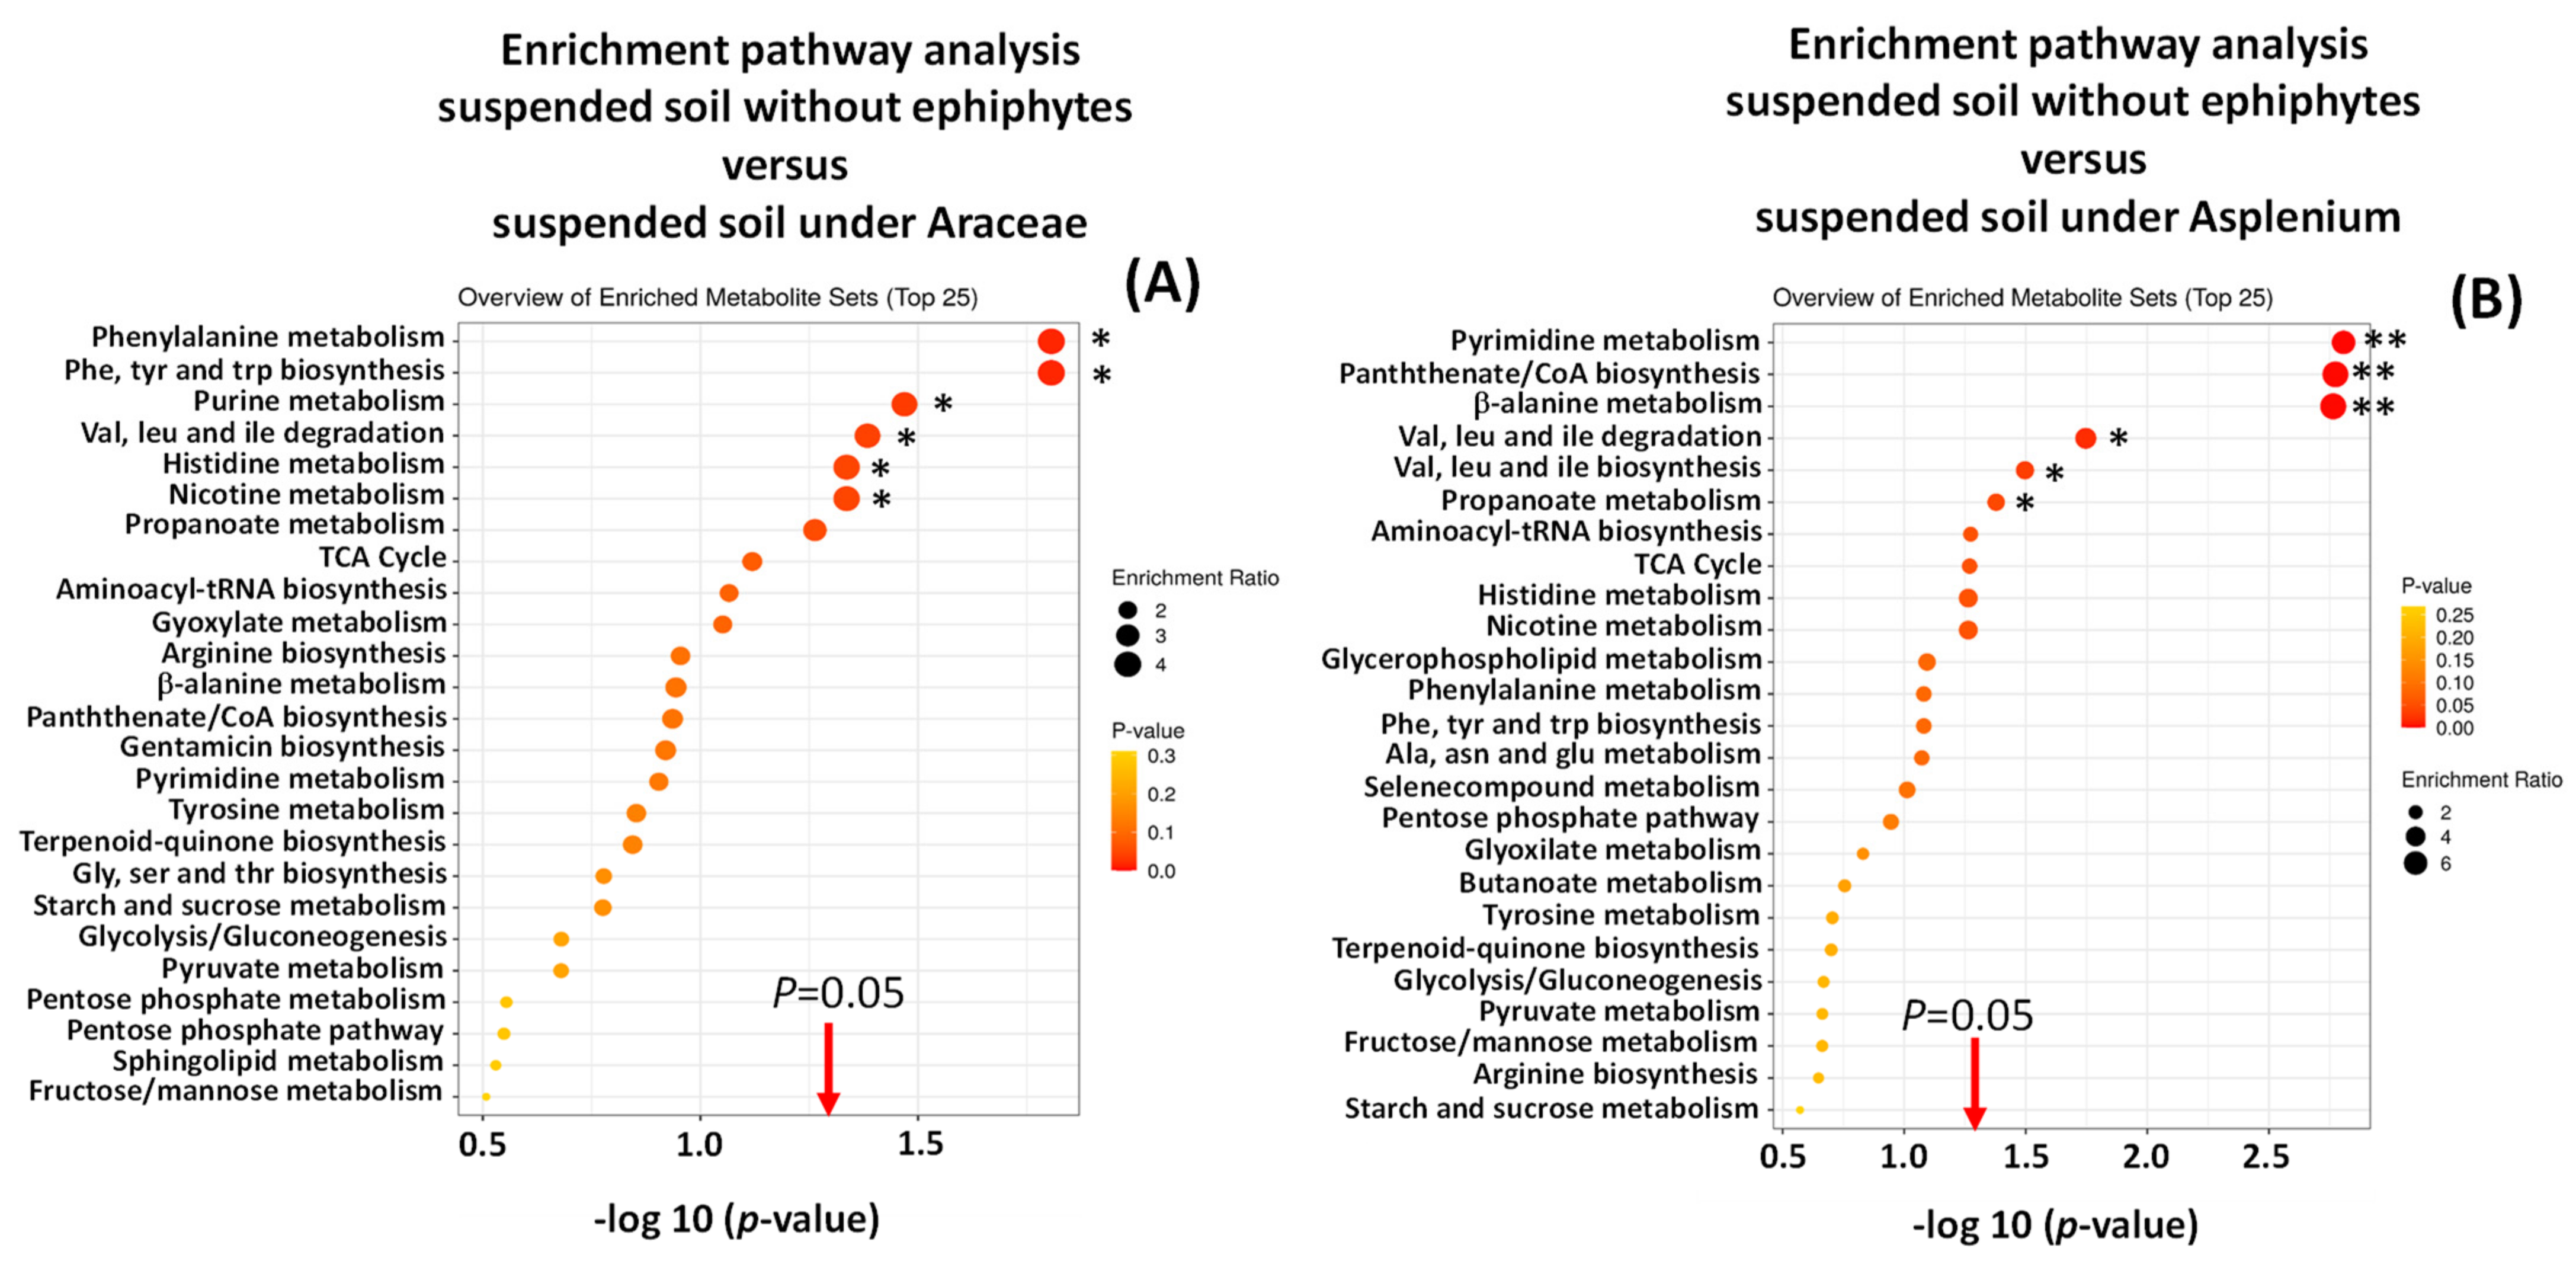
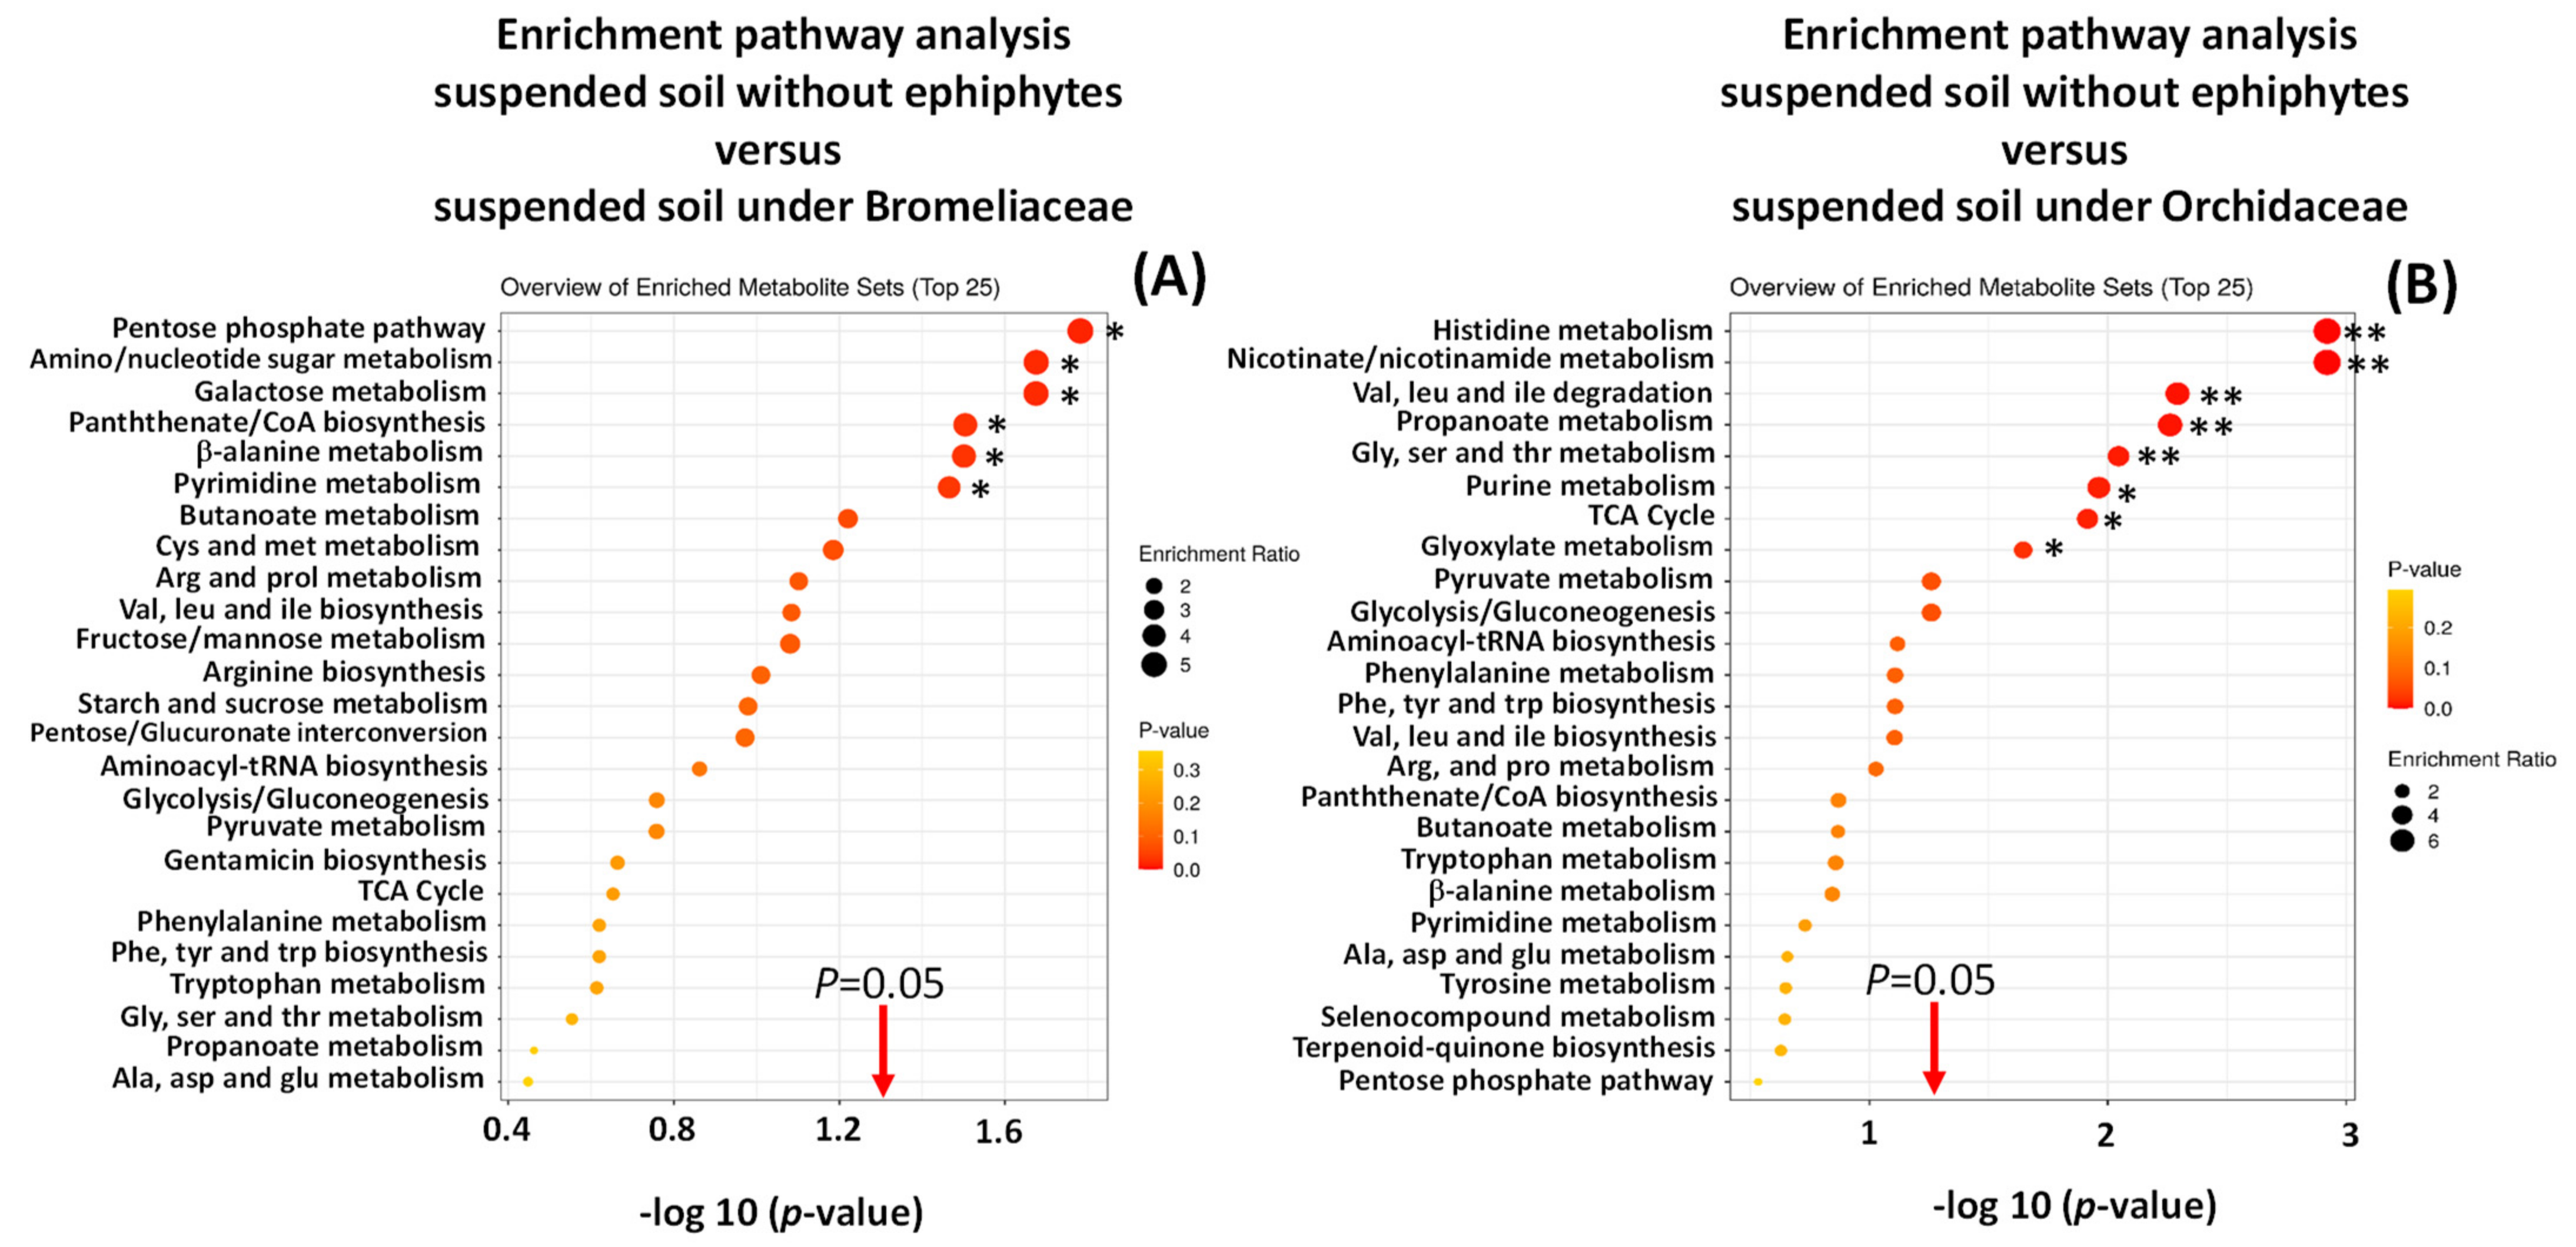
Enrichment of Metabolic Pathways

There was metabolic pathway enrichment particularly for those pathways related to amino acids and nucleotides, in suspended soils compared to forest floor soils (some > 8 times) (Figure S1) and in epiphyte-associated soils compared to suspended soils (Figure 5 and Figure 6).

3. Discussion

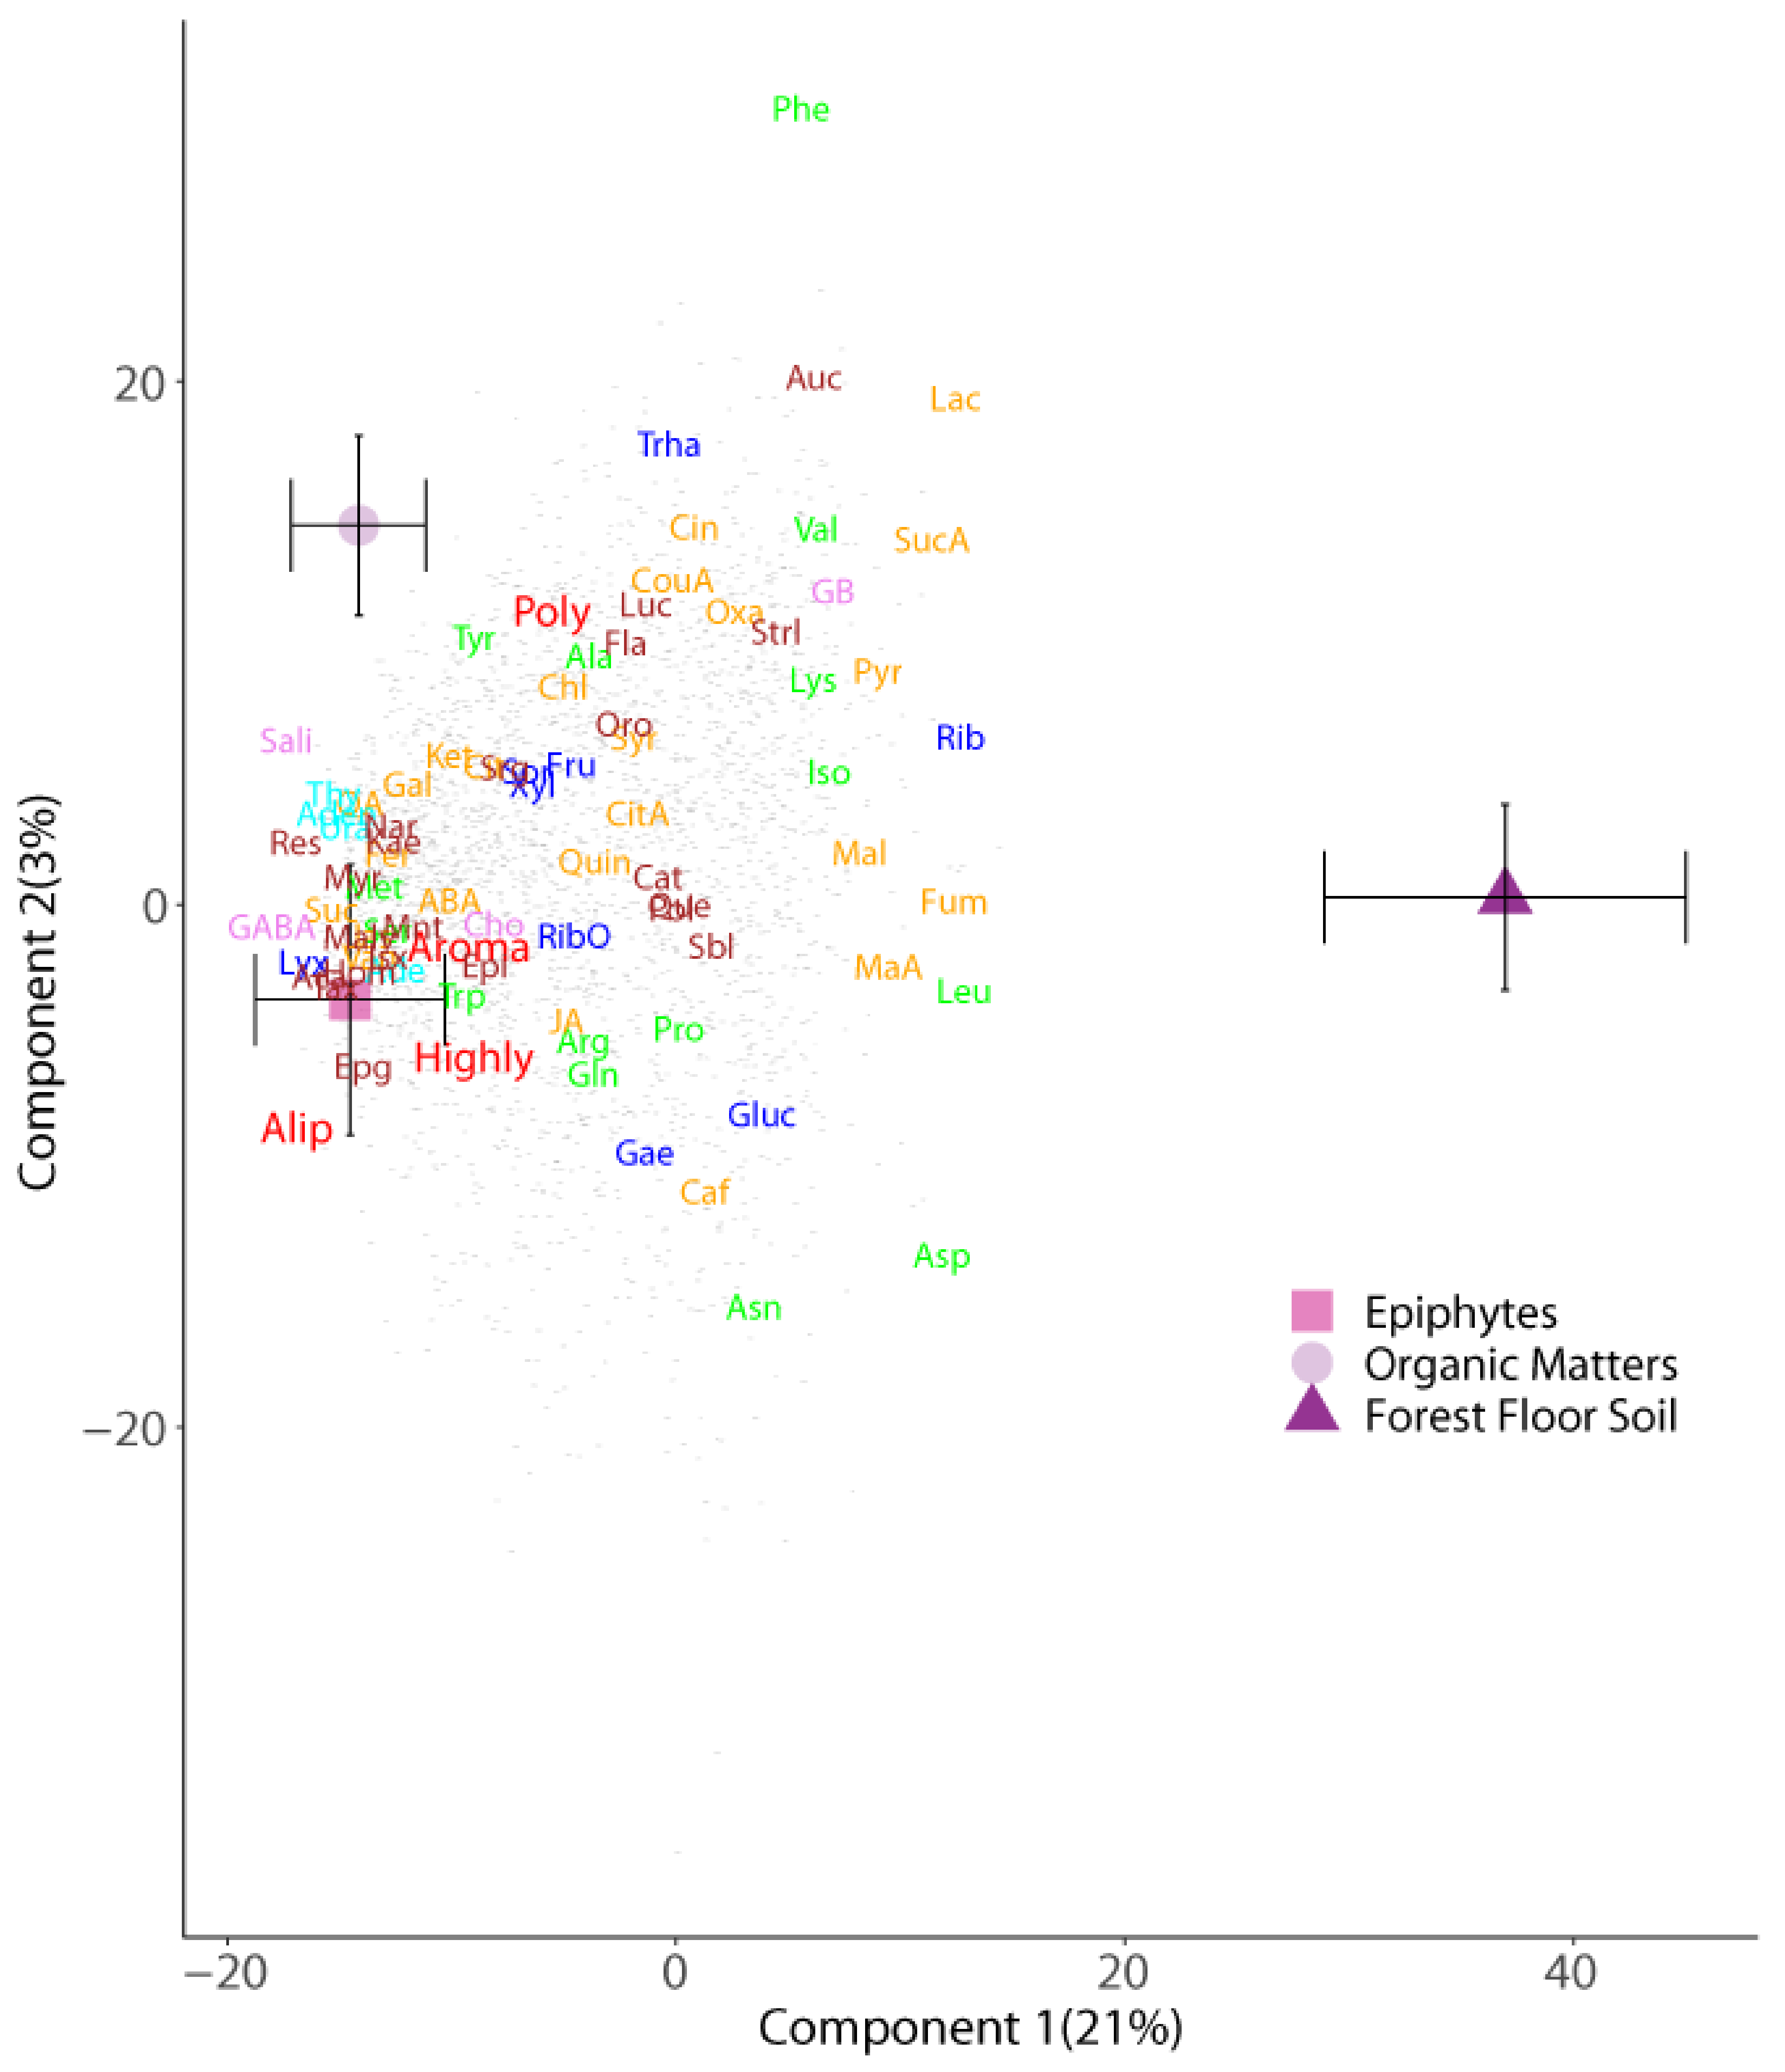
3.1. Metabolome of Forest Floor and Canopy Soils

The metabolome of forest floor soils was distinct from that of canopy soils, including both with and without epiphytes. Organic matter decomposition rates in canopy soils contrast with those on the floor; processes tend to be slower in the canopy [54].
Our results showed that an abundance of several plant metabolite compounds, such as primary metabolites and phenolic groups, were greater in canopy soils than in forest floor soils, indicating a greater proportion of compounds of plant origin. This is consistent with previous studies observing that the organic matter contents in floor soil (~6% C) greatly differ with those in canopy soil or suspended soil (~35% C) [52]. We found higher abundances of metabolites such as amino acids, nucleotides, and compounds related to energy metabolism in suspended soils compared to forest floor soils, indicating the role of tree leaf litter in the formation of suspended soils. Similarly, in a Costa Rican rainforest, higher concentrations of host tree compounds and nutrients were reported in canopy soils compared with forest floor soils, where there was also variation in the two soil types among tree species [24]. As expected, we found more organic compounds resulting from the metabolization of the leaves in canopy soils than in the forest floor soils, which contain much less organic carbon. This is again consistent with the origin of soil in canopies, which is mostly a result of plant litter, in contrast with the ground soil, which is mostly a result of bedrock weathering and leaching [55].
Our results showed a clear effect of tree species on canopy soil metabolomic profiles, regardless of association with epiphytes, indicating that species-specific environmental conditions in the canopy influence canopy soil processes. While suspended soils are directly influenced by the host tree through inputs of its leaf litter [56], variations in host tree species epiphyte communities with environmental conditions indicate that microsite factors may be key drivers of epiphyte community composition, rather than limitation of dispersal [57]. Given that epiphytes capture water and nutrients from the atmosphere and intercepted host tree leaf litter [58], variation in canopy soil metabolomes among host tree species and between suspended soils and those on the floor forest is expected, along with differences in key factors, such as soil C and nutrient concentrations [22]. For example, in a Hawaiian rainforest, a greater content of P in tree bark was found to be positively related to the presence and colonization of certain types of epiphytes [59], and concentrations of available nutrients in epiphyte-associated soils were shown to depend on tree host species [25]. Microscale changes in forest physicochemical traits are linked with tree species distribution in tropical forests [7,13,60] and canopy microclimate conditions, which vary with tree species architecture and vertical position in the forest, influencing epiphyte species composition and associated soil formation [61,62]. For example, rainforest tree canopies that intercept and accumulate higher amounts of water from fog were found to be positively related to greater epiphyte community biomass and diversity in both French Guiana [63] and Costa Rica [64].
We found tree species differences in forest floor and canopy soil metabolomic profiles, supporting studies that have shown tree species composition and diversity affect epiphyte species composition and function, due to the effects on soil nutrient concentration and availability [62,65], soil microbiota and invertebrate community composition [66], phosphorus concentration and availability [10,67,68], physical characteristics [69], fertility [70], and moisture and organic carbon content [71,72,73].

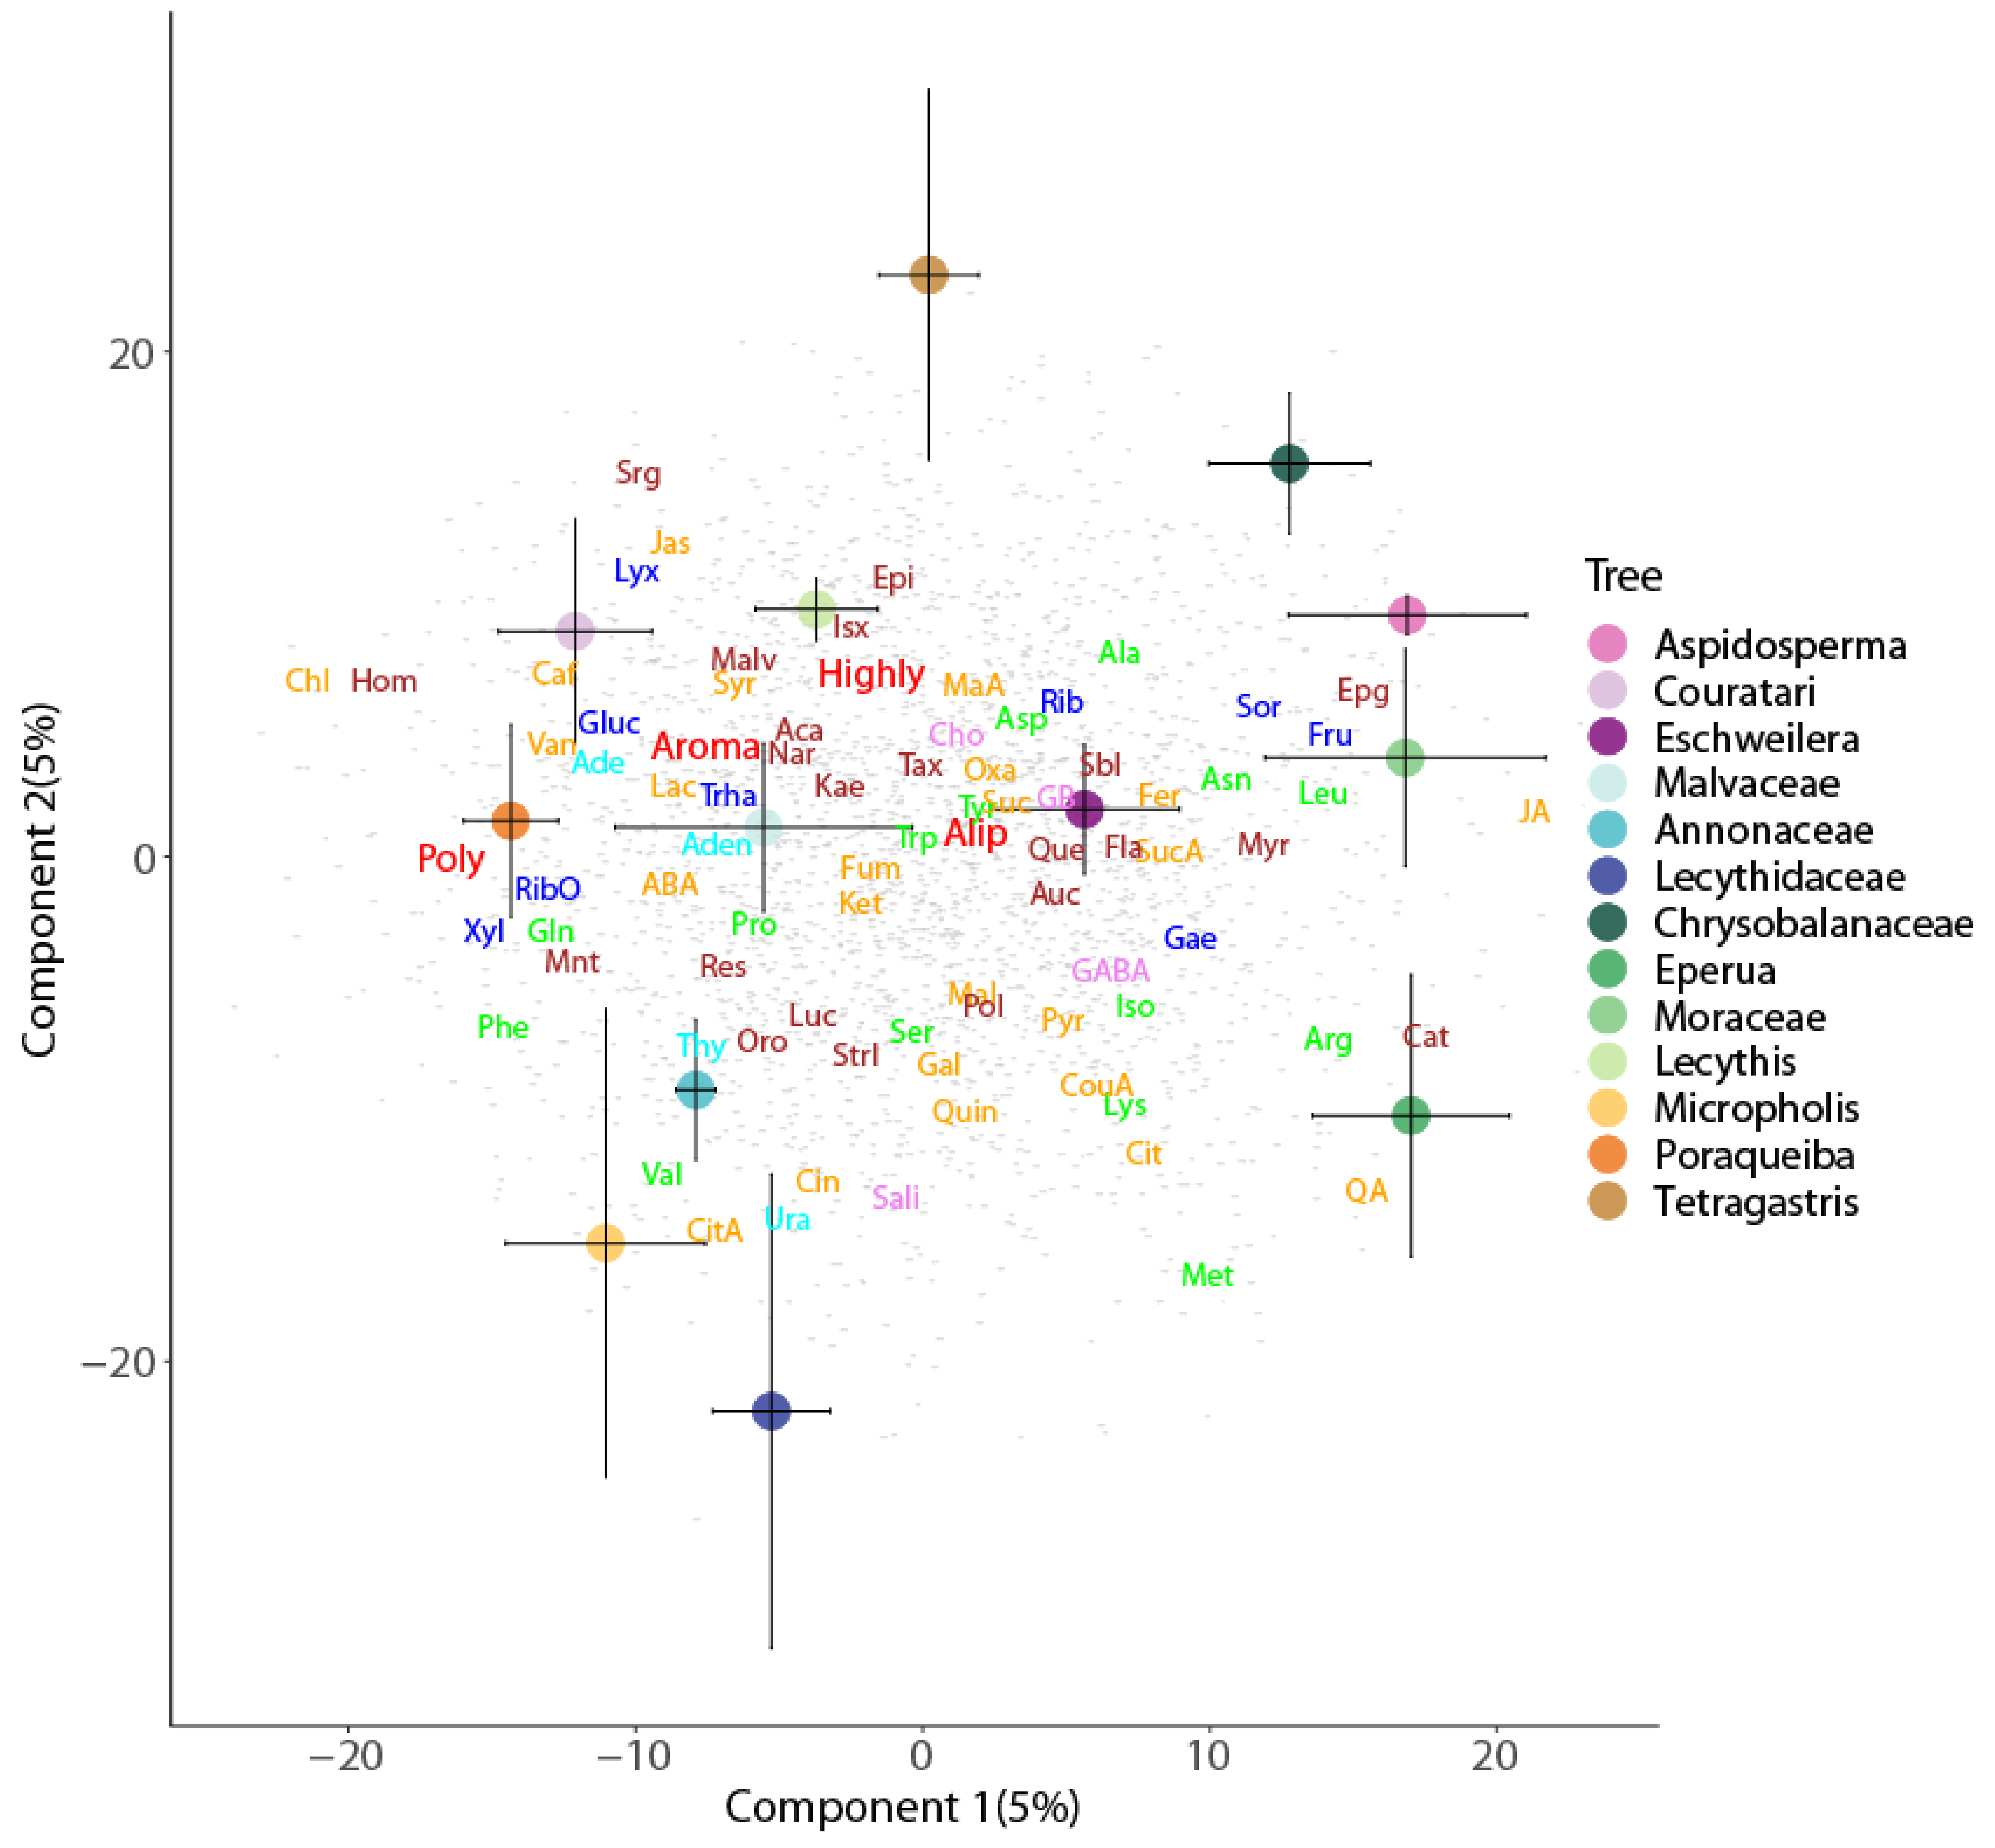
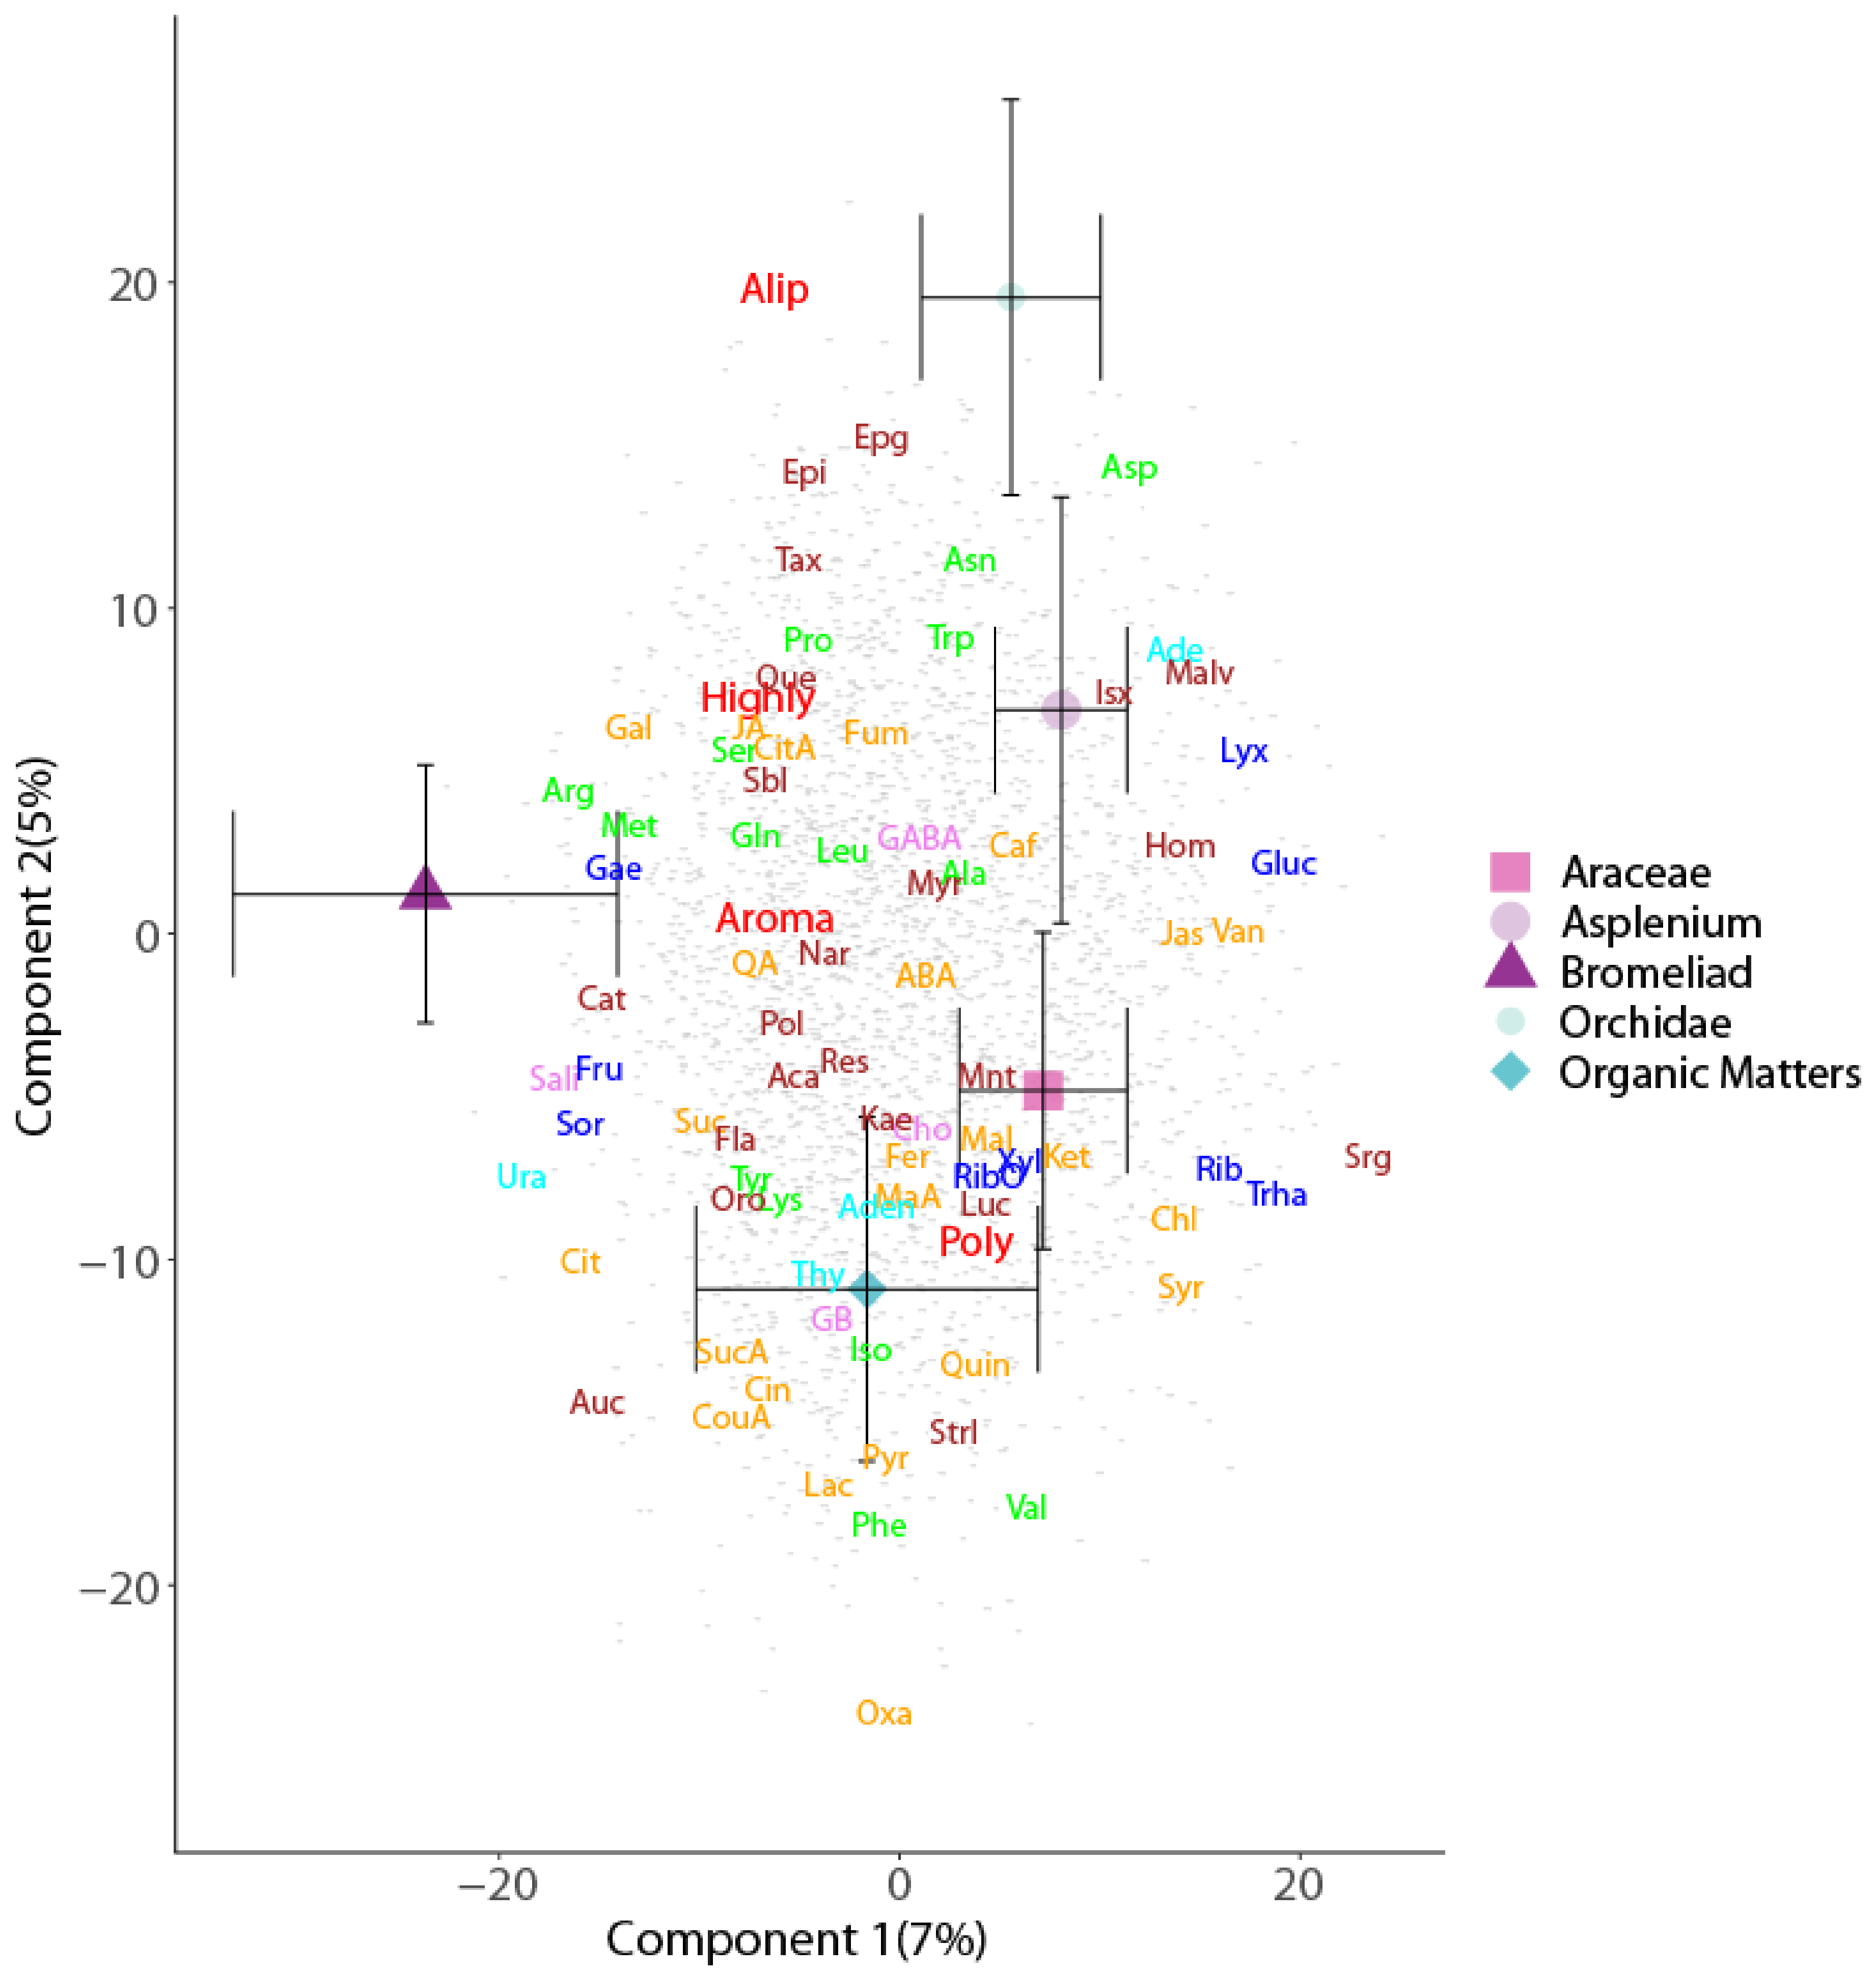
3.2. Metabolic Profile Differences among Canopy Soils

In addition to the effects of tree species on forest floor soil metabolomics, we also observed epiphyte taxon differences in metabolic profiles of epiphyte-associated soils, where there was greater upregulation of pathways compared to suspended soils. Epiphyte-associated soils receive organic compounds, such as epiphyte root exudates [56], that likely differ in chemical composition and function, leading to variation in soil metabolome among epiphyte taxa.
Epiphyte species composition and canopy accumulation of organic matter are a positive feedback of appropriate microclimate conditions, such as lower temperature and greater levels of humidity [74], that create environmental niches occupied by organisms, which may not otherwise persist [53,75,76]. For example, variation in levels of light penetration and moisture among canopy strata have been linked with contrasting epiphyte communities and function [77,78,79,80,81], supporting our finding that suspended soil metabolic profiles are associated with epiphyte taxa, while a study exploring microbe communities of suspended soils using artificial soil microcosms found a negative relationship between the volume of suspended soil and microbe diversity [36].
The differing modes of nutrient acquisition (roots versus leaf-absorbing trichomes) and variation in microclimate among epiphytes (wet in bromeliads versus dry in Asplenium) likely result in distinct microbial communities [82], as supported by the distinct metabolic profiles of bromeliad-associated soils. Asplenium ferns, which retain greater levels of moisture by their fibrous roots than suspended soils, are likely to provide an intermediate microclimate, as supported by our analysis that shows its metabolome differs from those associated with the other epiphyte taxa. Suspended soil microbial community composition is sensitive to changes in microclimate [38], and our study indicates that epiphyte-mediated influences on the levels of moisture in suspended soils and accumulation of nutrients may contribute to the associated microfauna community composition. We recommend future studies focus on the dynamics and drivers of these poorly understood epiphyte-associated soils.
Our analysis shows the influences of tree species and epiphyte taxa on variance in suspended soil metabolomic profiles. We found that soil metabolic profiles associated with Asplenium varied with tree species, indicating likely differences in associated environmental conditions and distinct local metabolomes.

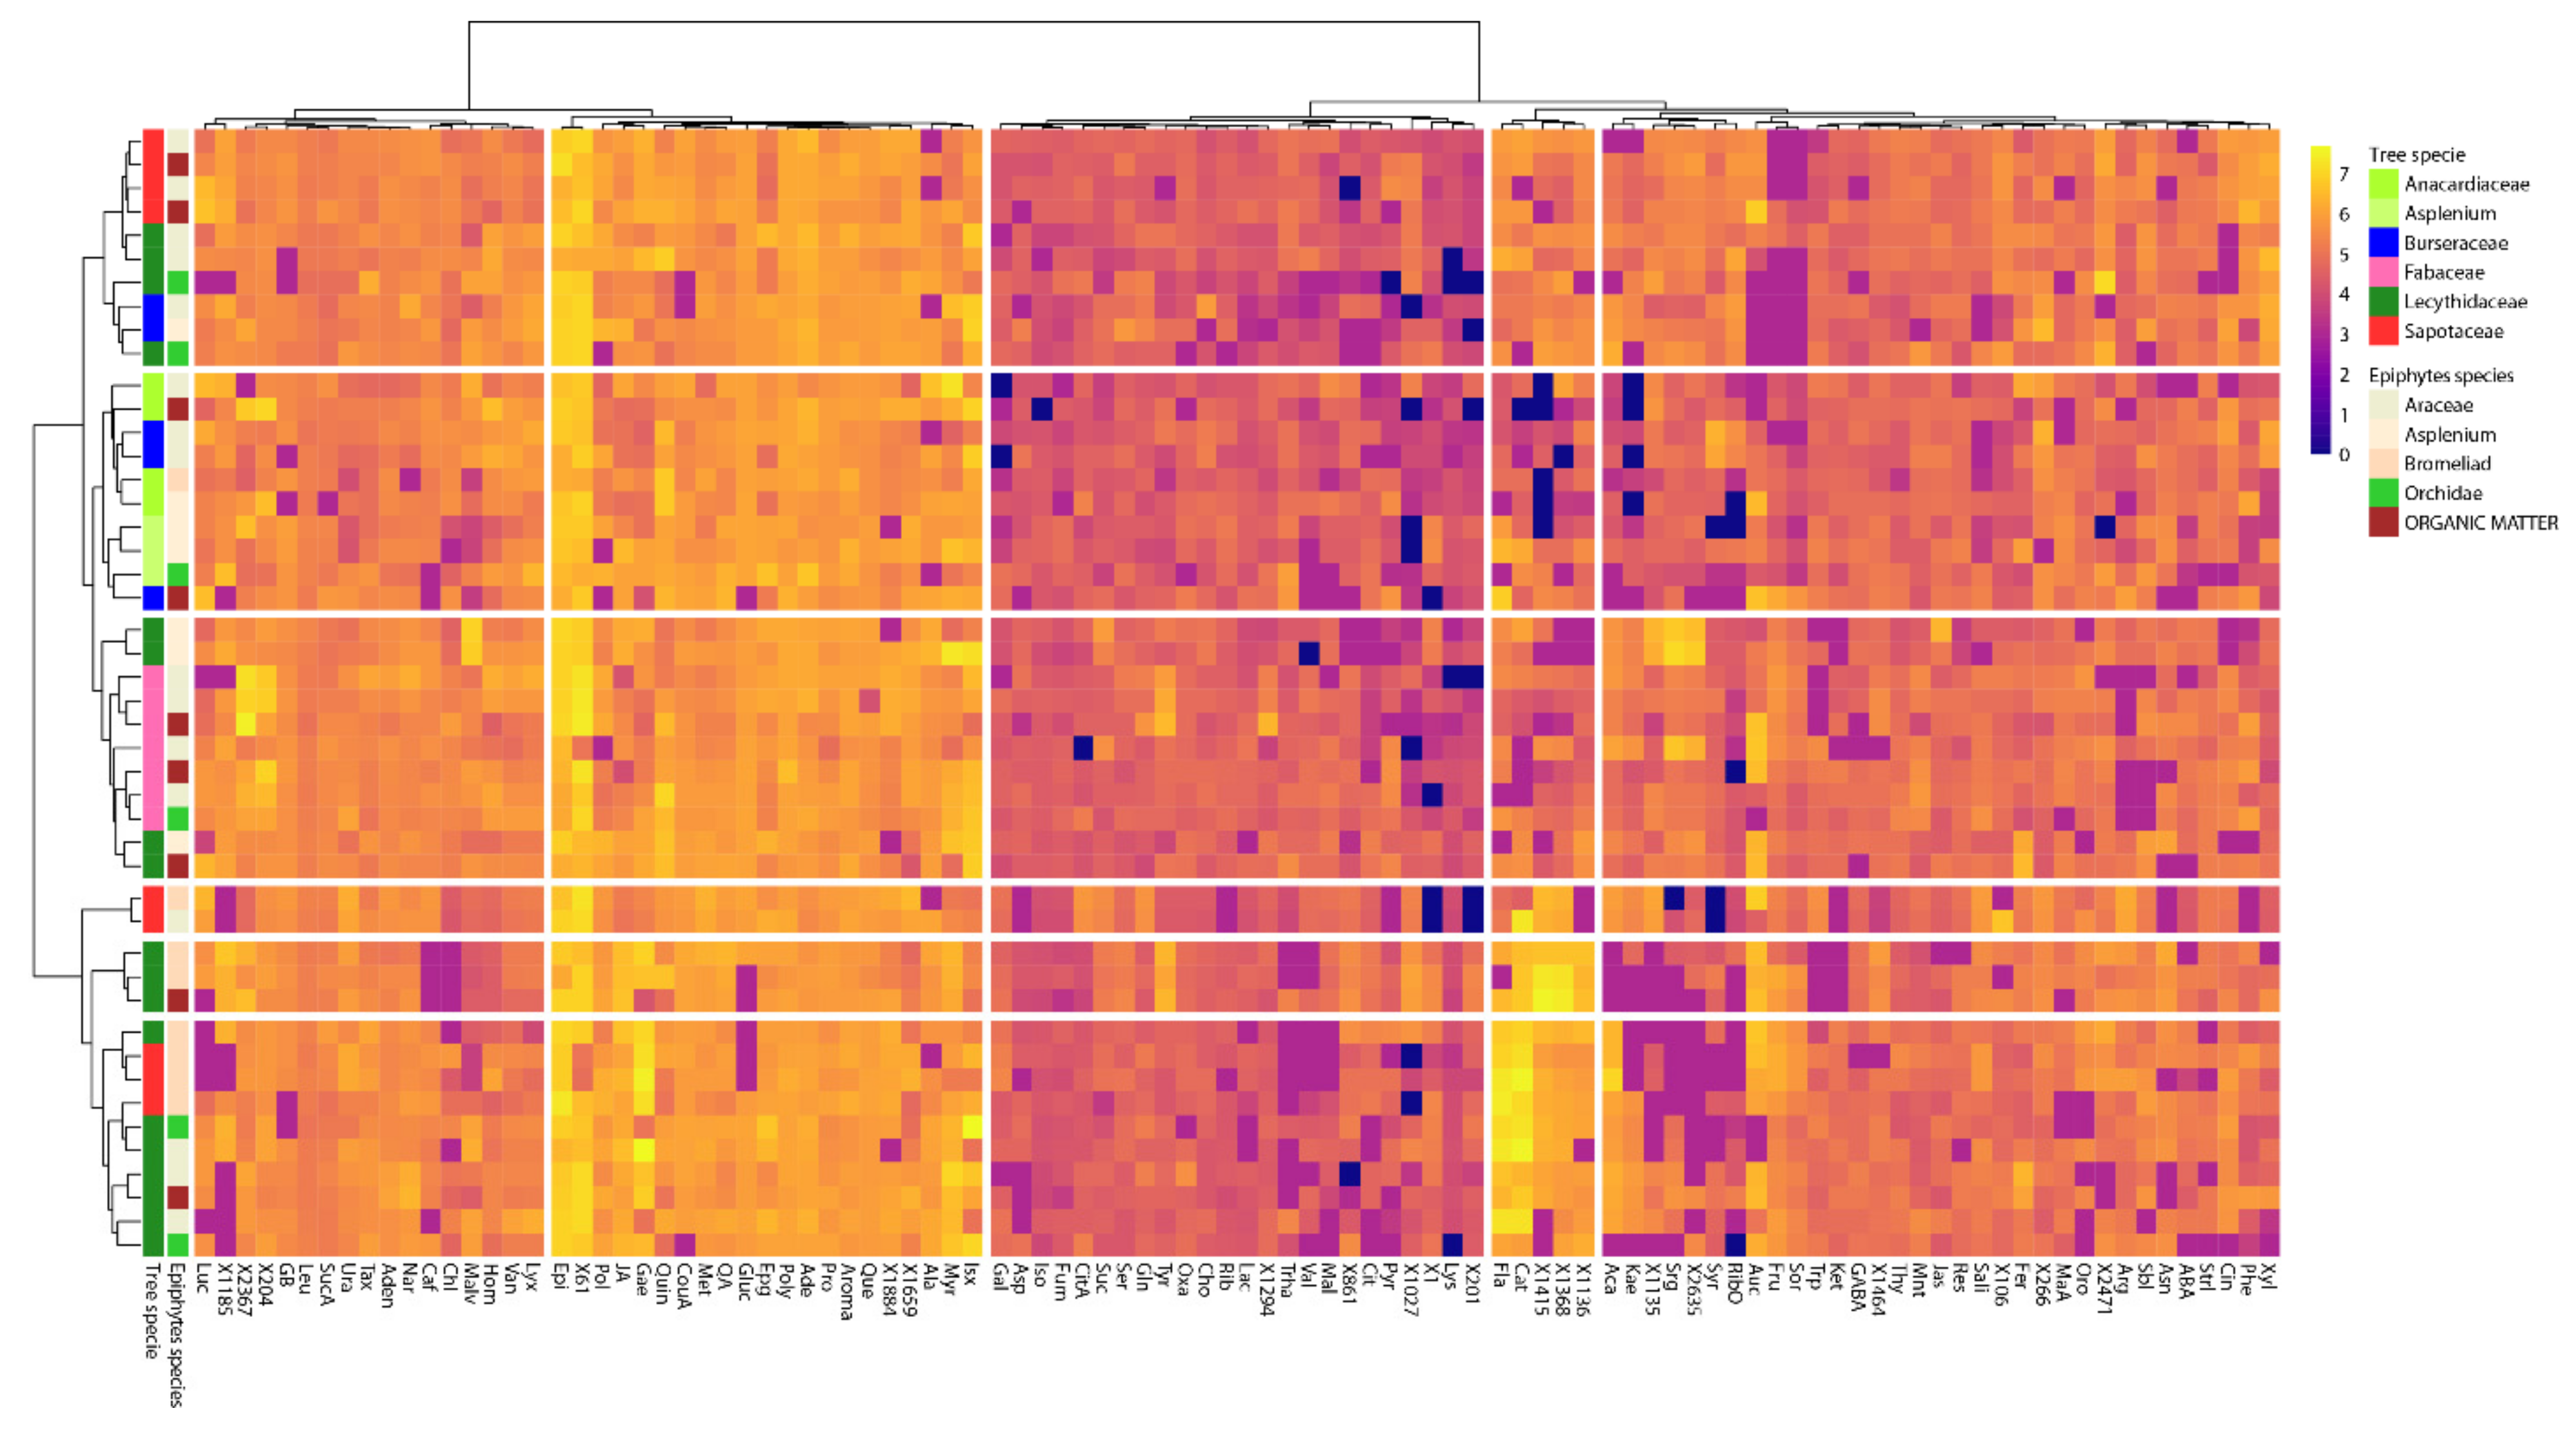
3.3. Global Overview of the High Diversity of Metabolomic Profile in the Studied Soils

Currently, there is no clear consensus on the direction of effects of tree species on soil traits. It has been argued that local-scale soil properties cause the high levels of tree diversity in tropical forests [7,11,12,83]. However, our results clearly demonstrate that rainforest tree and epiphyte taxa influence heterogeneity and metabolic function of forest floor and canopy soils, with a positive feedback on their diversity. The dependence on forest floor soil traits of tree species in tropical forests [26,38,48,51] has been linked to differences in tree species leaf litter leachates [49,50]. Yet, our study is the first to show evidence of a general link between forest floor and canopy soil traits (here, metabolomics) and plant species composition in a tropical forest. Our results demonstrate that the greater abundance of metabolites related to plant species (particularly those related to biological production and expression, such as amino acids and nucleotides) and to plant stress-tolerance (such as phenolics) have a positive feedback effect on soil trait diversity and the key role of plant diversity in the maintenance of micro-scale soil biological and functional diversity in this rainforest in French Guiana.

4. Materials and Methods

4.1. Study Area

The study was conducted in September 2017 at the Pararé research station in Nouragues Nature Reserve (4°02′ N, 52°41′ W) in French Guiana, where lowland wet tropical forest represents 97% of total land cover [84]. A pronounced dry season, which extends from September to November, is associated with the displacement of the inter-tropical convergence zone; the mean annual temperature is 25.8 °C, with an annual amplitude of 2 °C (daily amplitudes of 7 and 10 °C in the rainy and dry seasons, respectively) [85,86]. The study area comprises an inselberg granite outcrop, with primary lowland rainforest of high floral diversity [87,88]. The Pararé research station and the adjacent 4-hectare research plot experience an average daily temperature and annual rainfall of 26 °C and 2861 mm, respectively [89]. Soils are classified as nutrient poor Acrisols [90]. Samples were collected within a fully inventoried 1.5-hectare plot at the Pararé Research Station, where canopy height ranges between 35 and 55 m [91].

4.2. Soil Sampling and Analysis

Thirteen species (Table 3) of trees across a range of families within the study plots were randomly selected at the Pararé Research Station, based on the presence of epiphytes and the feasibility of climbing. Using ropes to climb the trees, we collected specimens of Asplenium (Asplenium serratum), Bromeliaceae (Aechmea aquilega and Mezobromelia pleiosticha), Araceae (Anthurium sp. and Philodendron sp.), and Orchidaceae epiphytes from branches, recording their height and orientation in the canopy. The epiphyte-associated and suspended soils were removed from supporting branches, placed into sealed bags, and transported to the field camp. We sampled at least three epiphytes and three organic soils in each individual tree. Organic matter was removed from the roots of Araceae and Orchidaceae, the tanks of bromeliads, and the litter-trapping leaves of Asplenium. The soils were processed following the approach described by Gargallo-Garriga et al. [92], where samples were passed through a 0.5 × 0.5 cm mesh and placed in a paper bag, for temporary storage at −80 °C on dry ice and additional liquid nitrogen, prior to transfer to the EcoFoG lab at Kourou, where they were freeze dried for 48 h (Alpha 1-2 LD, Christ, Osterode am Harz, Germany). Then, the samples were ground to a fine powder and homogenized, using a pestle and mortar, and stored at −80 °C prior to analysis. In addition, we collected three replicates of soil (forest floor soil) around the individual tree, always in the same position and less than 1 m of distance from the trunk base.

4.3. Metabolite Extraction and Analysis

Following the approach described by Gargallo-Garriga et al. [93], the soil samples were extracted using a 1:1 methanol:H2O solution. Then, the extracted fraction was analyzed twice, by using the positive and negative ion modes of a liquid chromatography–mass spectrometer (LC-MS; UltiMate 3000 chromatographic system coupled to a LTQ Orbitrap XL high-resolution mass spectrometer, ThermoFisher Scientific, Waltham, MA, USA) that was equipped with a heated electrospray ionization source to perform metabolomic profiling. Samples were analyzed in MS and MS/MS under the same conditions, by selecting the top three parent ions of each scan. The raw data from the LC-MS were processed and compared using the XCMS 72 platform, as described in Gargallo-Garriga et al. (2020). We quantified the metabolites, after the elimination of peaks that were not consistently representative, based on the presence of mass/RT in at least three samples of any provenance, when each sample was then split and randomly queued into two LC-MS run batches. The peak areas corresponding to each metabolite were normalized based on the total peak areas in the sample. Neutral masses obtained in positive and negative modes were evaluated to avoid duplicates (same retention time and neutral mass in the different modes), retaining the most intense peaks. LC-MS chromatograms were obtained with a Dionex Ultimate 3000 HPLC system (Thermo Fisher Scientific/Dionex RSLC, Dionex, Waltham, MA, USA) coupled to an LTQ Orbitrap XL high-resolution mass spectrometer (Thermo Fisher Scientific, Waltham, MA, USA) equipped with an HESI II (heated electrospray ionization) source. Chromatography was performed on a reversed-phase C18 Hypersil gold column (150 × 2.1 mm, 3-µ particle size; Thermo Scientific, Waltham, MA, USA) at 30 °C. The mobile phases consisted of acetonitrile (A) and water (0.1% acetic acid) (B). Both mobile phases were filtered and degassed for 10 min in an ultrasonic bath prior to use. The elution gradient, at a flow rate of 0.3 mL per minute, began at 10% A (90% B) and was maintained for 5 min, then to 10% B (90% A) for the next 20 min. The initial proportions (10% A and 90% B) were gradually recovered over the next 5 min, and the column was then washed and stabilized for 5 min before the next sample was injected. The injection volume of the samples was 5 µL. HESI was used for MS detection. All samples were injected twice: once with the ESI operating in negative ionization mode (−H) and once in positive ionization mode (+H). The Orbitrap mass spectrometer was operated in FTMS (Fourier Transform Mass Spectrometry) full-scan mode with a mass range of 50–1000 m/z and high-mass resolution (60, 000). The resolution and sensitivity of the spectrometer were monitored by injecting a standard of caffeine after every 10 samples, and the resolution was further monitored with lock masses (phthalates). Blank samples were also analyzed during the sequence. The assignment of the metabolites was based on the standards, with the retention time and mass of the assigned metabolites in both positive and negative ionization modes (Table S1).

4.4. Metabolite Identification and Quantification

We identified and determined metabolites based on comparison with our standard compound library (>200 compounds) and searching for each MS and MS/MS in KEGG and MASSBANK databases, following the approach described by Gargallo-Garriga et al. (2020). For those that could not be positively identified, we made tentative identifications based on MS/MS spectra as annotated metabolites. As a result, we assigned the stochiometry of 2757 metabolic compounds, and based on the stoichiometric ratios of nitrogen and hydrogen to carbon, and of oxygen to carbon [94,95], we classified the compounds into four broad families according to plant secondary metabolism, comprising highly-unsaturated polyphenols (192 compounds), polycyclic aromatics (142 compounds), aliphatics (1351 compounds), and phenolic compounds (280 compounds).

4.5. Statistical Analysis

We used permutational analysis of variance (PERMANOVA; Anderson 2001), using the ‘ADONIS’ function from the ‘vegan’ package [96] in R (R Development Core Team 2015), first to test for differences in soil metabolome profile in function of tree species and types of soil (forest floor soil, canopy without and with epiphytes) as independent factors (13 tree species) and a second PERMANOVA was conducted only with canopy suspendedsoils with tree species and soil with different epiphyte taxa (Asplenium, Bromeliaceae, Araceae, and Orchidaceae) as independent factors, in pursuit of the “metabolomic niche hypothesis” [97]. PERMANOVA determines variation within a distance matrix, which is assigned a priori groups for each level of independent factors, and compares the observed community matrix to a nonparametric null distribution, which here was based on 2000 permutations of the observed matrix.
We used partial least squares discriminant analysis (PLSDA) to characterize and visualize relations among soil metabolomes by position (forest floor and canopy soil, including suspended and epiphyte-associated soils) and the association with epiphyte taxa. We then conducted an enrichment pathway analysis (MetaboAnalyst 5.0, www.metaboanalyst.ca, accessed on 23 September 2021) to test for up- and downregulated metabolic pathways in comparing suspended soils without epiphytes with the suspended soils with different epiphyte taxa. This analysis allowed us to detect the metabolic pathways that are differently expressed between two sets of samples by comparing their metabolomics profiles.

5. Conclusions

An abundance of metabolites tended to be greater in canopy soils than in forest floor soils, and in epiphyte-associated soils than in suspended soils, where groups such as phenolics of plant origin and those involved in primary metabolomic pathways, such as those related to amino acid, nucleotides, and energy metabolism, were enriched. Tree species was a main driver of forest floor and canopy soil (both suspended and epiphyte-associated) metabolomic profiles.

Supplementary Materials

The following are available online at https://www.mdpi.com/article/10.3390/metabo11110718/s1, Figure S1: Enrichment pathway analysis of soil metabolomics profile versus suspended soils without epiphytes, Table S1: Processing parameters of LC-MS chromatograms using MzMine 2.0 (Pluskal et al., 2010). Chromatogram represents by the total ion current (TIC).

Author Contributions

Conceptualization, A.G.-G., J.S. and J.P.; methodology, A.G.-G., J.S., K.K., O.U. and J.P.; software, A.G.-G., J.S., A.F.A. and J.P.; investigation, A.G.-G., J.S., L.F., I.R.-R., J.D., C.L., L.V.L., E.V. and J.P.; resources, I.A.J. and J.P.; data curation, A.G.-G., J.S., A.F.A. and J.P.; writing—original draft preparation, A.G.-G., J.S. and J.P.; writing—review and editing, A.G.-G., J.S., A.F.A., K.K., L.F., I.R.-R., J.D., C.L., L.V.L., E.V., O.U. and J.P.; visualization, A.G.-G., J.S. and J.P.; supervision, A.G.-G., J.S., I.A.J., K.K., O.U. and J.P.; funding acquisition, I.A.J. and J.P. All authors have read and agreed to the published version of the manuscript.

Funding

The authors acknowledge the financial support from the European Research Council Synergy project SyG-2013-610028 IMBALANCE-P, the Spanish Government grant PID2019-110521GB-I00, the Fundación Ramón Areces grant ELEMENTAL-CLIMATE, and the Catalan Government grant SGR 2017-1005. The work was supported by the MEYS project SustES (CZ.02.1.01/0.0/0.0/16_019/0000797). AFA was supported by Researchers Supporting Project number (RSP-2021/218), King Saud University, Riyadh, Saudi Arabia. LF was supported by the European Union’s Horizon 2020 research and innovation program under the Marie Sklodovska-Curie grant agreement No 847693 (REWIRE). This work was supported from an “Investissement d’Avenir’’ grant managed by the Agence Nationale de la Recherche (CEBA, ref. ANR-10-LABX-25-01).

Institutional Review Board Statement

Not applicable.

Informed Consent Statement

Not applicable.

Data Availability Statement

All data is available from the corresponding author upon request. The data are not publicly available due to research still in progress.

Conflicts of Interest

The authors declare no conflict of interest.

References

  1. Connell, J.H. Diversity in Tropical Rain Forests and Coral Reefs. Science 1978, 199, 1302–1310. [Google Scholar] [CrossRef] [PubMed] [Green Version]
  2. John, R.; Dalling, J.W.; Harms, K.E.; Yavitt, J.B.; Stallard, R.F.; Mirabello, M.; Hubbell, S.P.; Valencia, R.; Navarrete, H.; Vallejo, M.; et al. Soil nutrients influence spatial distributions of tropical tree species. Proc. Natl. Acad. Sci. USA 2007, 104, 864–869. [Google Scholar] [CrossRef] [PubMed] [Green Version]
  3. Wright, J.S. Plant diversity in tropical forests: A review of mechanisms of species coexistence. Oecologia 2002, 130, 1–14. [Google Scholar] [CrossRef] [PubMed]
  4. Myers, N.; Mittermeier, R.A.; Mittermeier, C.G.; Da Fonseca, G.A.B.; Kent, J. Biodiversity hotspots for conservation priorities. Nat. Cell Biol. 2000, 403, 853–858. [Google Scholar] [CrossRef] [PubMed]
  5. Achard, F.; Eva, H.D.; Stibig, H.-J.; Mayaux, P.; Gallego, J.; Richards, T.; Malingreau, J.-P. Determination of Deforestation Rates of the World’s Humid Tropical Forests. Science 2002, 297, 999–1002. [Google Scholar] [CrossRef] [Green Version]
  6. Volkov, I.; Banavar, J.R.; He, F.; Hubbell, S.P.; Maritan, A. Density dependence explains tree species abundance and diversity in tropical forests. Nat. Cell Biol. 2005, 438, 658–661. [Google Scholar] [CrossRef] [PubMed]
  7. Aiba, S.-I.; Sawada, Y.; Takyu, M.; Seino, T.; Kitayama, K.; Repin, R. Structure, floristics and diversity of tropical montane rain forests over ultramafic soils on Mount Kinabalu (Borneo) compared with those on non-ultramafic soils. Aust. J. Bot. 2015, 63, 191–203. [Google Scholar] [CrossRef]
  8. LeBauer, D.S.; Treseder, K.K. Nitrogen Limitation of Net Primary Productivity in Terrestrial Ecosystems Is Globally Distributed. Ecology 2008, 89, 371–379. [Google Scholar] [CrossRef] [Green Version]
  9. Fujii, K.; Shibata, M.; Kitajima, K.; Ichie, T.; Kitayama, K.; Turner, B. Plant–soil interactions maintain biodiversity and functions of tropical forest ecosystems. Ecol. Res. 2018, 33, 149–160. [Google Scholar] [CrossRef]
  10. Xu, W.; Ci, X.; Song, C.; He, T.; Zhang, W.; Li, Q.; Li, J. Soil phosphorus heterogeneity promotes tree species diversity and phylogenetic clustering in a tropical seasonal rainforest. Ecol. Evol. 2016, 6, 8719–8726. [Google Scholar] [CrossRef]
  11. Pennington, R.T.; Lavin, M.; Oliveira-Filho, A. Woody Plant Diversity, Evolution, and Ecology in the Tropics: Perspectives from Seasonally Dry Tropical Forests. Annu. Rev. Ecol. Evol. Syst. 2009, 40, 437–457. [Google Scholar] [CrossRef] [Green Version]
  12. Matos, F.A.R.; Magnago, L.; Gastauer, M.; Carreiras, J.M.B.; Simonelli, M.; Meira-Neto, J.A.A.; Edwards, D.P. Effects of landscape configuration and composition on phylogenetic diversity of trees in a highly fragmented tropical forest. J. Ecol. 2016, 105, 265–276. [Google Scholar] [CrossRef]
  13. Martins, K.; Marques, M.; dos Santos, E.; Marques, R. Effects of soil conditions on the diversity of tropical forests across a successional gradient. For. Ecol. Manag. 2015, 349, 4–11. [Google Scholar] [CrossRef]
  14. Mandl, N.A.; Kessler, M.; Gradstein, R. Effects of environmental heterogeneity on species diversity and composition of terrestrial bryophyte assemblages in tropical montane forests of southern Ecuador. Plant Ecol. Divers. 2009, 2, 313–321. [Google Scholar] [CrossRef]
  15. Clark, D.B.; Clark, D.A.; Read, J.M. Edaphic variation and the mesoscale distribution of tree species in a neotropical rain forest. J. Ecol. 1998, 86, 101–112. [Google Scholar] [CrossRef]
  16. Becerra, J.X. On the factors that promote the diversity of herbivorous insects and plants in tropical forests. Proc. Natl. Acad. Sci. USA 2015, 112, 6098–6103. [Google Scholar] [CrossRef] [Green Version]
  17. Nadkarni, N.M.; Schafer, D.; Matelson, T.J.; Solano, R. Comparison of srboreal and terrestrial soil characteristics in a lower montane forest, Monteverde, Costa Rica. Pedobiologia 2002, 46, 24–33. [Google Scholar] [CrossRef]
  18. Lowman, M.D.; Rinker, H.B. Forest Canopies, 2nd ed.; Academic Press: Cambridge, MA, USA, 2004; p. 544. [Google Scholar]
  19. Ozanne, C.M.P.; Anhuf, D.; Boulter, S.L.; Keller, M.; Kitching, R.L.; Körner, C.; Meinzer, F.C.; Mitchell, A.W.; Nakashizuka, T.; Silva Dias, P.L.; et al. Biodiversity meets the almosphere: A global view of forest canopies. Science 2003, 301, 183–186. [Google Scholar] [CrossRef] [PubMed] [Green Version]
  20. Nannipieri, P.; Ascher, J.; Ceccherini, M.T.; Landi, L.; Pietramellara, G.; Renella, G. Microbial diversity and soil functions. Eur. J. Soil Sci. 2003, 54, 655–670. [Google Scholar] [CrossRef]
  21. Floren, A.; von Rintelen, T.; Hebert, P.D.N.; de Araujo, B.C.; Schmidt, S.; Balke, M.; Narakusumo, R.P.; Peggie, D.; Ubaidillah, R.; von Rintelen, K.; et al. Integrative ecological and molecular analysis indicate high diversity and strict elevational separation of canopy beetles in tropical mountain forests. Sci. Rep. 2020, 10, 1–12. [Google Scholar] [CrossRef]
  22. Paoletti, M.G.; Taylor, R.A.J.; Stinner, B.R.; Stinner, D.H.; Benzing, D.H. Diversity of soil fauna in the canopy and forest floor of a Venezuela cloud forest. J. Trop. Ecol. 1991, 7, 373–383. [Google Scholar] [CrossRef]
  23. Beaulieu, F.; Walter, D.E.; Proctor, H.C.; Kitching, R.L. The Canopy starts at 0.5 cm: Predatory mites (Acari: Mesostigmata) differ between rain forest floor soil and suspended soil at any height. Biotropica 2010, 42, 704–709. [Google Scholar] [CrossRef]
  24. Cardelús, C.L.; Mack, M.C.; Woods, C.; Demarco, J.; Treseder, K. The influence of tree species on canopy soil nutrient status in a tropical lowland wet forest in Costa Rica. Plant Soil 2008, 318, 47–61. [Google Scholar] [CrossRef]
  25. Lesica, P.; Antibus, R.K. Canopy Soils and epiphyte richness. Res. Explor. 1991, 7, 156. [Google Scholar]
  26. Looby, C.I.; Hollenbeck, E.C.; Treseder, K.K. Fungi in the Canopy: How Soil Fungi and Extracellular Enzymes Differ Between Canopy and Ground Soils. Ecosystems 2019, 23, 768–782. [Google Scholar] [CrossRef] [Green Version]
  27. Victoriano-Romero, E.; García-Franco, J.G.; Mehltreter, K.; Valencia-Díaz, S.; Toledo-Hernandez, A.; Flores-Palacios, A. Ephiphyte associations and canopy soil volumen: Nutrient capital and factors influencing soil retention in the canopy. Plant Biol. 2019, 22, 541–552. [Google Scholar] [CrossRef]
  28. Janzen, D.H. Herbivores and the Number of Tree Species in Tropical Forests. Am. Nat. 1970, 104, 501–528. [Google Scholar] [CrossRef]
  29. Leroy, C.; Carrias, J.-F.; Céréghino, R.; Corbara, B. The contribution of microorganisms and metazoans to mineral nutrition in bromeliads. J. Plant Ecol. 2016, 9, 241–255. [Google Scholar] [CrossRef]
  30. Lyons, B.; Nadkarni, N.M.; North, M.P. Spatial distribution and succession of epiphytes on Tsuga heterophylla (western hemlock) in an old-growth Douglas-fir forest. Can. J. Bot. 2000, 78, 957–968. [Google Scholar] [CrossRef]
  31. Neider, J.; Prosperí, J.; Michaloud, G. Epiphytes and their contribution to canopy diversity. Plant Ecol. 2001, 153, 51–63. [Google Scholar] [CrossRef]
  32. Zotz, G. The systematic distribution of vascular epiphytes—A critical update. Bot. J. Linn. Soc. 2013, 171, 453–481. [Google Scholar] [CrossRef] [Green Version]
  33. Gotsch, S.G.; Nadkarni, N.; Darby, A.; Glunk, A.; Dix, M.; Davidson, K.; Dawson, T.E. Life in the treetops: Ecophysiological strategies of canopy epiphytes in a tropical montane cloud forest. Ecol. Monogr. 2015, 85, 393–412. [Google Scholar] [CrossRef] [Green Version]
  34. Benzing, D.H. Bromeliaceae: Profile of an Adaptive Radiation; Cambridge University Press: Cambridge, MA, USA, 2000. [Google Scholar] [CrossRef]
  35. Ngai, J.T.; Srivastava, D.S. Predators accelerate nutrient cycling in a bromeliad ecosystem. Science 2006, 314, 963. [Google Scholar] [CrossRef] [PubMed] [Green Version]
  36. Wardle, D.; Yeates, G.; Barker, G.; Bonner, K. The influence of plant litter diversity on decomposer abundance and diversity. Soil Biol. Biochem. 2006, 38, 1052–1062. [Google Scholar] [CrossRef]
  37. Pittl, E.; Innerebner, G.; Wanek, W.; Insam, H. Microbial communities of arboreal and ground soils in the Esquinas rainforest, Costa Rica. Plant Soil 2009, 329, 65–74. [Google Scholar] [CrossRef]
  38. Donald, J.; Bonnett, S.; Cutler, M.; Majalap, N.; Maxfield, P.; Ellwood, M.D.F. Physical Conditions Regulate the Fungal to Bacterial Ratios of a Tropical Suspended Soil. Forest 2017, 8, 474. [Google Scholar] [CrossRef] [Green Version]
  39. Nakamura, A.; Kitching, R.L.; Cao, M.; Creedy, T.J.; Fayle, T.; Freiberg, M.; Hewitt, C.N.; Itioka, T.; Koh, L.P.; Ma, K.; et al. Forests and Their Canopies: Achievements and Horizons in Canopy Science. Trends Ecol. Evol. 2017, 32, 438–451. [Google Scholar] [CrossRef] [Green Version]
  40. Sardans, J.; Peñuelas, J.; Rivas-Ubach, A. Ecological metabolomics: Overview of current developments and future challenges. Chemoecology 2011, 21, 191–225. [Google Scholar] [CrossRef]
  41. Chen, M.-S. Inducible direct plant defense against insect herbivores: A review. Insect Sci. 2008, 15, 101–114. [Google Scholar] [CrossRef]
  42. Fiehn, O. Metabolomics--the link between genotypes and phenotypes. Plant Mol. Biol. 2002, 48, 155–171. [Google Scholar] [CrossRef]
  43. Gargallo-Garriga, A.; Wright, S.J.; Sardans, J.; Pérez-Trujillo, M.; Oravec, M.; Večeřová, K.; Urban, O.; Fernández-Martínez, M.; Parella, T.; Peñuelas, J. Long-term fertilization determines different metabolomic profiles and responses in saplings of three rainforest tree species with different adult canopy position. PLoS ONE 2017, 12, e0177030. [Google Scholar] [CrossRef] [Green Version]
  44. Hewavitharana, S.S.; Klarer, E.; Reed, A.J.; Leisso, R.; Poirier, B.; Honaas, L.; Rudell, D.R.; Mazzola, M. Temporal Dynamics of the Soil Metabolome and Microbiome during Simulated Anaerobic Soil Disinfestation. Front. Microbiol. 2019, 10, 2365. [Google Scholar] [CrossRef] [Green Version]
  45. Song, Y.; Li, X.; Yao, S.; Yang, X.; Jiang, X. Correlations between soil metabolomics and bacterial community structures in the pepper rhizosphere under plastic greenhouse cultivation. Sci. Total Environ. 2020, 728, 138439. [Google Scholar] [CrossRef]
  46. Peñuelas, J.; Sardans, J.; Ogaya, R.; Estiarte, M. Nutrient stoichiometric relations and biogeochemical niche in coexisting plant species: Effect of simulated climate change. Polish J. Ecol. 2008, 56, 613–622. [Google Scholar]
  47. Bundy, J.G.; Davey, M.P.; Viant, M.R. Environmental metabolomics: A critical review and future perspectives. Metabolomics 2009, 5, 3–21. [Google Scholar] [CrossRef]
  48. Musila, W.; Todt, H.; Uster, D.; Dalitz, H. Is Geodiversity Correlated to Biodiversity? A Case Study of the Relationship between Spatial Heterogeneity of Soil Resources and Tree Diversity in a Western Kenyan Rainforest. In African Biodiversity; Springer: Boston, MA, USA, 2005; pp. 405–414. [Google Scholar]
  49. Schreeg, L.A.; Mack, M.C.; Turner, B.L. Leaf litter inputs decrease phosphate sorption in a strongly weathered tropical soil over two time scales. Biogeochemistry 2013, 113, 507–524. [Google Scholar] [CrossRef]
  50. Osborne, B.B.; Nasto, M.K.; Soper, F.M.; Asner, G.P.; Balzotti, C.S.; Cleveland, C.C.; Taylor, P.G.; Townsend, A.R.; Porder, S. Leaf litter inputs reinforce islands on nitrogen fertility in a lowland tropical rainforest. Biogeochemistry 2020, 147, 293–306. [Google Scholar] [CrossRef]
  51. Matson, A.L.; Corre, M.D.; Burneo, J.I.; Veldkamp, E. Free-living nitrogen fixation responds to elevated nutrient inputs in tropical montane forest floor and canopy soils of southern Ecuador. Biogeochemistry 2015, 122, 281–294. [Google Scholar] [CrossRef]
  52. Nadkarni, N.M.; Schaefer, D.; Matelson, T.J.; Solano, R. Biomass and nutrient pools of canopy and terrestrial components in a primary and a secondary montane cloud forest, Costa Rica. For. Ecol. Manag. 2004, 198, 223–236. [Google Scholar] [CrossRef]
  53. Scheffers, B.R.; Phillips, B.L.; Shoo, L.P. Asplenium bird’s nets ferns in rainforest canopies are climate-contingent refuges for frogs. Glob. Ecol. Conserv. 2014, 2, 37–46. [Google Scholar]
  54. Aguilar-Cruz, Y.; Garcia-Franco, J.G.; Zotz, G. Microsites and early litter decomposition patterns in the soil and forest canopy at tregional scale. Biogeochemistry 2020, 151, 15–30. [Google Scholar] [CrossRef]
  55. Zaharescu, D.G.; Burghelea, C.I.; Dontsova, K.; Presler, J.K.; Hunt, E.A.; Domanik, K.J.; Amistadi, M.K.; Sandhaus, S.; Munoz, E.N.; Gaddis, E.E.; et al. Ecosystem-bedrock interaction changes nutrient compartmentalization during early oxidative weathering. Sci. Rep. 2019, 9, 15006. [Google Scholar] [CrossRef] [Green Version]
  56. Enloe, H.A.; Quideau, S.A.; Graham, R.C.; Sillett, S.C.; Oh, S.-W.; Wasylishen, R.E. Soil Organic Matter Processes in Old-Growth Redwood Forest Canopies. Soil Sci. Soc. Am. J. 2010, 74, 161–171. [Google Scholar] [CrossRef]
  57. Marí, M.L.G.; Toledo, J.J.; Nascimento, H.E.M.; Zartman, C.E. Regional and Fine Scale Variation of Holoepiphyte Community Structure in Central Amazonian White-Sand Forests. Biotropica 2016, 48, 70–80. [Google Scholar] [CrossRef]
  58. Gotsch, S.G.; Nadkarni, N.; Amici, A. The functional roles of epiphytes and arboreal soils in tropical montane cloud forests. J. Trop. Ecol. 2016, 32, 455–468. [Google Scholar] [CrossRef]
  59. Benner, J.W. Epiphytes preferentially colonize high-phosphorus host trees in unfertilized Hawaiian montane forests. Bryol. 2011, 114, 335–345. [Google Scholar] [CrossRef]
  60. Ledo, A.; Burslem, D.F.; Condés, S.; Montes, F. Micro-scale habitat associations of woody plants in a neotropical cloud forest. J. Veg. Sci. 2013, 24, 1086–1097. [Google Scholar] [CrossRef] [Green Version]
  61. Zotz, G.; Schultz, S. The vascular epiphytes of a lowland forest in Panama—species composition and spatial structure. Plant Ecol. 2007, 195, 131–141. [Google Scholar] [CrossRef]
  62. Boelter, C.R.; Dambos, C.S.; Nascimiento, H.E.M.; Zartman, C.E. A tangled web in tropical tree-tops: Effects of edaphic variation, neighborhood phorophyte composition and bark characteristics on epiphytes in a Central Amazonian forest. J. Veg. Sci. 2014, 25, 1090–1099. [Google Scholar] [CrossRef]
  63. Obregon, A.; Gehrig-Downie, C.; Gradstein, S.R.; Rollenbeck, R.; Bendix, J. Canopy level fog occurrence in a tropical lowland forest of French Guaiana as a prerequisite for high epiphyte diversity. Agric. For. Metereol. 2011, 151, 290–300. [Google Scholar] [CrossRef]
  64. Bohlman, S.A.; Matelson, T.J.; Nadkarni, N.M. Moisture and Temperature Patterns of Canopy Humus and Forest Floor Soil of a Montane Cloud Forest, Costa Rica. Biotropica 1995, 27, 13. [Google Scholar] [CrossRef]
  65. Benner, J.W.; Vitousek, P.M. Development of a diverse epiphyte community in response to phosphorus fertilization. Ecol. Lett. 2007, 10, 628–636. [Google Scholar] [CrossRef] [PubMed]
  66. Li, Y.Q.; Ruan, H.H.; Zou, X.M.; Myster, R.W. Response of major soil decomposers to landscape in a Puerto Rican rainforest. Soil Sci. 2005, 170, 202–211. [Google Scholar] [CrossRef]
  67. Sahu, S.C.; Dhal, N.K.; Lal, B.; Mohanty, R.C. Differences in tree species diversity and soil nutrient status in a tropical sacred forest ecosystem on Niyamgiri hill range, Eastern Ghats, India. J. Mt. Sci. 2012, 9, 492–500. [Google Scholar] [CrossRef]
  68. Prada, C.M.; Morris, A.; Andersen, K.M.; Turner, B.L.; Caballero, P.; Dalling, J.W. Soils and rainfall drive landscape-scale changes in the diversity and functional composition of three communities in premontane tropical forest. J. Veg. Sci. 2017, 278, 859–870. [Google Scholar] [CrossRef]
  69. Amani, C. Impact of Soil Heterogeneity on Forest Structure and Diversity of Tree Species in the Central Congo Basin. Int. J. Plant Sci. 2018, 179, 198–208. [Google Scholar] [CrossRef]
  70. Paoli, G.D.; Curran, L.M.; Zak, D.R. Soil nutrients and beta diversity in the Bornean Dipterocarpaceae: Evidence for niche partitioning by tropical rain forest trees. J. Ecol. 2006, 94, 157–170. [Google Scholar] [CrossRef] [Green Version]
  71. Kuzmeier, S.; Wiedemann, T.; Biber, P.; Schad, P.; Krasilnikov, P.V. Effects of Edaphic factors on the tree stand siversity in a tropical forest of Sierra Madre del Sur, Mexico. Eurasian Soil Sci. 2012, 45, 740–751. [Google Scholar] [CrossRef]
  72. Ewel, J.J.; Mazzarino, M.J.; Celis, G. Soil Changes in Model Tropical Ecosystems: Effects of Stand Longevity Outweigh Plant Diversity and Tree Species Identity in a Fertile Volcanic Soil. Ecosystems 2014, 17, 820–836. [Google Scholar] [CrossRef]
  73. Sarvade, S.; Gupta, B.; Singh, M. Composition, diversity and distribution of tree species in response to changing soil properties with increasing distance from water source—A case study of Gobind Sagar Reservoir in India. J. Mt. Sci. 2016, 13, 522–533. [Google Scholar] [CrossRef]
  74. Gehrig--Downie, C.; Obregón, A.; Bendix, J.; Gradstein, R.S. Epiphyte biomass and canopy microclimate in the tropical lowland cloud forest of French Guaiana. Biotropica 2011, 43, 591–596. [Google Scholar] [CrossRef]
  75. Woods, C.L.; Cardelús, C.L.; DeWalt, S.J. Microhabitat associations of vascular epiphytes in a wet tropical forest canopy. J. Ecol. 2015, 103, 421–430. [Google Scholar] [CrossRef]
  76. Eskov, A.; Zverev, A.; Abakumov, E. Microbiomes in Suspended Soils of Vascular Epiphytes Differ from Terrestrial Soil Microbiomes and from Each Other. Microorganisms 2021, 9, 1033. [Google Scholar] [CrossRef] [PubMed]
  77. Rascher, U.; Freiberg, M.; Lüttge, U. Functional Diversity of Photosynthetic Light Use of 16 Vascular Epiphyte Species Under Fluctuating Irradiance in the Canopy of a Giant Virola michelii (Myristicaceae) Tree in the Tropical Lowland Forest of French Guyana. Front. Plant Sci. 2012, 2, 117. [Google Scholar] [CrossRef] [PubMed] [Green Version]
  78. Pardow, A.; Gehrig-Downie, C.; Gradstein, R.; Lakatos, M. Functional diversity of epiphytes in two tropical lowland rain-forest, French Guaiana: Using bryophyte life-forms to detect areas of high biodiversity. Biodivers. Conserv. 2012, 21, 3637–3655. [Google Scholar] [CrossRef]
  79. Ruiz-Cordova, J.P.; Toledo-Hernández, V.H.; Flores-Palacios, A. The effect of substrate abundance in the vertical stratification of bromeliad epiphytes in a tropical dry forest (Mexico). Flora-Morphol. Distrib. Funct. Ecol. Plants 2014, 209, 375–384. [Google Scholar] [CrossRef]
  80. Ding, Y.; Liu, G.; Zang, R.; Zhang, J.; Lu, X.; Huang, J. Distribution of vascular epiphytes along a tropical elevational gradient: Disentangling abiotic and biotic determinants. Sci. Rep. 2016, 6, 19706. [Google Scholar] [CrossRef] [Green Version]
  81. Costa, D.S.; Zotz, G.; Hemp, A.; Kleyer, M. Trait patterns of epiphytes compared to other plant life--Forms along a tropical elevation gradient. Funct. Ecol. 2018, 32, 2073–2084. [Google Scholar] [CrossRef]
  82. Donald, J.; Maxfield, P.; Leroy, C.; Ellwood, M.F. Epiphytic suspended soils from Borneo and Amazonia differ in their microbial community composition. Acta Oecologica 2020, 106, 103586. [Google Scholar] [CrossRef]
  83. Peña-Claros, M.; Poorter, L.; Alarcón, A.; Blate, G.; Choque, U.; Fredericksen, T.S.; Justiniano, M.J.; Leaño, C.; Licona, J.C.; Pariona, W.; et al. Soil Effects on Forest Structure and Diversity in a Moist and a Dry Tropical Forest. Biotropica 2012, 44, 276–283. [Google Scholar] [CrossRef]
  84. Chave, J.; Riéra, B.; Dubois, M.-A. Estimation of biomass in a neotropical forest of French Guiana: Spatial and temporal variability. J. Trop. Ecol. 2001, 17, 79–96. [Google Scholar] [CrossRef] [Green Version]
  85. Gourlet-Fleury, S.; Guehl, J.-M.; Laroussinie, O. Ecology and Management of a Neotropical Rainforest: Lessons Drawn from Paracou, a Long-Term Experimental Research Site in French Guiana; Elseiver: Paris, France, 2004. [Google Scholar]
  86. Courtois, E.A.; Stahl, C.; Berge, J.V.D.; Bréchet, L.; Van Langenhove, L.; Richter, A.; Urbina, I.; Soong, J.L.; Peñuelas, J.; Janssens, I. Spatial Variation of Soil CO2, CH4 and N2O Fluxes Across Topographical Positions in Tropical Forests of the Guiana Shield. Ecosystems 2018, 21, 1445–1458. [Google Scholar] [CrossRef] [Green Version]
  87. Poszwa, A.; Ferry, B.; Pollie, B.; Grimaldi, C.; Charles-Dominique, P.; Loubet, M.; Dambrine, E. Variations of plant and soil 87Sr/86Sr along the slope of a tropical inselberg. Ann. For. Sci. 2009, 66, 512. [Google Scholar] [CrossRef]
  88. Vand der meer, P.J.; Bongers, F. Patterns of treefall and branch fall in a tropical rain forest in French Guiana. J. Ecol. 1996, 84, 19–29. [Google Scholar] [CrossRef]
  89. Réjou-Méchain, M.; Tymen, B.; Blanc, L.; Fauset, S.; Feldpausch, T.R.; Monteagudo, A.; Phillips, O.; Richard, H.; Chave, J. Using repeated small-footprint LiDAR acquisitions to infer spatial and temporal variations of a high-biomass Neotropical forest. Remote Sens. Environ. 2015, 169, 93–101. [Google Scholar] [CrossRef]
  90. FAO-ISRIC-ISSS. World Reference Base for Soil Resources; World Soil Resources Report Nr. 84; FAO: Rome, Italy, 1998. [Google Scholar]
  91. Minh, D.H.T.; Le Toan, T.; Rocca, F.; Tebaldini, S.; Villard, L.; Réjou-Méchain, M.; Phillips, O.L.; Feldpausch, T.R.; Dubois-Fernandez, P.; Scipal, K.; et al. SAR tomography for the retrieval of forest biomass and height: Cross-validation at two tropical forest sites in French Guaiana. Remote Sens. Environ. 2016, 175, 138–147. [Google Scholar] [CrossRef] [Green Version]
  92. Gargallo-Garriga, A.; Sardans, J.; Pérez-Trujillo, M.; Rivas-Ubach, A.; Oravec, M.; Vecerova, K.; Urban, O.; Jentsch, A.; Kreyling, J.; Beierkuhnlein, C.; et al. Opposite metabolic responses of shoots and roots to drought. Sci. Rep. 2015, 4, 6829. [Google Scholar] [CrossRef] [Green Version]
  93. Gargallo-Garriga, A.; Sardans, J.; Llusià, J.; Peguero, G.; Asensio, D.; Ogaya, R.; Urbina, I.; Van Langenhove, L.; Verryckt, L.T.; Courtois, E.A.; et al. 31P-NMR Metabolomics Revealed Species-Specific Use of Phosphorous in Trees of a French Guiana Rainforest. Molecules 2020, 25, 3960. [Google Scholar] [CrossRef]
  94. Koch, B.P.; Dittmar, T.; Witt, M.; Kattner, G. Fundamentals of Molecular Formula Assignment to Ultrahigh Resolution Mass Data of Natural Organic Matter. Anal. Chem. 2007, 79, 1758–1763. [Google Scholar] [CrossRef]
  95. Kellerman, A.M.; Dittmar, T.; Kothawala, D.N.; Tranvik, L.J. Chemodiversity of dissolved organic matter in lakes driven by climate and hydrology. Nat. Commun. 2014, 5, 3804. [Google Scholar] [CrossRef] [Green Version]
  96. Oksanen, J.; Kindt, R.; Legendre, P.; O’Hara, B.; Stevens, M.H.H.; Oksanen, M.J. MASS Suggests. The vegan package. Community Ecol. Package 2007, 10, 631–637. [Google Scholar]
  97. Anderson, M.J.; Gorley, R.N.; Clarke, K.R. PERMANOVA + for PRI-MER: Guide to Software and Statistical Methods; PRIMER-E: Plymouth, UK, 2008. [Google Scholar]
Figure 1. Partial least squares discriminant analysis biplots of metabolomic profiles of forest floor soils and epiphyte-associated and non-associated suspended soils (organic matter). Depicted values are means (±95% CI). Samples’ categorized scores (mean ± S.E.) by different soil types: “Epiphytes” (suspended soils associated with an epiphyte), “Organic Matters” (canopy soil without an epiphyte), and “Forest Floor Soil”. Soils are indicated by different colors: pink square, epiphytes; lilac circle, organic matters; purple triangle, forest floor soil. Loadings of the metabolites; only those with loadings >0.5 are depicted. The various metabolomic families are represented by different colors: dark blue, sugars; green, amino acids; orange, compounds involved in the metabolism of amino acids and sugars; cyan, nucleotides; brown, phenolics; red, others. Metabolites: arginine (Arg), asparagine (Asn), aspartic acid (Asp), glutamic acid (Glu), glutamine (Gln), isoleucine (Ile), lysine (Lys), leucine (Leu), methionine (Met), phenylalanine (Phe), serine (Ser), tryptophan (Trp), threonine (Thr), tyrosine (Tyr), valine (Val), adenine (Ade), adenosine (Ado), thymidine (TdR), chlorogenic acid (CGA), trans-caffeic acid (CafA), α-ketoglutaric acid (KG), citric acid (Cit), L-malic acid (Mal), lactic acid (Lac), abscisic acid (Abs), pyruvate (Pyr), succinic acid (SAD), pantothenic acid hemicalcium salt (Pan), jasmonic acid (JA), 5,7-dihydroxy-3,4,5–trimethoxyflavone (Fla), acacetin (AC), epicatechin (EC), epigallocatechin (EGC), homoorientin (Hom), isovitexin (Ivx), kaempferol (Kae), myricetin (Myr), quercetin (Qct), resveratrol (Rvt), saponarin (Sp), catechin hydrate (Cat), 3-coumaric acid (CouA), gallic acid (GA), quinic acid (QuiA), sodium salicylate (Sal), syringic acid (Syr), trans-ferulic acid (Fer), vanillic acid (Van), 2-deoxy-D-ribose (Rib), D-(-)-lyxose (Lyx), D-(+)-sorbose (Sor), D-(+)-trehalose dehydrate (Tre), aucubin (Auc). All the other small grey dots correspond to non-identified compounds.
Metabolites 11 00718 g001
Figure 2. Partial least squares discriminant analysis biplots of metabolomic profiles of forest floor and suspended soils across 13 species of tree (Table 2). Depicted values are means (±95% CI). Metabolites as in Figure 1.
Metabolites 11 00718 g002
Figure 3. Partial least squares discriminant analysis biplots of metabolomic profiles of epiphyte (Araceae, Asplenium, Bromeliaceae, Orchidae)-associated and non-associated (organic matter) suspended soils. Depicted values are means (±95% CI). Metabolites as in Figure 1.
Metabolites 11 00718 g003
Figure 4. Heatmap clustering analysis of the metabolites identified in the foliar metabolomes of tree species and epiphyte species. Families and species are generally clustered together with the corresponding metabolites. The samples are represented horizontally, and the metabolites are represented vertically. Abundance is represented by the intensity of the color of each metabolite, with blue representing low abundance and yellow representing high abundance. The 100 most important metabolites that were differentially affected (p < 0.05) between species and family are represented.
Metabolites 11 00718 g004
Figure 5. Enrichment pathway analysis of metabolomic profiles of suspended soils associated with Araceae (A) and Asplenium (B) compared with non-epiphyte soils. * p < 0.05, ** p < 0.01.
Metabolites 11 00718 g005
Figure 6. Enrichment pathway analysis of metabolomic profiles of suspended soils associated with Bromeliaceae (A) and Orchidaceae (B) compared with non-epiphyte soils. * p < 0.05, ** p < 0.01.
Metabolites 11 00718 g006
Table 1. Differences in soil metabolome by soil type (forest floor, suspended soil +/− epiphyte) (n = 3) and tree species (n = 13), as tested by PERMANOVA.
dfSum of SquaresMean SquareFR2P
Soil type22.331.178.170.1960.001
Tree species122.610.221.520.2190.001
Soil type × Tree species131.830.140.980.1530.56
Residuals365.140.140.4336
Total6311.91
Table 2. Differences in soil metabolome by +/− epiphyte taxa and tree species (n = 13).
dfSum of SquaresMean SquareFR2P
Epiphyte43.470.504.000.2910.001
Tree species122.560.211.720.2150.001
Epiphyte × Tree species202.910.151.170.2440.031
Residuals242.980.120.25
Total6311.91
Table 3. List of all collected vascular epiphytes of canopy soil attached to their base. The family to which the epiphyte belonged and, whenever possible, the genus and species are listed. Epiphytes are given by the identified tree species. We collected epiphytes from 13 out of the 14 sampled trees. Asplenium (Asplenium serratum), Bromeliaceae (Aechmea aquilega and Mezobromelia pleiosticha), Araceae (Anthurium sp. and Philodendron sp.), and Orchidaceae were sampled.
Tree SpeciesDBHEpiphytes CollectedEpi FamilyEpi GenusSpecies
Aspidosperma sprucaneaum Benth. Ex Müll.Arg.97.11BromeliaceaeAchmeaA. aquilega
Couratari oblongifolia Ducke & R. Knuth79.11AraceaeUnknownPhilodendron sp.
Eschweilera coriaceae (DC.) S.A.Mori53.00AraceaeUnknownPhilodendron sp.
Malvaceae Sterculia pruriens53.63AspleniaceaeAspleniumAsplenium sp.
BromeliaceaeUnknownM. pleiosticha
AraceaePhilodendronPhilodendron sp.
Annonaceae Oxandra asbeckii53.22BromeliaceaeMezobromeliaM. pleiosticha
OrchidaceaeUnknownOrchidaceae sp.
Lecythidaceae Gustavia hexapetala48.71BromeliaceaeAchmeaA. aquilega
Chrysobalanaceae Licania alba54.73AspleniaceaeAspleniumAsplenium sp. 1
AraceaePhilodendronPhilodendron sp.
BromeliaceaeAchmeaA. aquilega
Eperua falcata Aubl.81.83AspleniaceaeAspleniumAsplenium sp.
OrchidaceaeUnknownOrchidaceae sp. 2
AraceaePhilodendronPhilodendron sp. 2
Moraceae Brosimum guianense73.52AspleniaceaeAspleniumAsplenium sp. 1
OrchidaceaeUnknownOrchidaceae sp.
Lecythis persistens Sagot47.43AraceaeAnthuriumAnthurium sp. 2
BromeliaceaeUnknownM. pleiosticha
OrchidaceaeUnknownOrchidaceae sp.
Micropholis sp.69.62AspleniaceaeAspleniumAsplenium sp.
BromeliaceaeAchmeaA. aquilega
Poraqueiba guianensis Aubl.83.43OrchidaceaeUnknownOrchidaceae sp.
AraceaePhilodendronPhilodendron sp.
Tetragastris sp.47.42AraceaePhilodendronPhilodendron sp.
AraceaePhilodendronPhilodendron sp.
Tetragastris altissima (Aubl.) Swart95.53AraceaeAnthuriumAnthurium sp.
AspleniaceaeAspleniumAsplenium sp. 1
BromeliaceaeUnknownM. pleiosticha
Publisher’s Note: MDPI stays neutral with regard to jurisdictional claims in published maps and institutional affiliations.

