Indoor Localization System Based on Bluetooth Low Energy for Museum Applications

 ,
, 
 ,
, 
 , , and
Abstract
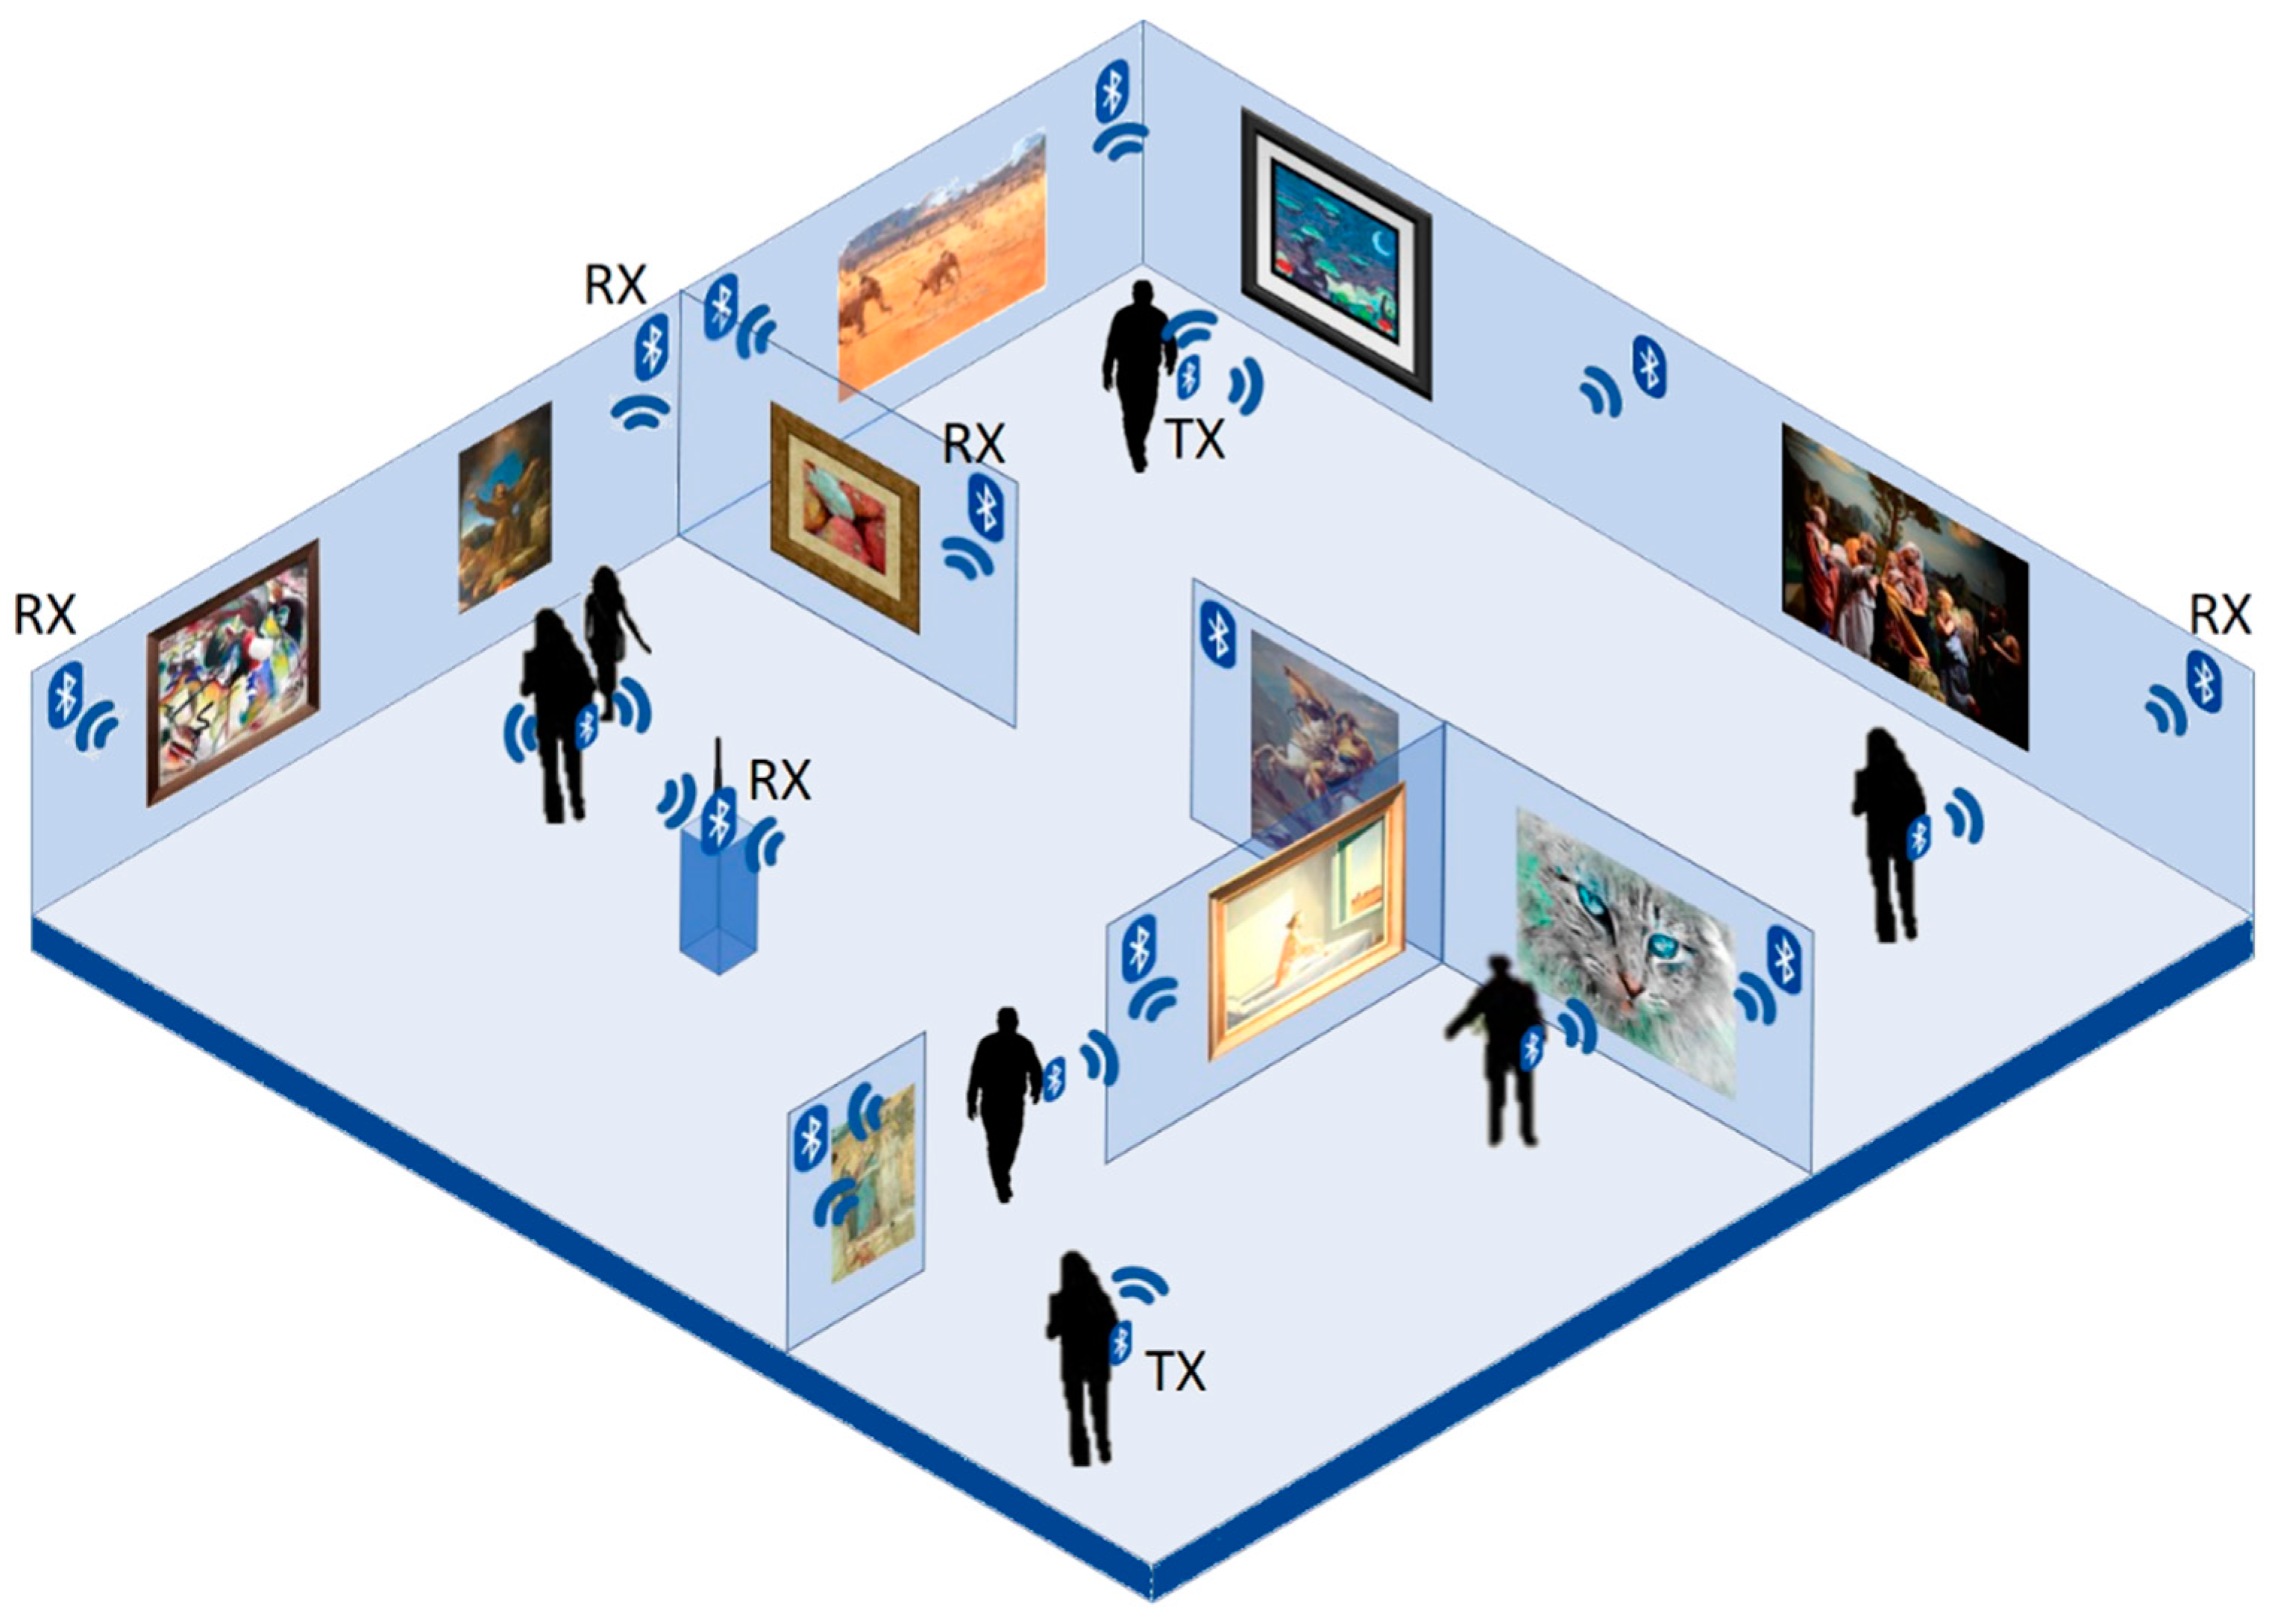
:1. Introduction
- The preparation phase (performed offline) is based on a non-invasive measurement campaign in the considered space where people are going to be localized. The offline phase in most papers can be long and costly (see below) [15,16]. In our case it consisted of collecting RSSI values between the receiver and the transmitter in a few positions in the area, with the aim of gaining knowledge of the propagation environment and the involved mechanisms (e.g., scattering and reflections);
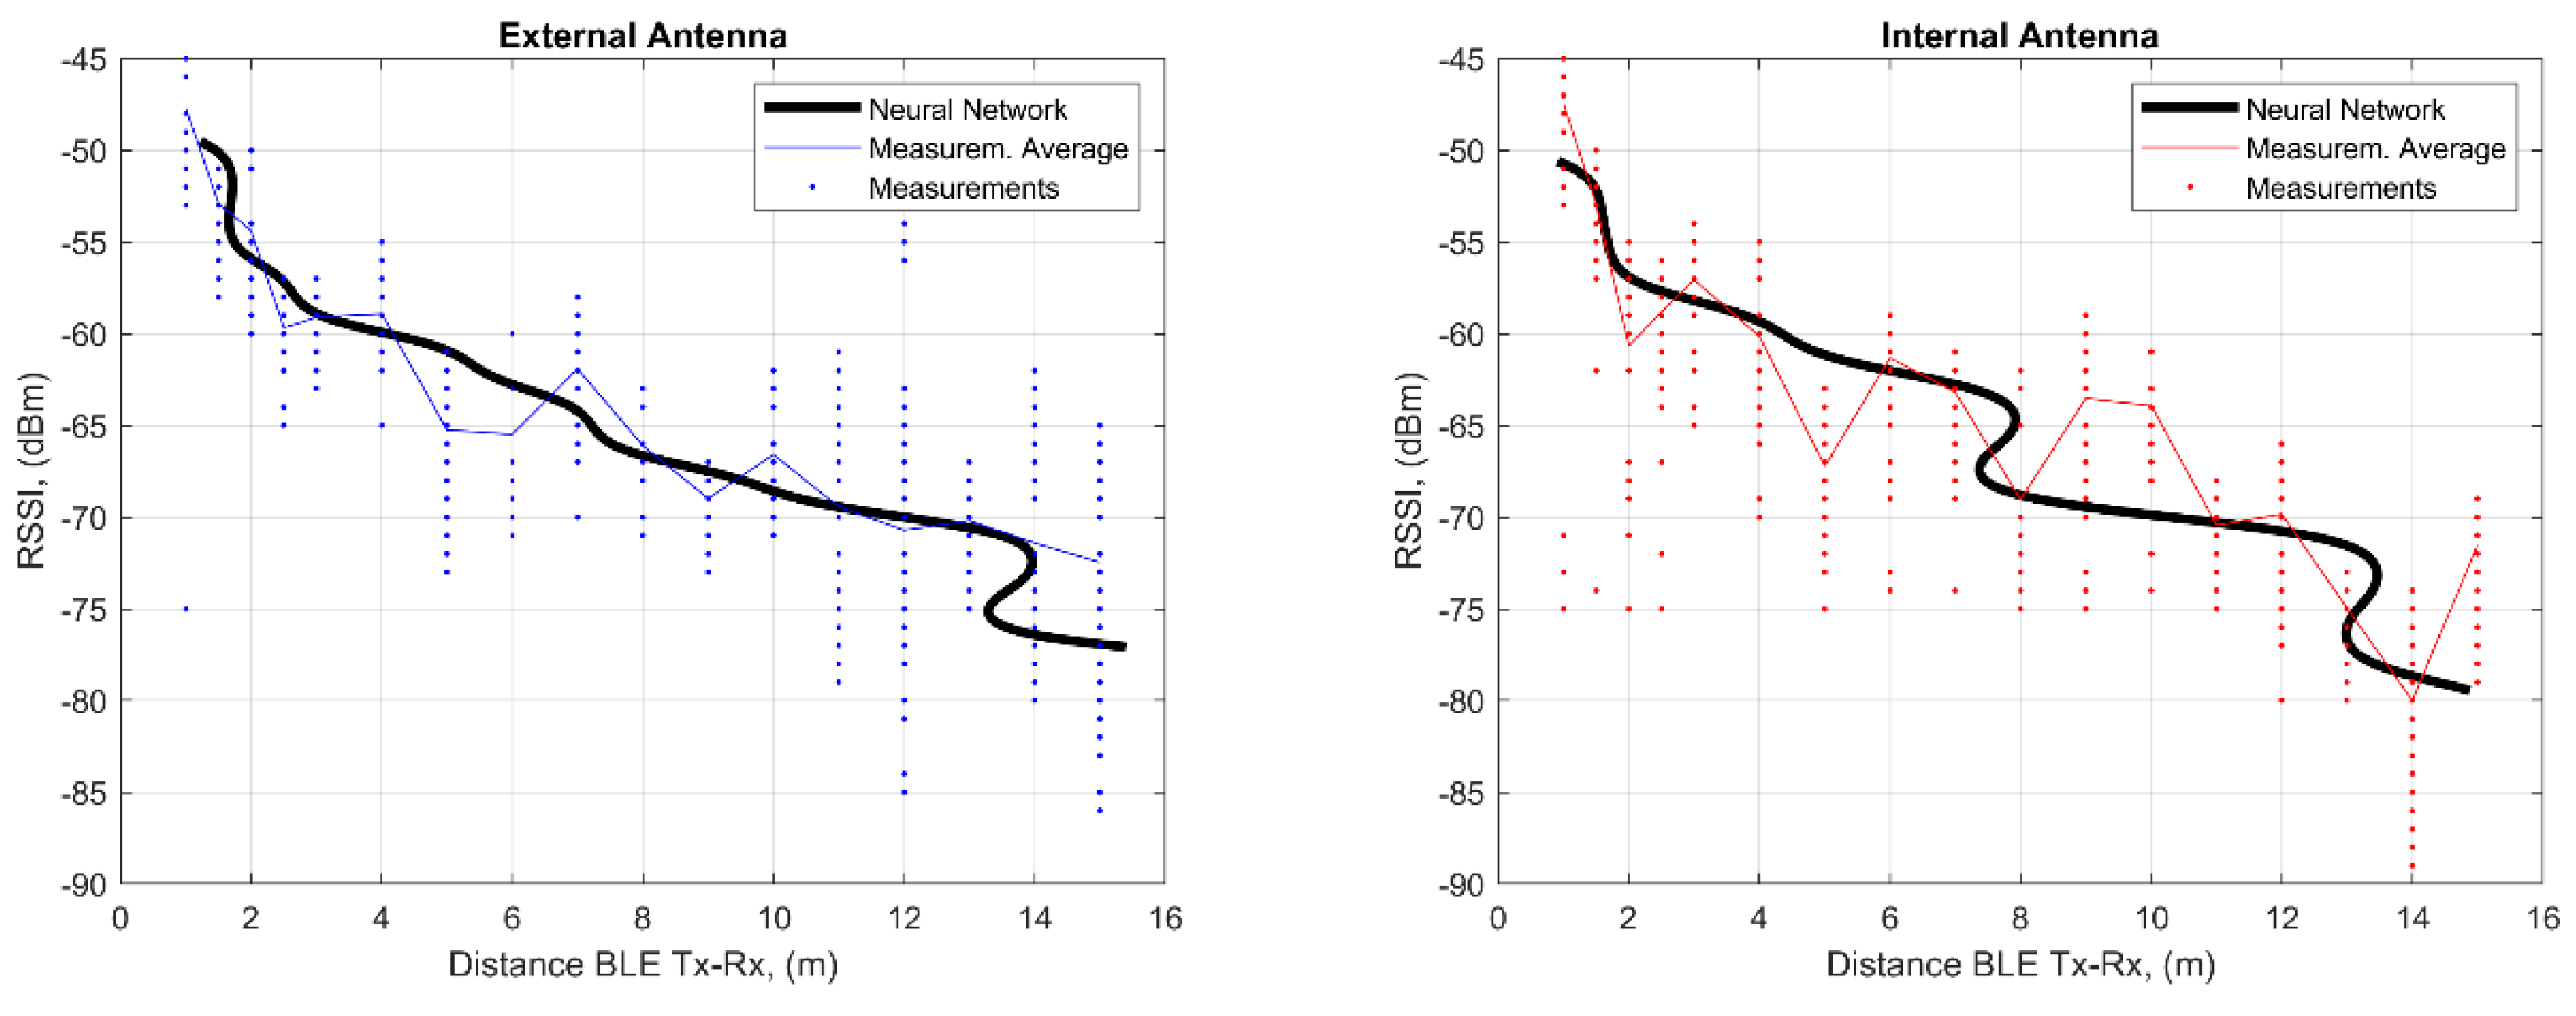
- Unlike some works in the literature (such as [17,18,19,20]; see Related Works section) where the distance estimation was expressed by evaluation of the radio frequency signal attenuation and its related pathloss model (i.e., model-based positioning), we introduced a neural network trained by the measurements collected in the preparation phase. This allowed us to overcome the problem of estimating the distance based on propagation distance and radio signal strength, which may give very complex results in indoor environments;
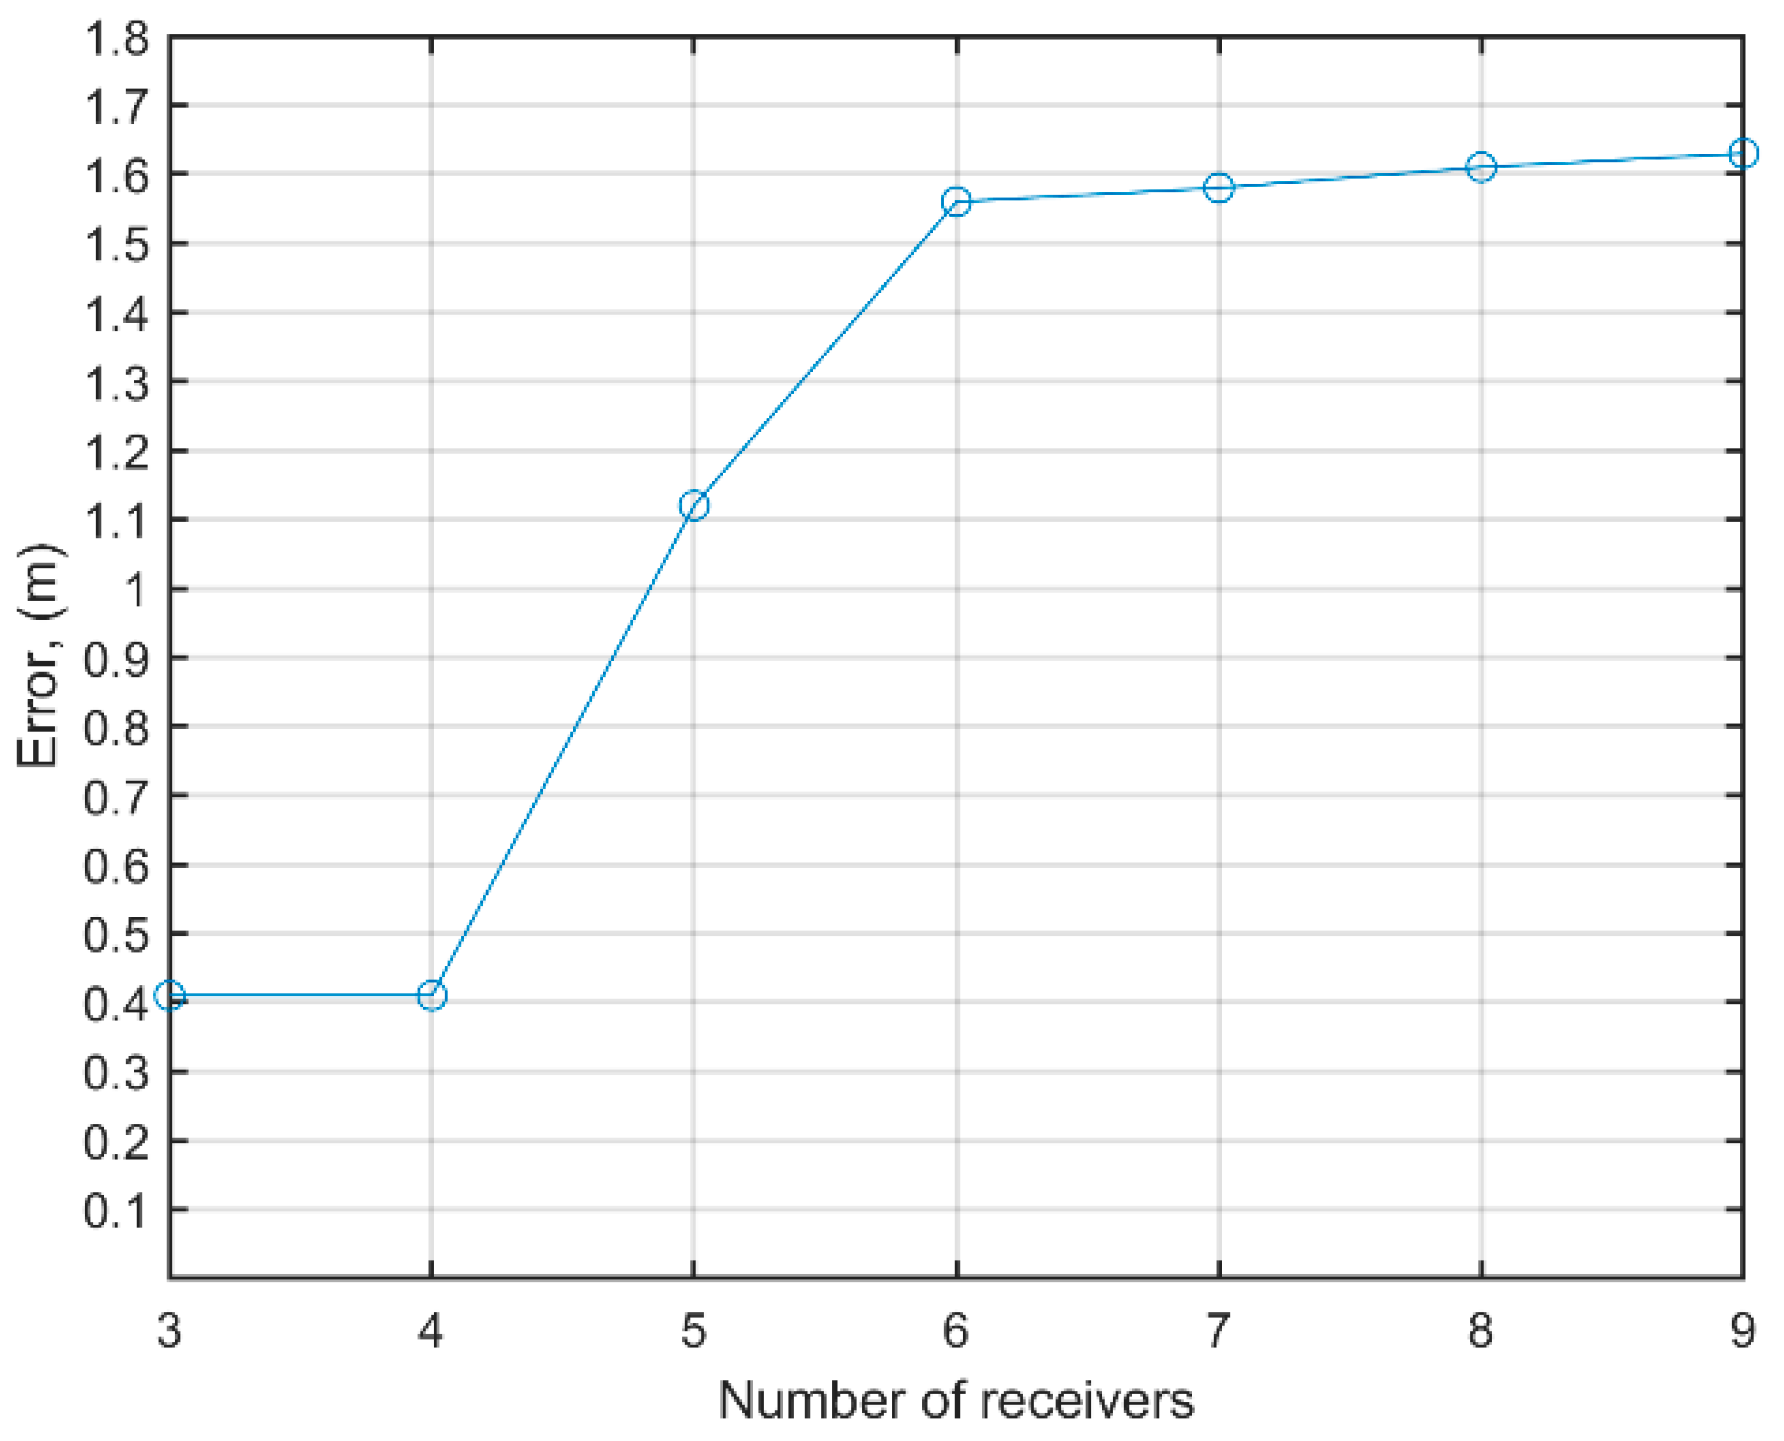
- We analyzed different deployment strategies in the considered area by evaluating the positioning errors in terms of the deployed scenarios. Differently from [21], in this analysis we gained an indication of how many receivers should be deployed, and where;
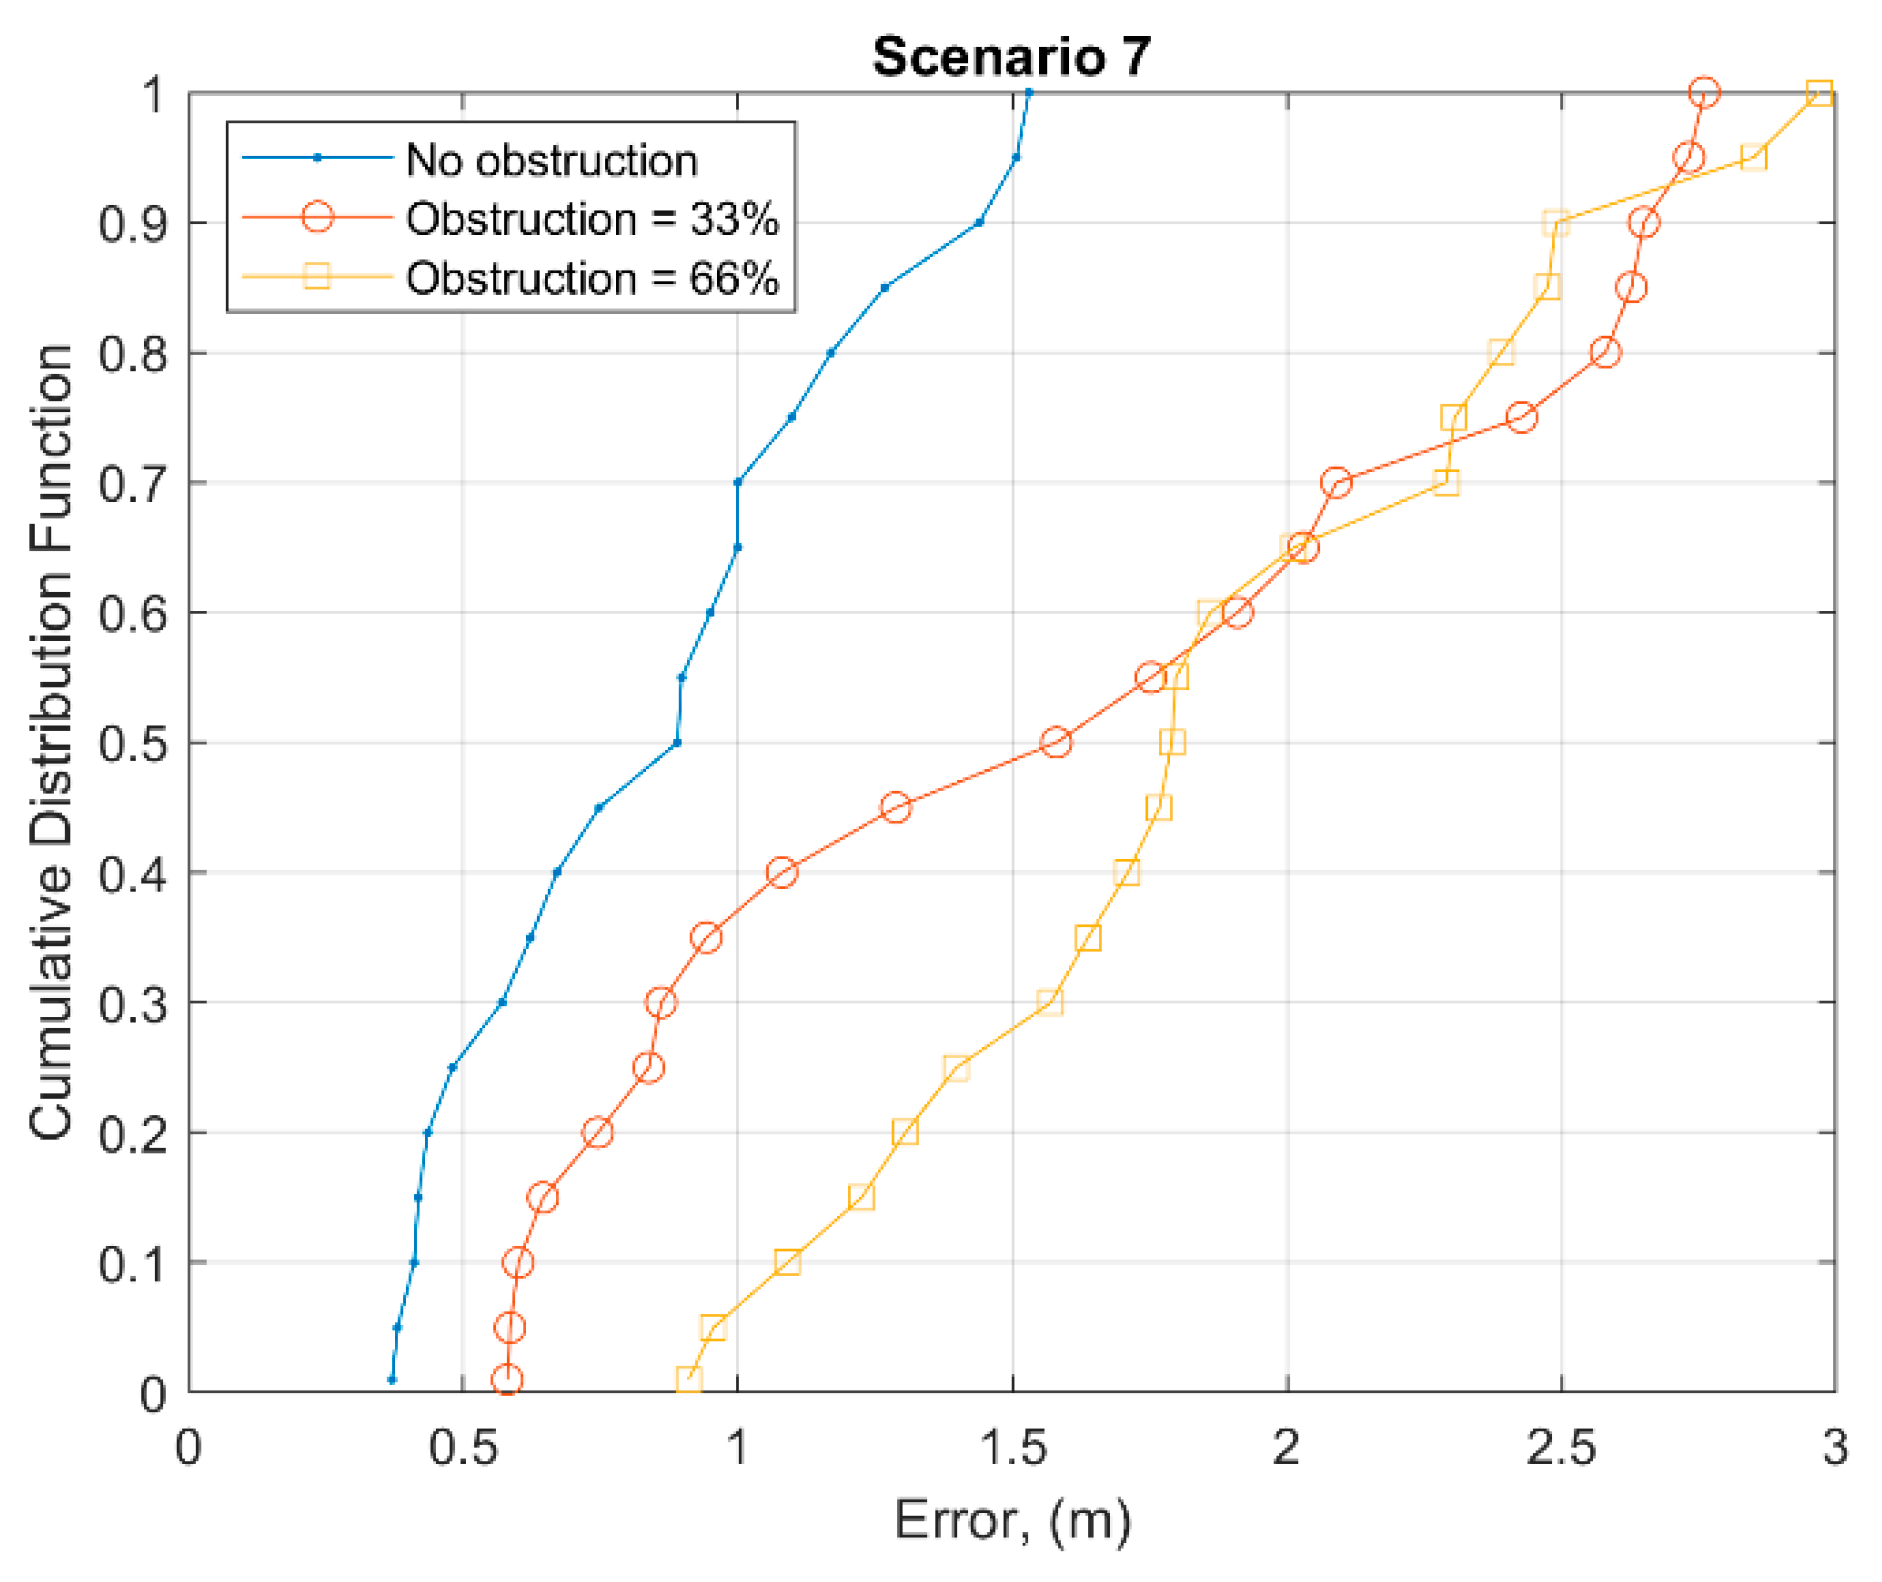
- Finally, unlike other methods proposed in the literature such as fingerprinting (such as in [22,23]), we performed an analysis where possible human obstruction could occur during the normal phase. This is important since other studies have failed in position estimation because their RSSI collection was done without any human presence, which means results are different when people obstruct the RF signal.
2. Related Works
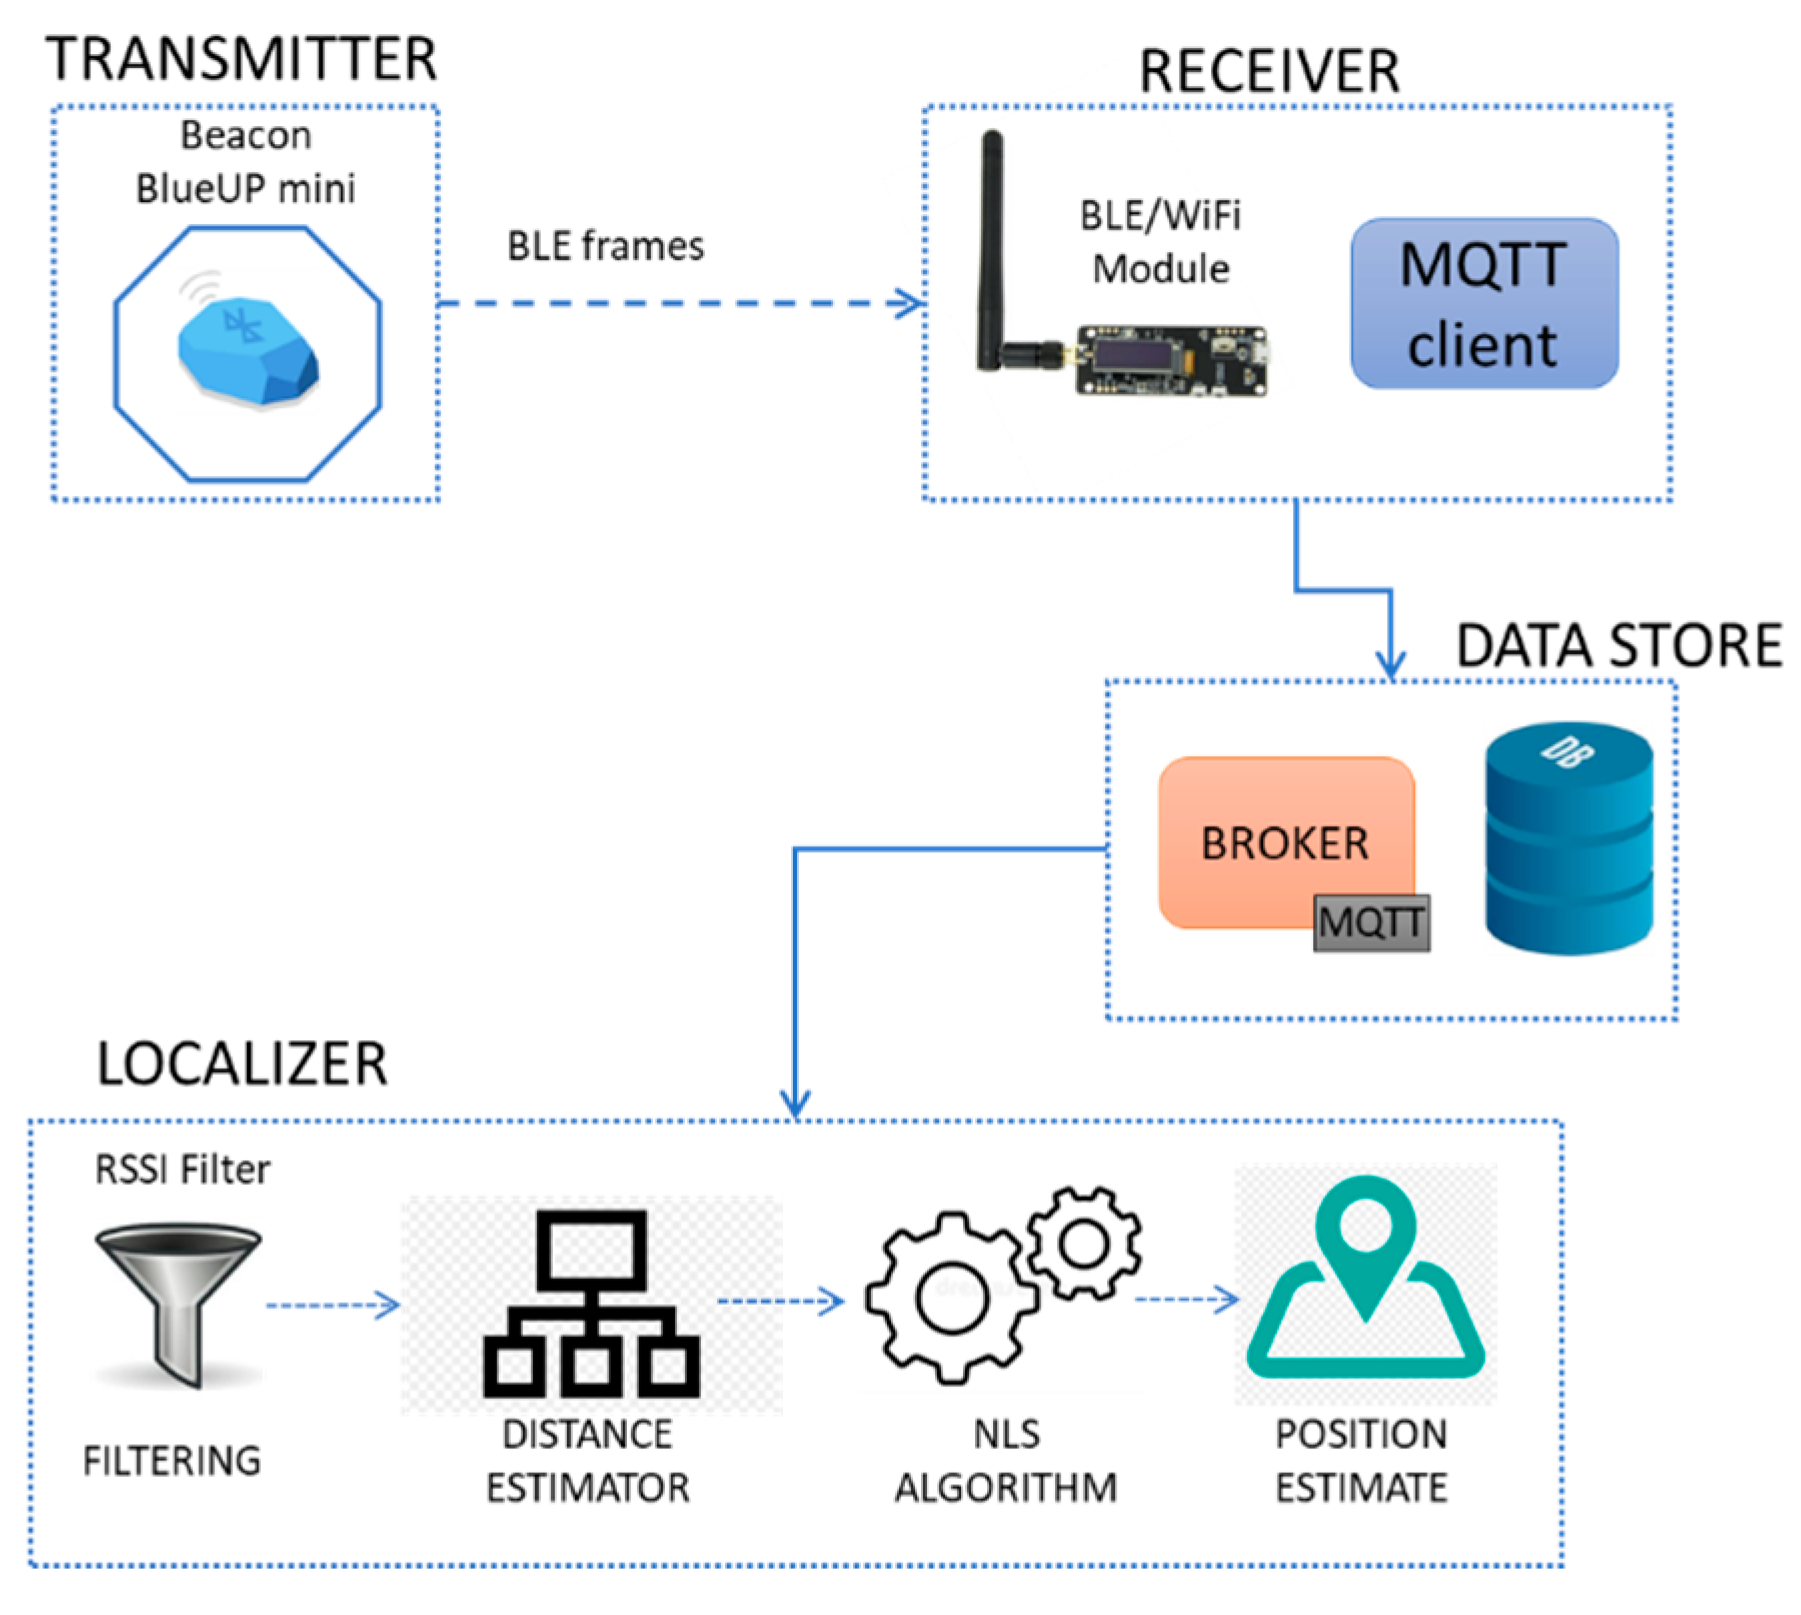
3. System Architecture
4. Propagation Model Estimation in the Considered Environment
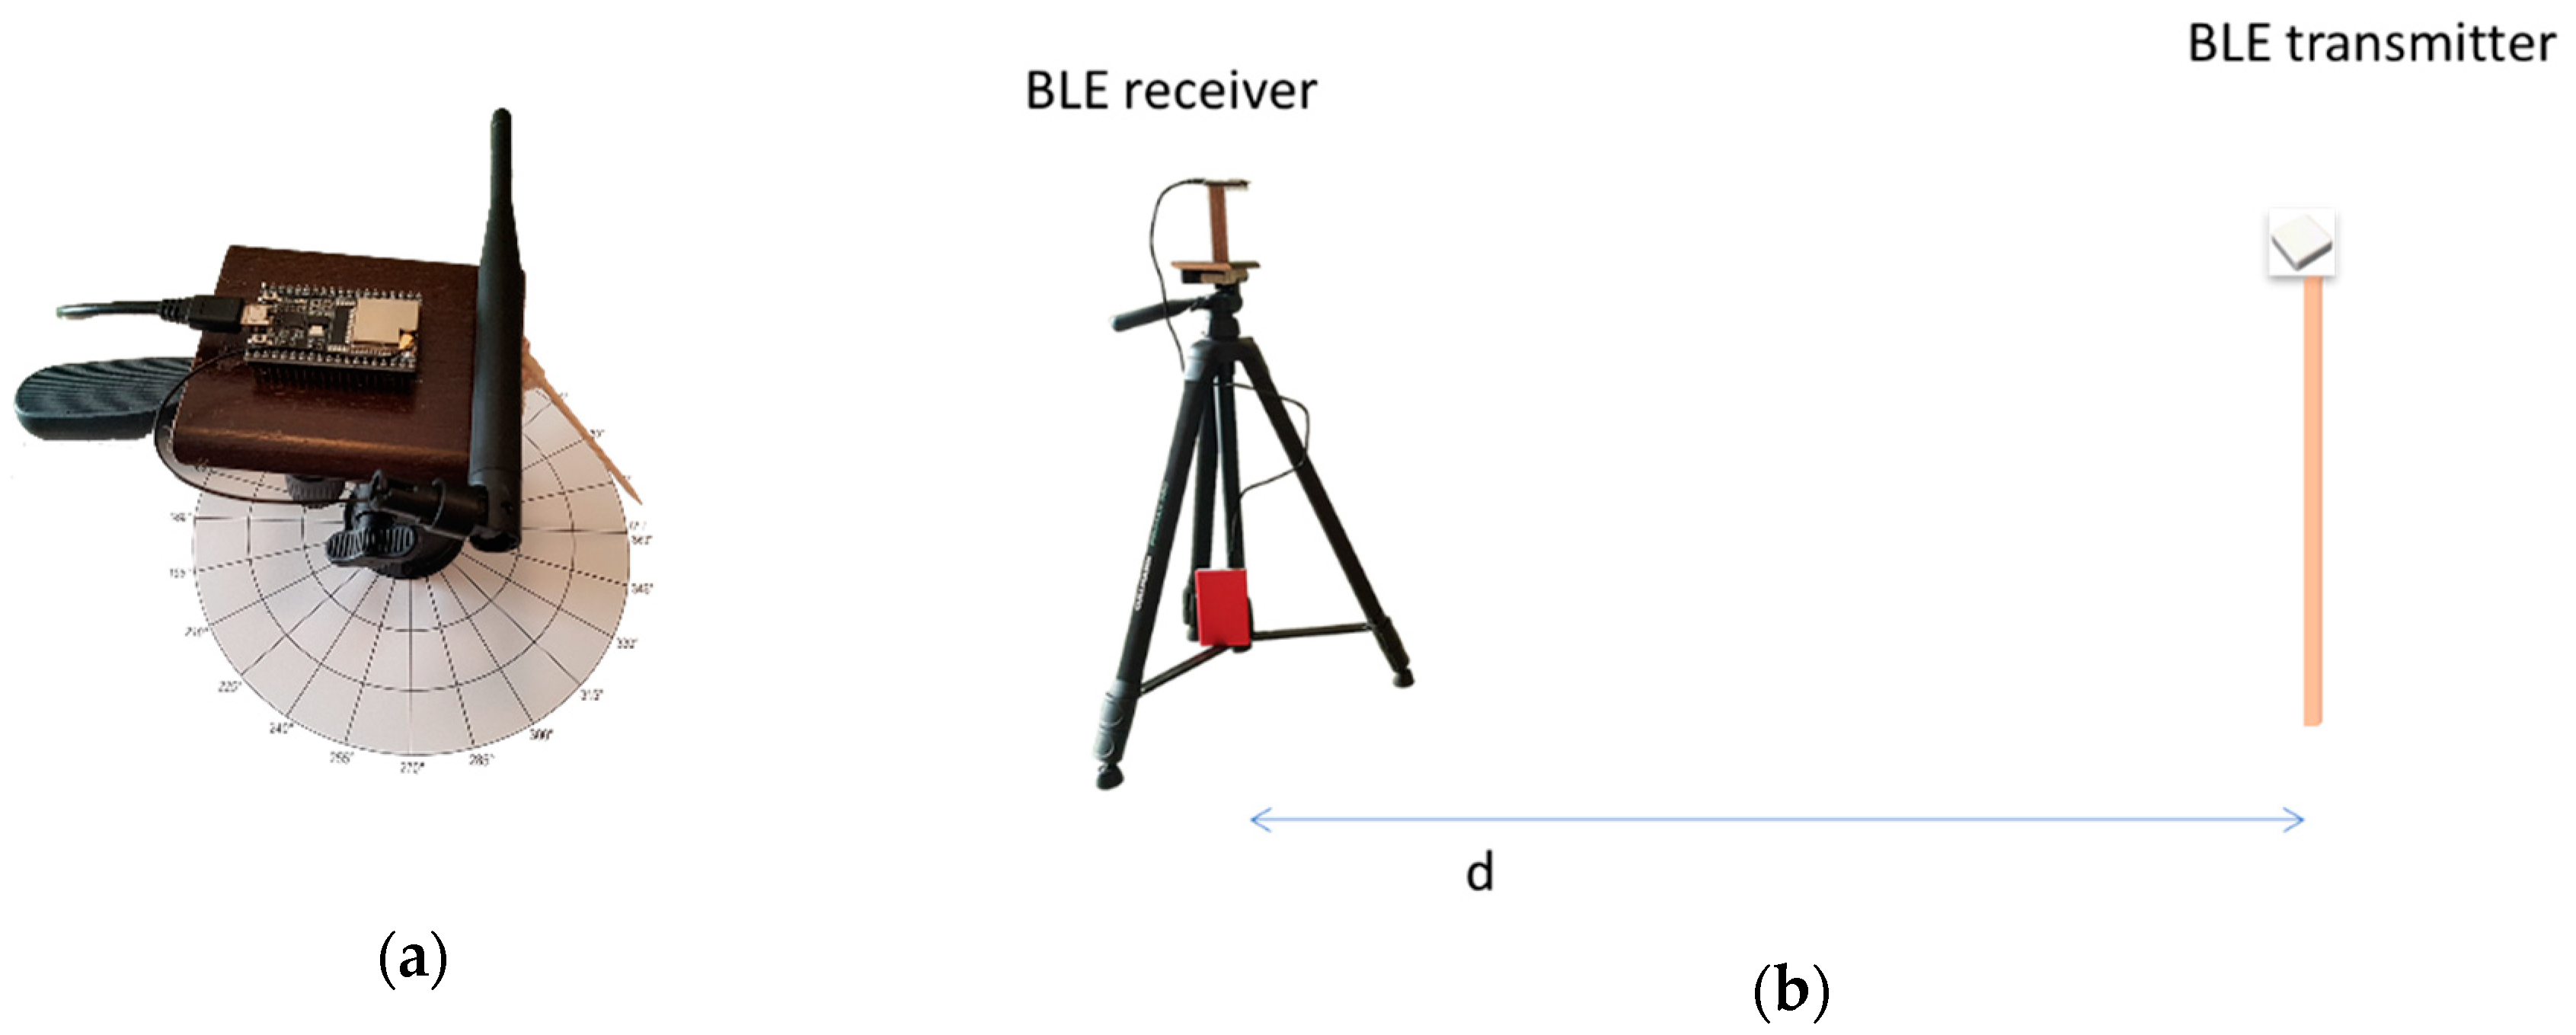
4.1. Testbed Setup
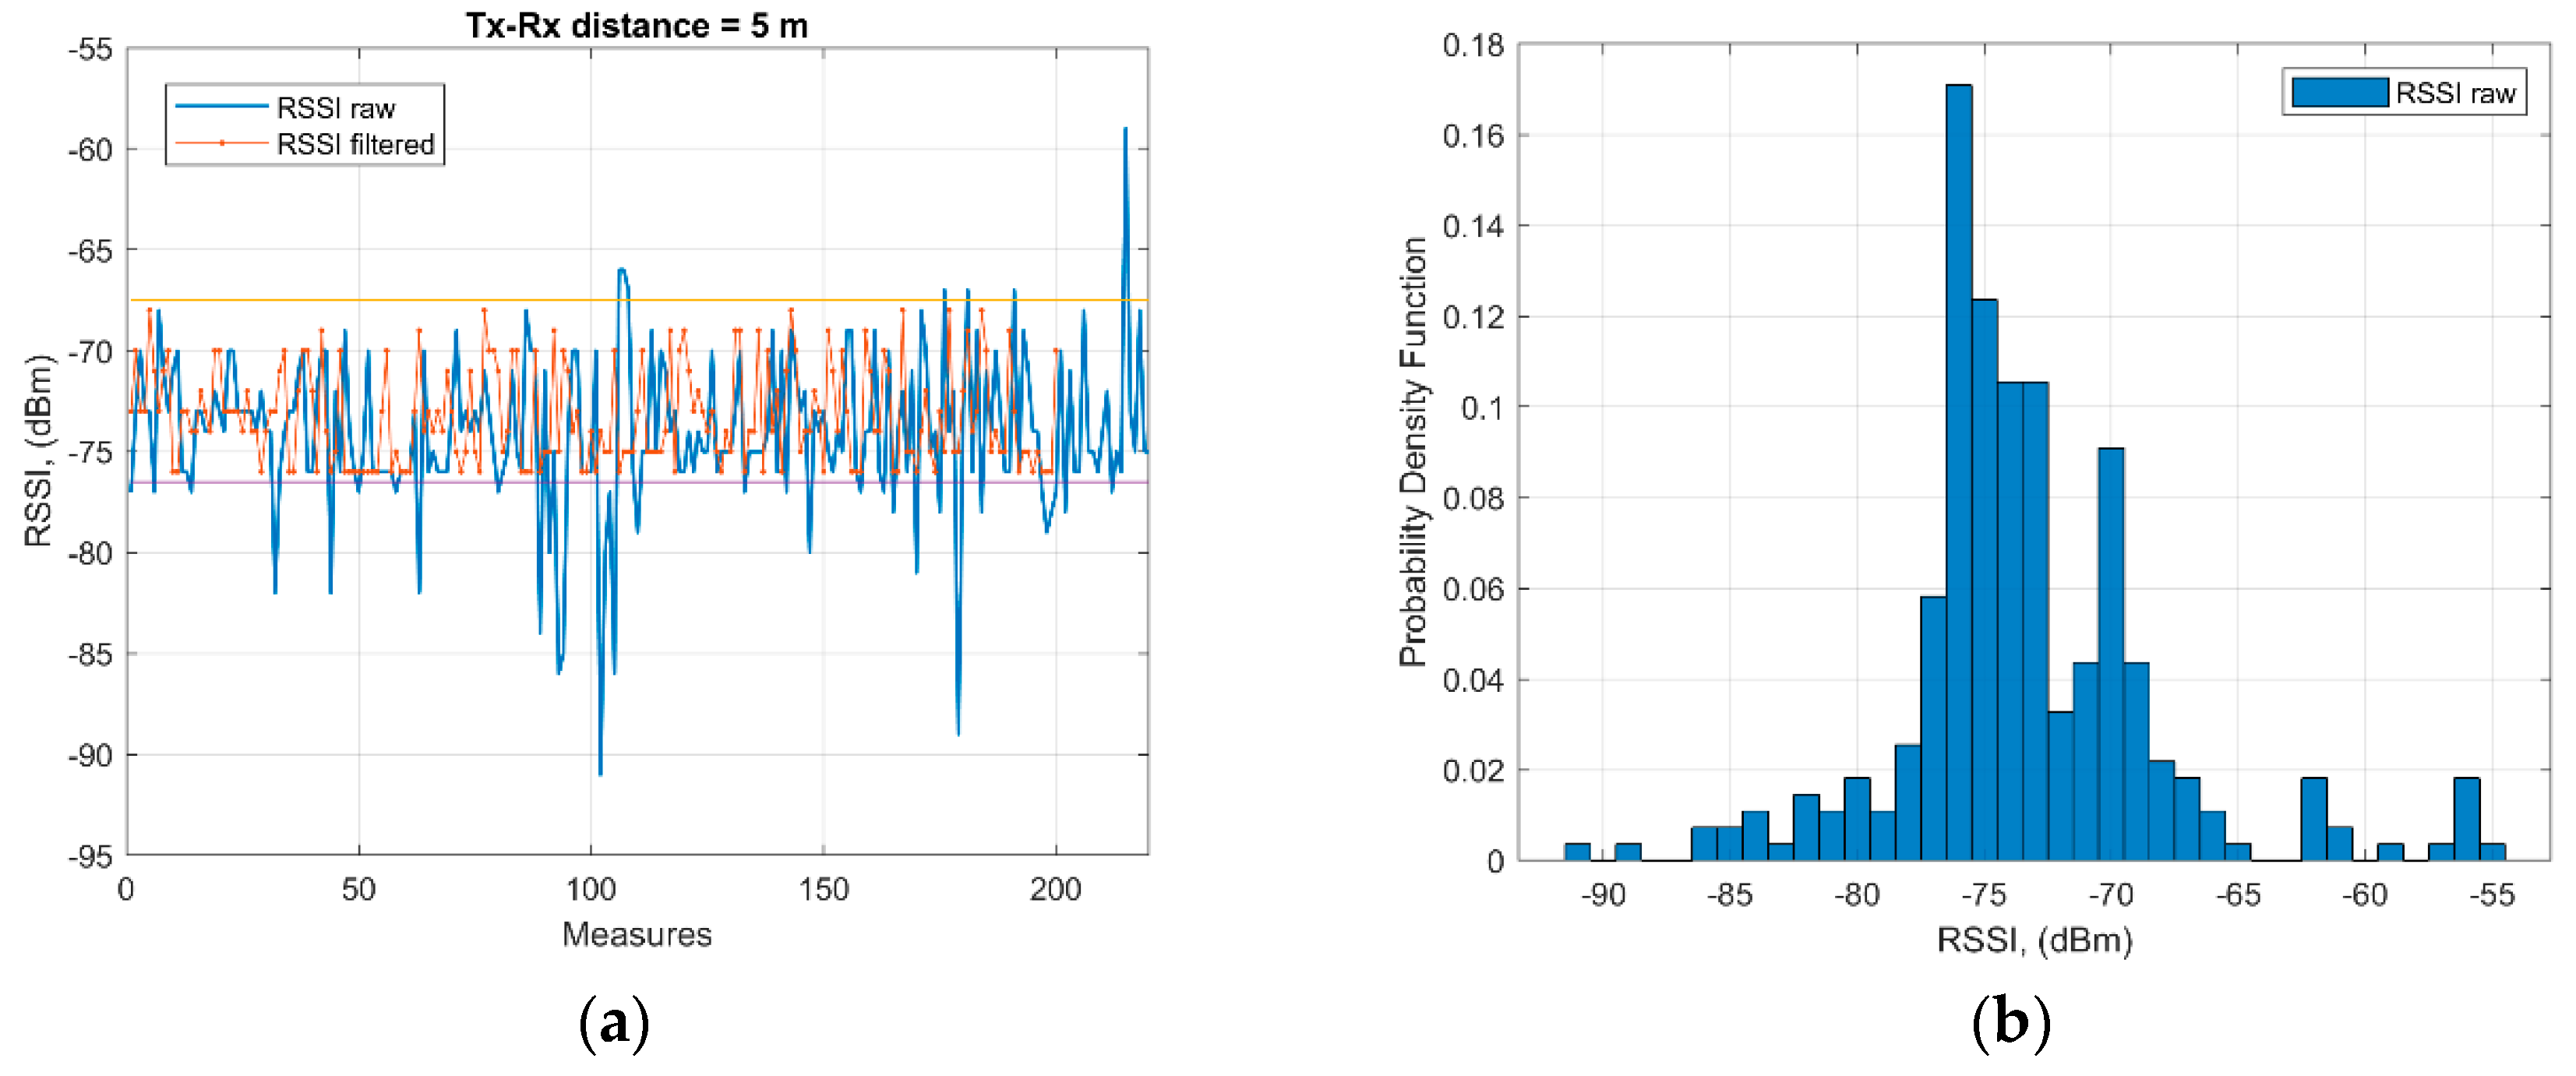
4.2. Measurement Campaign
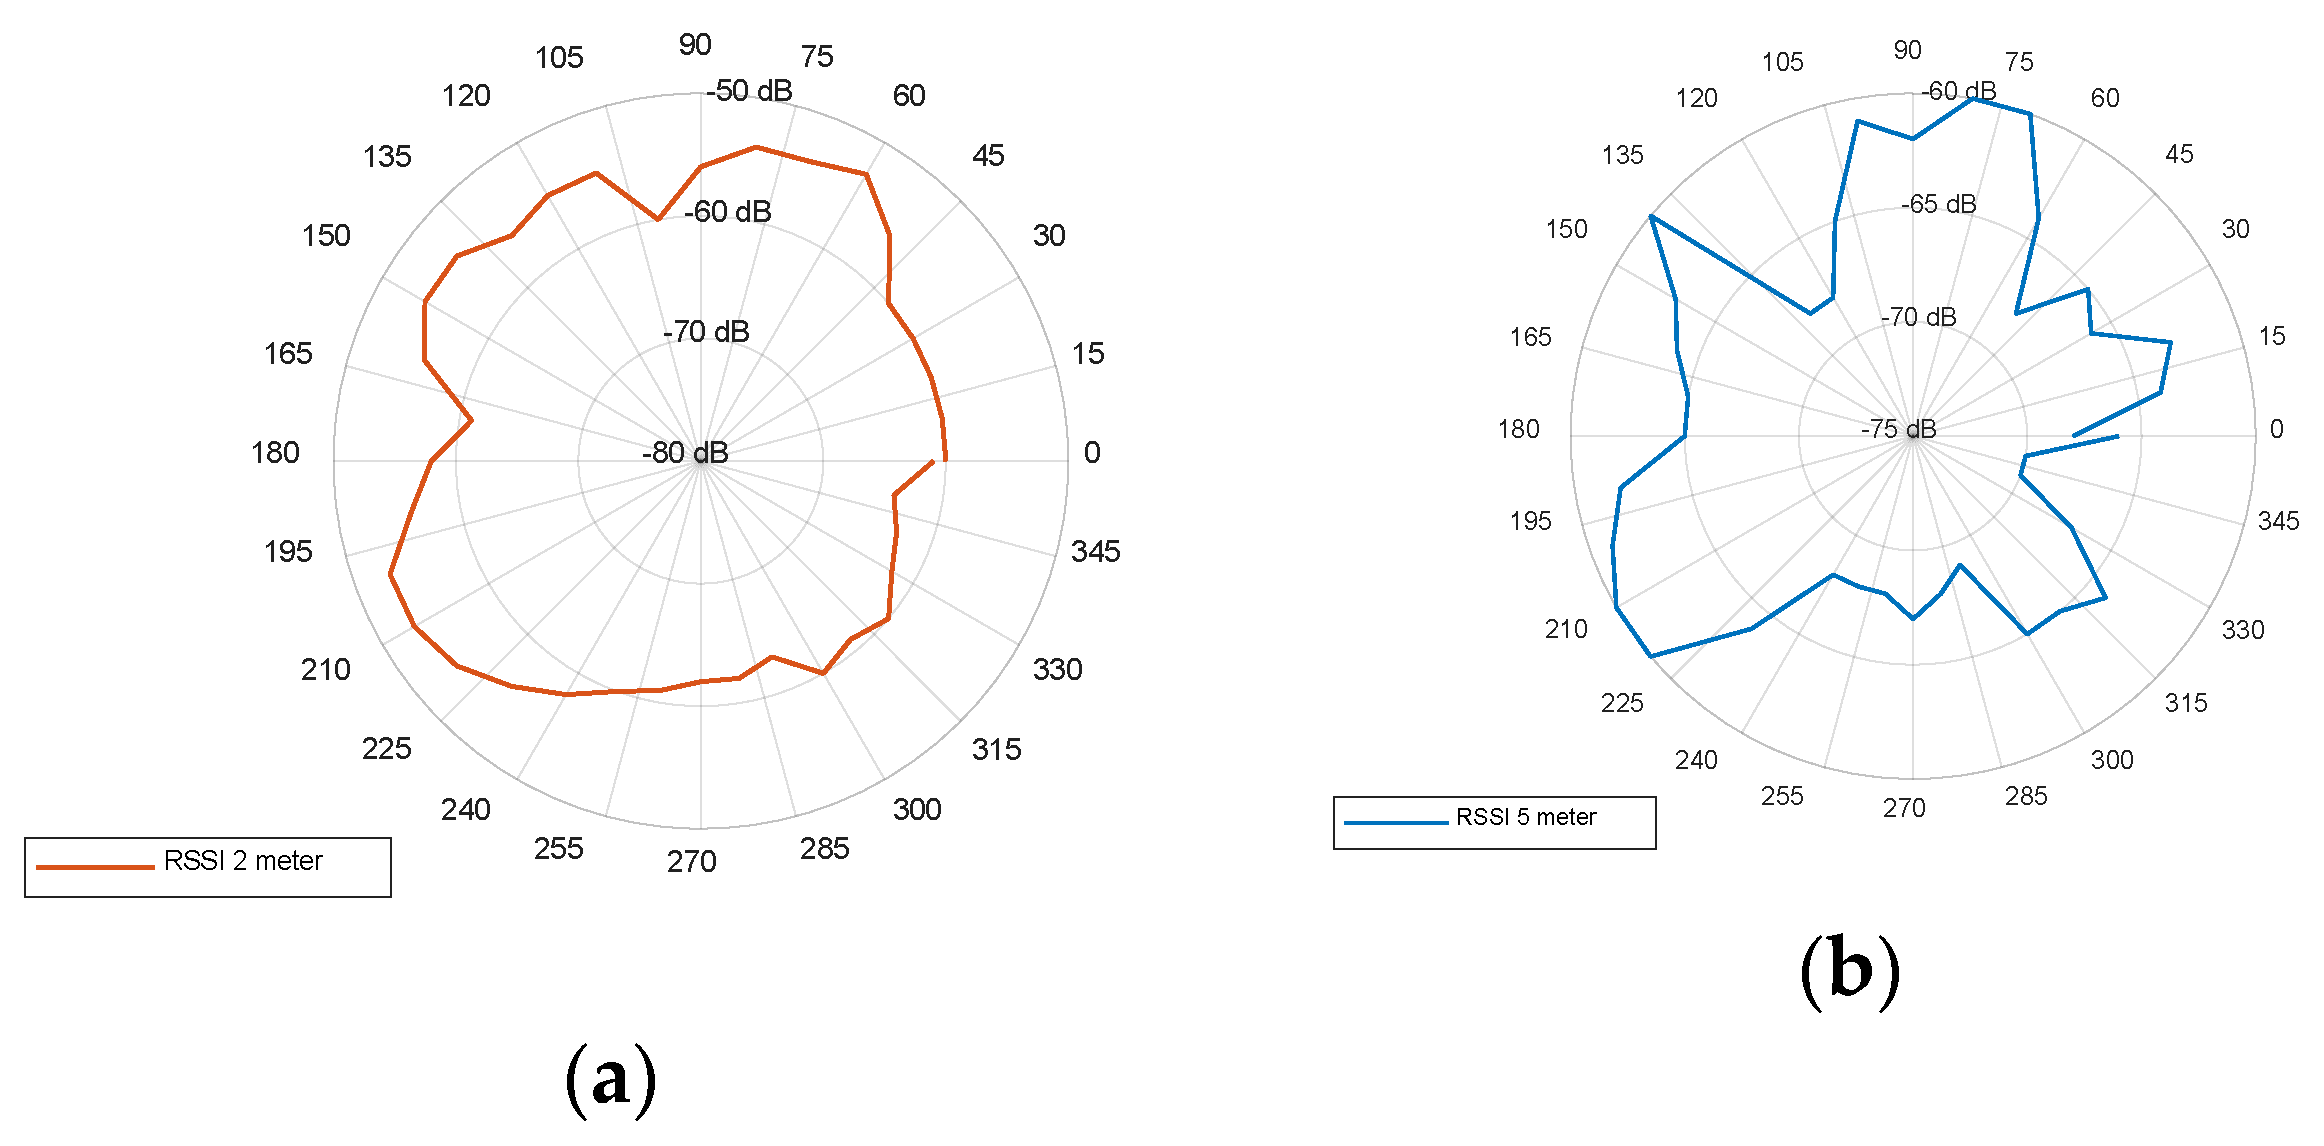
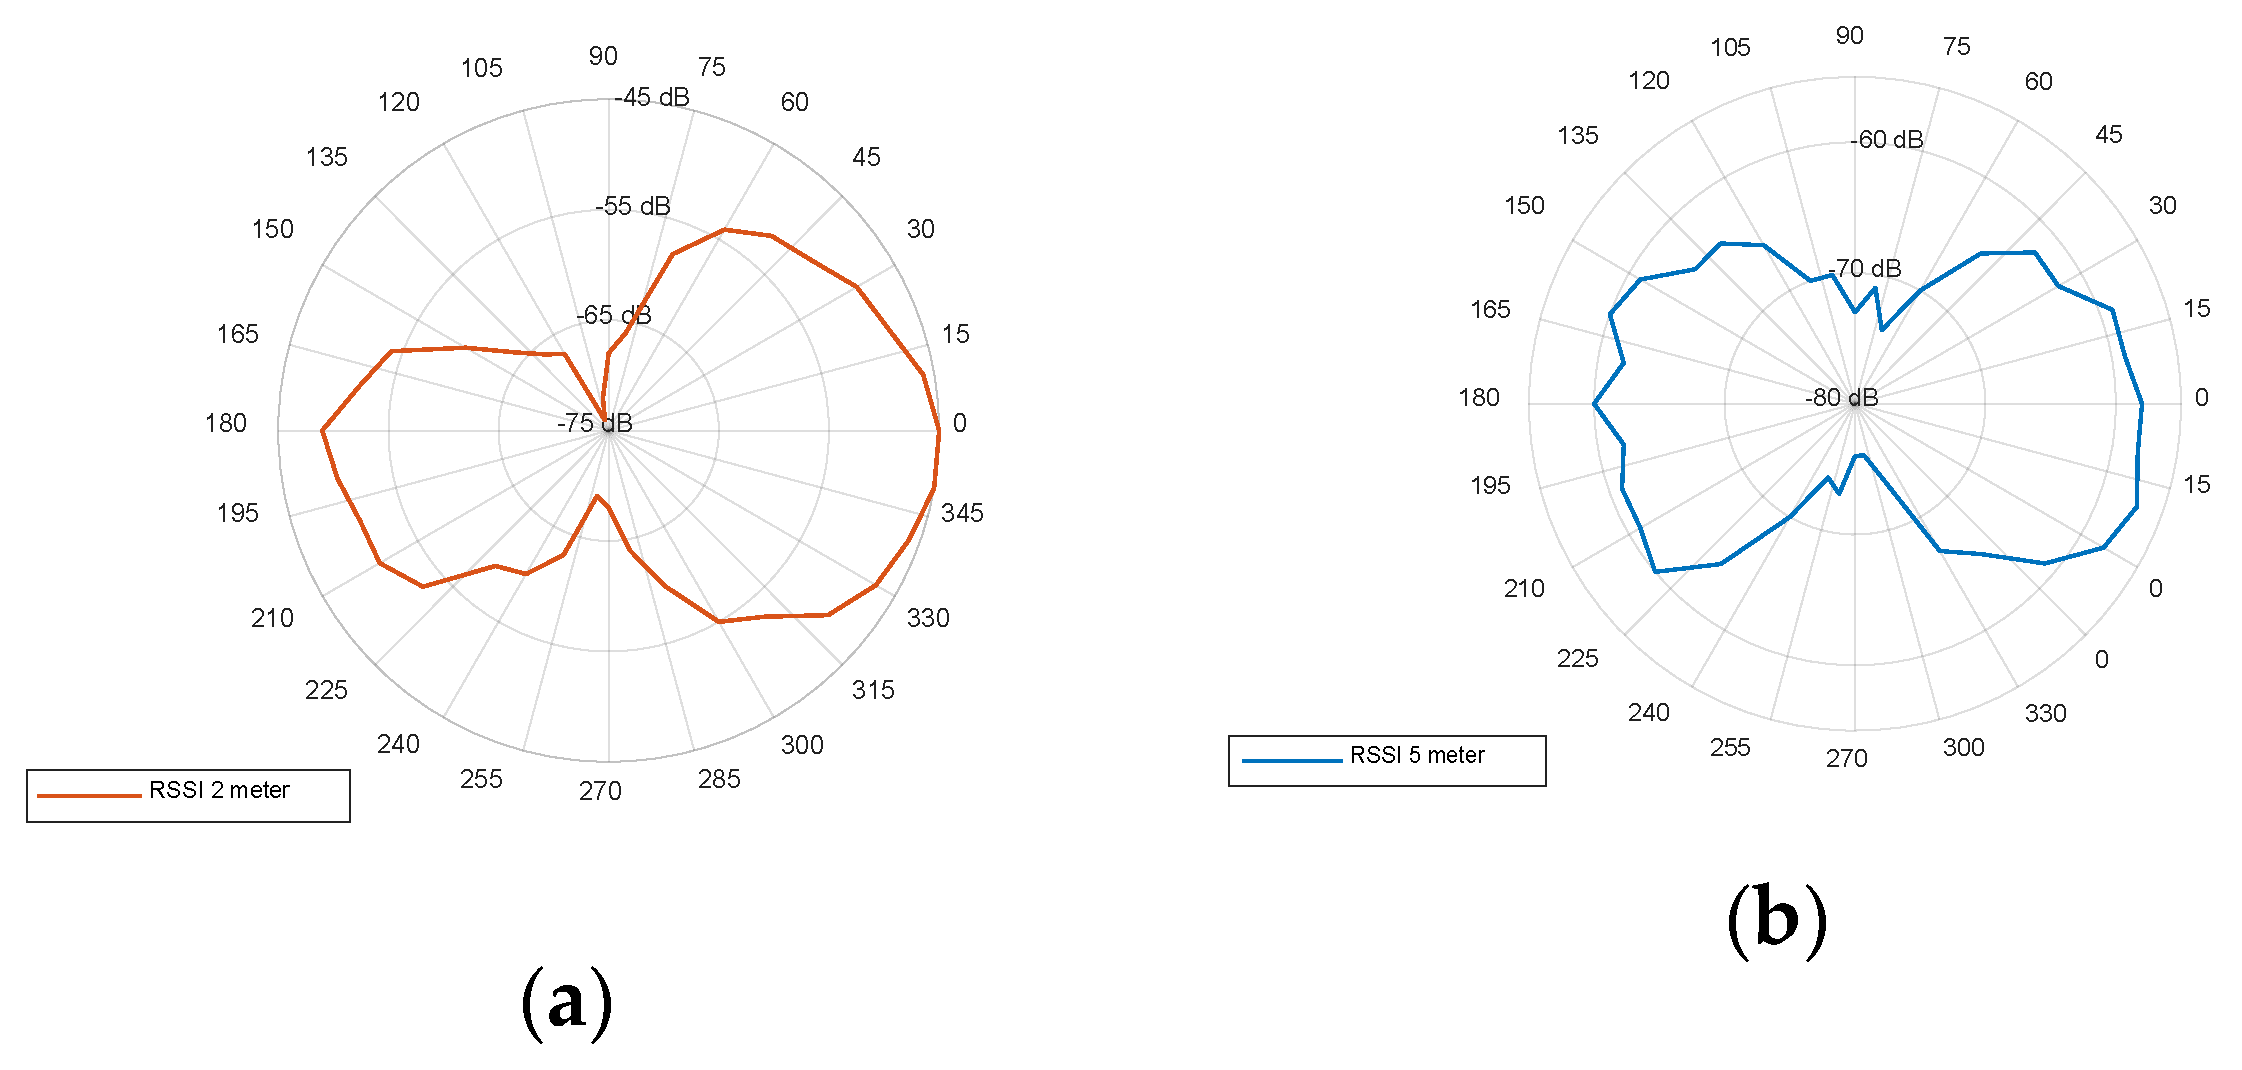
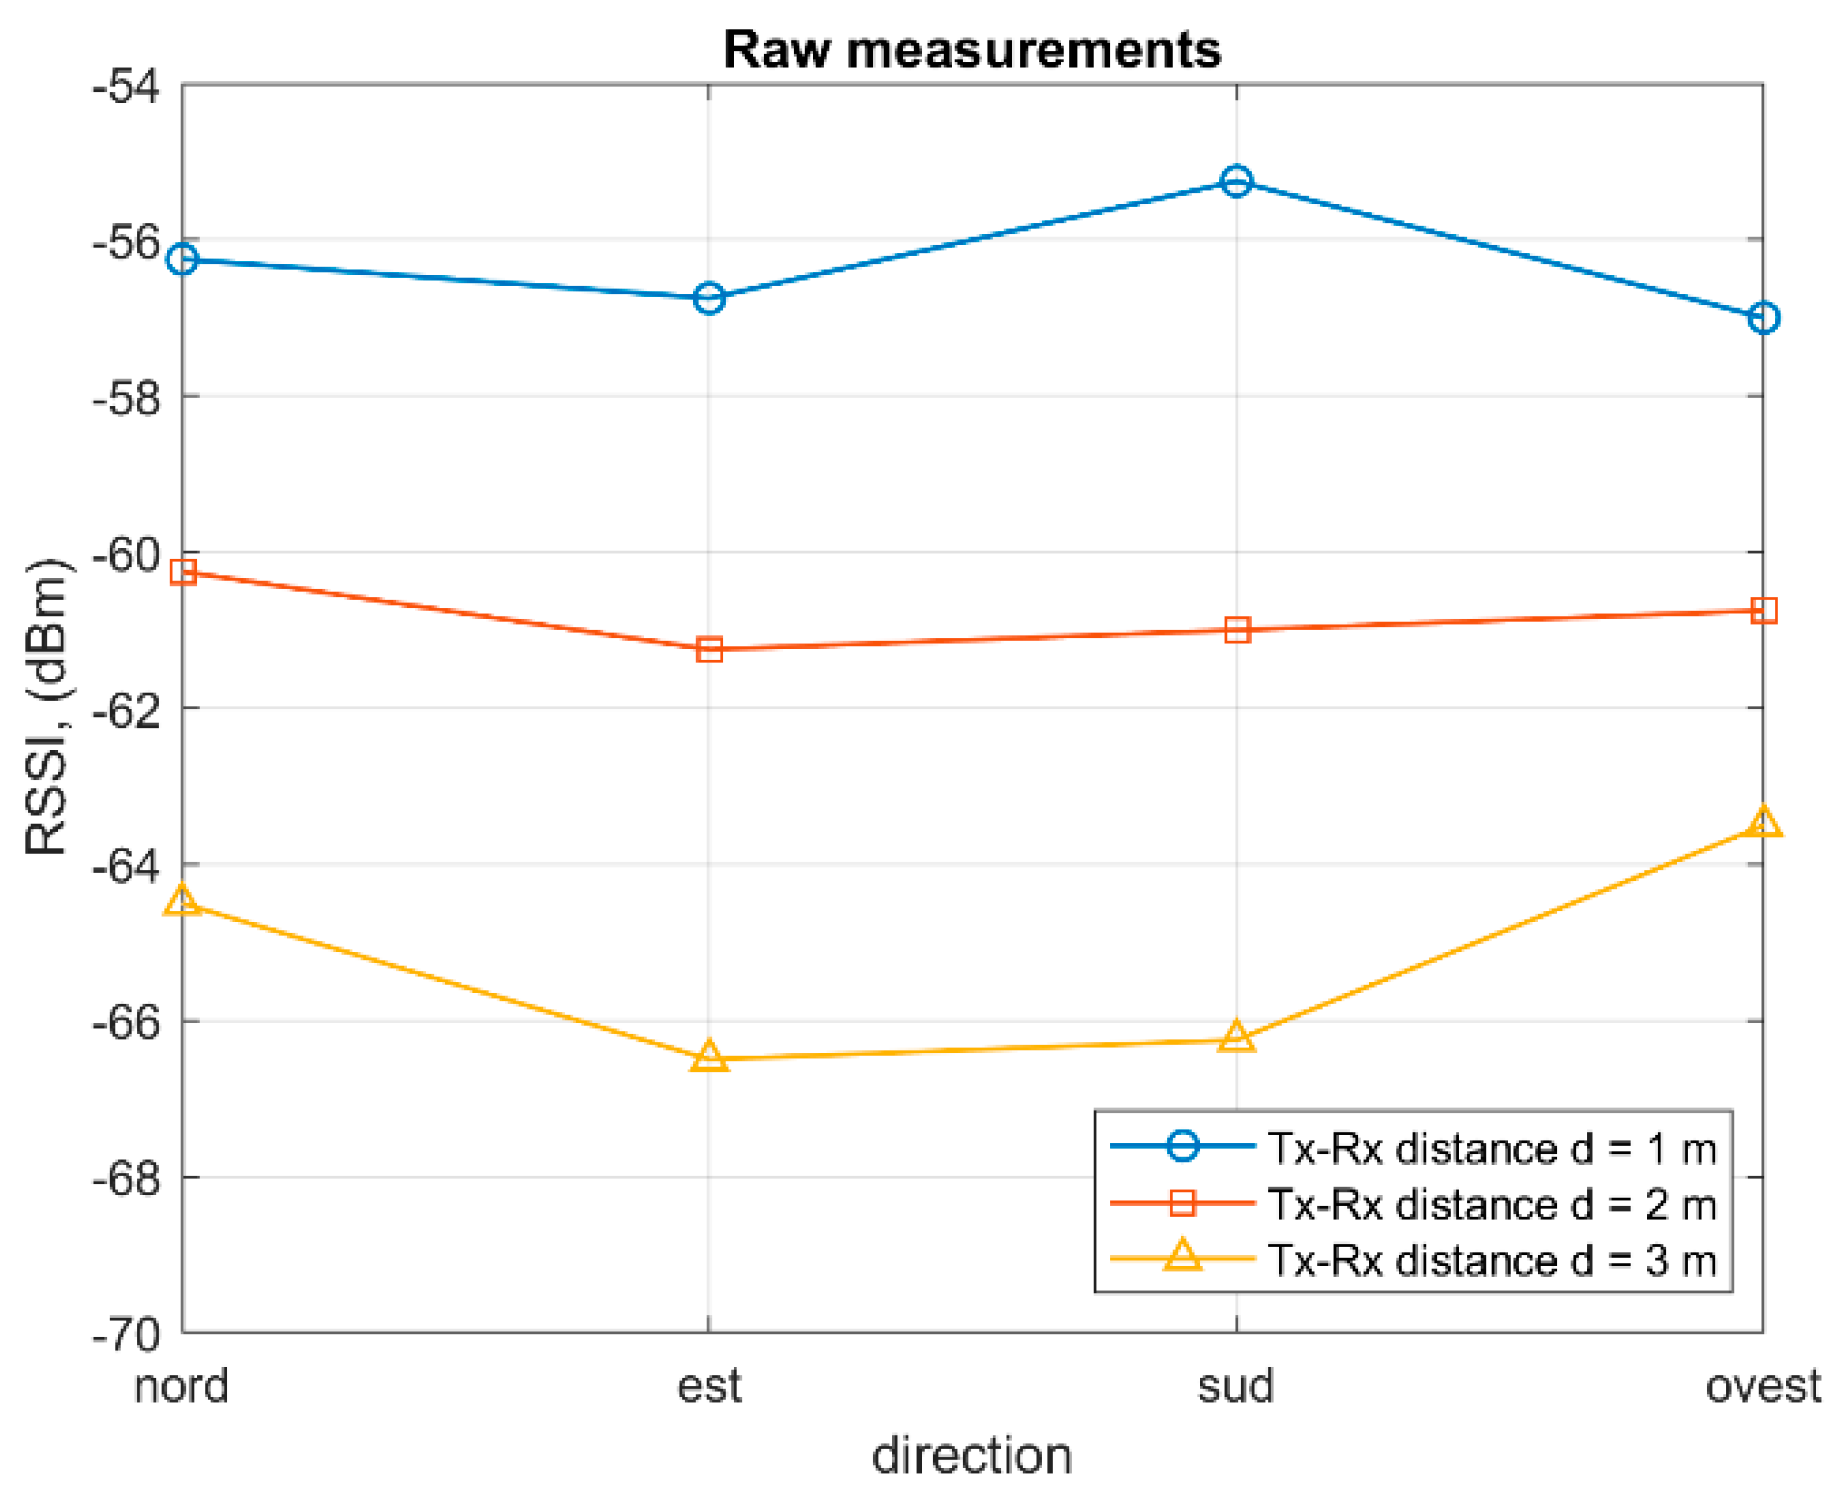
4.3. Radiation Diagram Evaluation
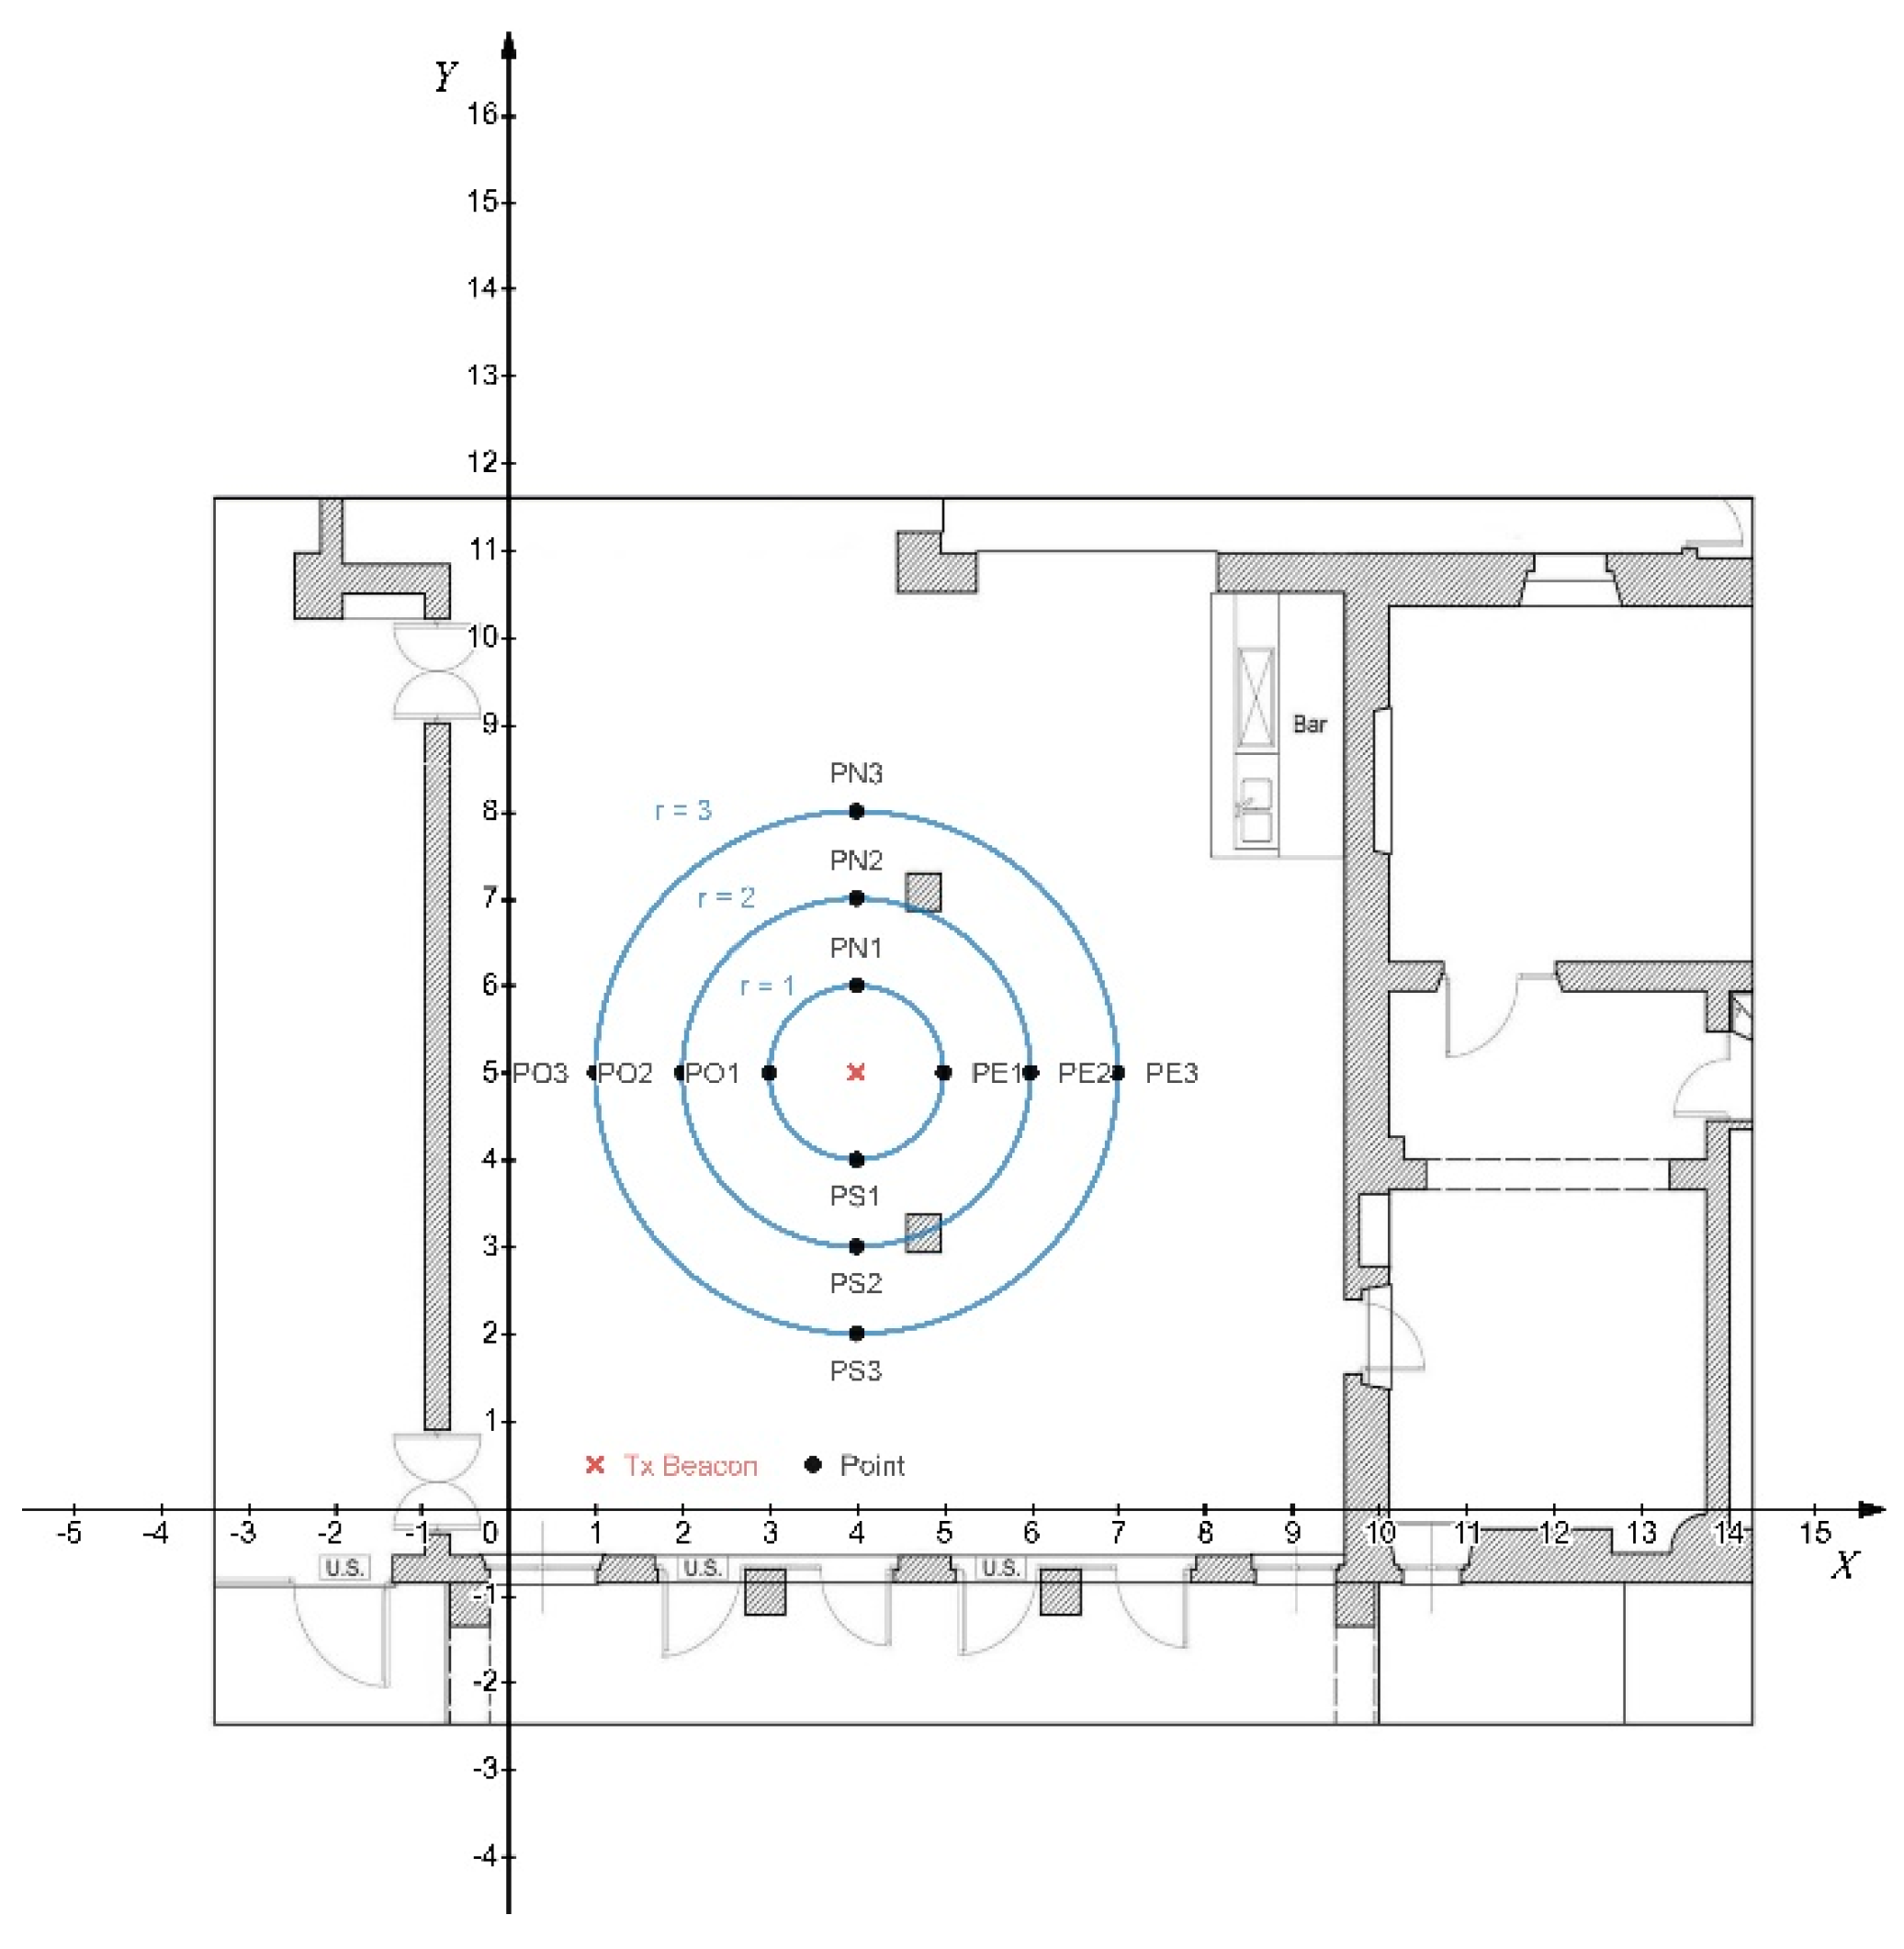
- The receiver was placed at a distance of 1 m north with respect to the transmitter.
- 150 RSSI values were acquired at 0°, 90°, 180°, and 270° by rotating the receiver on its position in the directions north-east-south-west. Thus, a total of 600 values were acquired in the north direction.
- Point 2 was repeated in the east, south, and west directions with respect to the transmitter.
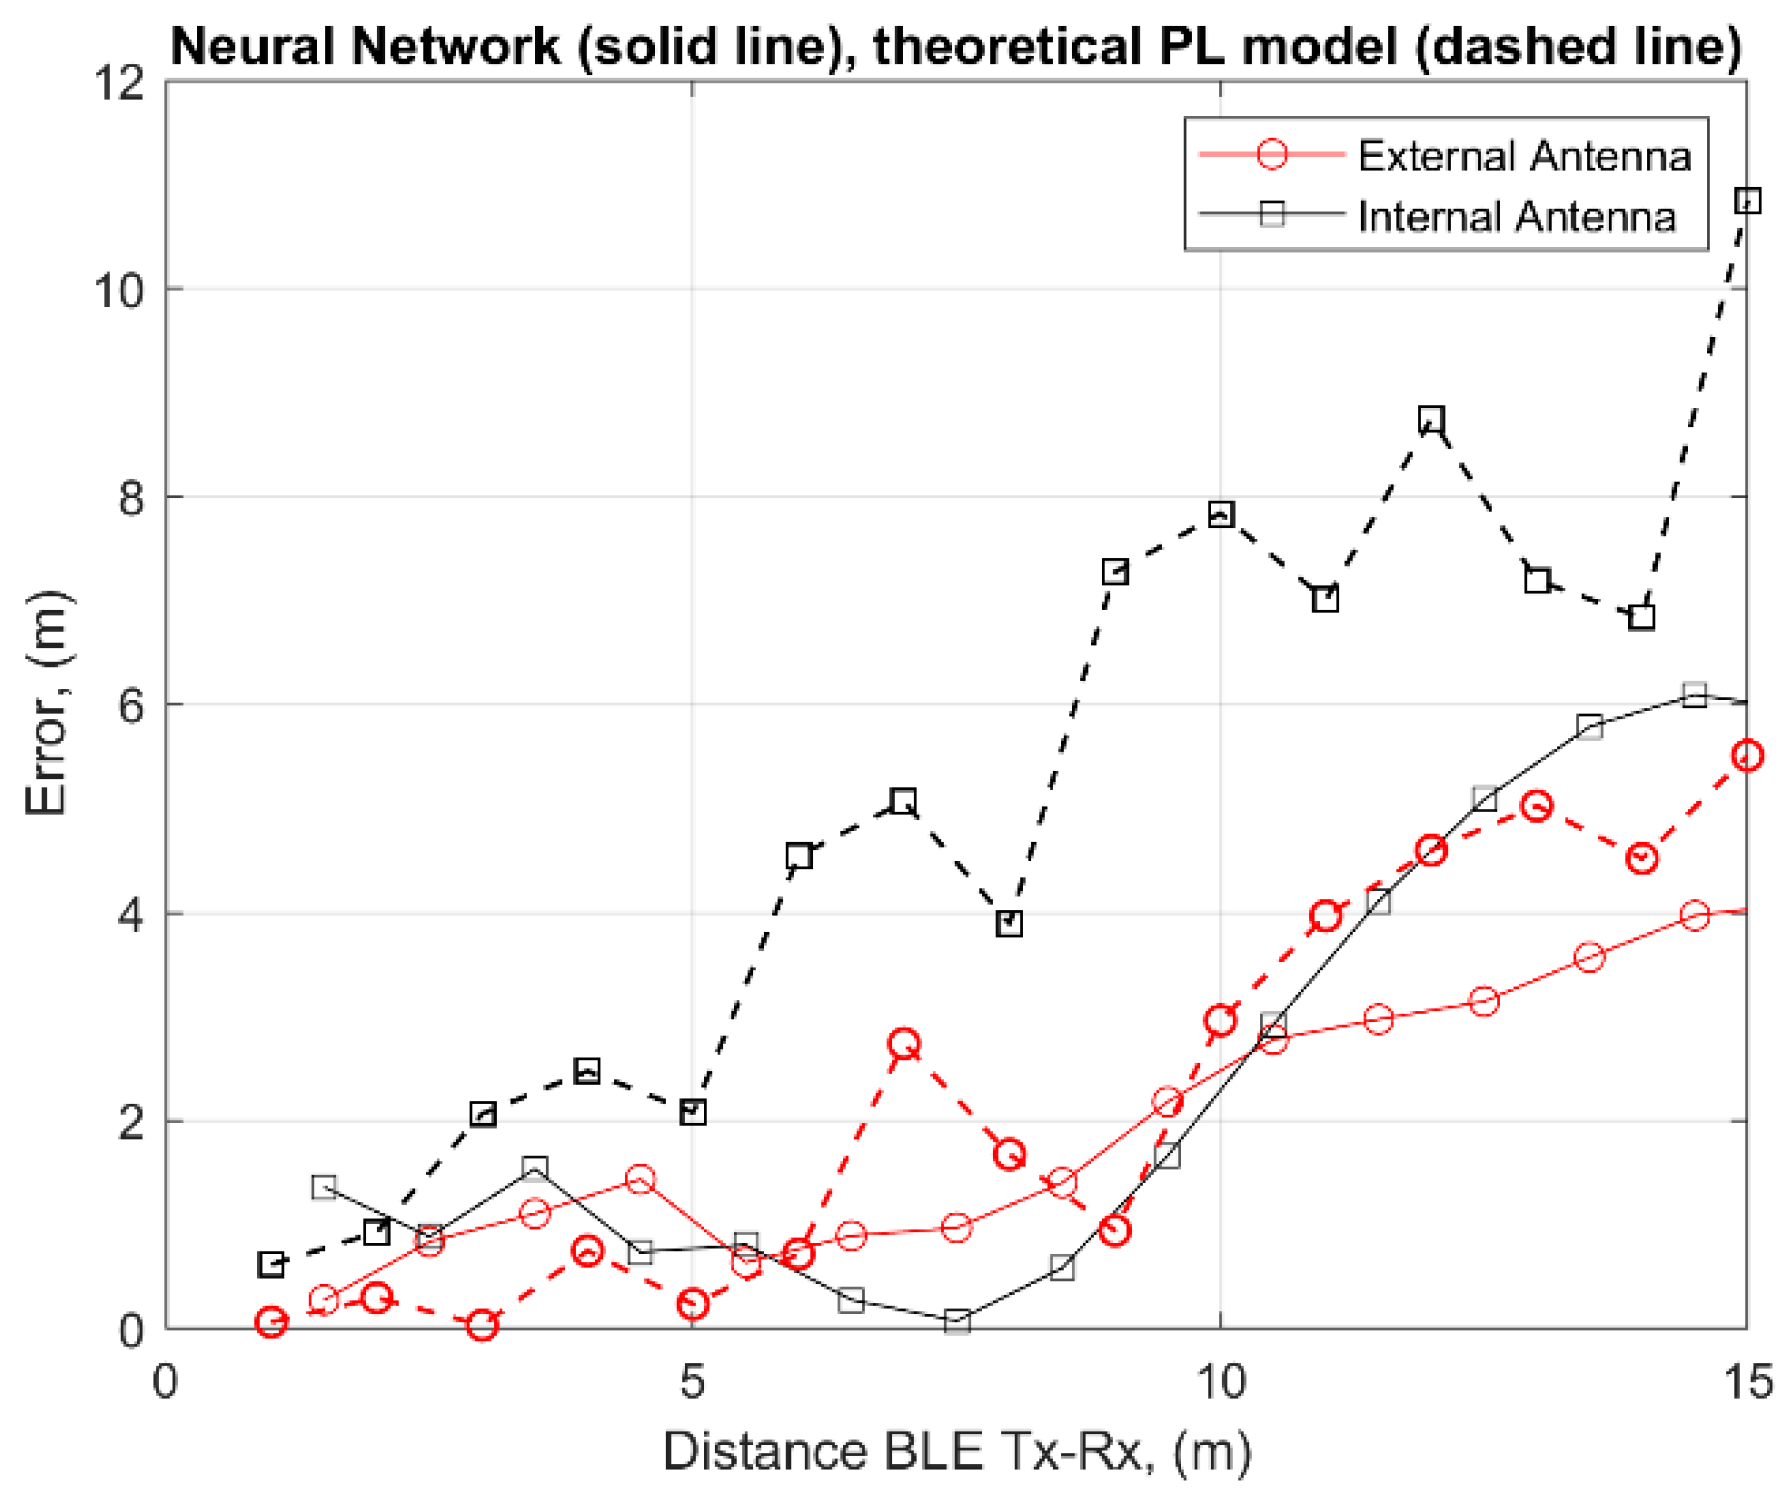
4.4. Neural Network for Distance Estimation
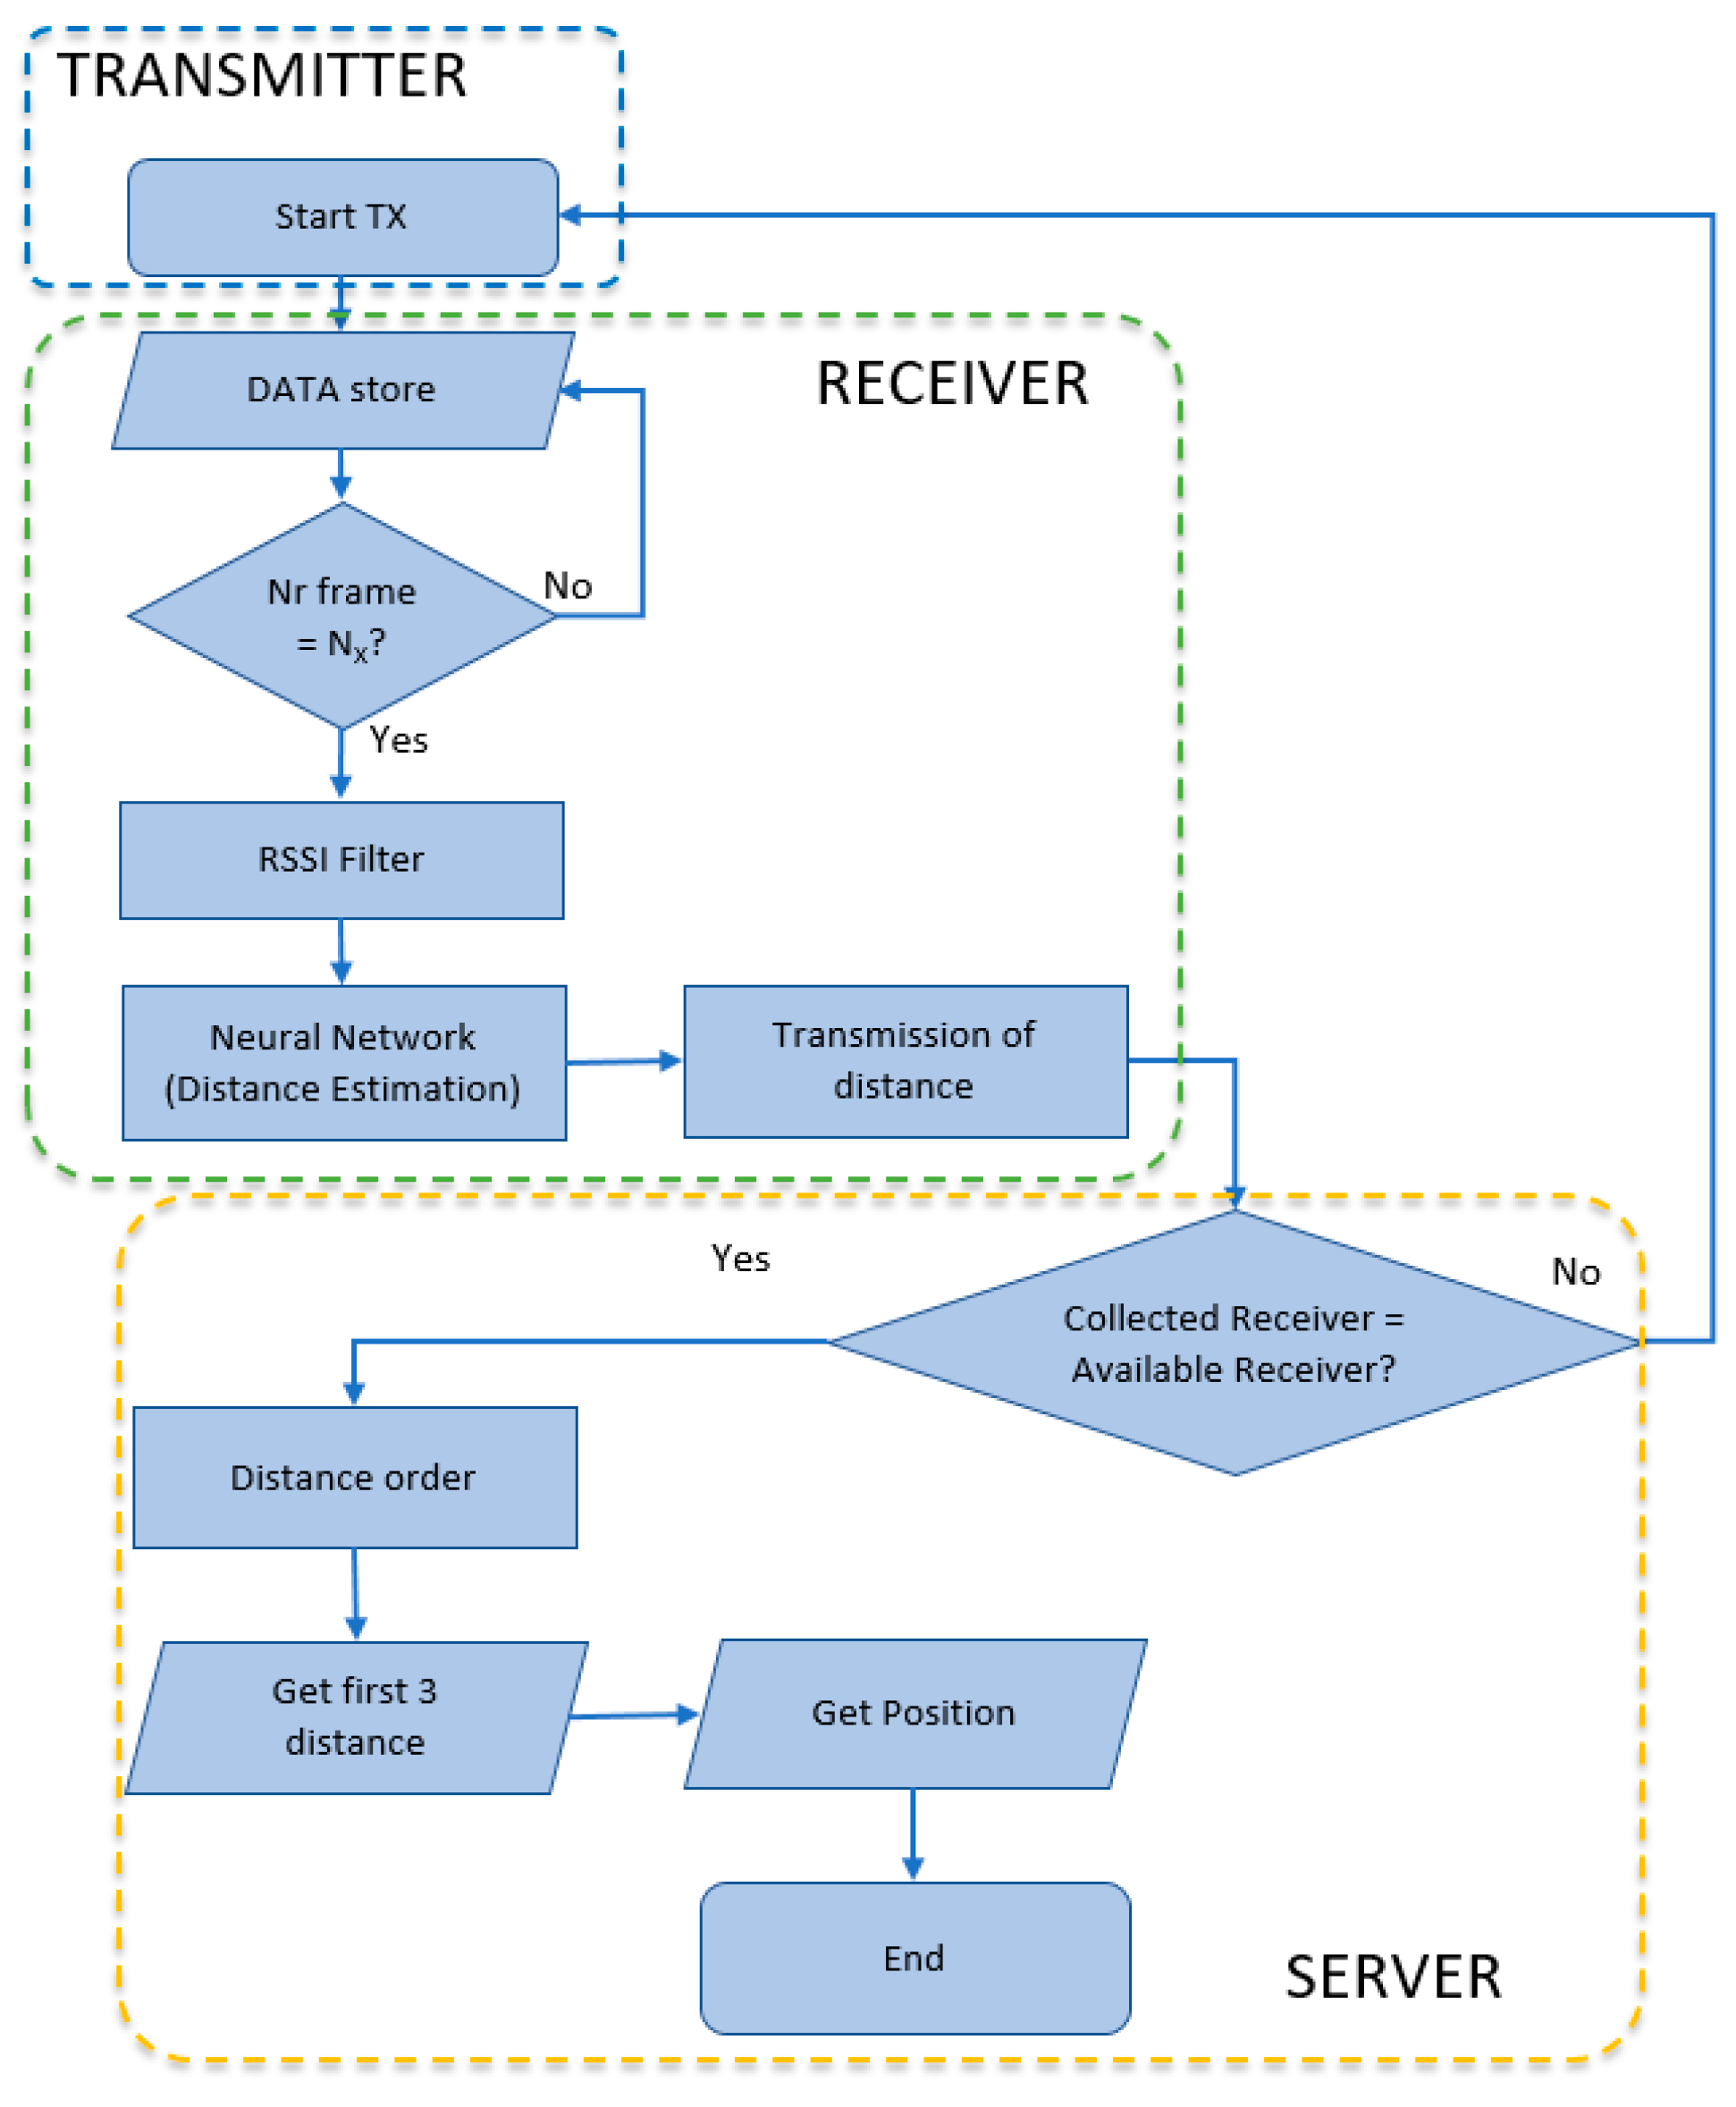
5. Localization Procedure
- The transmitter starts to transmit frames with the set transmission power and the set frequency. This value is fixed (and known by the localizer) in the environment where the localization service is provided.
- For each receiver in the room that receives frames (i.e., the distance between the transmitter and the receiver is such that the SNR is above the threshold), it collects NX = 5 frames (i.e., a measurement set).
- For each measurement set, the receiver filters the data and the neural network estimates the distance between the transmitter and the receiver.
- The receiver sends the pair of estimated distances to the server.
- The localizer in the server sorts the array with the estimated distances and selects the three shortest distances.
- The localizer applies the NLS algorithm to these distances and estimates the position of the transmitter.
6. Experimental Setup
6.1. Performance Evaluation of the Distance Estimator
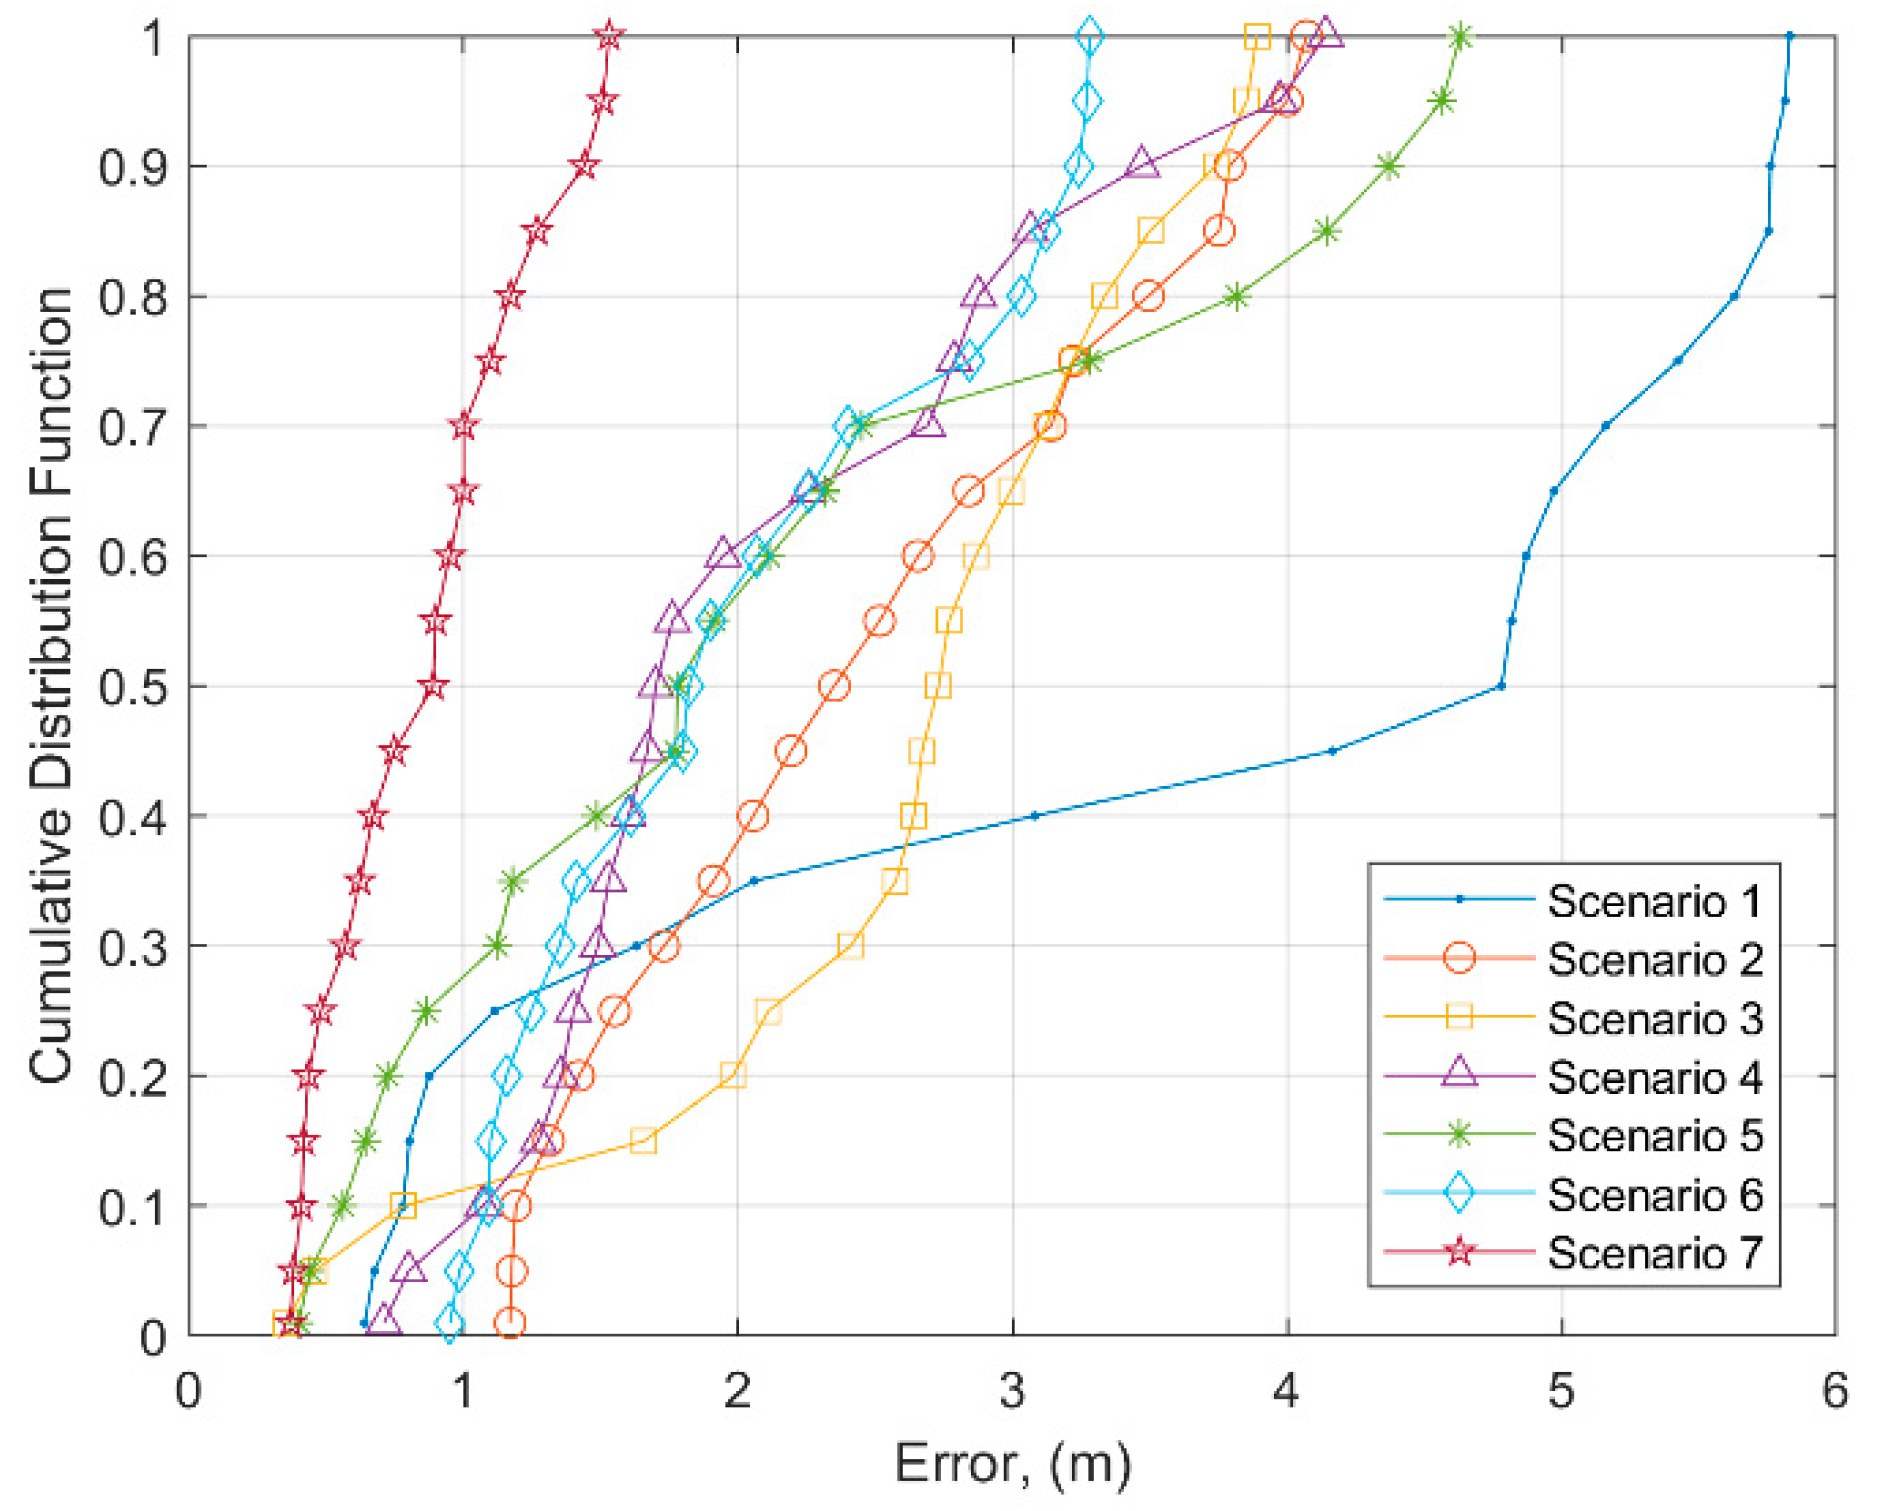
6.2. Deployment of BLE Receivers and Accuracy Evaluation of the Localization Procedure
7. Conclusions
Author Contributions
Funding
Conflicts of Interest
References
- Zafari, F.; Gkelias, A.; Leung, K.K. A Survey of Indoor Localization Systems and Technologies. IEEE Commun. Surv. Tutor. 2019, 21, 2568–2599. [Google Scholar] [CrossRef] [Green Version]
- Raza, U.; Kulkarni, P.; Sooriyabandara, M. Low Power Wide Area Networks: An Overview. IEEE Commun. Surv. Tutor. 2017, 19, 855–873. [Google Scholar] [CrossRef] [Green Version]
- Darroudi, S.M.; Gomez, C. Bluetooth Low Energy Mesh Networks: A Survey. Sensors 2017, 17, 1467. [Google Scholar] [CrossRef] [PubMed] [Green Version]
- Aggarwal, C.; Han, J. A survey of RFID data processing. In Managing and Mining Sensor Data; Springer Science: New York, NY, USA, 2013; pp. 349–382. ISBN 9781461463092. [Google Scholar]
- Ferroni, P.; Zanzotto, F.M.; Riondino, S.; Scarpato, N.; Guadagni, F.; Roselli, M. Breast cancer prognosis using a machine learning approach. Cancers 2019, 11, 328. [Google Scholar] [CrossRef] [Green Version]
- Ferroni, P.; Zanzotto, F.M.; Scarpato, N.; Riondino, S.; Guadagni, F.; Roselli, M. Validation of a machine learning approach for venous thromboembolism risk prediction in oncology. Dis. Markers 2017, 2017, 1–7. [Google Scholar] [CrossRef] [Green Version]
- Matta, M.; Cardarilli, G.C.; Di Nunzio, L.; Fazzolari, R.; Giardino, D.; Nannarelli, A.; Re, M.; Spanò, S. A reinforcement learning based QAM/PSK symbol synchronizer. IEEE Access 2019, 7, 124147–124157. [Google Scholar] [CrossRef]
- Beritelli, F.; Capizzi, G.; Lo Sciuto, G.; Napoli, C.; Woźniak, M. A novel training method to preserve generalization of RBPNN classifiers applied to ECG signals diagnosis. Neural Netw. 2018, 108, 331–338. [Google Scholar] [CrossRef]
- Beritelli, F.; Capizzi, G.; Lo Sciuto, G.; Napoli, C.; Scaglione, F. Rainfall Estimation Based on the Intensity of the Received Signal in a LTE/4G Mobile Terminal by Using a Probabilistic Neural Network. IEEE Access 2018, 6, 30865–30873. [Google Scholar] [CrossRef]
- Luna-Perejón, F.; Domínguez-Morales, M.; Gutiérrez-Galán, D.; Civit-Balcells, A. Low-Power Embedded System for Gait Classification Using Neural Networks. J. Low Power Electron. Appl. 2020, 10, 14. [Google Scholar] [CrossRef]
- Spanò, S.; Cardarilli, G.C.; Di Nunzio, L.; Fazzolari, R.; Giardino, D.; Nannarelli, A.; Matta, M.; Re, M. An Efficient Hardware Implementation of Reinforcement Learning: The Q-Learning Algorithm. IEEE Access 2019, 7, 186340–186351. [Google Scholar]
- Losh, M.; Llamocca, D. A low-power spike-like neural network design. Electron. Switz. 2019, 8, 1479. [Google Scholar] [CrossRef] [Green Version]
- Cardarilli, G.C.; Di Nunzio, L.; Fazzolari, R.; Nannarelli, A.; Re, M.; Spano, S. N-Dimensional Approximation of Euclidean Distance. IEEE Trans. Circuits Syst. Express Briefs 2020, 67, 565–569. [Google Scholar] [CrossRef]
- Giuliano, R.; Mazzenga, F.; Petracca, M.; Vatalaro, F. Application of Radio Frequency Identification for Museum Environment. In Proceedings of the Workshops on Enabling Technologies: Infrastructure for Collaborative Enterprises, Hammamet, Tunisia, 17–20 June 2013; pp. 190–195. [Google Scholar]
- Danis, F.S.; Cemgil, A.T. Model-Based Localization and Tracking Using Bluetooth Low-Energy Beacons. Sensors 2017, 17, 2484. [Google Scholar] [CrossRef] [PubMed] [Green Version]
- Sthapit, P.; Gang, H.; Pyun, J. Bluetooth Based Indoor Positioning Using Machine Learning Algorithms. In Proceedings of the IEEE International Conference on Consumer Electronics, Asia (ICCE-Asia), Jeju, Korea, 24–26 June 2018; pp. 206–212. [Google Scholar] [CrossRef]
- Nurminen, H.; Dashti, M.; Piché, R. A Survey on Wireless Transmitter Localization Using Signal Strength Measurements. Wirel. Commun. Mobile Comput. 2017. [Google Scholar] [CrossRef]
- Chiou, S.-Y.; Liao, Z.-Y. Design and Implementation of Beacon-Based Positioning. J. Inf. Sci. Eng. 2020, 36, 643–658. [Google Scholar] [CrossRef]
- Lohan, E.-S.; Talvitie, J.; Figueiredo De Silva, P.; Nurminen, H.; Ali-Löytty, S.; Piche, R. Received Signal Strength models for WLAN and BLE-based indoor positioning in multi-floor buildings. In Proceedings of the International Conference on Localization and GNSS (ICL-GNSS), Gothenburg, Sweden, 22–24 June 2015. [Google Scholar] [CrossRef]
- Zuo, Z.; Liu, L.; Zhang, L.; Fang, Y. Indoor Positioning Based on Bluetooth Low-Energy Beacons Adopting Graph Optimization. Sensors 2018, 18, 3736. [Google Scholar] [CrossRef] [Green Version]
- Kriz, P.; Maly, F.; Kozel, T. Improving Indoor Localization Using Bluetooth Low Energy Beacons. Mobile Inf. Syst. 2016, 11. [Google Scholar] [CrossRef] [Green Version]
- Ishida, S.; Takashima, Y.; Tagashira, S.; Fukuda, A. Proposal of Separate Channel Fingerprinting Using Bluetooth Low Energy. In Proceedings of the 5th IIAI International Congress on Advanced Applied Informatics (IIAI-AAI), Kumamoto, Japan, 10–14 July 2016; pp. 230–233. [Google Scholar]
- Hoang, M.T.; Yuen, B.; Dong, X.; Lu, T.; Westendorp, R.; Reddy, K. Recurrent Neural Networks for Accurate RSSI Indoor Localization. IEEE Internet Things J. 2019, 6, 10639–10651. [Google Scholar] [CrossRef] [Green Version]
- Mackin, C. Exploration for Range Based Indoor Localization Technologies and Algorithms; Technical Report No. UCB/EECS-2018-109; Electrical Engineering and Computer Sciences University of California: Berkeley, CA, USA, August 2018; Available online: http://www2.eecs.berkeley.edu/Pubs/TechRpts/2018/EECS-2018-109.html (accessed on 9 August 2018).
- Gu, Y.; Lo, A.; Niemegeers, I. A survey of indoor positioning systems for wireless personal networks. IEEE Commun. Surv. Tutor. 2009, 11, 13–32. [Google Scholar] [CrossRef] [Green Version]
- Yang, J.; Li, Y.; Cheng, W. An improved geometric algorithm for indoor localization. Int. J. Distrib. Sens. Netw. 2018, 14, 1–13. [Google Scholar] [CrossRef]
- Mussina, A.; Aubakirov, S. RSSI Based Bluetooth Low Energy Indoor Positioning. In Proceedings of the IEEE 12th International Conference on Application of Information and Communication Technologies (AICT), Almaty, Kazakhstan, 17–19 October 2018; pp. 1–4. [Google Scholar]
- Hillar, C.C. MQTT Essentials—A Lightweight IoT Protocol; Packet Publishing: Birmingham, UK, 2017. [Google Scholar]
- Xu, B.; Zhu, X.; Zhu, H. An Efficient Indoor Localization Method Based on the Long Short-Term Memory Recurrent Neuron Network. IEEE Access 2019, 7, 123912–123921. [Google Scholar] [CrossRef]
- Naghdi, S.; O’Keefe, K. Detecting and Correcting for Human Obstacles in BLE Trilateration Using Artificial Intelligence. Sens. Basel 2020, 20, 1350. [Google Scholar] [CrossRef] [PubMed] [Green Version]
- Dinh, T.T.; Duong, N.; Sandrasegaran, K. Smartphone-based Indoor Positioning Using BLE iBeacon and Reliable Lightweight Fingerprint Map. IEEE Sens. J. 2020. [Google Scholar] [CrossRef]
- Iqbal, Z.; Luo, D.; Henry, P.; Kazemifar, S.; Rozario, T.; Yan, Y.; Westover, K.; Lu, W.; Nguyen, D.; Long, T.; et al. Accurate real time localization tracking in a clinical environment using Bluetooth Low Energy and deep learning. PLoS ONE 2018, 13, e0205392. [Google Scholar] [CrossRef] [PubMed] [Green Version]
- Mazan, F.; Kovarova, A. A Study of Devising Neural Network Based Indoor Localization Using Beacons: First Results. Comput. Inf. Syst. J. 2015, 19, 15–20. [Google Scholar]
- Tsitsipa, V.; Achillias, G.; Parthenios, P. Using big data to design user-centric museums. From visitors loyal to museums to museums loyal to users. In Proceedings of the Education and Research in Computer Aided Architectural Design in europe (eCAADe), Łódź, Poland, 19–21 September 2018. [Google Scholar]
- Bluetooth Smart or Version 4.0+ of the Bluetooth Specification. Available online: bluetooth.com (accessed on 10 March 2017).
- Hernández-Rojas, D.L.; Fernández-Caramés, T.M.; Fraga-Lamas, P.; Escudero, C.J. Design and Practical Evaluation of a Family of Lightweight Protocols for Heterogeneous Sensing through BLE Beacons in IoT Telemetry Applications. Sensors 2018, 18, 57. [Google Scholar] [CrossRef] [Green Version]
- Espressif Systems, ESP32-WROOM-32D & ESP32-WROOM-32U Datasheet v1.9. Available online: https://www.espressif.com/sites/default/files/documentation/esp32-wroom-32d_esp32-wroom-32u_datasheet_en.pdf. (accessed on 9 June 2020).
- SR Passives, Wi-Fi—Ant 410-1. Available online: https://www.tme.eu/Document/c80a7d27e7324afe40b4ab4d29f42817/WIFI-ANT410-1.pdf (accessed on 9 June 2020).
- Goldoni, E.; Savioli, A.; Risi, M.; Gamba, P. Experimental analysis of RSSI-based indoor localization with IEEE 802.15.4. In Proceedings of the European Wireless Conference (EW), Lucca, Italy, 12–15 April 2010; pp. 71–77. [Google Scholar]
- Capizzi, G.; Coco, S.; Lo Sciuto, G.; Napoli, C. A New Iterative FIR Filter Design Approach Using a Gaussian Approximation. IEEE Signal. Process. Lett. 2018, 25, 1615–1619. [Google Scholar] [CrossRef]
- Murphy, W.S.; Hereman, W. Determination of a Position in Three Dimensions Using Trilateration and Approximated Distances; Technical Report MCS-95-07; Colorado School of Mines: Golden, CO, USA, October 1995; pp. 1–19. Available online: https://inside.mines.edu/~whereman/papers/Murphy-Hereman-Trilateration-MCS-07-1995.pdf (accessed on 9 June 2020).


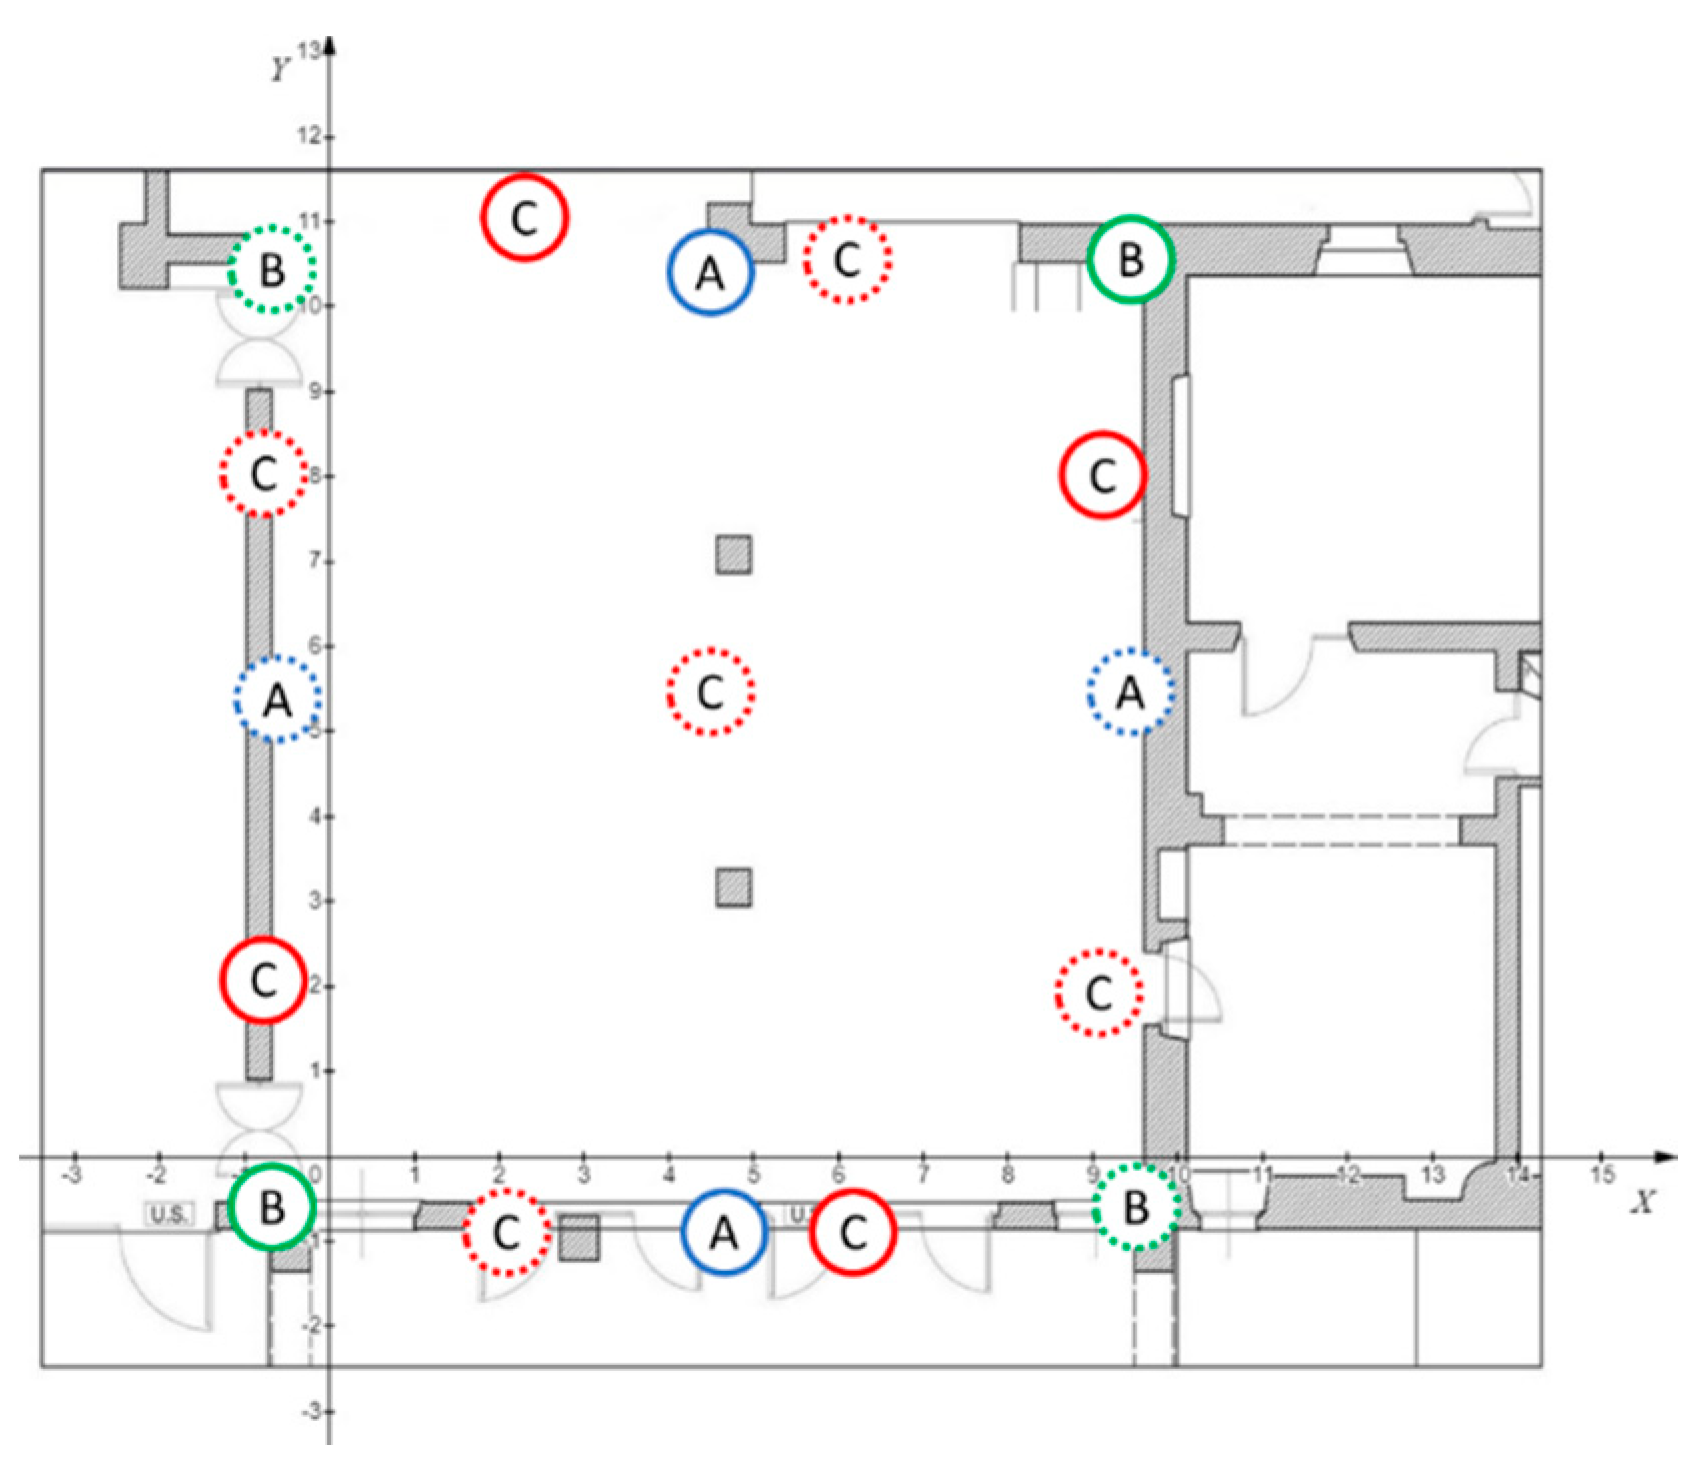
| Scenario | Receiver Position | Receiver Type |
|---|---|---|
| Scenario 1 | BLE receivers located in positions A | Four receivers with external antenna |
| Scenario 2 | BLE receivers located in positions A | Four receivers with internal antenna |
| Scenario 3 | BLE receivers located in positions B | Four receivers with external antenna |
| Scenario 4 | BLE receivers located in positions B | Four receivers with internal antenna |
| Scenario 5 | BLE receivers located in positions A | Two receivers with internal antenna (dashed) |
| Two receivers with external antenna (solid) | ||
| Scenario 6 | BLE receivers located in positions B | Two receivers with internal antenna (dashed) |
| Two receivers with external antenna (solid) | ||
| Scenario 7 | BLE receivers located in positions C | Five receivers with internal antenna (dashed) |
| Four receivers with external antenna (solid) |
| Scen. 1 | Scen. 2 | Scen. 3 | Scen. 4 | Scen. 5 | Scen. 6 | Scen. 7 | |||
|---|---|---|---|---|---|---|---|---|---|
| Test nr | Xreal | Yreal | Error (m) | Error (m) | Error (m) | Error (m) | Error (m) | Error (m) | Error (m) |
| 1 | 1 | 7 | 5.75 | 1.73 | 2.63 | 0.71 | 4.07 | 1.79 | 1.00 |
| 2 | 2 | 2 | 5.51 | 3.74 | 1.95 | 4.14 | 1.77 | 1.82 | 0.41 |
| 3 | 2 | 8 | 4.91 | 2.74 | 2.73 | 1.70 | 4.63 | 2.40 | 0.37 |
| 4 | 3 | 2 | 0.81 | 4.07 | 3.74 | 2.93 | 0.40 | 3.28 | 0.70 |
| 5 | 3 | 3 | 5.76 | 1.97 | 0.35 | 1.49 | 0.67 | 1.35 | 1.21 |
| 6 | 3 | 4 | 4.78 | 1.19 | 2.01 | 1.66 | 1.20 | 1.10 | 1.00 |
| 7 | 4 | 6 | 0.94 | 1.17 | 2.95 | 2.11 | 1.96 | 0.95 | 1.53 |
| 8 | 4 | 8 | 0.64 | 3.14 | 3.89 | 1.54 | 2.27 | 3.24 | 0.45 |
| 9 | 1 | 4 | 1.63 | 1.49 | 3.12 | 1.07 | 0.56 | 1.93 | 1.13 |
| 10 | 2 | 5 | 3.96 | 1.35 | 3.42 | 1.78 | 1.12 | 1.21 | 0.64 |
| 11 | 2 | 7 | 5.16 | 2.57 | 2.65 | 2.69 | 4.37 | 2.21 | 0.89 |
| 12 | 3 | 9 | 5.83 | 3.79 | 2.41 | 1.34 | 3.56 | 3.08 | 0.90 |
| 13 | 4 | 3 | 4.83 | 2.14 | 3.25 | 1.37 | 0.78 | 1.09 | 1.44 |
| 14 | 5 | 8 | 0.78 | 3.25 | 2.78 | 2.82 | 1.78 | 2.99 | 0.42 |
| 15 | 5 | 4 | 2.20 | 2.35 | 0.78 | 3.47 | 2.45 | 1.43 | 0.57 |
| Avg. error (m) | 3.57 | 2.45 | 2.58 | 2.05 | 2.11 | 1.99 | 0.84 | ||
| Error Std Dev. (m) | 2.11 | 0.98 | 0.99 | 0.96 | 1.43 | 0.83 | 0.38 | ||
| Nr. | Xreal | Yreal | Xestimated | Yestimated | Error (m) | Avg. Error 33% Obstruction (m) | Avg. Error 66% Obstruction (m) |
|---|---|---|---|---|---|---|---|
| 1 | 1 | 7 | 1.83 | 7.56 | 1.00 | 2.54 | 2.47 |
| 2 | 2 | 2 | 2.04 | 2.41 | 0.41 | 0.86 | 1.57 |
| 3 | 2 | 8 | 2.21 | 7.7 | 0.37 | 2.65 | 2.49 |
| 4 | 3 | 2 | 2.74 | 2.65 | 0.70 | 2.62 | 2.29 |
| 5 | 3 | 3 | 1.96 | 3.62 | 1.21 | 1.81 | 1.80 |
| 6 | 3 | 4 | 3.53 | 3.15 | 1.00 | 0.60 | 0.91 |
| 7 | 4 | 6 | 2.72 | 6.83 | 1.53 | 0.66 | 1.27 |
| 8 | 4 | 8 | 4.26 | 8.37 | 0.45 | 0.83 | 1.79 |
| 9 | 1 | 4 | 1.78 | 4.82 | 1.13 | 2.01 | 2.31 |
| 10 | 2 | 5 | 2.12 | 5.63 | 0.64 | 1.19 | 1.34 |
| 11 | 2 | 7 | 2.28 | 7.85 | 0.89 | 1.58 | 1.76 |
| 12 | 3 | 9 | 2.82 | 8.12 | 0.90 | 2.09 | 1.92 |
| 13 | 4 | 3 | 2.6 | 2.67 | 1.44 | 2.76 | 2.97 |
| 14 | 5 | 8 | 4.69 | 8.29 | 0.42 | 0.58 | 1.09 |
| 15 | 5 | 4 | 5.12 | 4.56 | 0.57 | 0.97 | 1.66 |
| Avg. error (m) | 0.84 | 1.58 | 1.84 | ||||
| Error Std Dev. (m) | 0.38 | 0.82 | 0.58 | ||||
© 2020 by the authors. Licensee MDPI, Basel, Switzerland. This article is an open access article distributed under the terms and conditions of the Creative Commons Attribution (CC BY) license (http://creativecommons.org/licenses/by/4.0/).
Share and Cite
Giuliano, R.; Cardarilli, G.C.; Cesarini, C.; Di Nunzio, L.; Fallucchi, F.; Fazzolari, R.; Mazzenga, F.; Re, M.; Vizzarri, A. Indoor Localization System Based on Bluetooth Low Energy for Museum Applications. Electronics 2020, 9, 1055. https://doi.org/10.3390/electronics9061055
Giuliano R, Cardarilli GC, Cesarini C, Di Nunzio L, Fallucchi F, Fazzolari R, Mazzenga F, Re M, Vizzarri A. Indoor Localization System Based on Bluetooth Low Energy for Museum Applications. Electronics. 2020; 9(6):1055. https://doi.org/10.3390/electronics9061055
Chicago/Turabian StyleGiuliano, Romeo, Gian Carlo Cardarilli, Carlo Cesarini, Luca Di Nunzio, Francesca Fallucchi, Rocco Fazzolari, Franco Mazzenga, Marco Re, and Alessandro Vizzarri. 2020. "Indoor Localization System Based on Bluetooth Low Energy for Museum Applications" Electronics 9, no. 6: 1055. https://doi.org/10.3390/electronics9061055