Article

Classification of the Relative Position between the Third Molar and the Inferior Alveolar Nerve Using a Convolutional Neural Network Based on Transfer Learning

1
Department of Electronic Engineering, Chung Yuan Christian University, Taoyuan City 320317, Taiwan
2
Department of General Dentistry, Chang Gung Memorial Hospital, Taoyuan City 33305, Taiwan
3
Department of Program on Semiconductor Manufacturing Technology, Academy of Innovative Semiconductor and Sustainable Manufacturing, National Cheng Kung University, Tainan City 701, Taiwan
4
Department of Information Management, Chung Yuan Christian University, Taoyuan City 320317, Taiwan
5
Department of Electrical Engineering, Ming Chi University of Technology, New Taipei City 243303, Taiwan
6
Department of Electronic Engineering, Feng Chia University, Taichung 40724, Taiwan
*
Authors to whom correspondence should be addressed.
Electronics 2024, 13(4), 702; https://doi.org/10.3390/electronics13040702
Submission received: 13 November 2023 / Revised: 25 January 2024 / Accepted: 6 February 2024 / Published: 9 February 2024
(This article belongs to the Special Issue Revolutionizing Medical Image Analysis with Deep Learning)

Abstract

:
In recent years, there has been a significant increase in collaboration between medical imaging and artificial intelligence technology. The use of automated techniques for detecting medical symptoms has become increasingly prevalent. However, there has been a lack of research on the relationship between impacted teeth and the inferior alveolar nerve (IAN) in DPR images. The severe compression of teeth against the IAN may necessitate the requirement for nerve canal treatment. To reduce the occurrence of such events, this study aims to develop an auxiliary detection system capable of precisely locating the relative positions of the IAN and impacted teeth through object detection and image enhancement. This system is designed to shorten the duration of examinations for dentists while concurrently mitigating the chances of diagnostic errors. The innovations in this research are as follows: (1) using YOLO_v4 to identify impacted teeth and the IAN in DPR images achieves an accuracy of 88%. However, the developed algorithm in this study achieves an accuracy of 93%. (2) Image enhancement is utilized in this study to expand the dataset, with an accuracy of up to 2~3% enhancement in detecting diseases. (3) The segmentation technique proposed in this study surpasses previous methods by achieving 6% higher accuracy in dental diagnosis.

1. Introduction

In the era of artificial intelligence (AI) technologies, remarkable advancements have continuously reshaped our lifestyles and work patterns. These innovations have become increasingly pervasive, particularly within the healthcare domain, where the fusion of medicine and AI is a prominent paradigm. With the global populace experiencing a rise in age, escalating burdens associated with chronic illnesses, and frequently constrained healthcare resources, these represent ubiquitous predicaments confronting healthcare systems worldwide. Nonetheless, the rapid advancement of technology offers sanguine prospects. Novelties such as wearable apparatuses [1], telemedicine [2], extensive-scale databases [3], and decision-making driven by industrial artificial intelligence (IAI) [4] have augmented the efficiency of healthcare practitioners. These works have also laid the groundwork for potentially metamorphosing the entire healthcare field. Utilizing these technologies, health statuses can be systematically assessed and skillfully managed. Diseases can be predicted in advance, and tailored medical interventions can be offered. This means that while using advanced AI technologies, it is possible to foresee or anticipate illnesses before they fully develop. Additionally, specific and personalized medical treatments or interventions can be provided based on this early prediction.
AI models can meticulously dissect MRI images to ascertain the orientation of targets under diverse clinical scenarios. It can obviate the necessity for supplementary manual annotations or calibration methodologies [5]. The deployment of AI technology empowers physicians to attain a more profound comprehension of medical afflictions. This technology assists in preventing the onset of diseases and formulating more effective treatment methods. This amplifies the caliber of patient care and augments the prospects of diminishing healthcare outlays and enhancing healthcare accessibility.
In the contemporary field of dentistry, numerous studies have embraced the integration of digital technologies. Technologies such as cone beam computed tomography (CBCT) imaging [6], surgical guides [7], robotic navigation systems for surgery [8], and even the incorporation of AI in surgery [9] have collectively optimized dental procedures, rendering them more comprehensive and precise. Traditionally, digital panoramic radiography (DPR) has been used to image periodontal conditions and take manual impressions, a process prone to human error. However, with the digitization of dentistry, AI modeling has expedited the production of surgical and prosthodontic components while enhancing the accuracy of data acquisition. The improvement in efficiency and quality provides clinicians more time for patient care. Furthermore, periapical (PA) image is utilized as an adjunct diagnostic tool, particularly in the assessment of conditions such as apical lesions [10], implants [11], and furcation involvement [12]. DPR images refer to extraoral radiographs [13], typically encompassing all teeth alongside adjacent skeletal structures and nerves, providing two-dimensional information about dental and maxillofacial osseous anatomy. Research pertaining to DPR images has encompassed a range of applications, including tooth localization [14], multi-symptom assessment on DPR images [15], and prosthesis classification [16], among others. DPR images offer substantial advantages in localization and classification. In clinical practice, panoramic radiographs are commonly utilized to assess the contact status between the mandibular third molar and the inferior alveolar nerve, as well as to evaluate the depth of the mandibular third molar and its proximity to the mandibular ramus. Should suspicions arise regarding contact between the inferior alveolar nerve and the mandibular third molar post-panoramic screening, a computed tomography (CT) scan is employed to further identify cortical bone defects surrounding the inferior alveolar nerve [17]. However, due to the significant increase in patient costs and radiation exposure associated with CT scans [18], CT is not a routine examination method. Consequently, the accurate assessment capability of panoramic radiographs in determining true contact relationships, avoiding misinterpretation issues, and thereby reducing the frequency of CT usage is of paramount importance. In a previous study [19], a classifier was introduced to discern the relationship between the inferior alveolar nerve and impacted teeth on DPR images, ultimately achieving an accuracy of 79.5% and a mean average precision (mAP) of 0.885.
In the fields of medical imaging and oral surgical procedures, precise localization and identification of anatomical structures are of paramount importance. This is particularly evident when dealing with impacted teeth. Dentists must have a clear understanding of the patient’s oral condition before performing oral surgical procedures, especially for the precise positioning of the teeth and their proximity to the inferior alveolar nerve. Accurate positioning and identification not only contribute to surgical success but also reduce patient risk and discomfort. One such scenario involves impacted third molars, commonly known as wisdom teeth, which fail to erupt normally due to insufficient space in the jawbone [20]. The affected lower wisdom teeth may still be partially covered by soft tissue and unable to grow normally, as shown in Figure 1. The mandibular third molar may result in complications such as cysts and tumors [21], which can lead to nerve injuries, given the proximity of the lower third molars to the inferior alveolar nerve. Therefore, accurate knowledge of the location of the impacted tooth and its relative proximity to the inferior alveolar nerve (IAN) becomes critical during impacted tooth extraction surgery. In recent years, the development of computer vision and deep learning technologies has provided new avenues for addressing this challenge, including the application of techniques such as YOLO [22], Faster R-CNN [23], and image preprocessing algorithms. The integration of these techniques allows for accurate identification of the distance between the impacted tooth and the inferior alveolar nerve. It helps reduce potential nerve damage and improves the efficiency and safety of oral surgery.
This study introduces an assisted detection algorithm combining object recognition and object detection, utilizing YOLO_V4 and a referenced cropping algorithm [24] to pinpoint the position between the impacted teeth and the inferior alveolar nerve. Image enhancement [25] is employed to augment pathological features for improved CNN training accuracy. Various CNN models, including AlexNet [26], GoogLeNet [27], and Inception_v3 [28], are utilized for object recognition, and their results are validated using a Fuzzy voting system [29], ensuring data reliability. This approach automates the segmentation of dental panoramic radiographs to ascertain overlap between impacted teeth and the inferior alveolar nerve, streamlining dental procedures while minimizing errors.
This research aims to address the following research questions:
  • YOLO_v4 achieves an accuracy of 88% in identifying impacted teeth and the inferior alveolar nerve, while the developed algorithm attains a superior 93% accuracy value.
  • The development of image enhancement techniques enhances disease detection accuracy by 2–3% in dental disease identification.
  • The segmentation technique proposed in this study surpasses previous methods by achieving 6% higher accuracy in dental diagnosis.

2. Materials and Methods

The primary objective of this study is to utilize image processing alongside AI models to identify the relative positions of impacted teeth and the inferior alveolar nerve (IAN) within DPR images. The flowchart of this study is depicted in Figure 2 and consists of three stages: tooth segmentation, image enhancement, and CNN training. Tooth segmentation aims to identify the images of impacted teeth and the IAN. This stage uses algorithmic image segmentation, and YOLO_V4 object recognition to locate pathological positions. Image enhancement methods are employed to highlight the relative positions of the IAN and impacted teeth. Medical X-ray images for this study were not readily available, so a database augmentation technique was used to expand the image database. The training of a CNN model is an effective approach for object classification, and further enhancements can be achieved by fine-tuning hyperparameters and optimizing the model. It determines whether the images containing impacted teeth overlap with the IAN and outputs the result if the model training accuracy is over 90%.

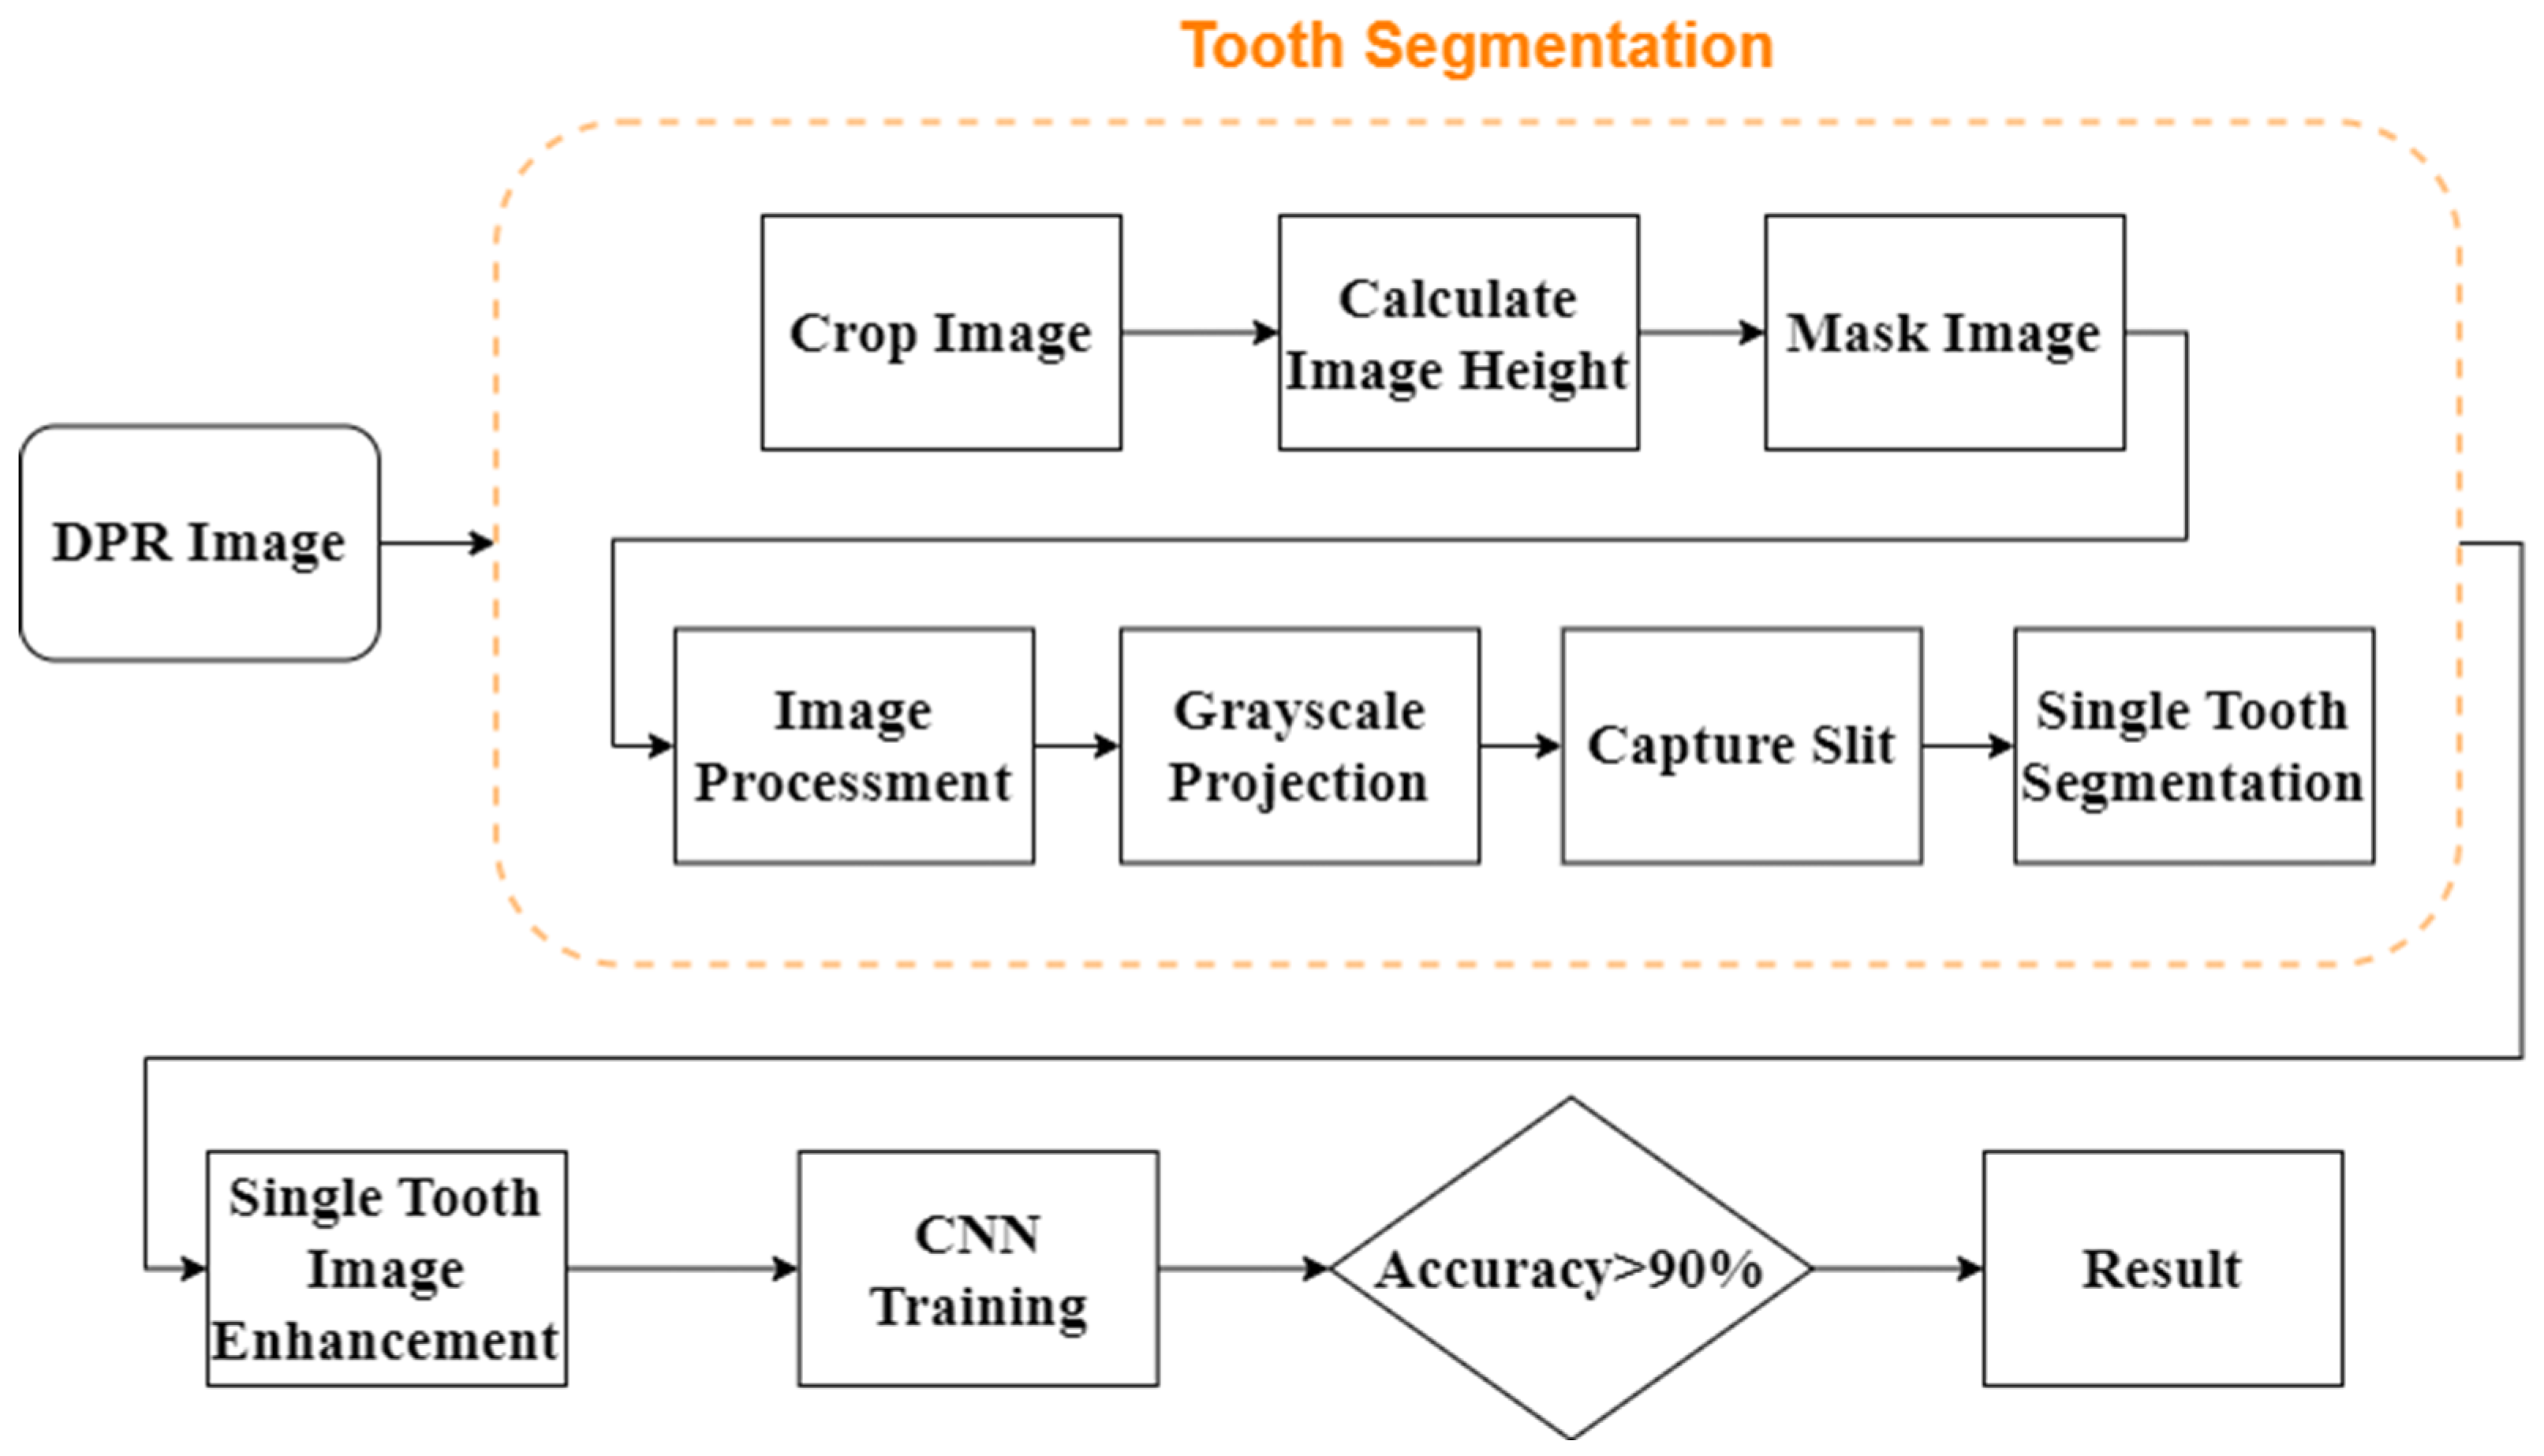
2.1. Tooth Segmentation

This study proposes methods for upper and lower jaw segmentation. The segmentation methods include image resizing, region cropping, and partial masking. These methods better highlight the upper and lower jaw areas for further easy identification and assessment. The DPR images utilized in this study have inconsistent sizes, so the original images are resized to ensure they have a consistent target size of 1540 × 2816. The resized image helps eliminate variability caused by differences in DPR image sizes. Next, region cropping is applied to extract the upper and lower jaw regions from the entire image. Specific rows and columns are selected to encompass the regions of interest, as shown in Figure 3a.
After database analysis and statistics, all of the DPR images used in this study were resized to the same size, and the lower row of teeth was, in all cases, located below 70% of the vertical position of the DPR image. Therefore, this study uses image masking technology to retain the lower row of the DPR image and use this area as the basis for image segmentation, where pixel values outside the mask are set to 255 (white), while pixel values within the mask remain unchanged (original image). This process preserves pixels within the masked area while masking out pixels outside the mask. This effectively improves the visibility of the upper and lower jaw areas. Applying this mask to the original image yields a masked version, which is used for lower teeth segmentation. This method significantly identified the upper and lower jaw regions, as shown in Figure 3b.
A.
Grayscale image
The color space of the DPR images is in RGB format. However, the images in RGB format are not conducive for subsequent processing. To streamline the image processing work, in this study, we converted these images into grayscale images. This conversion allows the study to focus solely on the grayscale luminance values of the images, eliminating the need to process each of the three RGB channels separately. This approach simplifies the representation of all pixel points in the images, which can be located using only the x and y-axis coordinates. This not only streamlines the image processing process but also enhances overall work efficiency.
B.
Gaussian high-pass filter
The major challenge in symptom analysis is the presence of noise points in the images. Therefore, it is crucial to apply filtering techniques to reduce this undesirable noise information. There are various types of filters available in existing technologies, and selecting the most suitable one is a critical decision. A variant of this filter is known as the Gaussian low-pass filter, which is used to reduce specific types of noise. Another variant, the Gaussian high-pass filter, is used to enhance dark areas in the image and accentuate details. The Gaussian high-pass filter is also a common technique employed for image enhancement and feature extraction. In the case of emphasizing the characteristics of the tooth edge, the Gaussian high-pass filter is the most suitable choice [30]; the formula is shown in (1), where D0 is the cut-off frequency and D(u,v) is the distance from the center of the frequency rectangle. When D0 is larger, the smoothness is better. This filter effectively reduces low-frequency components in the image. Consequently, this high-frequency information is preserved in the processed image, as shown in Figure 4.
H u , v = e D 2 ( u , v ) 2 D 0 2
C.
Contrast Stretching
Contrast stretching is a widely used technique in image processing [
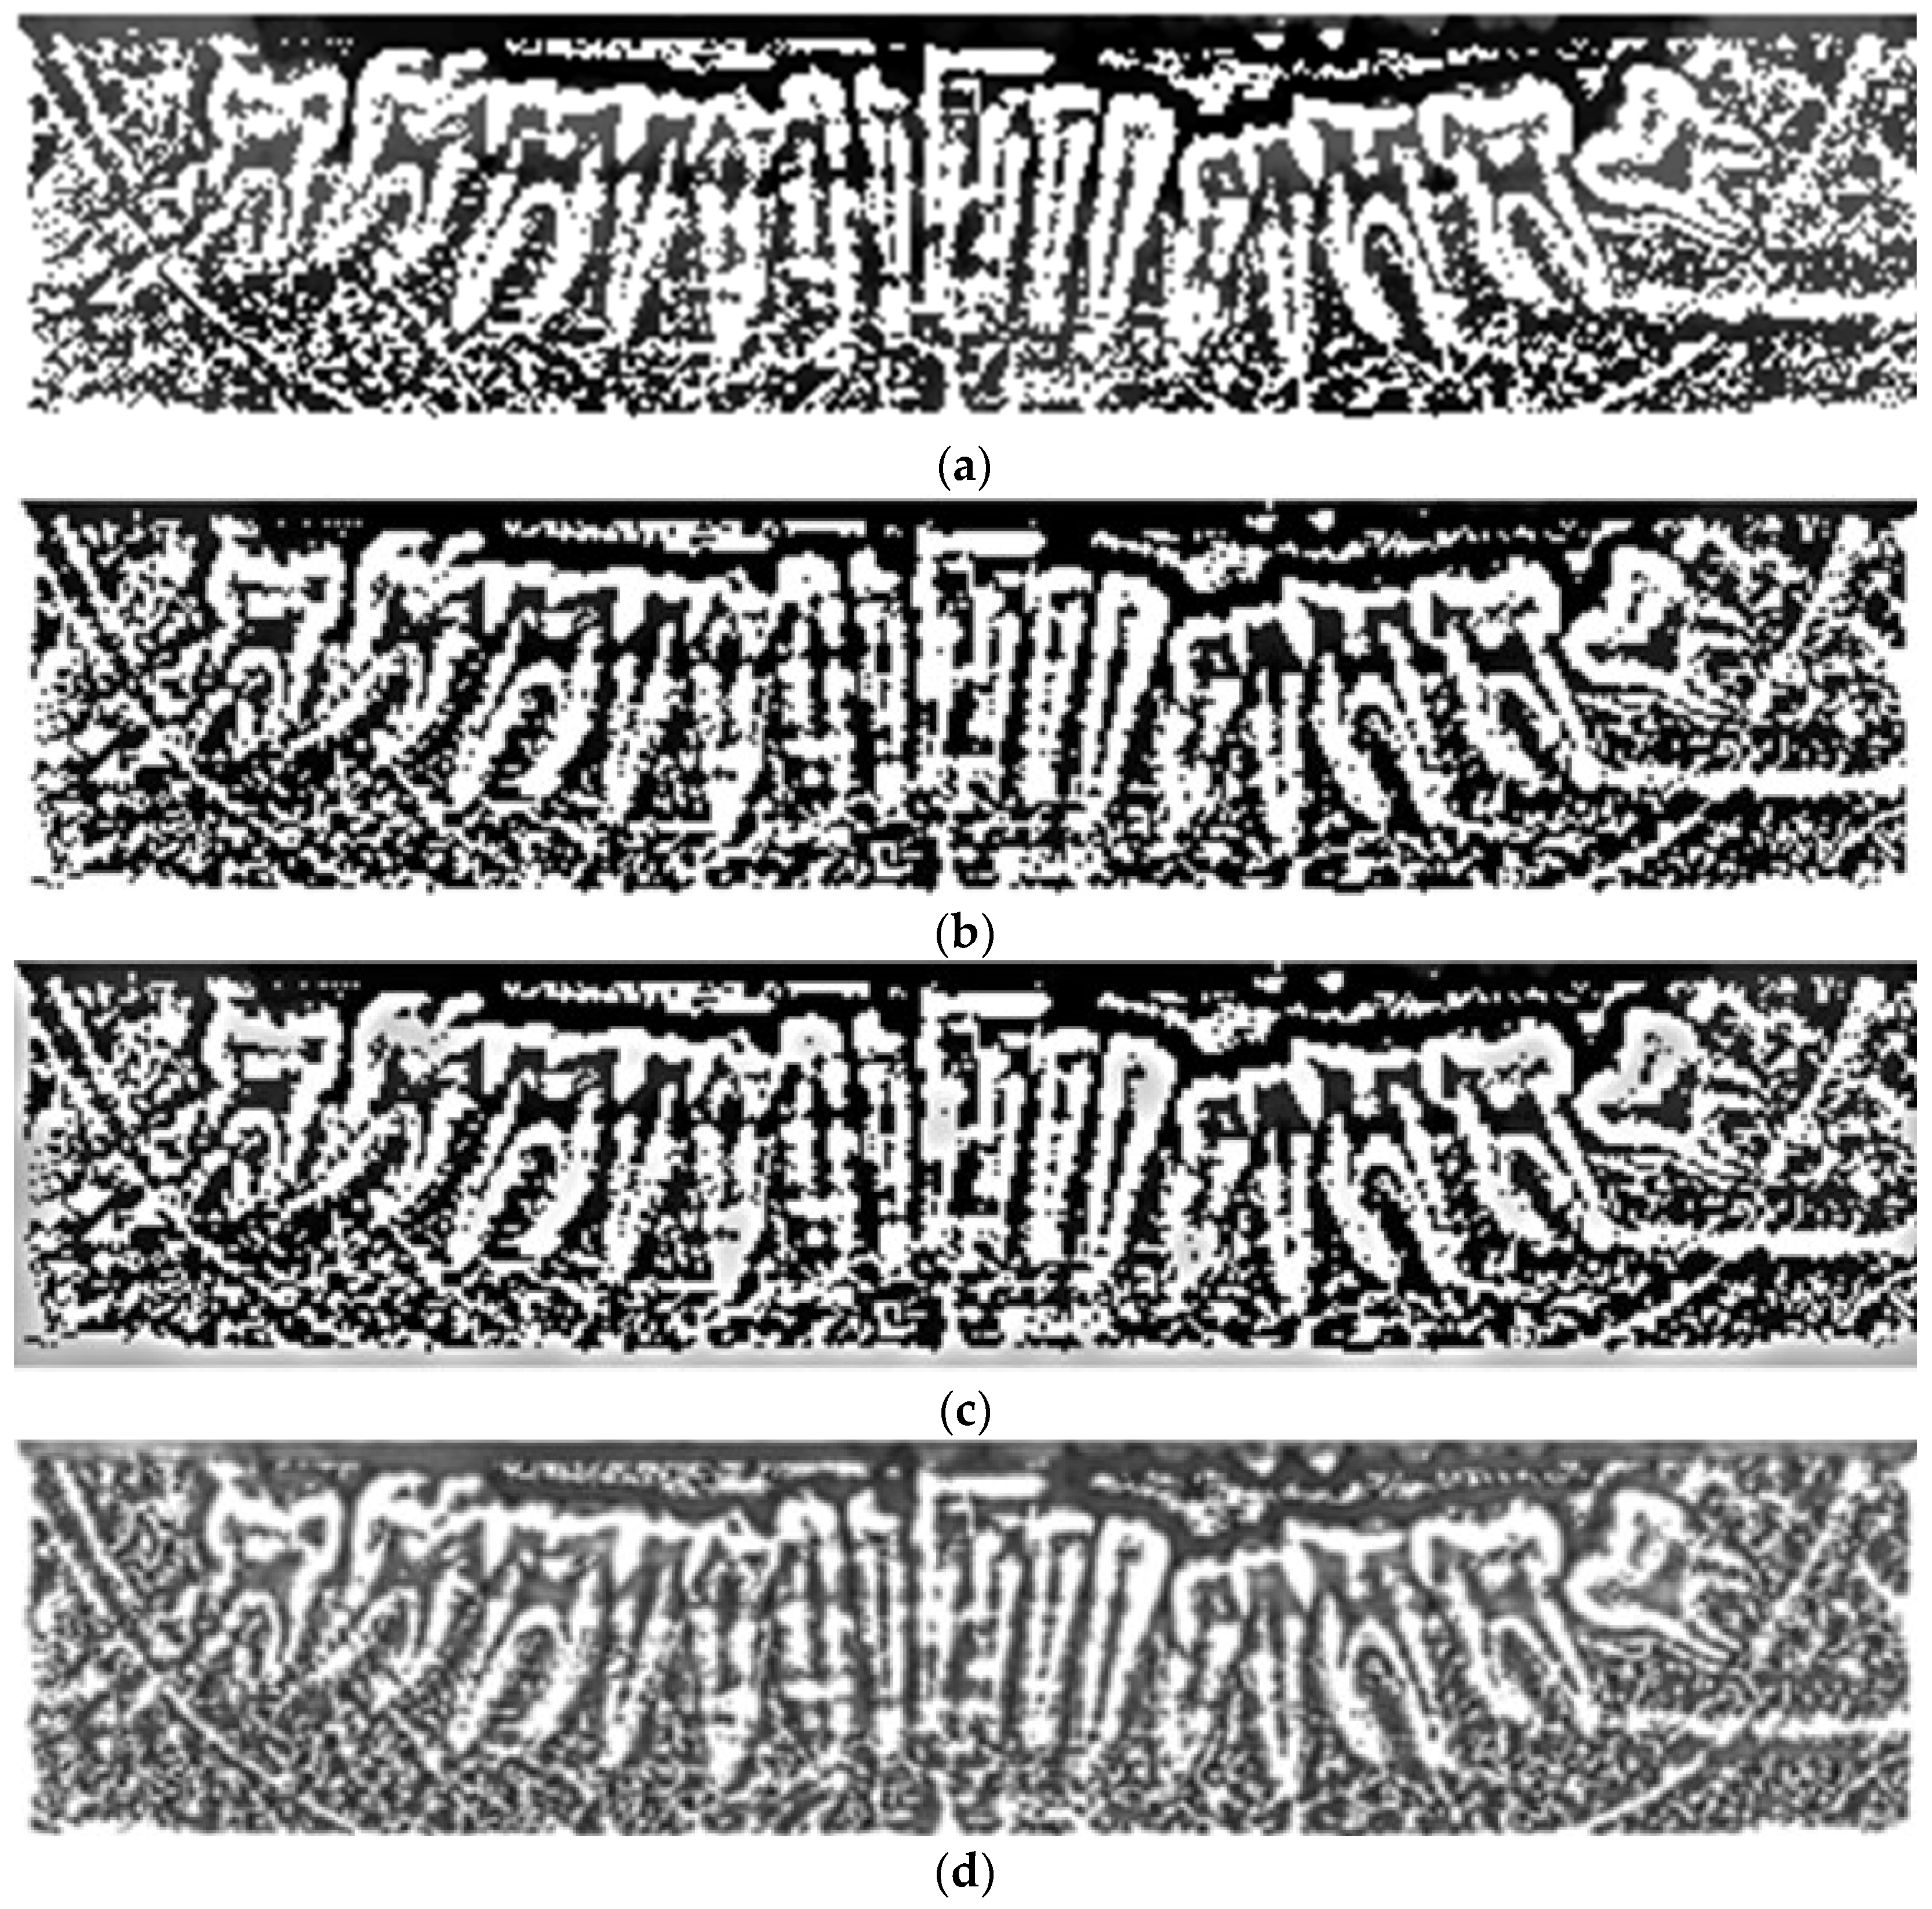
31]. It can increase contrast by expanding the brightness distribution of the image. The goal of contrast stretching is to highlight features by increasing image contrast. Contrast enhancement is achieved using histogram equalization, a method that redistributes the brightness levels of an image. It makes the brightness levels in the image more uniformly distributed, thus increasing contrast, as shown in Figure 5a. The square balancing technique is applied to enhance the differences between brightness levels. The squared image is then subjected to min–max normalization, mapping pixel values to the range of 0 to 255 for display purposes, as shown in Figure 5b.
Flat field correction is used to mitigate uneven brightness points in an image, ensuring that pixel values tend to be uniform. This correction helps eliminate differences in brightness caused by uneven illumination. Flat field correction is applied to the squared balanced image to improve image quality, as shown in Figure 5c. The flat field correction formula is as follows (2): where C represents the corrected image, R is the original image, F is the flat field image, D is the dark field or dark frame, and m is the average value of (FD). The images of F and D are based on adaptive histogram equalization adjustment parameters and are processed if they are lower than the adaptive threshold. If the threshold is lower than the threshold, it will be classified as a dark field, otherwise, it will be classified as a flat field. It can adjust region brightness and contrast in different areas of the image. Parameters are set to ensure that adaptive histogram equalization preserves details and avoids over-enhancement, as shown in Figure 5d.
C = R D × m F D
D.
Binarization
Binarization is the conversion of a grayscale image into a binary image [
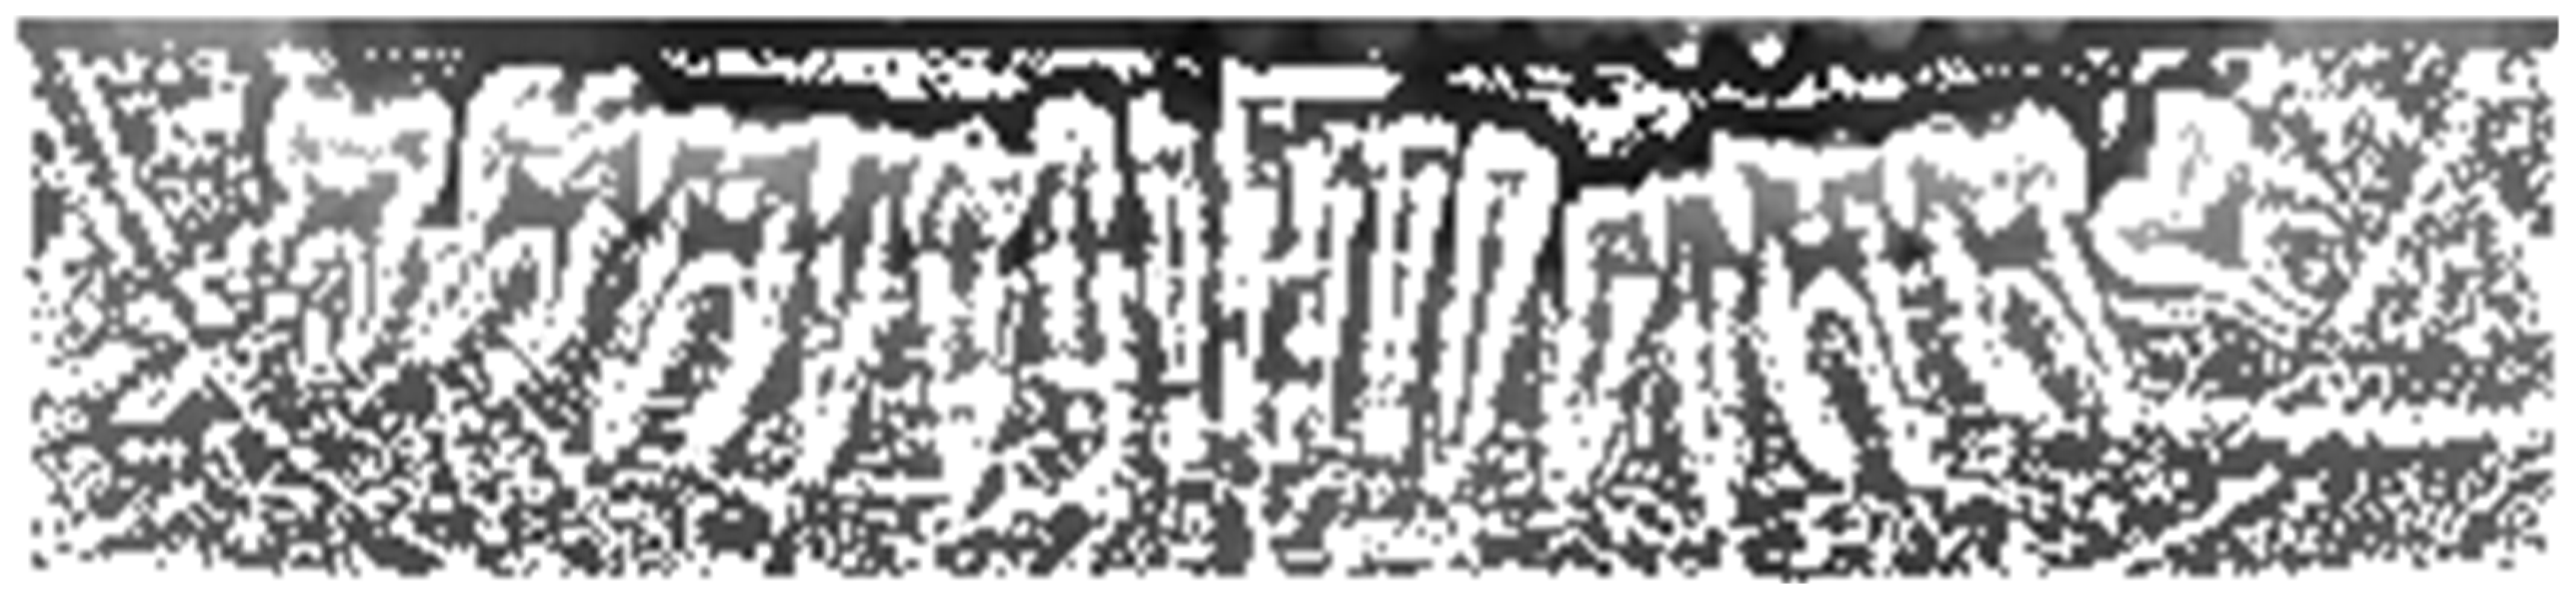
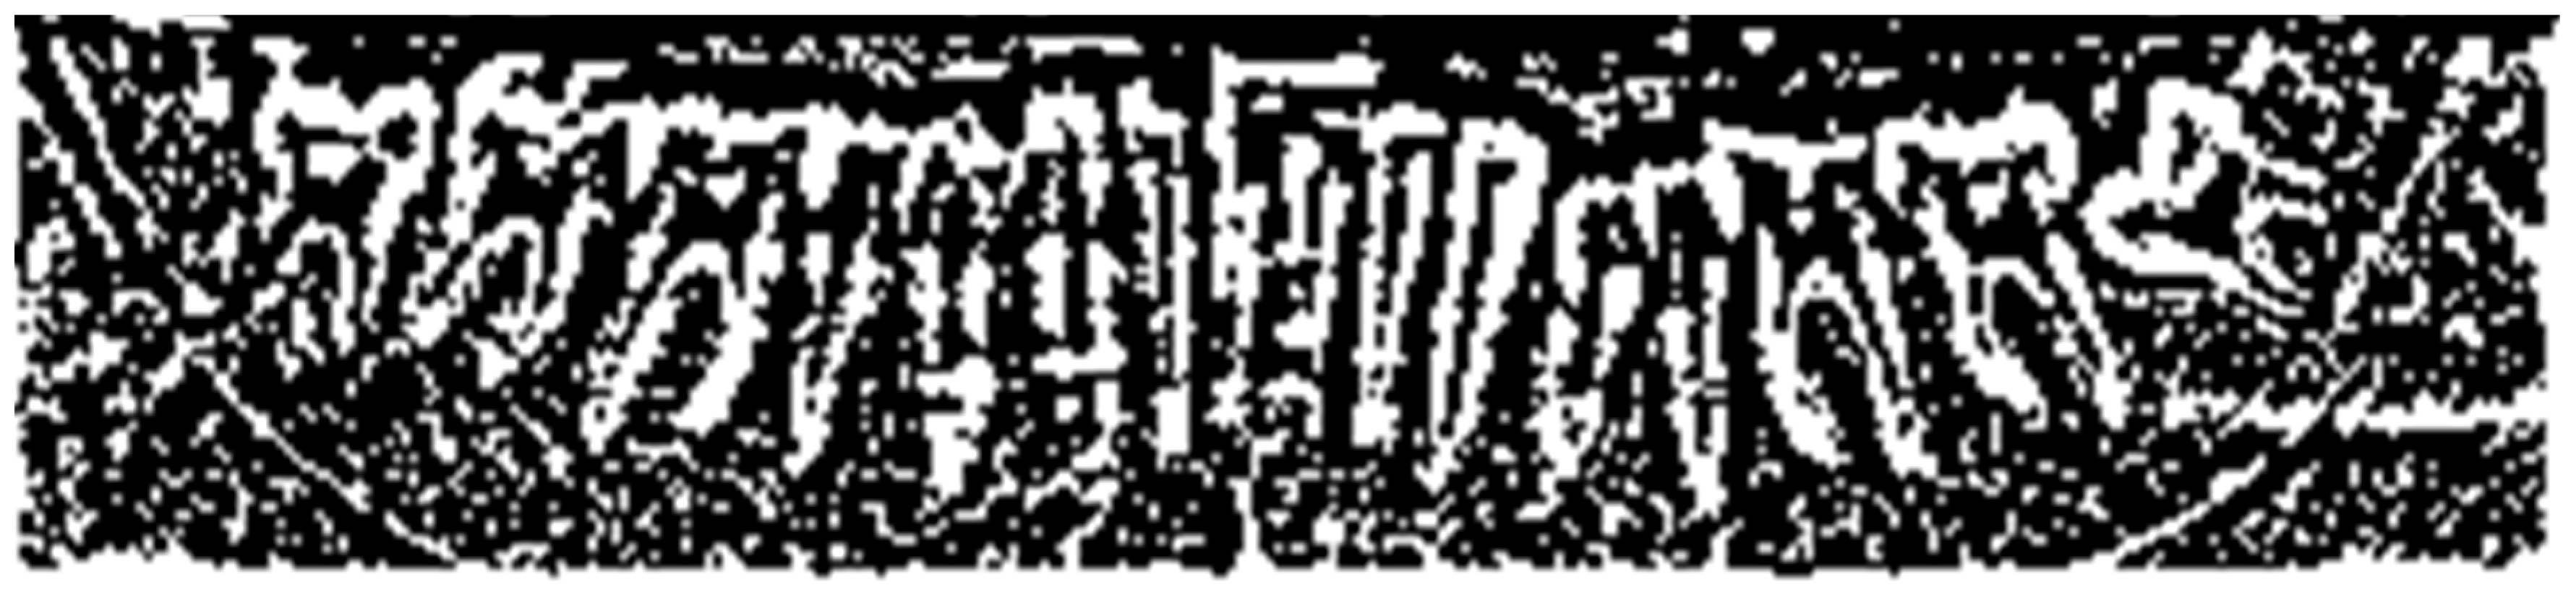
32], which contains only two pixel values, typically black and white. This transformation highlights the objects of interest in the image, facilitating subsequent analysis and processing. This study adopts a widely used image binarization method known as Otsu’s method. This method relies on an automatically selected threshold that categorizes the pixels in the image into the foreground (the target objects) and the background (everything else). Otsu’s method effectively accomplishes the conversion of an image into a binary image and performs admirably in various scenarios, as shown in Figure 6.
E.
Morphological operations
Morphological operations primarily deal with the shape, structure, and geometric features of objects [33]. These operations enable various enhancements, segmentations, and analyses of images by altering the morphology of objects. Morphological operations are based on a structuring element and a set of operations, including dilation, erosion, opening, and closing, among others. The opening operation formula is as follows (3): A is the original image, B is the structural element image, and the set A is opened by the structural element B, which means that the result of A being eroded by B is then expanded by 
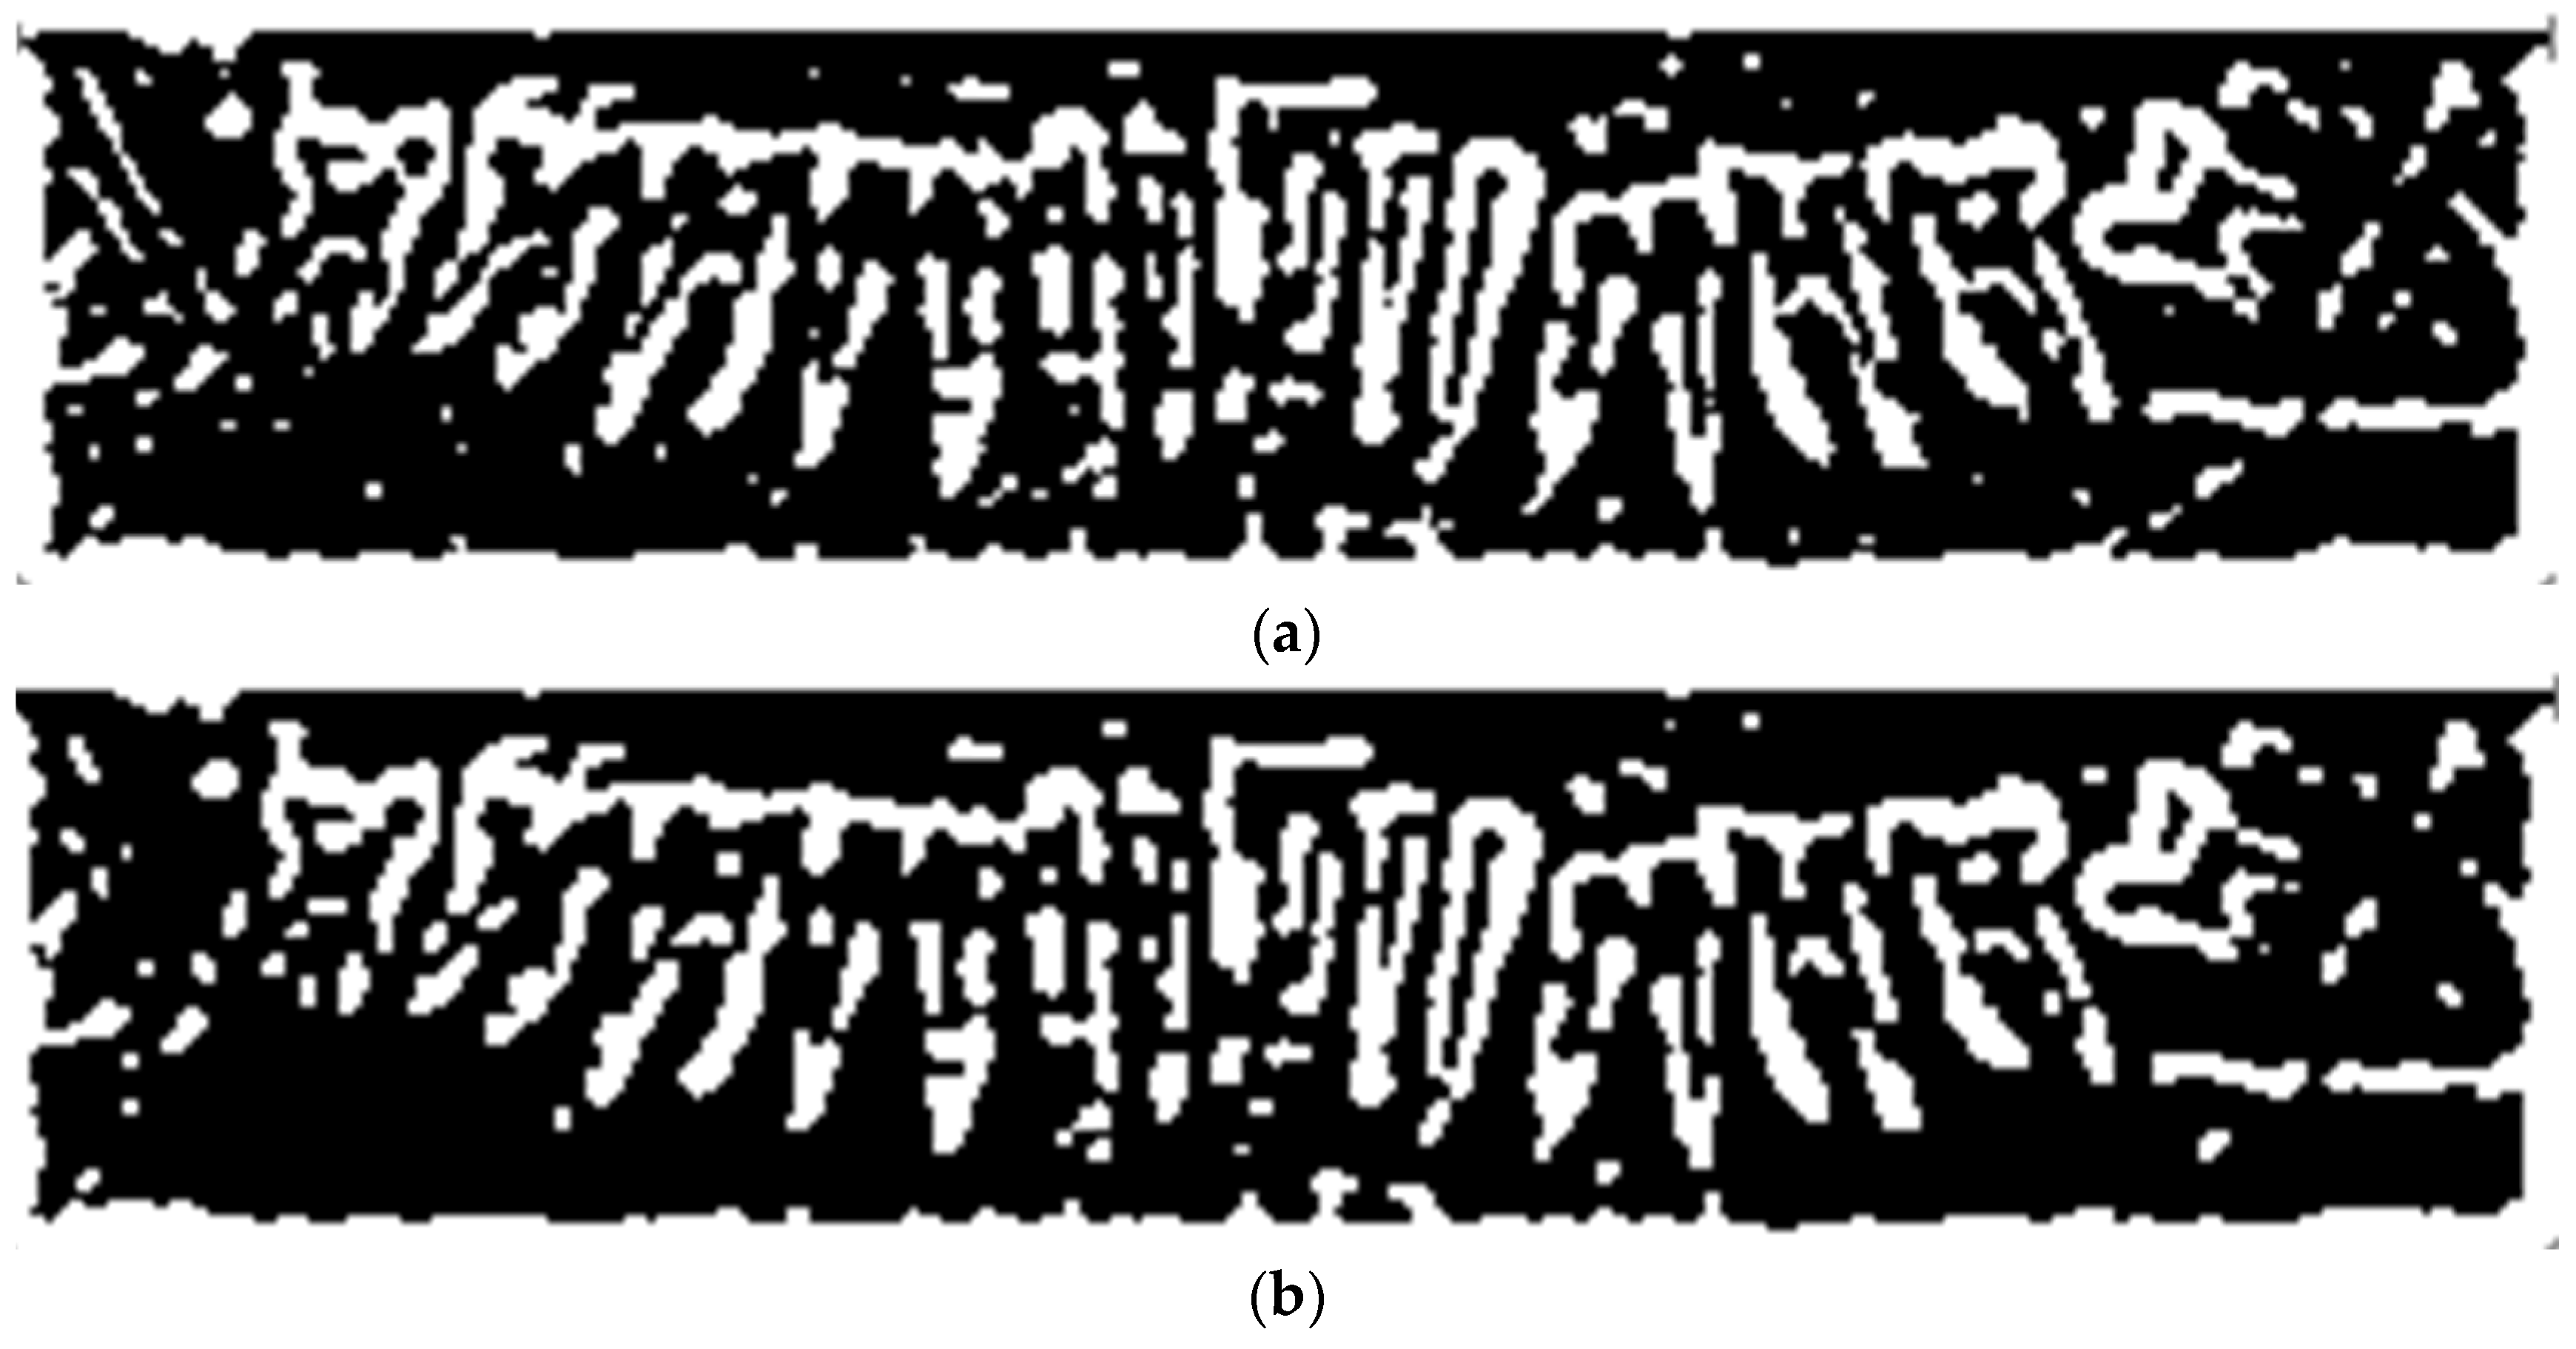
B. In this study, the image is first subjected to median filtering to reduce noise, as shown in Figure 7a. An opening operation is applied to smooth the image and remove unnecessary information, as shown in Figure 7b.
A B = ( A B ) B
F.
Vertical Grayscale Projection Algorithm
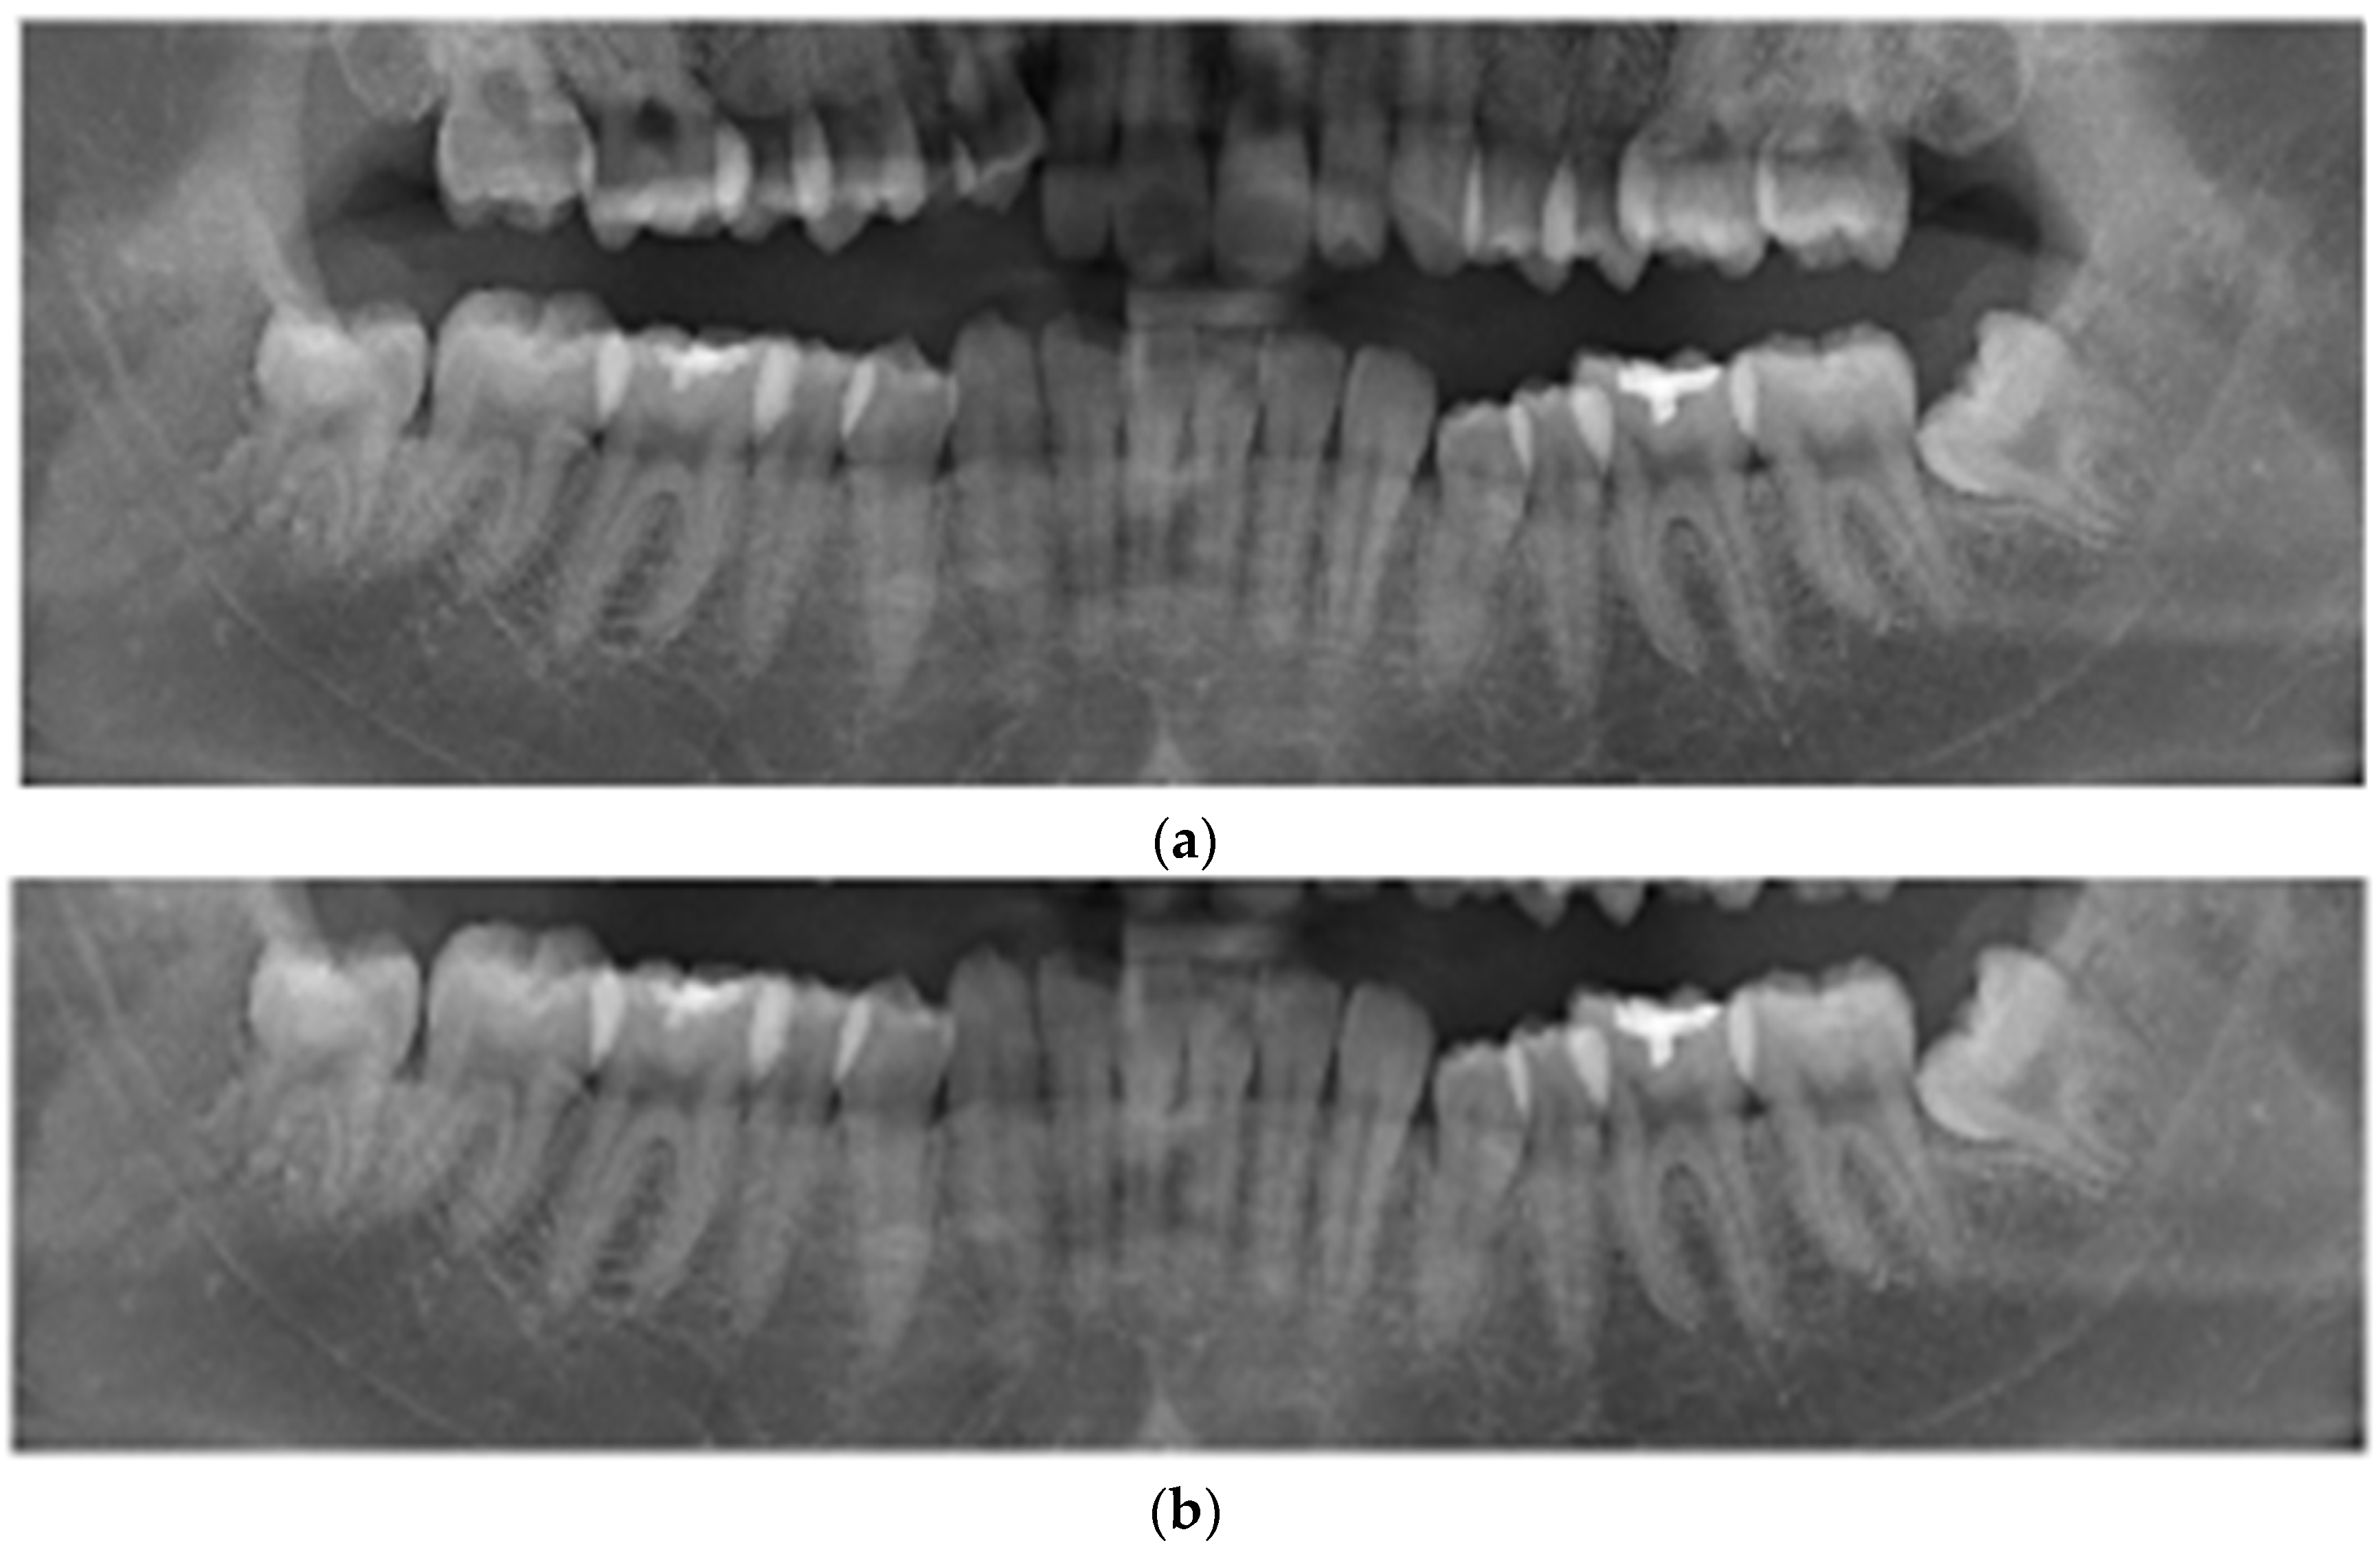
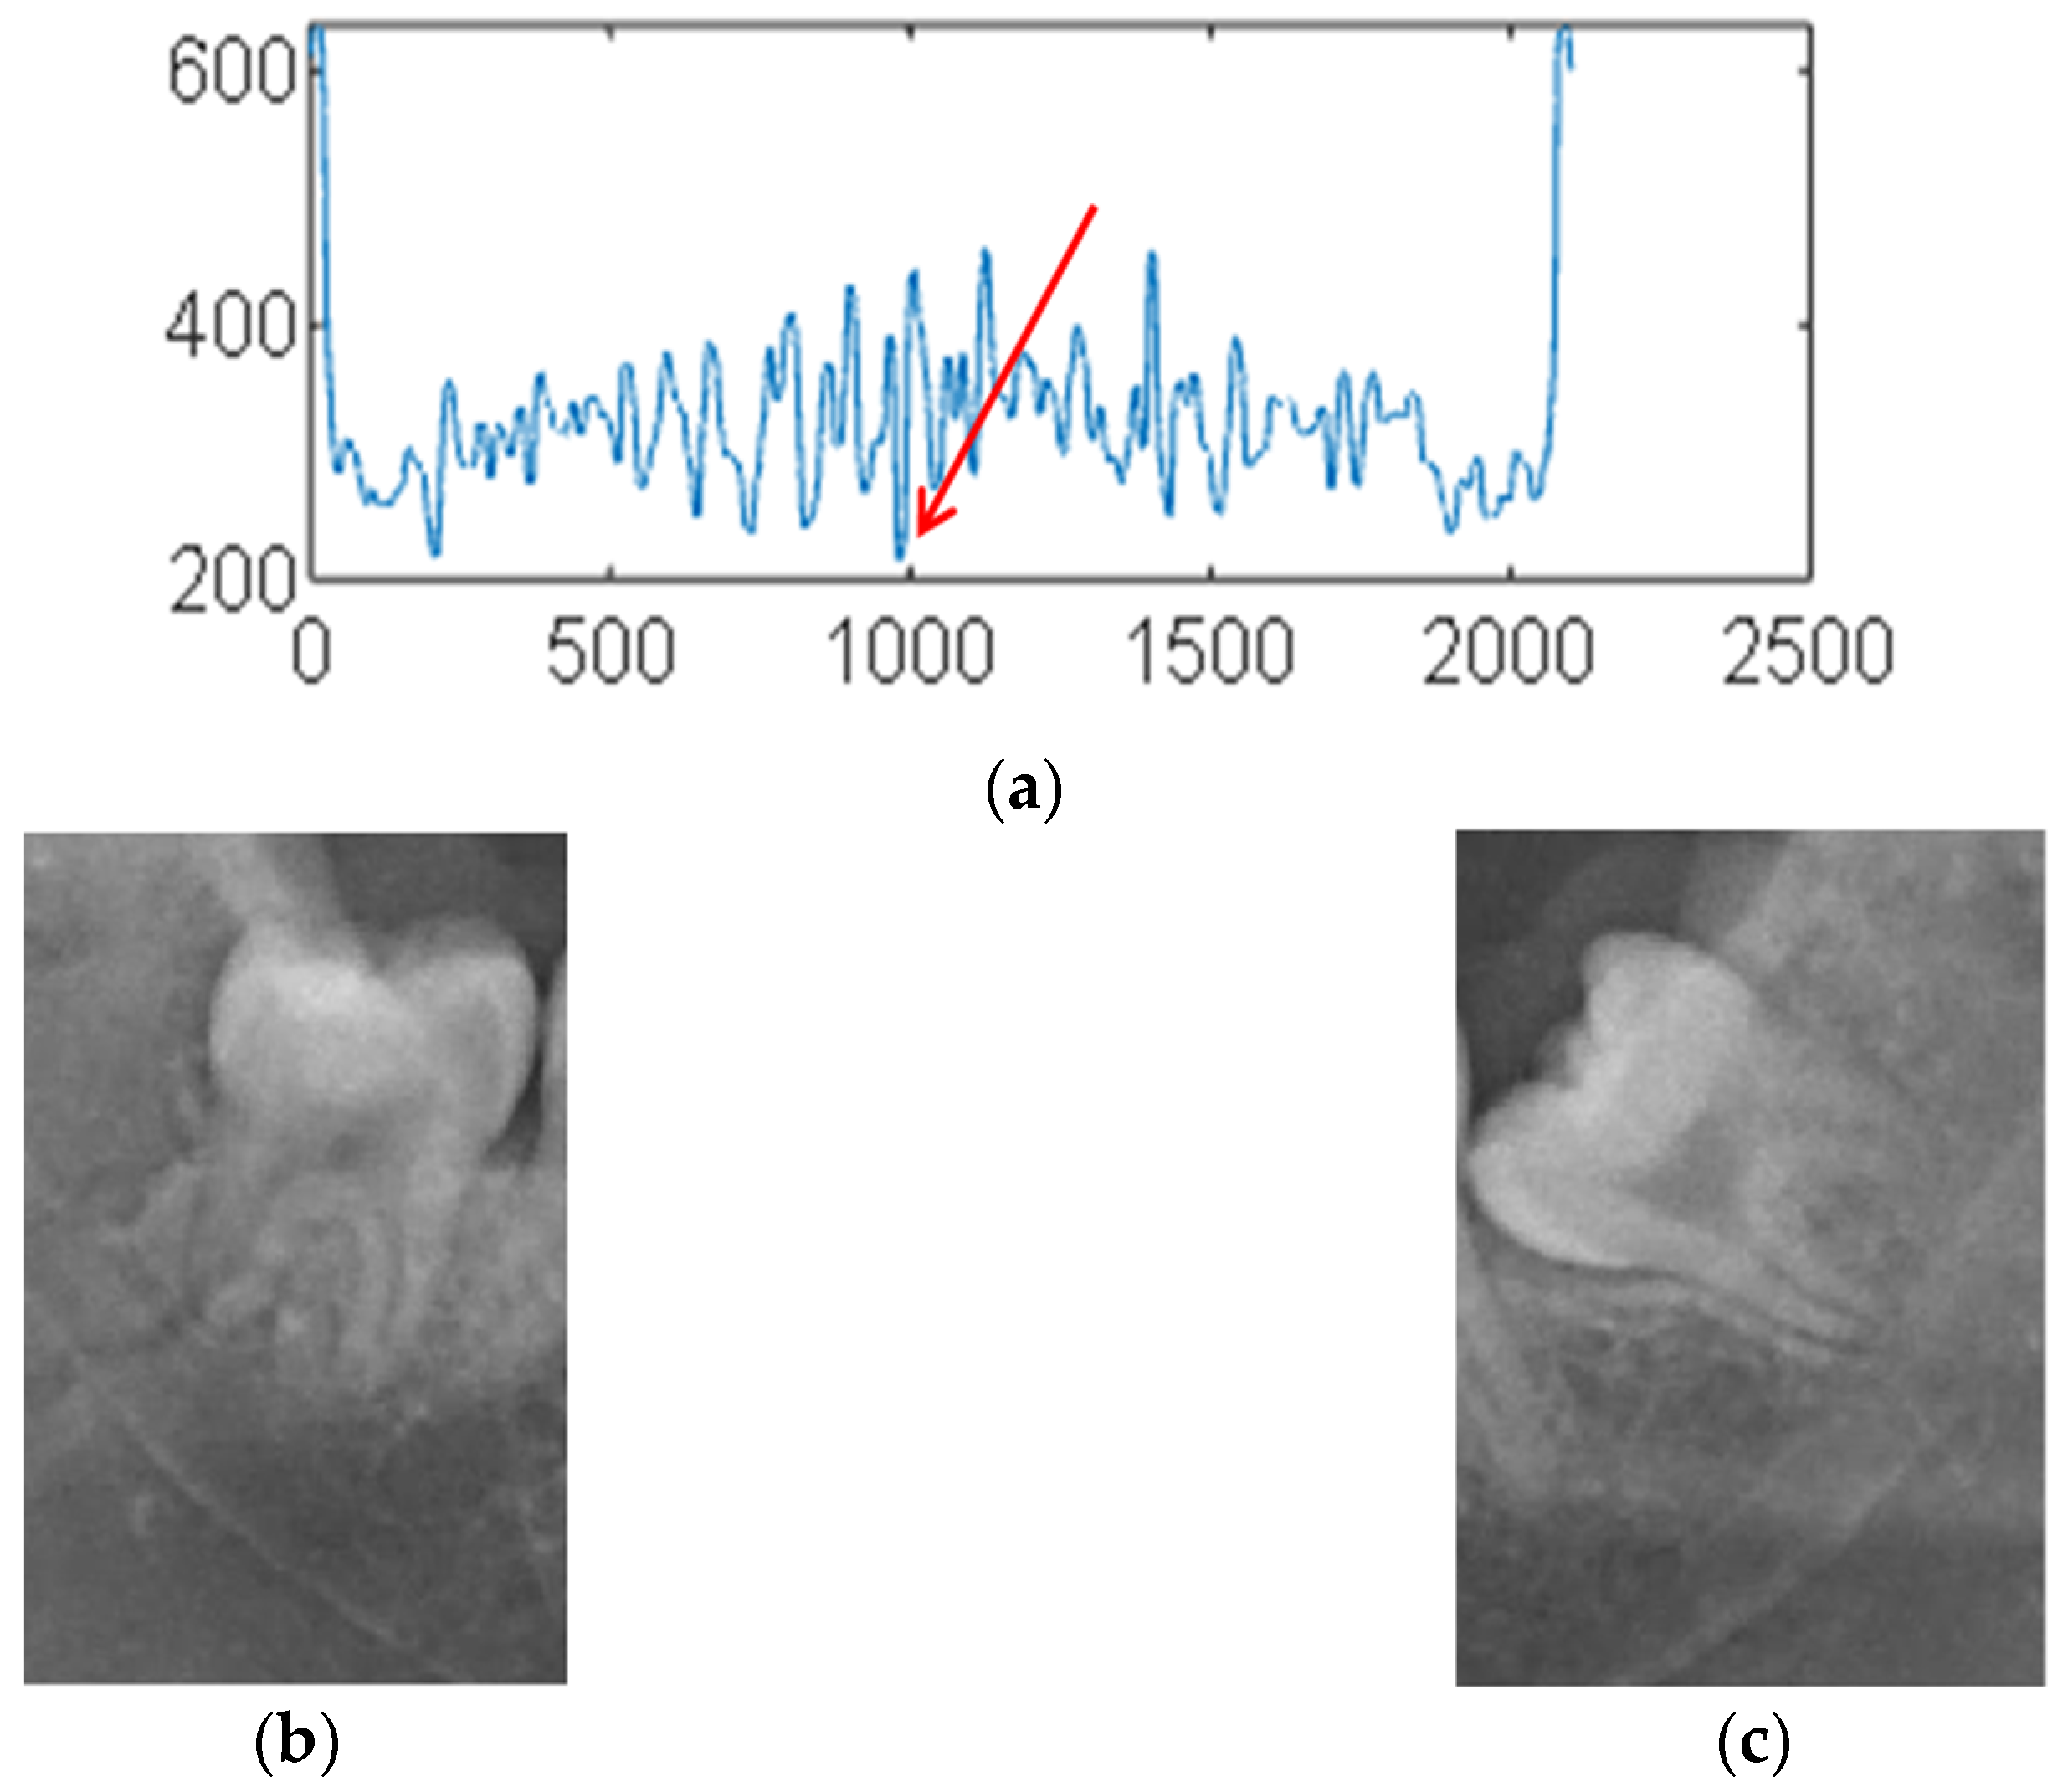
This study proposes a tooth segmentation algorithm based on vertical grayscale projection, which aims to automatically detect and segment teeth in DPR images. Vertical grayscale projection is used to analyze the brightness distribution in different regions. It is employed to identify the positions of tooth clefts, as shown in Figure 8a. Subsequently, teeth are segmented based on the characteristics of the projection distribution, as shown in Figure 8b,c. This algorithm exhibits excellent applicability and efficiency in oral image processing.
G.
YOLO_v4
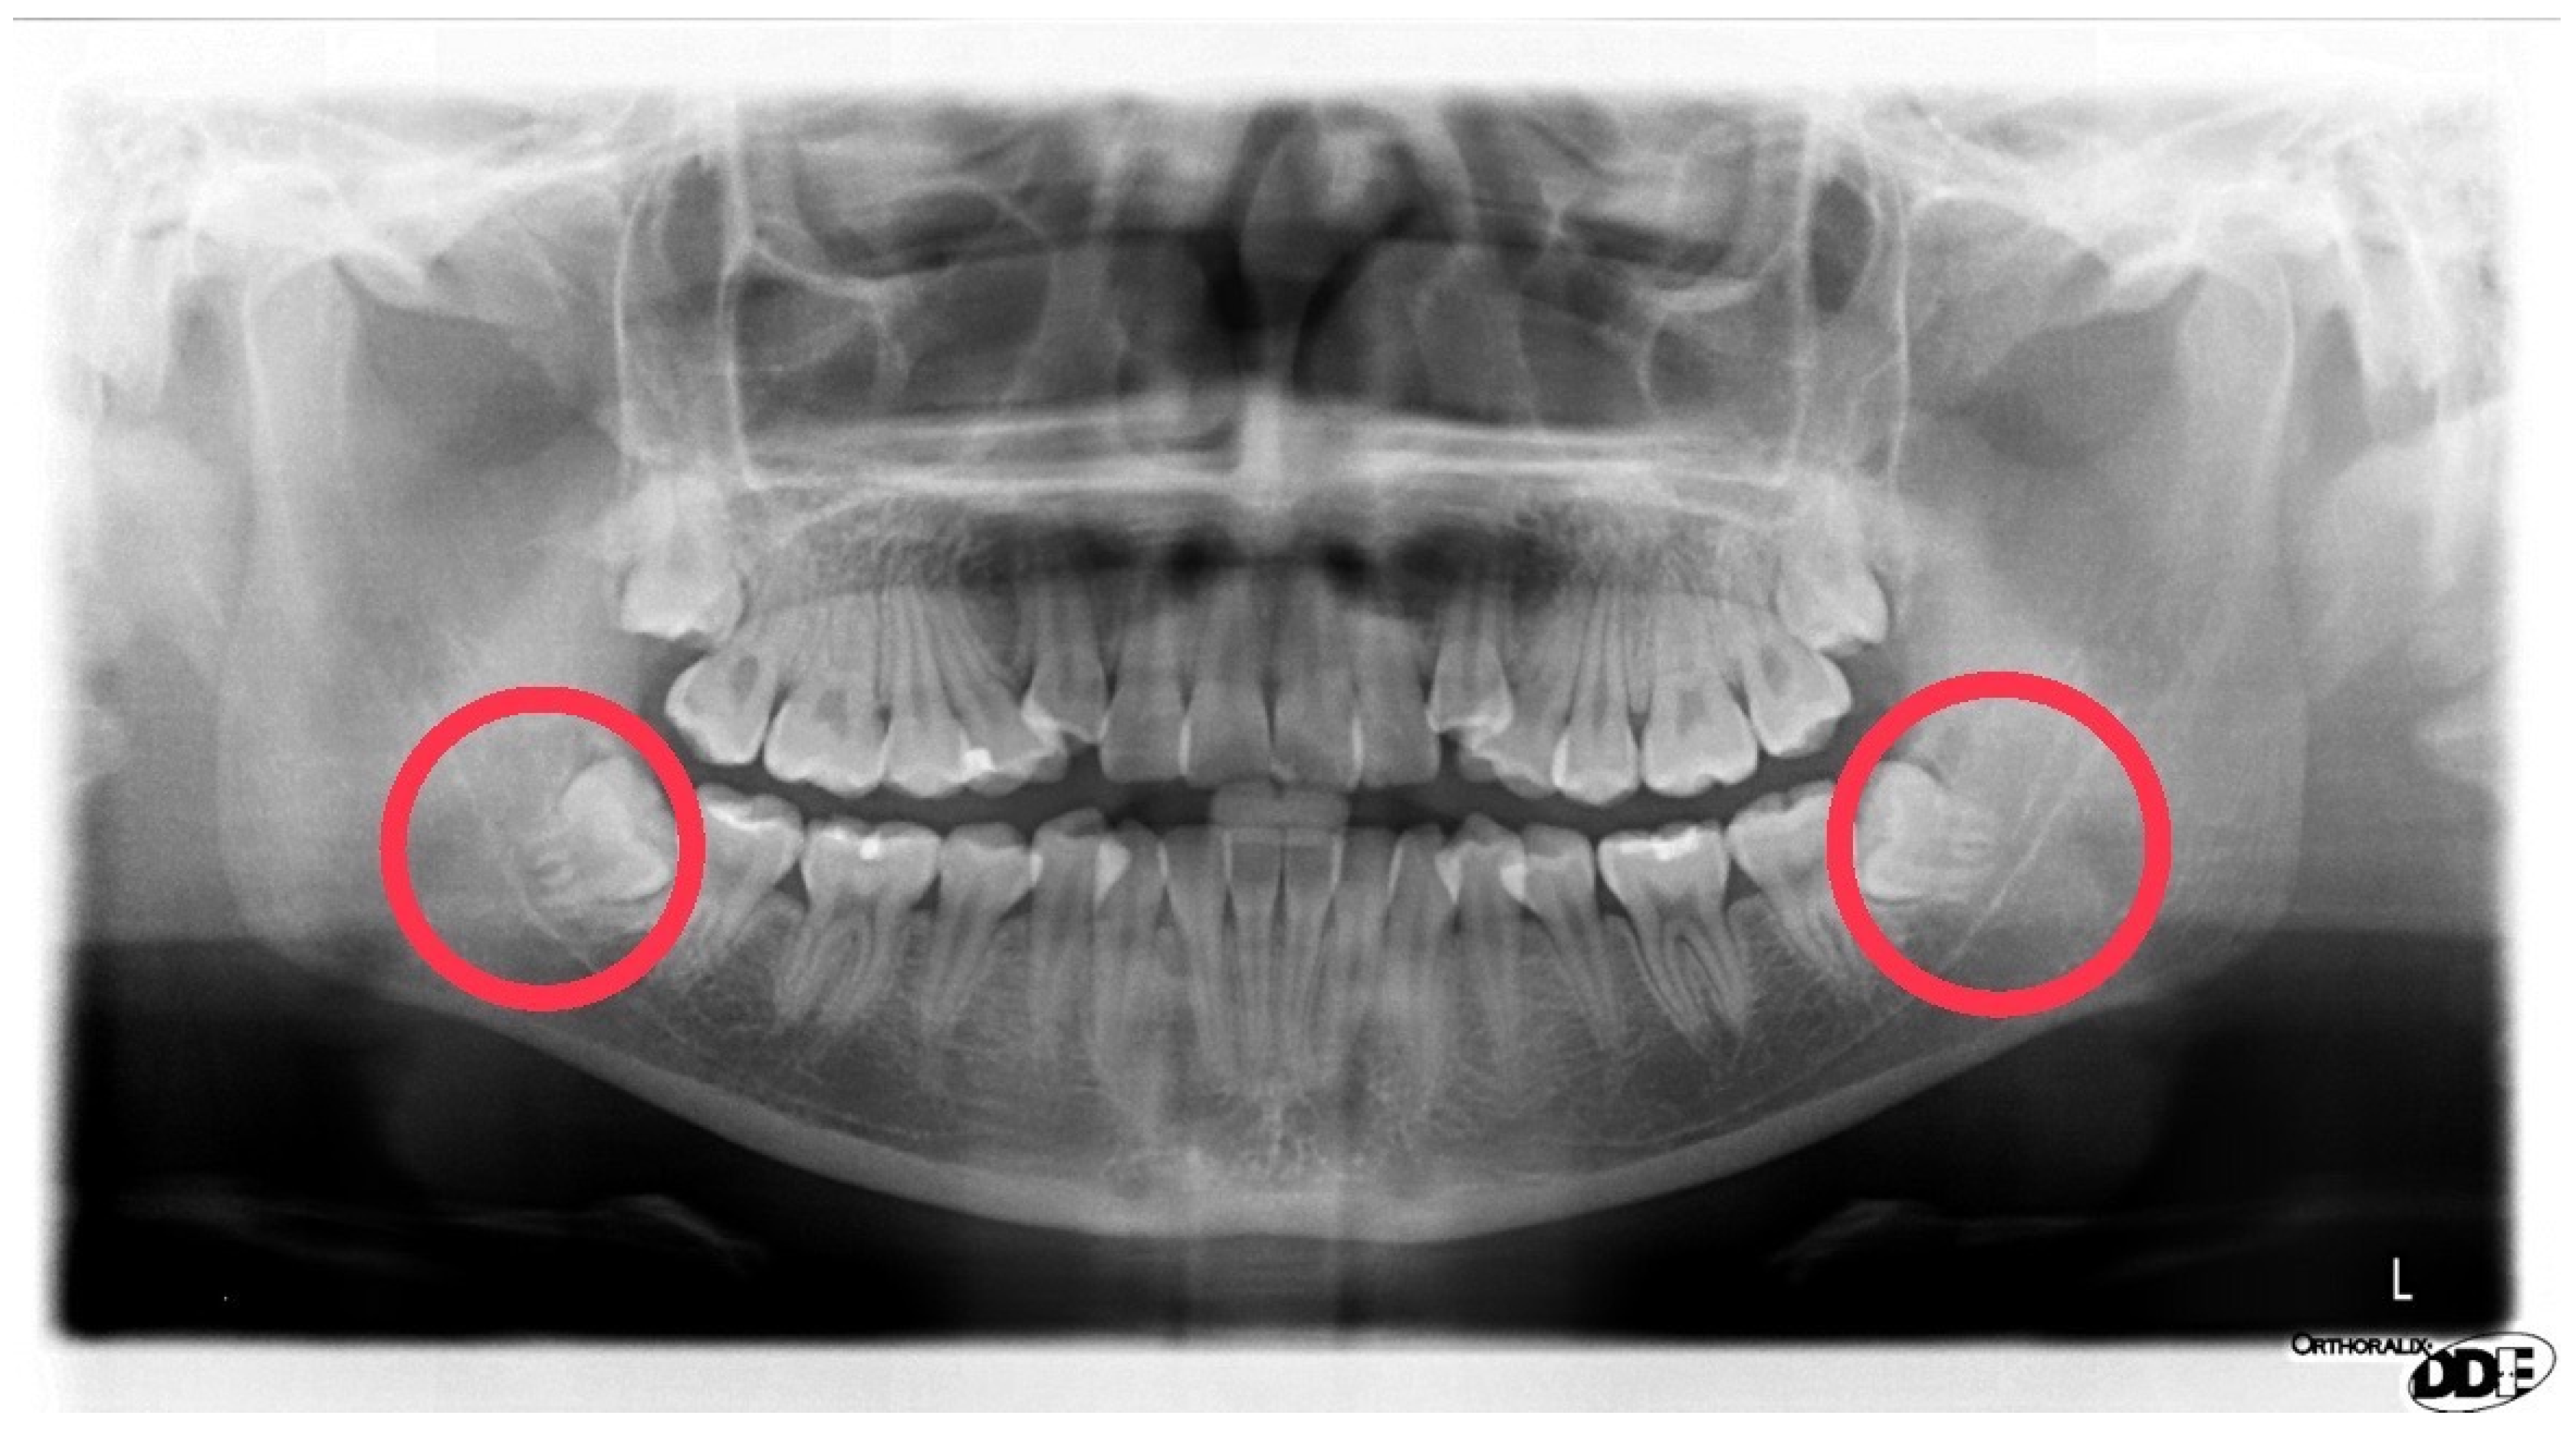
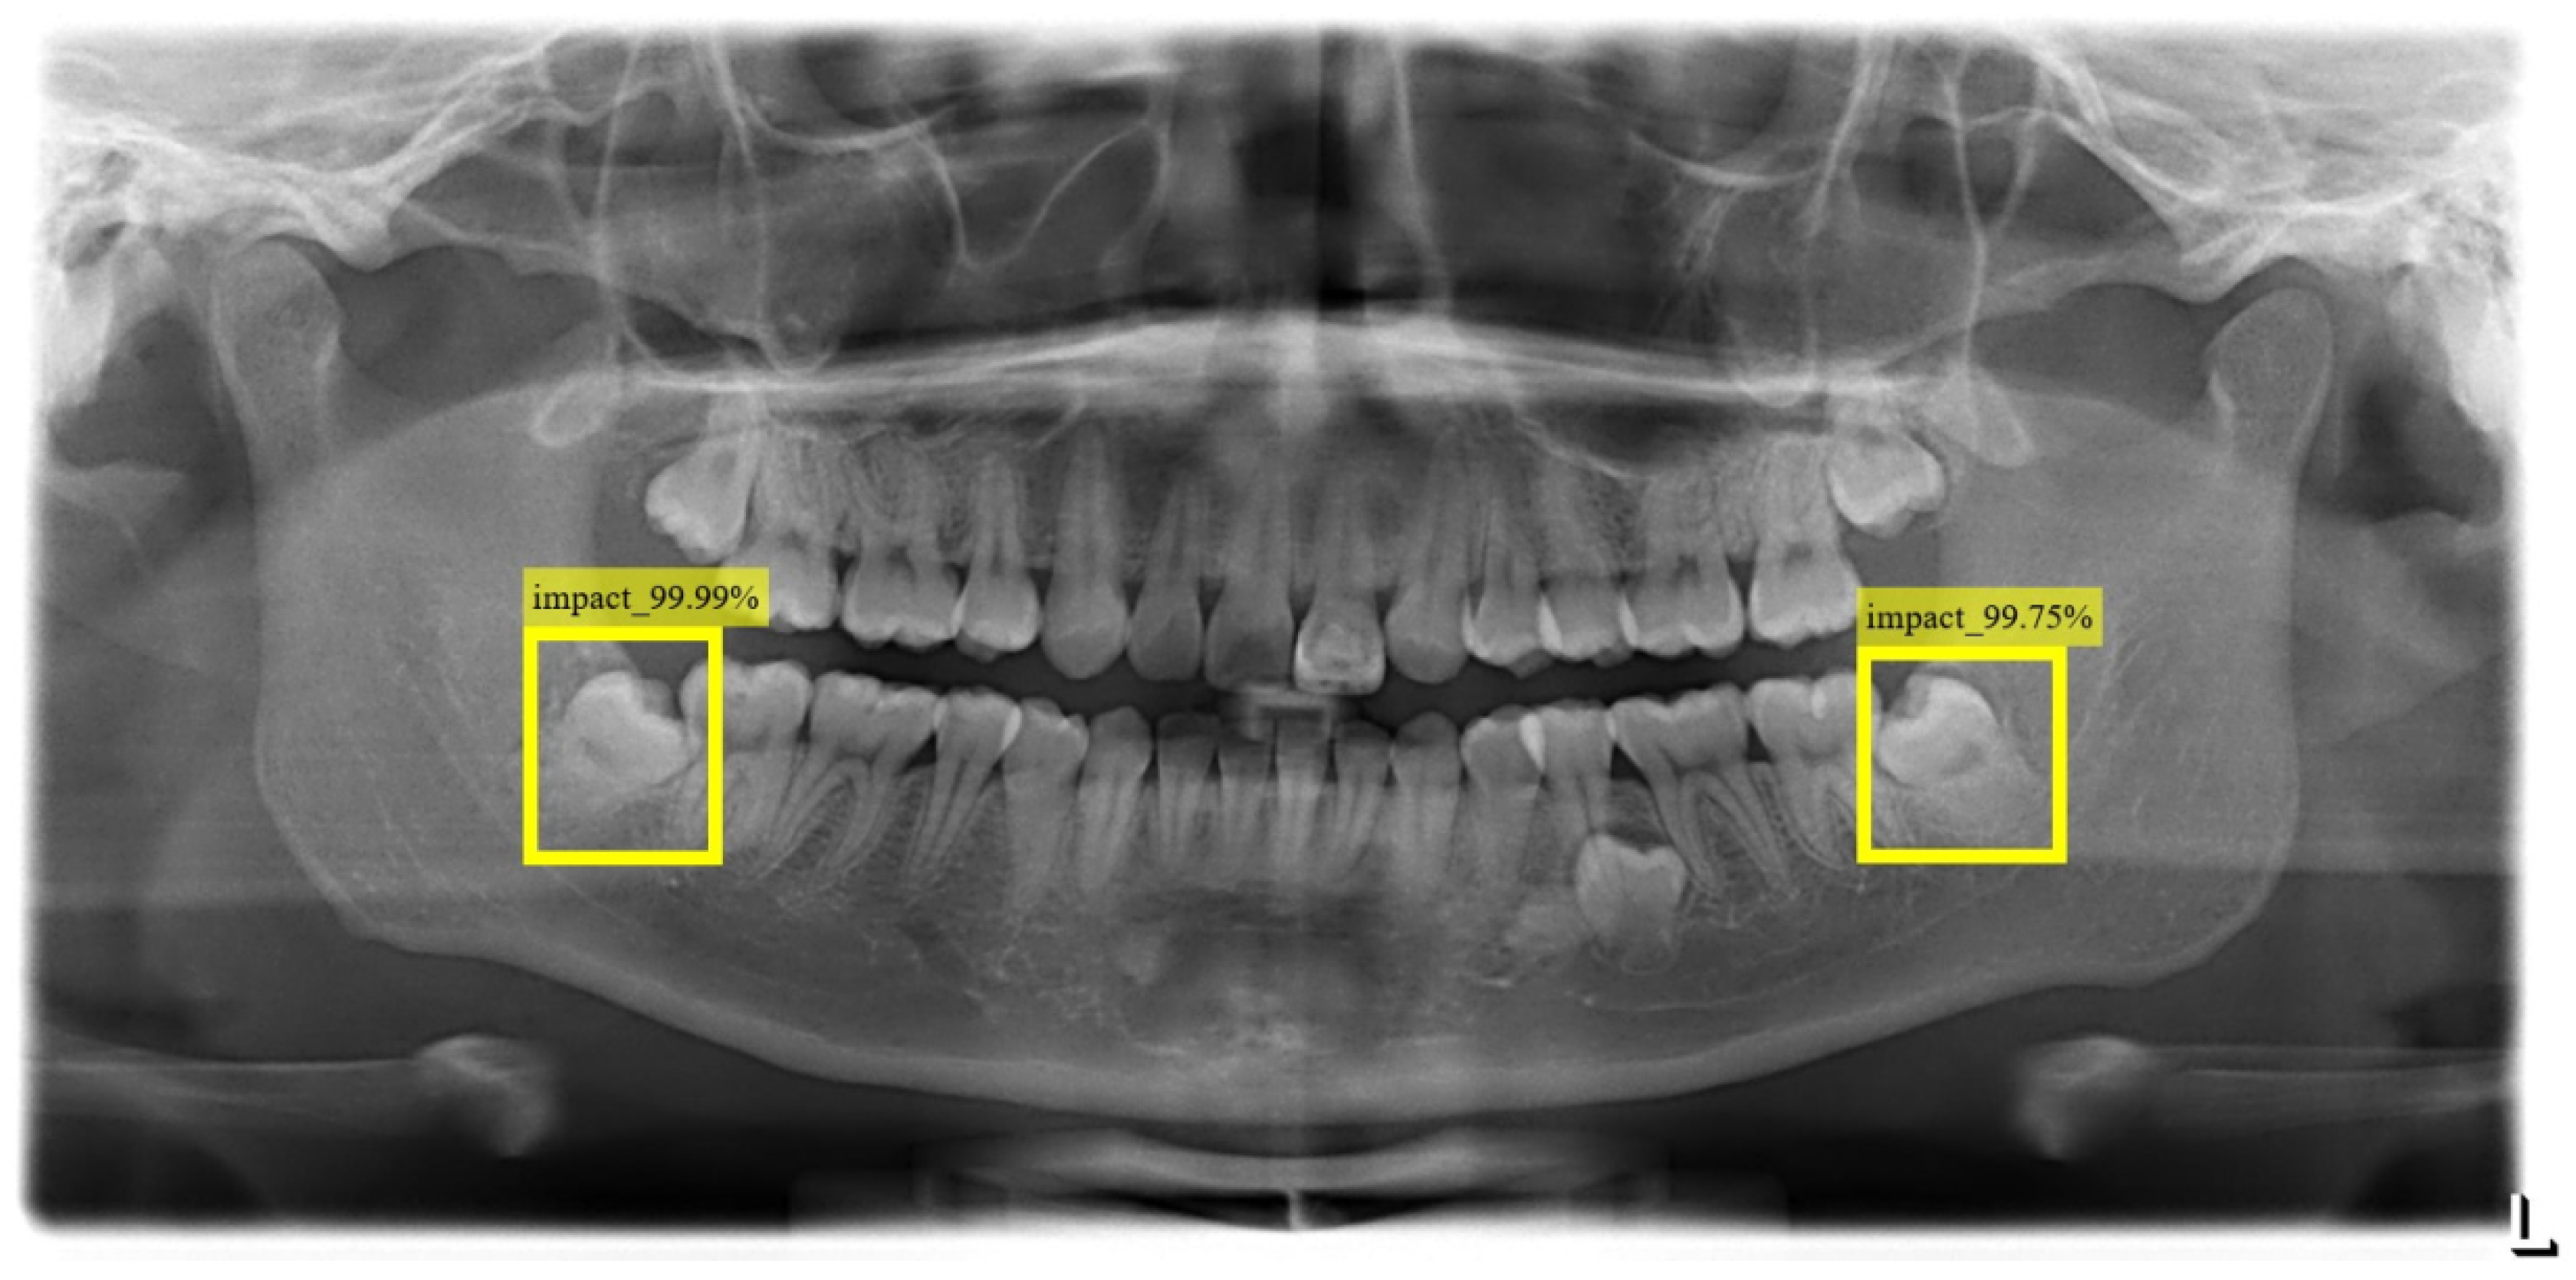
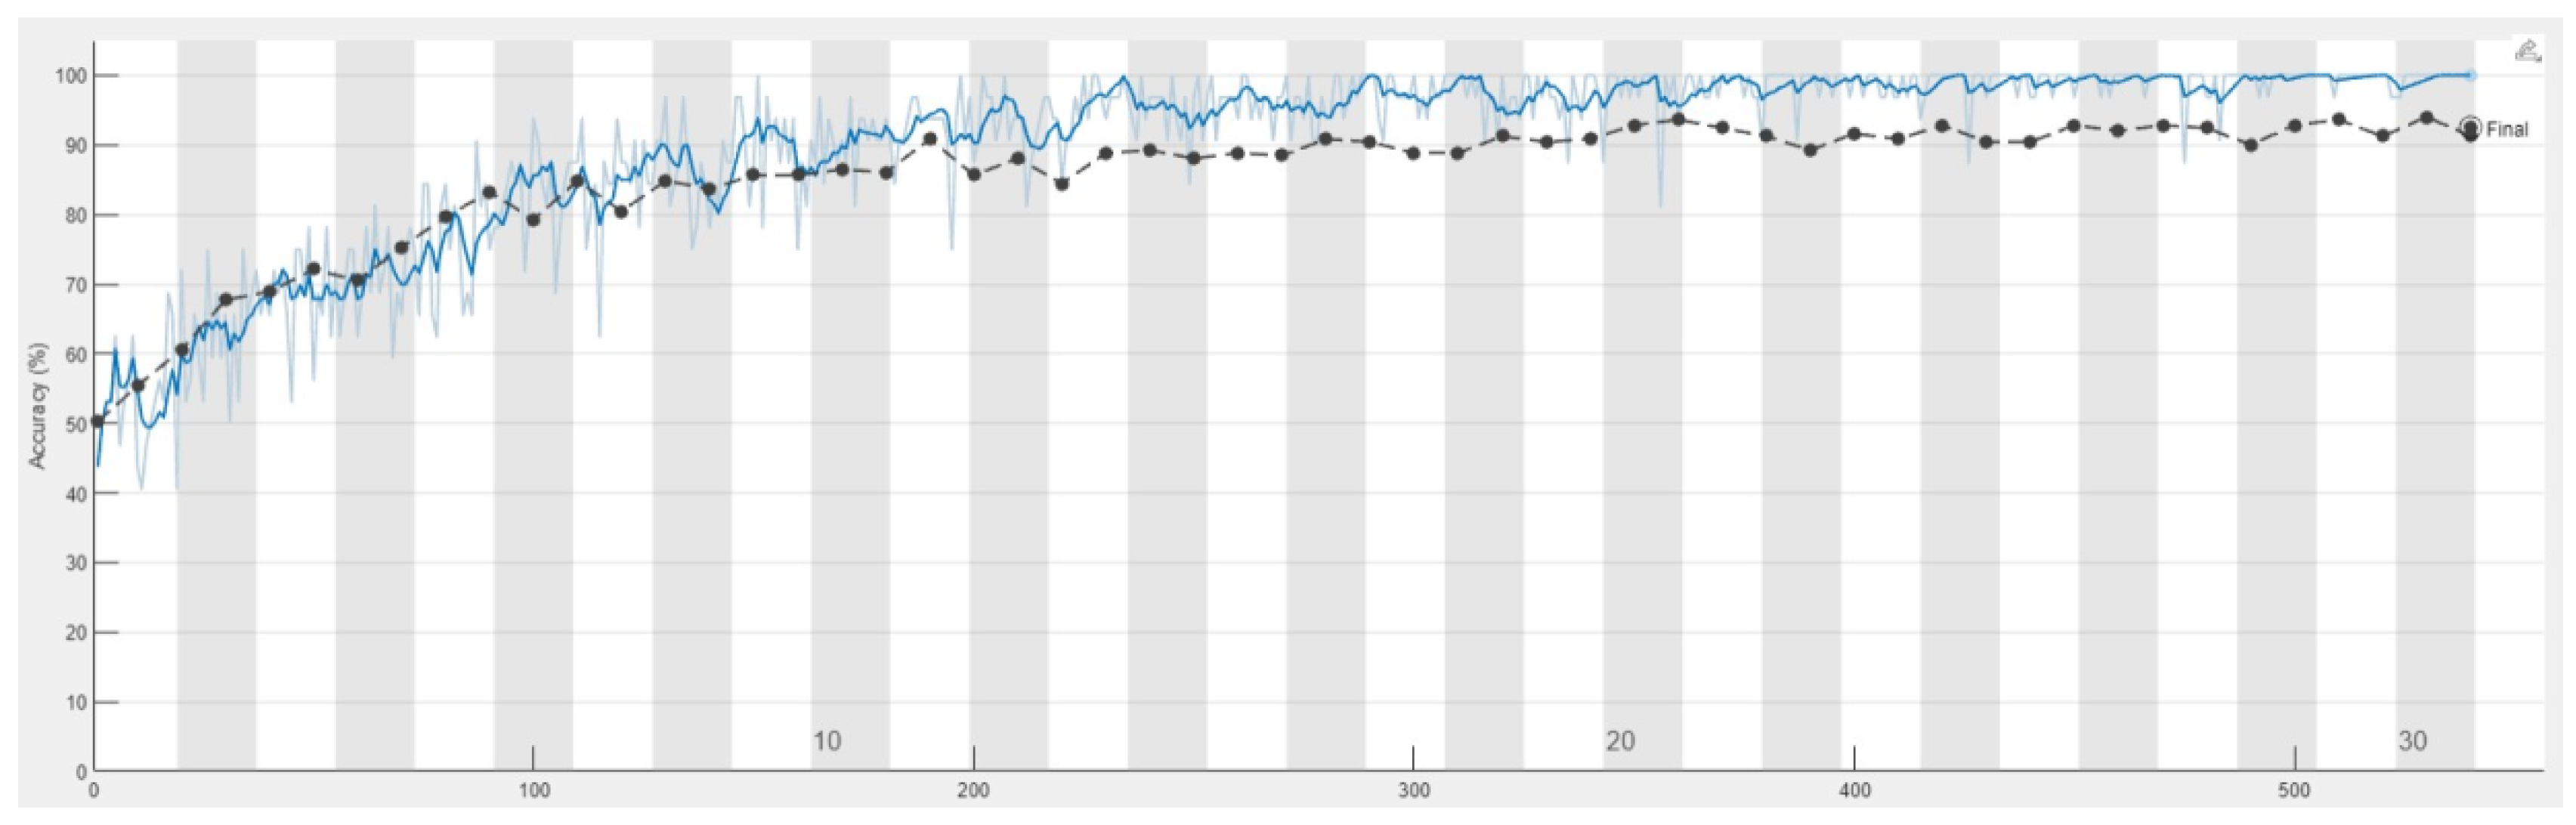
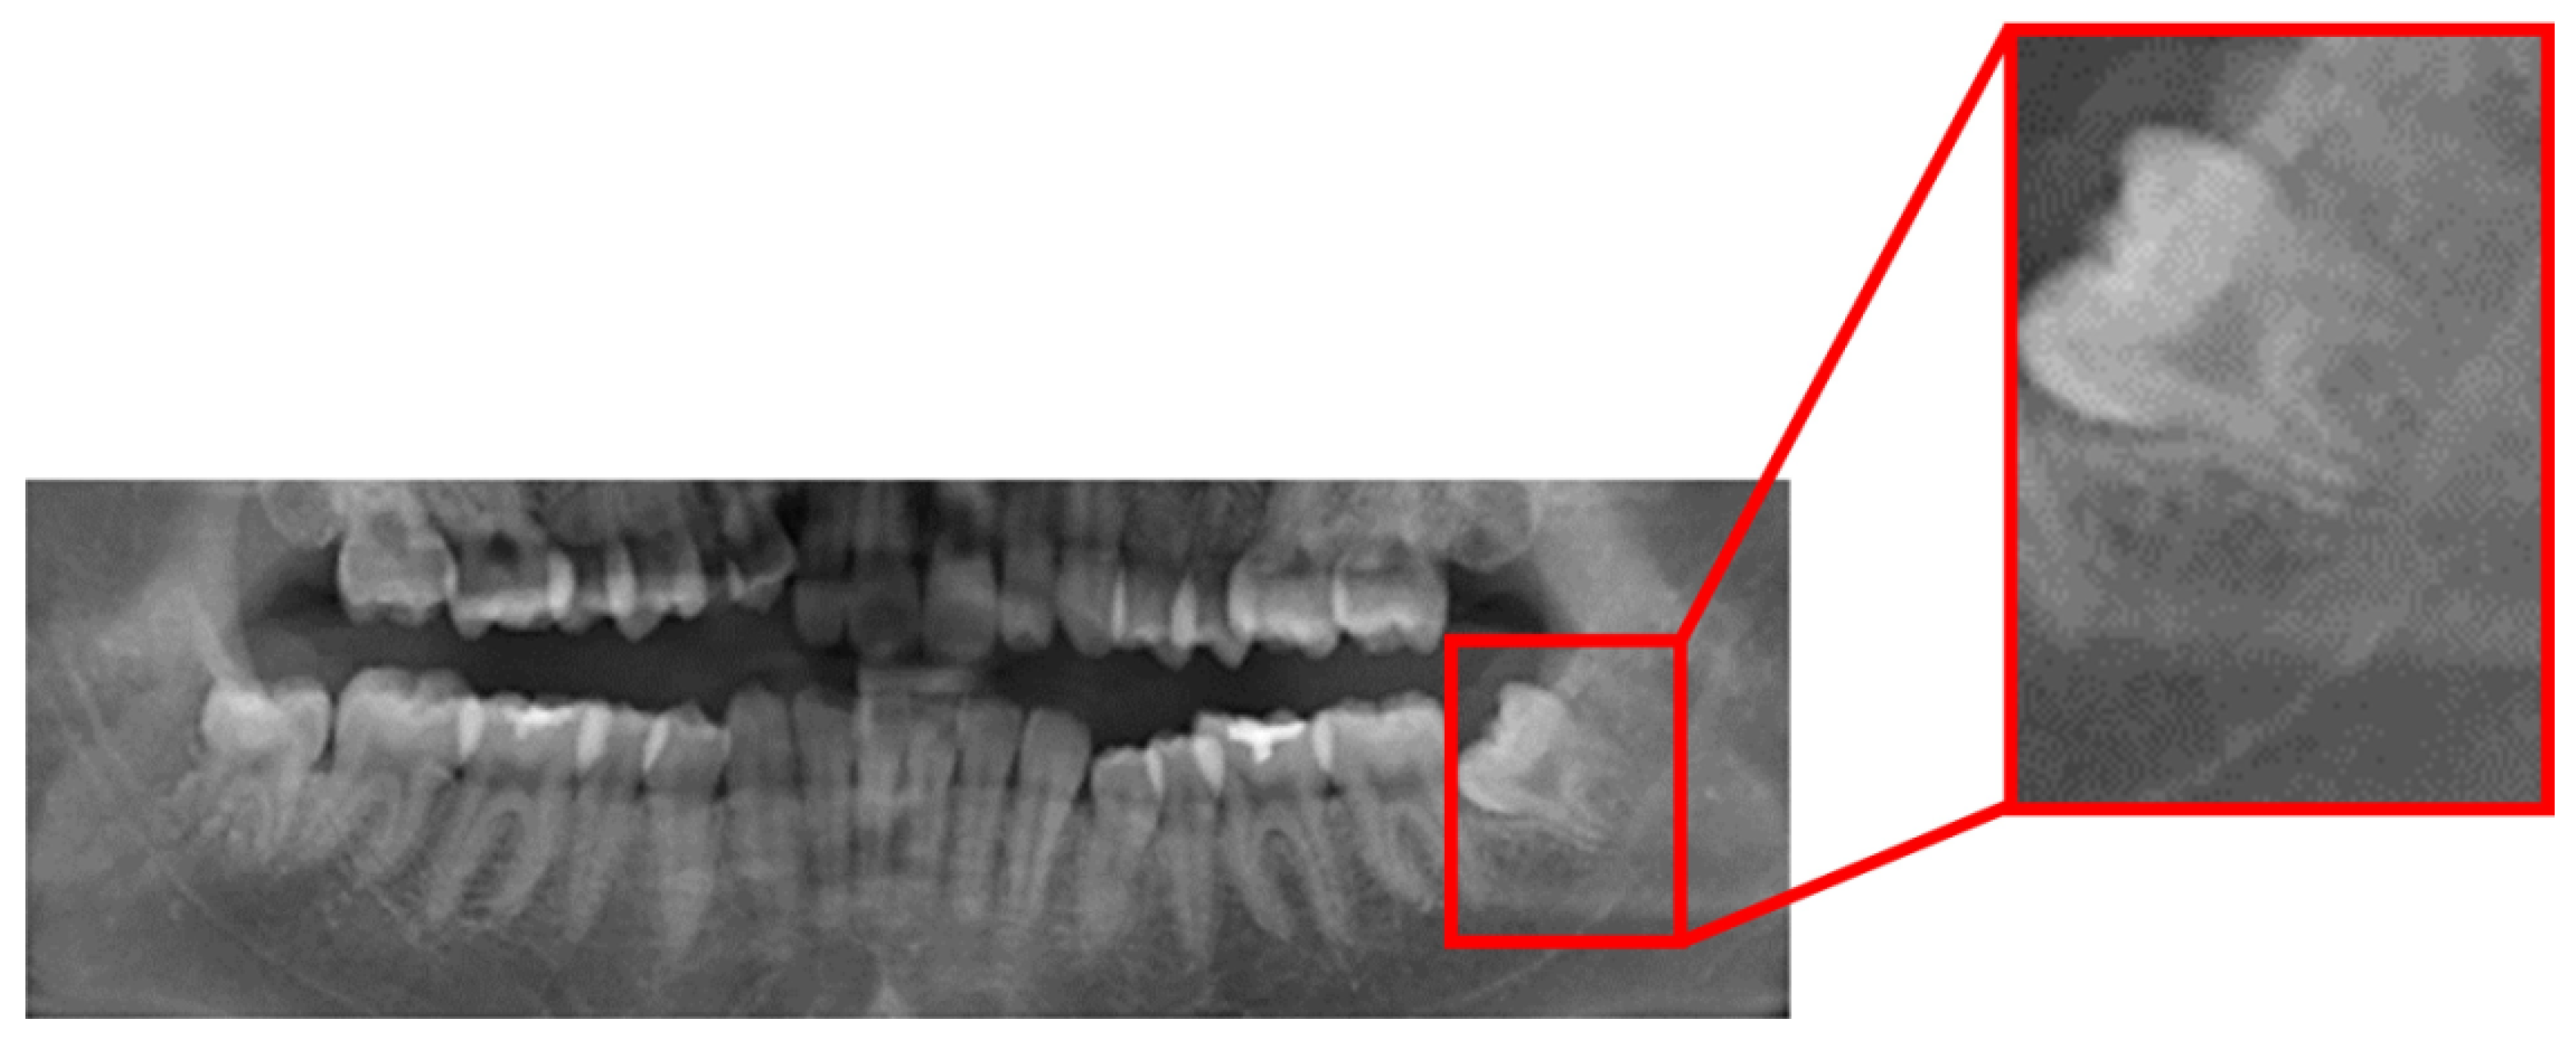
This study uses YOLO_V4 and vertical grayscale projection algorithms to locate the positions of impacted teeth and the inferior alveolar nerve. YOLO_V4 is an object recognition model, often used for detection or license plate recognition. In this research, YOLO_V4 was applied to identify impacted teeth and the inferior alveolar nerve in DPR images. This study annotated 500 DPR images for YOLO_v4 training, with the validation results depicted in Figure 9, showcasing an impressive accuracy of up to 88%. The YOLO model records both the position and class of bounding boxes, enabling the extraction of impacted teeth based on the recorded positions. The proposed impacted tooth segmentation algorithm, based on vertical grayscale projection, achieves an accuracy rate of 93%. Comparative analysis utilizing 100 untrained images against prior research outcomes, as presented in Table 1, reveals that the leveraging of the proposed impacted tooth segmentation algorithm in this study demonstrates an enhancement in accuracy by 3–5% compared to previous research and YOLO_v4.

2.2. Single Tooth Image Enhancement

In order to improve the accuracy of CNN training results, it is most critical to highlight the symptoms of impacted teeth. This study uses image preprocessing to eliminate most of the noise of impacted teeth images, additionally creating a black mask over adjacent unaffected tooth areas. The masked images are used as the training image dataset for the CNN model in this study.
A.
Image preprocessing
To enhance the accuracy of the CNN training model, this study applies image enhancement to the cropped impacted tooth images. Image preprocessing initially involves using guided filtering [
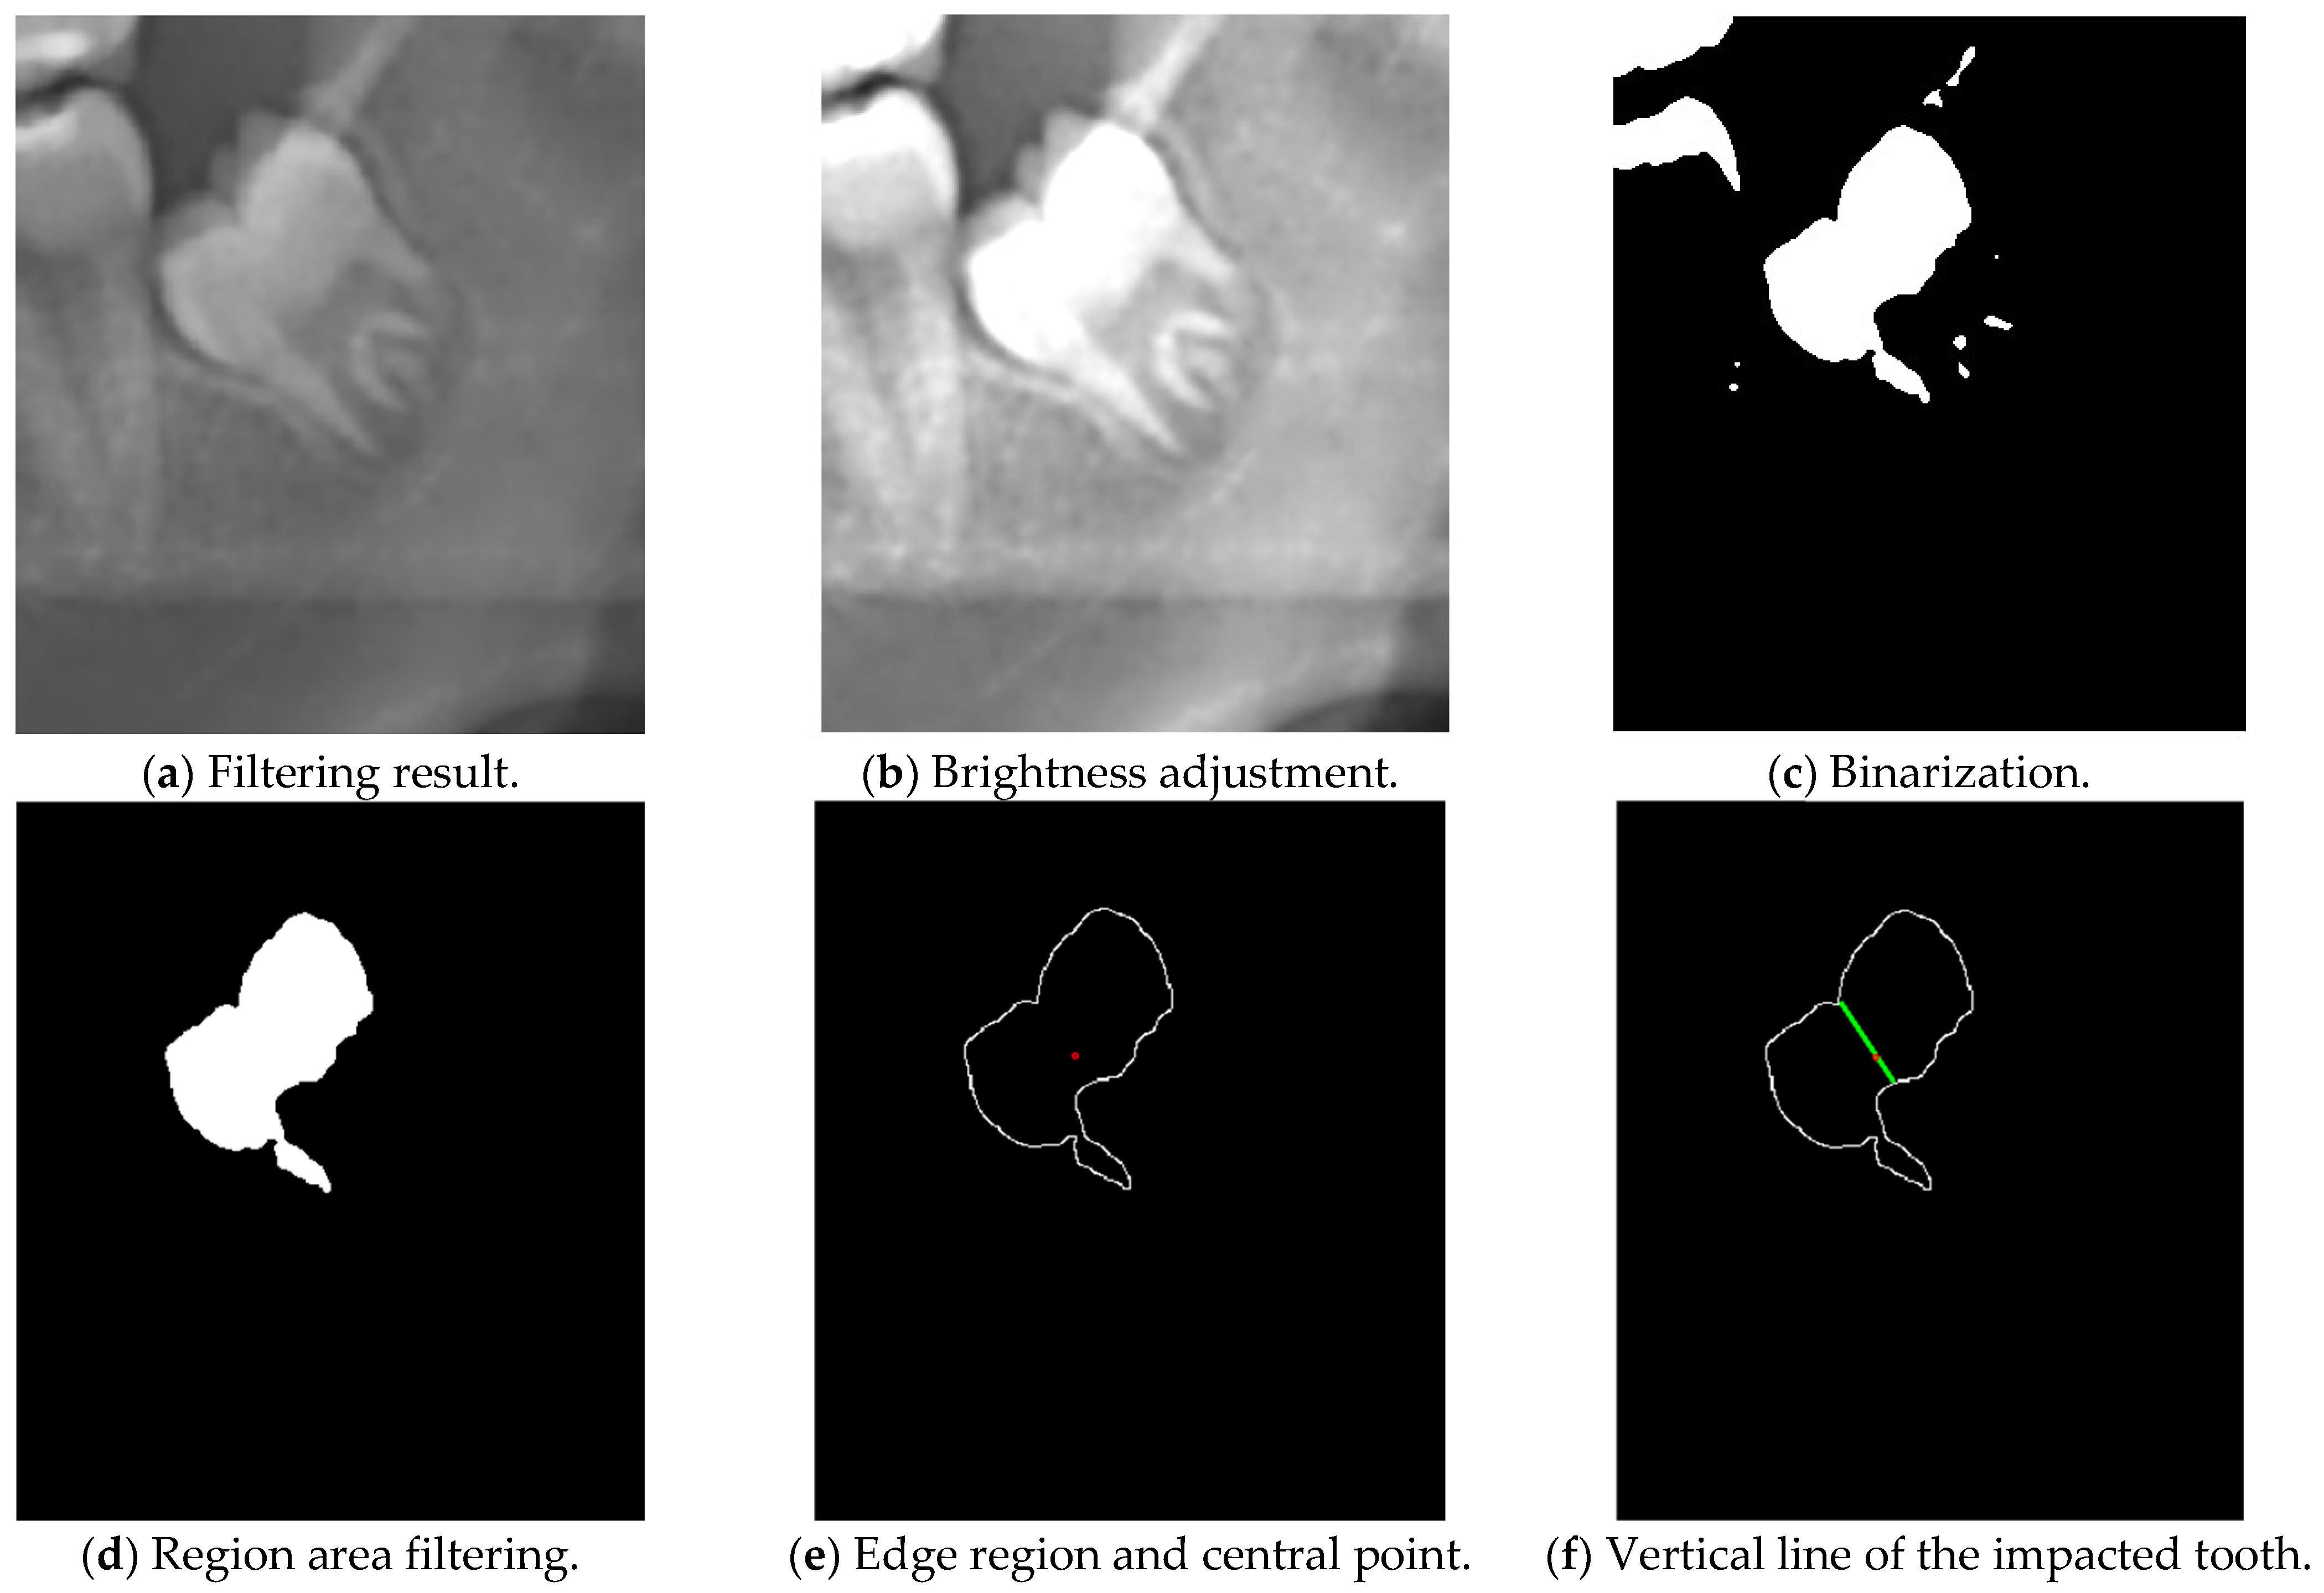
34] to smooth the image while preserving edges and features. Guided filtering is a smoothing image filter that preserves edges. In guided filtering, the original image serves as the guidance map, filtering out edge noise while retaining edge information. This aids in enhancing image quality and emphasizing specific regions of interest. The filtering results are depicted in Figure 10a, with the formulation given by Algorithm 1.
Algorithm 1. Guided Filter
Input filtering input image p, guidance image I, radius γ, regularization ε
Output filtering output image q.
1 :   m e a n I = f m e a n ( I )
    m e a n p = f m e a n ( p )
     c o r r I = f m e a n ( I . I )
    c o r r I P = f m e a n ( I . p )
2 :   v a r I = c o r r I m e a n I . m e a n I
    v a r I p = c o r r I p m e a n I . m e a n p
3 :   a = c o v I p   . /   ( v a r I + ε )
    b = m e a n I p m e a n I . m e a n p
4 :   m e a n a = f m e a n ( a )
    m e a n b = f m e a n b
5 :   q = m e a n a . I + m e a n b
B.
Brightness threshold segmentation
This study calculates the average pixel value of the filtered image, which is the overall brightness level of the image. Based on the calculated average pixel value, brightness adjustment is applied to the image. Different adjustments are made based on different ranges of average pixel values. For example, if the average pixel value is below a certain threshold (e.g., less than 122), the brightness range is adjusted to a brighter region. This helps to highlight low-brightness areas, which makes them easier to be identified; the image after brightness adjustment is shown in Figure 10b. Subsequently, brightness thresholding is used to convert the processed image into a binary mask. In this mask, pixels with brightness higher than the threshold are considered as the target region, while pixels with brightness lower than the threshold are considered as the background.
C.
Region Selection
In order to enhance the accuracy of recognition, this research employs a region area filtering technique to select regions of interest while excluding noisy areas. The primary aim is to ensure that the selected regions effectively represent the principal target regions rather than inconsequential noise. Subsequently, a binary mask was generated, with white pixels denoting the regions of interest, while black pixels signified the background as shown in Figure 10c. This step of constructing the binary mask is important to isolate the target region for more comprehensive analysis and subsequent processing. In this study, brightness threshold segmentation is employed to precisely locate the regions of interest. It can effectively segregate the regions of interest from the background by establishing a binary mask. To eliminate noise from this mask, a region area filtering approach is applied, ensuring that only regions surpassing a predefined area threshold are retained, as shown in Figure 10d.
D.
Center Point Calculation and Edge Detection
In the preceding step, a binary image mask is obtained, where white regions represent the objects of interest, and black regions denote the background. To facilitate further analysis and processing of these objects, the next step involves detecting the contours of the target objects. In this study, the Canny edge detection algorithm was employed for this purpose. The Canny algorithm [35] is adept at detecting edges within regions of interest. Once the edges are detected, the computed center points and contours are overlaid onto the edge regions, as shown in Figure 10e. This overlaying process aids the positions and shapes of the target objects. It provides a clear representation of the dental structures, which is essential for subsequent analysis and diagnosis.
E.
Determining the inclination or tilt direction of the target object
Boundary detection is employed to determine the inclination direction of the impacted tooth. Firstly, the distances between these boundaries within the region of interest is calculated. Subsequently, the shortest line among all possible lines passing through the center point of the region is selected, as shown in Figure 10f. The shortest line typically represents the connection between the top and bottom of the tooth crown. By determining the slope of this line, the inclination direction of the impacted tooth could be ascertained.
F.
Image Mask
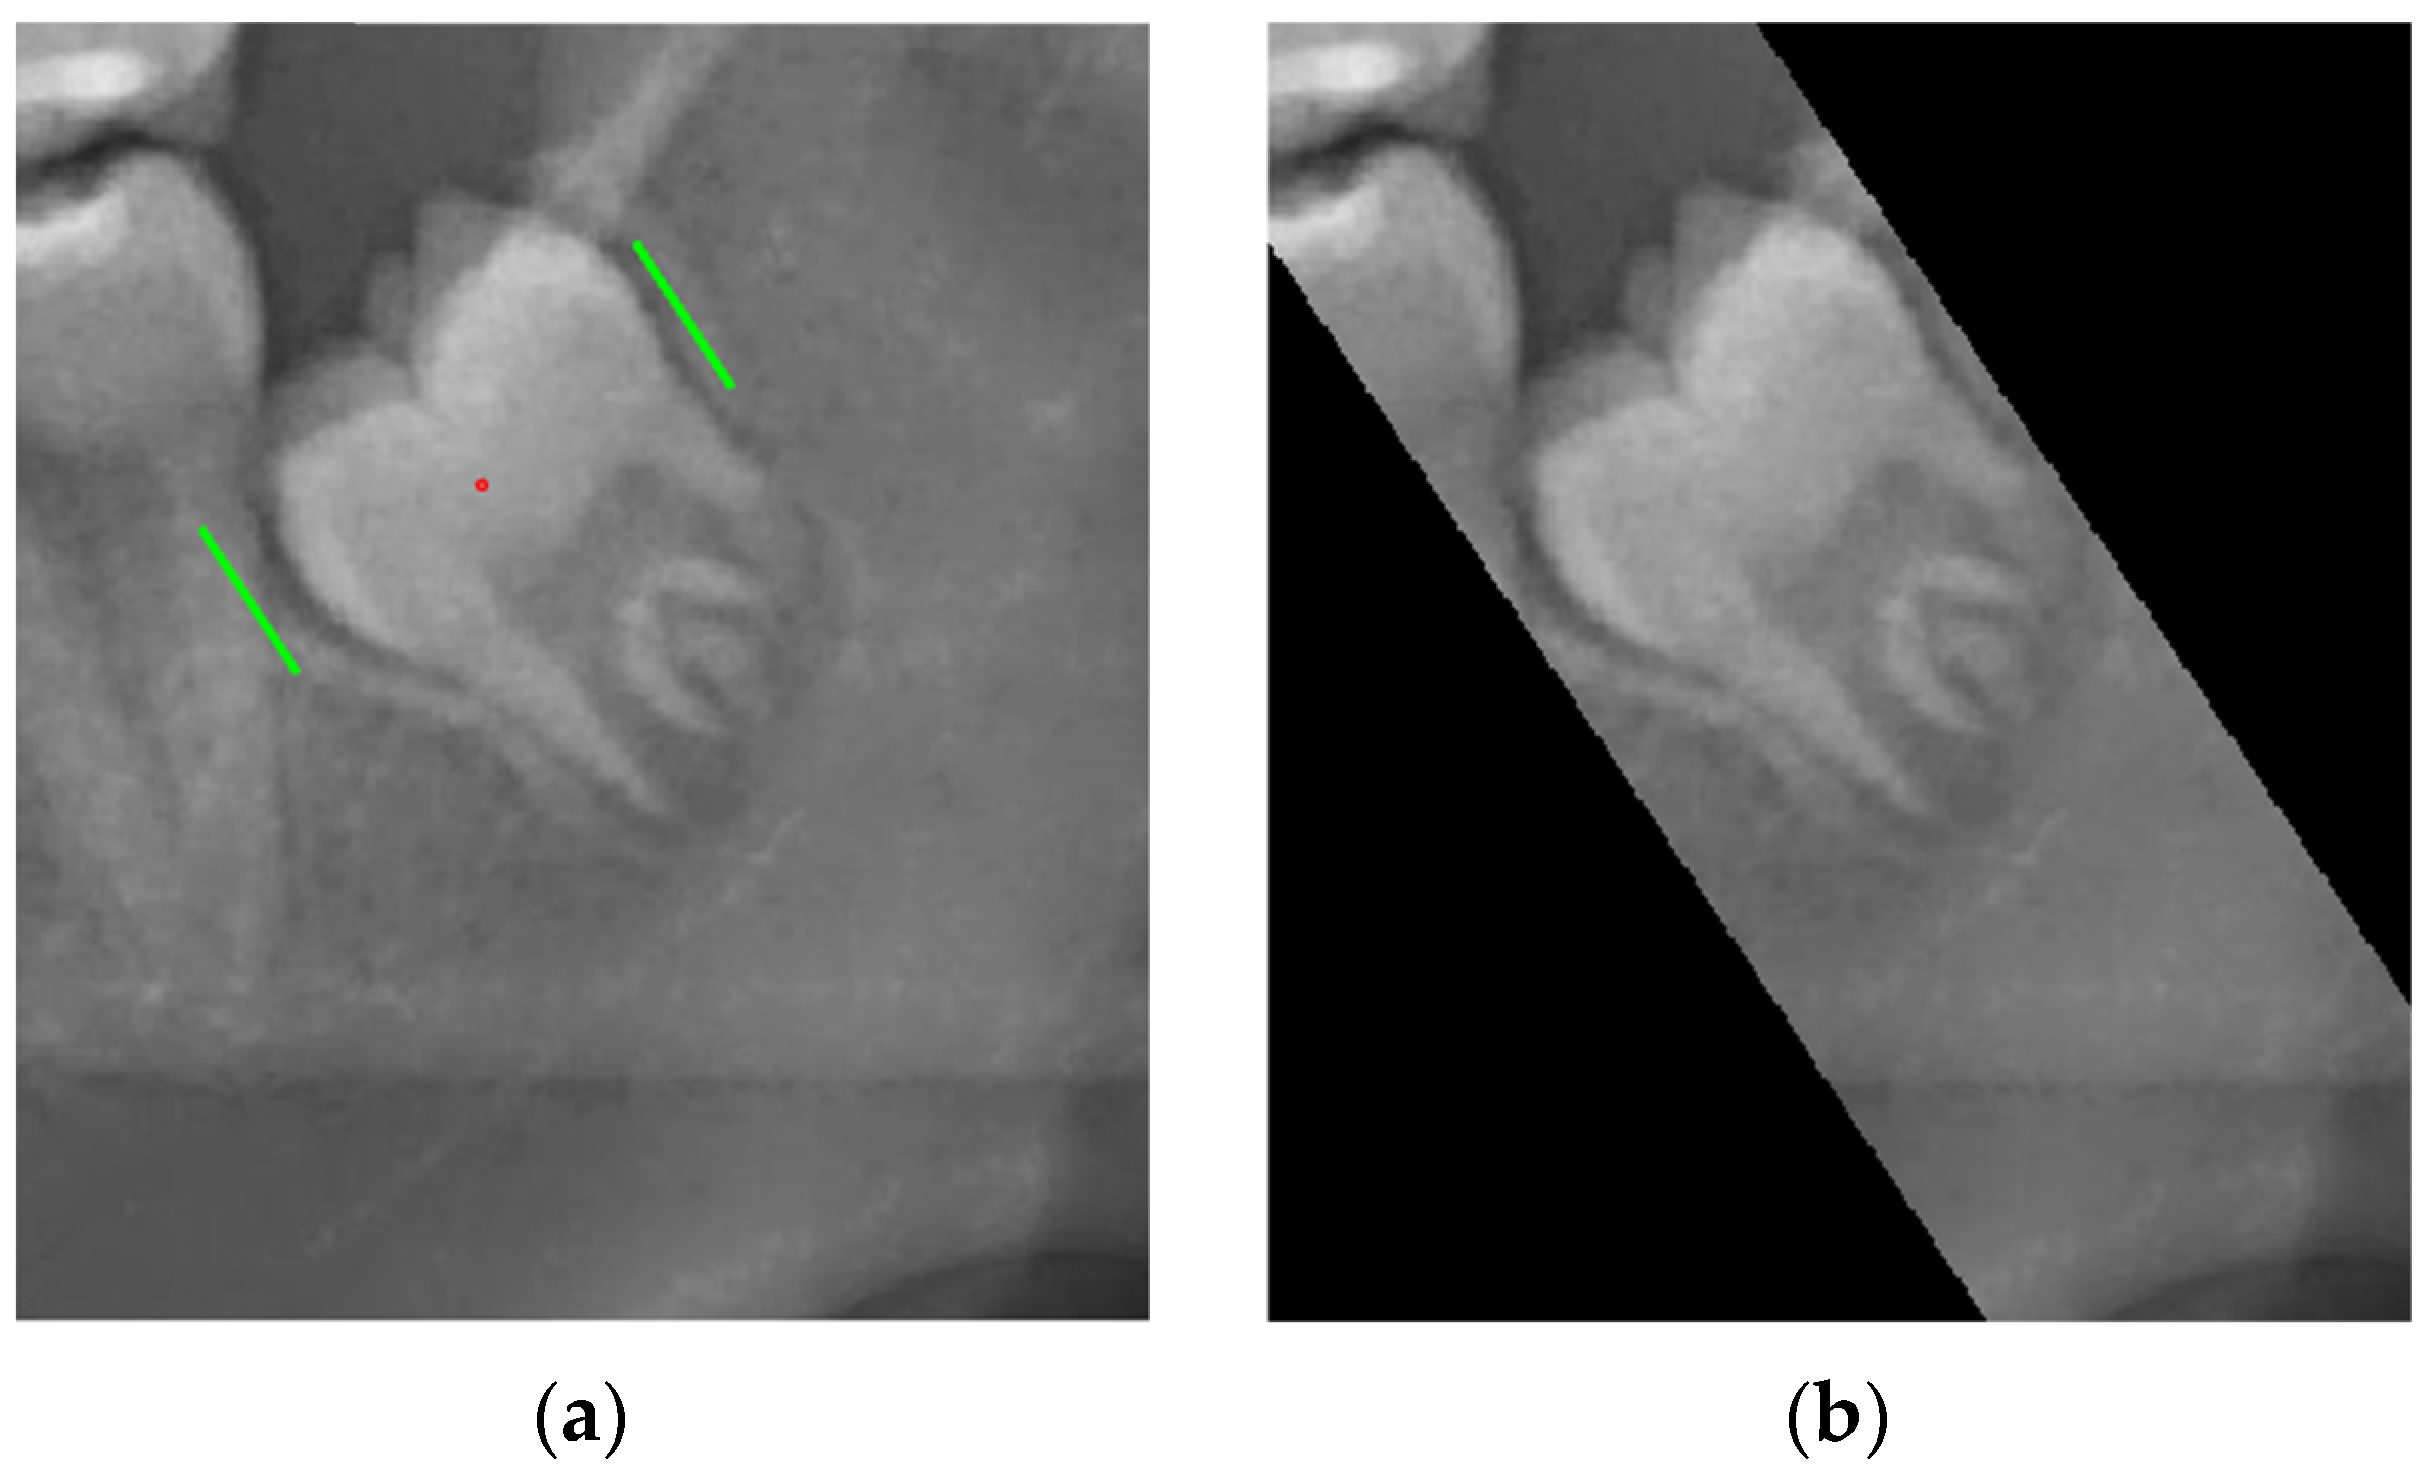
The threshold related to the width of the tooth is set by the slope of the inclination direction of the impacted tooth. By shifting the line from the central point by this threshold value on both sides, the boundary points of the impacted tooth can be identified. Subsequently, the areas outside the line are covered with a black mask, as shown in Figure 11.

2.3. CNN Training

In recent years, a suite of influential deep learning models rooted in CNNs has emerged, notably including AlexNet, GoogLeNet, VGGNet, and ResNet, among others. The CNN architecture is often used for classification tasks. This study harnesses four established models—AlexNet, GoogLeNet, MobileNet_V2, and ShuffleNet—for transfer learning purposes. The acceleration of CNN model training within this study is facilitated through the utilization of an Nvidia GeForce GTX 1060 GPU, with comprehensive hardware performance details presented in 
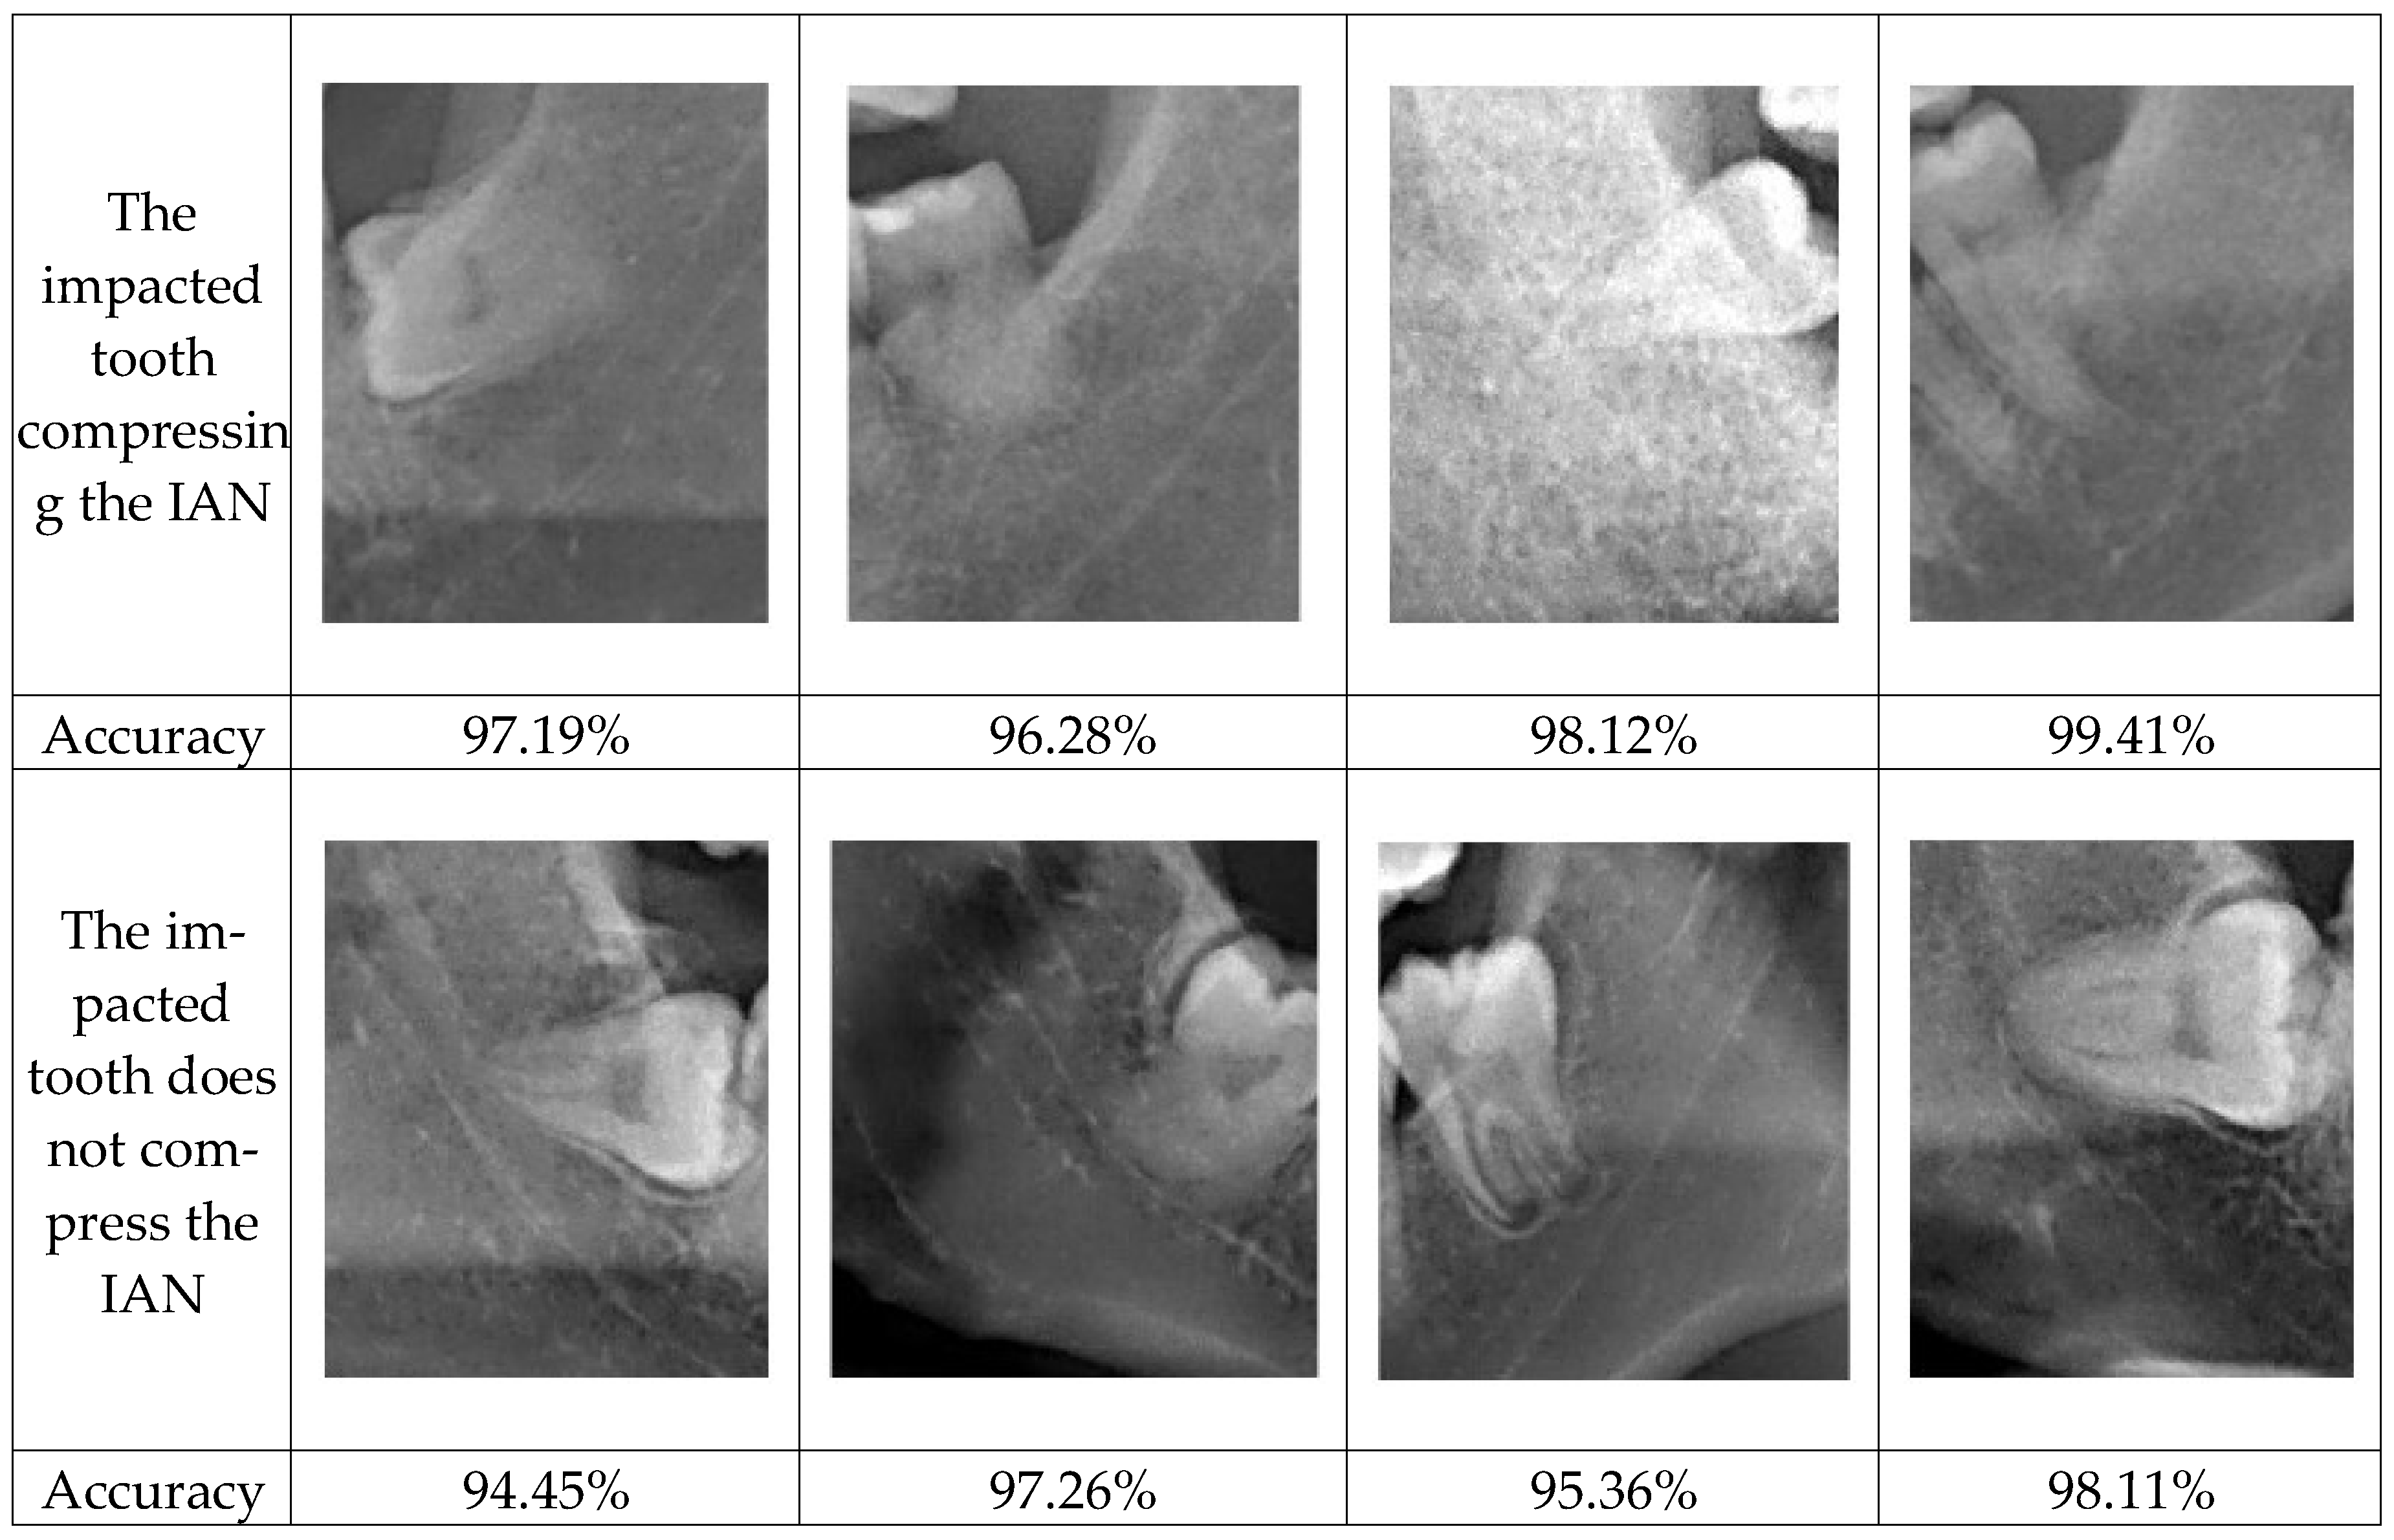
Table 2. MATLAB and Deep Network Designer serve as the foundational software tools for designing convolution network models. The core aim of this research is to discern whether impacted wisdom teeth exert pressure on the inferior alveolar nerve. The image database is segregated into two distinct categories, each containing 1000 images. These images are randomly partitioned, allocating 70% for CNN training and validation purposes. Among the 70%, 60% is dedicated to training and 40% is dedicated to validation. The remaining 30% constitutes test images, utilized to evaluate the accuracy of the CNN.
The architecture of the models, taking ShuffleNet as an example in this study, is outlined in Table 3. The input image size is 224 × 224. Since this study deals with only two classes, adjustments are made to the fully connected layer to output two classes instead of the original 1000. Training a CNN with existing images alone is insufficient. Therefore, data augmentation is employed to expand the database, such as vertical flipping, brightness adjustment, and image rotation. It results in a total of 1000 images through data augmentation.
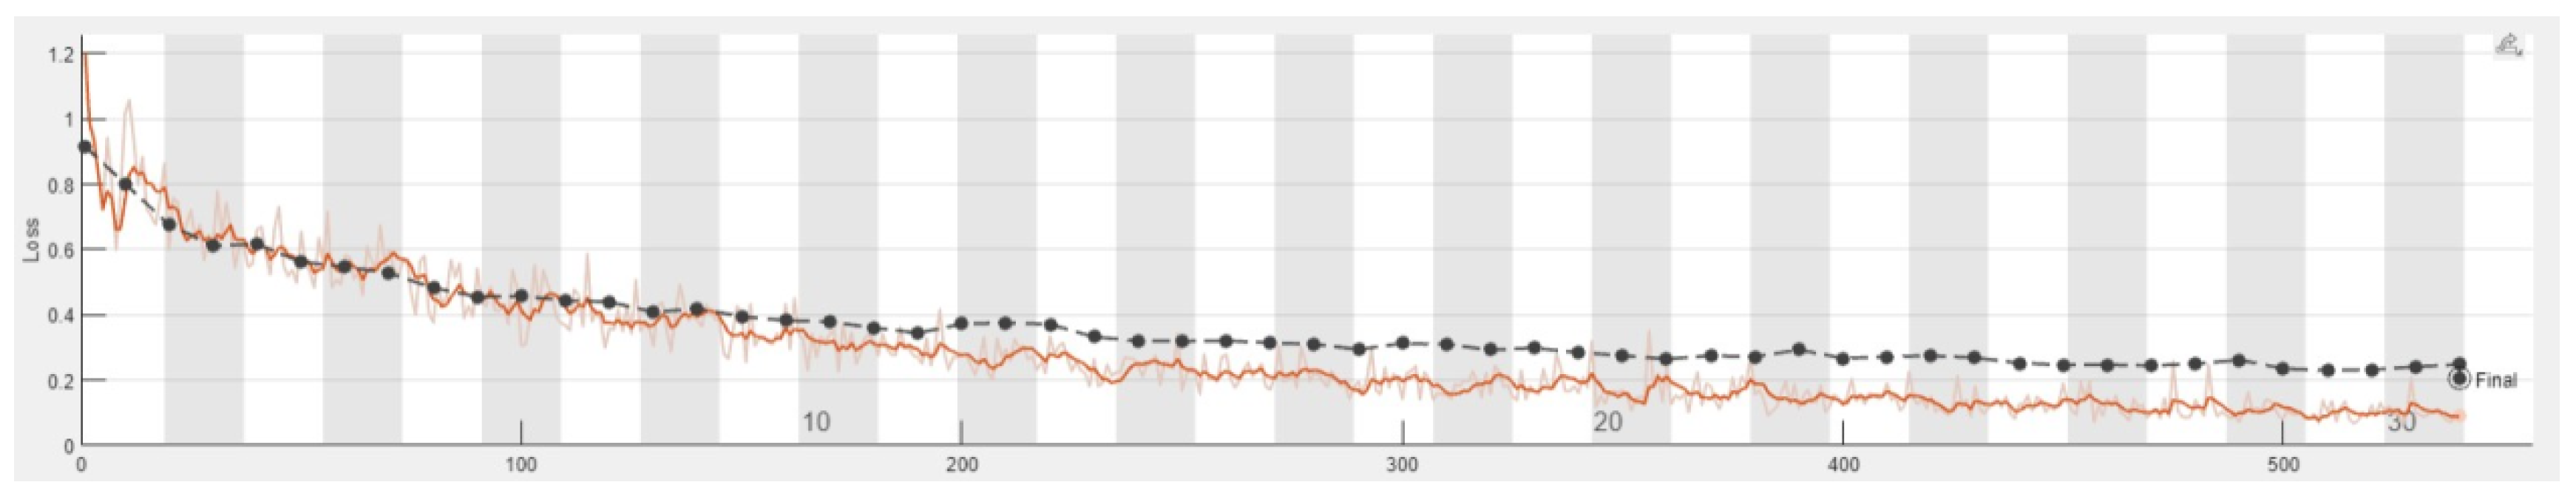
During the training phase, the configuration of hyperparameter combinations plays a crucial role in determining the success of the model. Each parameter represents a different aspect, such as the number of neural network layers, the choice of loss function, the size of convolutional kernels, and the learning rate, among others. This study experimented with various hyperparameter combinations. The details of the best performing parameter set are shown in Table 4.

3. Results and Discussion

This section presents the performance of the proposed CNN model and compares it with the methods proposed in other studies [36]. Additionally, an advanced symptom enhancement method is analyzed. The comparison of the four CNN networks is presented for further discussion of the results. The CNN models are validated by the accuracy rate of both the validation set and the testing dataset. Table 5 provides details about the training process of ShuffleNet, and the specific training steps are shown in Figure 12 and Figure 13. Furthermore, the confusion matrix, as shown in Table 6, is calculated based on the network model. This study’s training results are divided into whether the impacted tooth touches the inferior alveolar nerve. Equations (4)–(6) demonstrate the commonly used metrics for training, including accuracy, recall, and precision.
A c c u r a c y = T p + T n T p + F p + T n + F n
P r e c i s i o n = T p T p + F p
R e c a l l = T p T p + F n
F 1   s c o r e = 2 P r e c i s i o n R e c a l l P r e c i s i o n + R e c a l l
This study utilizes four distinct CNN models for training on the proposed target. Table 7 presents three common model evaluation metrics, including accuracy, recall, and precision. It can be observed from the table that both accuracy and recall achieve an accuracy rate exceeding 85%, and compared to method [37], it can been seen that the precision is higher than [37] 2~5%.
Table 8 demonstrates that the results for the original images fall within the range of 87% to 89%. Through the image enhancement proposed in this study, there is a notable improvement in the accuracy of the CNN training results. The image masking enhancement effectively boosts the training results by 2% to 3%. All four models achieve a judgment accuracy of over 90%.
In this study, a single tooth testing image is obtained using images from a non-training database as shown in Figure 14. Table 9 shows the diagnostic accuracy of whether the IAN in Figure 14 is extruded by an impacted tooth. The accuracy of ShuffleNet reached 93.90%, and the judgment accuracy of the other three models also exceeded 90%. There was a significant improvement of over 6% compared to the technique in reference [36].
In clinical practice, dentists often rely on their experience to visually assess the contact relationship between impacted teeth and the IAN based on DPR images. However, there remains a chance of misjudgment by dentists. Therefore, through the auxiliary system developed in this study, clinicians can now utilize assistance in diagnosing the true contact relationship between impacted teeth and the IAN based on DPR images. If contact between the inferior alveolar nerve and the mandibular third molar is suspected on DPR images, CT images can be used to further identify the inferior alveolar nerve, which provides dentists with more convenient and efficient consultations. Figure 15 explores the relationships between eight sets of mandibular third molars and the inferior alveolar nerve. By utilizing the image localization segmentation algorithm developed in this study along with CNN training models for pathological assessment, it is evident that the judgment results are highly accurate.

4. Conclusions

The primary objective of this study is to accurately determine if impacted teeth compress the inferior alveolar nerve (IAN) using a CNN model. To enhance the precision of the training model, in this research, we initially segmented the entire dental arch into individual images of affected single teeth. During the image segmentation process, a vertical grayscale projection algorithm was employed to identify pixel valleys, leading to a more precise cropping of individual tooth images with an accuracy of up to 93%. Compared to recent research [1], this method improved the cropping accuracy by 2.25%, surpassing the segmentation accuracy of YOLO_v4 (88%). To mitigate noise, the study employs precise calculation of the tilted angle of affected teeth to create a mask for the non-region of interest, retaining only the impacted teeth and the IAN. This approach significantly enhances the CNN model’s training accuracy by 3%. Finally, the study compares the accuracy of four models, with ShuffleNet exhibiting the highest accuracy, achieving a 93.90% accuracy value in determining compression on the inferior alveolar nerve. This marks a 6.4% improvement over state-of-the-art research [2]. In the future, this research aims to enhance medical diagnostic support systems by employing more sophisticated image segmentation models for feature annotation. It will continue to use digital panoramic radiography (DPR) as the initial method for dental symptom recognition. When signs of concern are detected, more detailed and precise diagnosis, such as cone beam computed tomography (CBCT), will be employed, thereby reducing medical resource utilization and contributing to advancements in the field of dentistry.

Author Contributions

Conceptualization, Y.C., S.-L.C., H.-S.C. and Y.-J.L.; data curation, Y.C., K.-C.L., Y.-J.L., T.-H.T., C.-H.P. and A.-Y.T.; formal analysis, T.-Y.C.; funding acquisition, S.-L.C. and C.-A.C.; methodology, H.-S.C., Y.-J.L., T.-H.T., C.-H.P. and A.-Y.T.; resources, C.-A.C., S.-L.C. and K.-C.L.; software, S.-L.C. and Y.-J.L.; supervision, C.-A.C. and S.-L.C.; validation, Y.C., H.-S.C. and T.-Y.C.; visualization, H.-S.C., Y.-J.L., T.-Y.C., T.-H.T., C.-H.P. and A.-Y.T.; writing—original draft, H.-S.C. and Y.-J.L.; writing—review and editing, T.-Y.C. and K.-C.L. All authors have read and agreed to the published version of the manuscript.

Funding

This work was supported by the Ministry of Science and Technology (MOST), Taiwan, under grant numbers MOST-109-2410-H-197-002-MY3, MOST-107-2218-E-131-002, MOST-107-2221-E-033-057, MOST-107-2622-E-131-007-CC3, MOST-106-2622-E-033-014-CC2, MOST-106-2221-E-033-072, MOST-106-2119-M-033-001, MOST 107-2112-M-131-001, and MOST-112-2410-H-033-014 and the National Chip Implementation Center, Taiwan.

Institutional Review Board Statement

Chang Gung Medical Foundation Institutional Review Board; IRB number: 02002030B0; date of approval: 1 December 2020; protocol title: A Convolutional Neural Network Approach for Dental Bite-Wing, Panoramic and Periapical Radiographs Classification; executing institution: Chang-Geng Medical Foundation Taoyuan Chang-Geng Memorial Hospital of Taoyuan; duration of approval: from 1 December 2020 to 30 November 2021. The IRB reviewed the study and determined that it is an expedited review according to case research or cases treated or diagnosed by clinical routines. However, this does not include HIV-positive cases.

Informed Consent Statement

The IRB approved the waiver of the participants’ consent.

Data Availability Statement

The data presented in this study are available in this article.

Acknowledgments

The authors are grateful to the Applied Electrodynamics Laboratory (Department of Physics, National Taiwan University) for the support with the microwave calibration kit and microwave components.

Conflicts of Interest

The authors declare no conflicts of interest.

References

  1. Ton, L.-P.; Le, L.-S.; Nguyen, M.-S. Micraspis: A Computer-Aided Proposal Toward Programming and Architecting Smart IoT Wearables. IEEE Access 2021, 9, 105393–105408. [Google Scholar] [CrossRef]
  2. Ahmad, M.; Alkanhel, R.; El-Shafai, W.; Algarni, A.D.; El-Samie, F.E.A.; Soliman, N.F. Multi-Objective Evolution of Strong S-Boxes Using Non-Dominated Sorting Genetic Algorithm-II and Chaos for Secure Telemedicine. IEEE Access 2022, 10, 112757–112775. [Google Scholar] [CrossRef]
  3. Malysiak-Mrozek, B.; Wieszok, J.; Pedrycz, W.; Ding, W.; Mrozek, D. High-Efficient Fuzzy Querying with HiveQL for Big Data Warehousing. IEEE Trans. Fuzzy Syst. 2022, 30, 1823–1837. [Google Scholar] [CrossRef]
  4. Peres, R.S.; Manta-Costa, A.; Barata, J. Implementing Privacy-Preserving and Collaborative Industrial Artificial Intelligence. IEEE Access 2023, 11, 74579–74589. [Google Scholar] [CrossRef]
  5. Gokyar, S.; Robb, F.J.L.; Kainz, W.; Chaudhari, A.; Winkler, S.A. MRSaiFE: An AI-Based Approach Towards the Real-Time Prediction of Specific Absorption Rate. IEEE Access 2021, 9, 140824–140834. [Google Scholar] [CrossRef] [PubMed]
  6. Zhang, Y.-D.; Satapathy, S.C.; Zhu, L.-Y.; Gorriz, J.M.; Wang, S.-H. A Seven-Layer Convolutional Neural Network for Chest CT-Based COVID-19 Diagnosis Using Stochastic Pooling. IEEE Sens. J. 2022, 22, 17573–17582. [Google Scholar] [CrossRef] [PubMed]
  7. Cattari, N.; Condino, S.; Cutolo, F.; Ghilli, M.; Ferrari, M.; Ferrari, V. Wearable AR and 3D Ultrasound: Towards a Novel Way to Guide Surgical Dissections. IEEE Access 2021, 9, 156746–156757. [Google Scholar] [CrossRef]
  8. Mikada, T.; Kanno, T.; Kawase, T.; Miyazaki, T.; Kawashima, K. Suturing Support by Human Cooperative Robot Control Using Deep Learning. IEEE Access 2020, 8, 167739–167746. [Google Scholar] [CrossRef]
  9. Yadalam, P.K.; Trivedi, S.S.; Krishnamurthi, I.; Anegundi, R.V.; Mathew, A.; Al Shayeb, M.; Narayanan, J.K.; Jaberi, M.A.; Rajkumar, R. Machine Learning Predicts Patient Tangible Outcomes after Dental Implant Surgery. IEEE Access 2022, 10, 131481–131488. [Google Scholar] [CrossRef]
  10. Chuo, Y.; Lin, W.-M.; Chen, T.-Y.; Chan, M.-L.; Chang, Y.-S.; Lin, Y.-R.; Lin, Y.-J.; Shao, Y.-H.; Chen, C.-A.; Chen, S.-L.; et al. A High-Accuracy Detection System: Based on Transfer Learning for Apical Lesions on Periapical Radiograph. Bioengineering 2022, 9, 777. [Google Scholar] [CrossRef]
  11. Chen, Y.-C.; Chen, M.-Y.; Chen, T.-Y.; Chan, M.-L.; Huang, Y.-Y.; Liu, Y.-L.; Lee, P.-T.; Lin, G.-J.; Li, T.-F.; Chen, C.-A.; et al. Improving Dental Implant Outcomes: CNN-Based System Accurately Measures Degree of Peri-Implantitis Damage on Periapical Film. Bioengineering 2023, 10, 640. [Google Scholar] [CrossRef] [PubMed]
  12. Mao, Y.-C.; Huang, Y.-C.; Chen, T.-Y.; Li, K.-C.; Lin, Y.-J.; Liu, Y.-L.; Yan, H.-R.; Yang, Y.-J.; Chen, C.-A.; Chen, S.-L.; et al. Deep Learning for Dental Diagnosis: A Novel Approach to Furcation Involvement Detection on Periapical Radiographs. Bioengineering 2023, 10, 802. [Google Scholar] [CrossRef] [PubMed]
  13. Różyło-Kalinowska, I. Panoramic radiography in dentistry. Clin. Dent. Rev. 2021, 5, 26. [Google Scholar] [CrossRef]
  14. Huang, Y.-C.; Chen, C.-A.; Chen, T.-Y.; Chou, H.-S.; Lin, W.-C.; Li, T.-C.; Yuan, J.-J.; Lin, S.-Y.; Li, C.-W.; Chen, S.-L.; et al. Tooth Position Determination by Automatic Cutting and Marking of Dental Panoramic X-ray Film in Medical Image Processing. Appl. Sci. 2021, 11, 11904. [Google Scholar] [CrossRef]
  15. Chen, S.-L.; Chen, T.-Y.; Mao, Y.-C.; Lin, S.-Y.; Huang, Y.-Y.; Chen, C.-A.; Lin, Y.-J.; Hsu, Y.-M.; Li, C.-A.; Chiang, W.-Y.; et al. Automated Detection System Based on Convolution Neural Networks for Retained Root, Endodontic Treated Teeth, and Implant Recognition on Dental Panoramic Images. IEEE Sens. J. 2022, 22, 23293–23306. [Google Scholar] [CrossRef]
  16. Gurses, A.; Oktay, A.B. Tooth Restoration and Dental Work Detection on Panoramic Dental Images via CNN. In Proceedings of the 2020 Medical Technologies Congress (TIPTEKNO), Antalya, Turkey, 19–20 November 2020; IEEE: New York, NY, USA, 2020; pp. 1–4. [Google Scholar] [CrossRef]
  17. Clé-Ovejero, A.; Sánchez-Torres, A.; Camps-Font, O.; Gay-Escoda, C.; Figueiredo, R.; Valmaseda-Castellón, E. Does 3-dimensional imaging of the third molar reduce the risk of experiencing inferior alveolar nerve injury owing to extraction?: A meta-analysis. J. Am. Dent. Assoc. 2017, 148, 575–583. [Google Scholar] [CrossRef]
  18. Ghaeminia, H.; Gerlach, N.; Hoppenreijs, T.; Kicken, M.; Dings, J.; Borstlap, W.; de Haan, T.; Bergé, S.; Meijer, G.; Maal, T. Clinical relevance of cone beam computed tomography in mandibular third molar removal: A multicentre, randomised, controlled trial. J. Cranio-Maxillofac. Surg. 2015, 43, 2158–2167. [Google Scholar] [CrossRef]
  19. Joo, Y.; Moon, S.-Y.; Choi, C. Classification of the Relationship Between Mandibular Third Molar and Inferior Alveolar Nerve Based on Generated Mask Images. IEEE Access 2023, 11, 81777–81786. [Google Scholar] [CrossRef]
  20. Zhan, C.; Huang, M.; Yang, X.; Hou, J. Dental nerves: A neglected mediator of pulpitis. Int. Endod. J. 2021, 54, 85–99. [Google Scholar] [CrossRef]
  21. Santosh, P. Impacted mandibular third molars: Review of literature and a proposal of a combined clinical and radiological classification. Ann. Med. Health Sci. Res. 2015, 5, 229–234. [Google Scholar] [CrossRef]
  22. Gong, Y.; Peng, J.; Jin, S.; Li, X.; Tan, Y.; Jia, Z. Research on YOLOv4 Traffic Sign Detection Algorithm Based on Deep Separable Convolution. In Proceedings of the 2021 IEEE International Conference on Emergency Science and Information Technology (ICESIT), Chongqing, China, 22–24 November 2021; IEEE: New York, NY, USA, 2021; pp. 333–336. [Google Scholar] [CrossRef]
  23. Ren, S.; He, K.; Girshick, R.; Sun, J. Faster R-CNN: Towards Real-Time Object Detection with Region Proposal Networks. arXiv 2016, arXiv:1506.01497. [Google Scholar] [CrossRef]
  24. Chen, S.-L.; Chen, T.-Y.; Huang, Y.-C.; Chen, C.-A.; Chou, H.-S.; Huang, Y.-Y.; Lin, W.-C.; Li, T.-C.; Yuan, J.-J.; Abu, P.A.R.; et al. Missing Teeth and Restoration Detection Using Dental Panoramic Radiography Based on Transfer Learning with CNNs. IEEE Access 2022, 10, 118654–118664. [Google Scholar] [CrossRef]
  25. Panetta, K.; Shreyas Kamath, K.M.; Rao, S.P.; Agaian, S.S. Deep Perceptual Image Enhancement Network for Exposure Restoration. IEEE Trans. Cybern. 2023, 53, 4718–4731. [Google Scholar] [CrossRef]
  26. Krizhevsky, A. One Weird Trick for Parallelizing Convolutional Neural Networks. arXiv 2014, arXiv:1404.5997. [Google Scholar]
  27. Szegedy, C.; Liu, W.; Jia, Y.; Sermanet, P.; Reed, S.; Anguelov, D.; Erhan, D.; Vanhoucke, V.; Rabinovich, A.; Liu, W.; et al. Going deeper with convolutions. In Proceedings of the 2015 IEEE Conference on Computer Vision and Pattern Recognition (CVPR), Boston, MA, USA, 7–12 June 2015; IEEE: New York, NY, USA, 2015; pp. 1–9. [Google Scholar] [CrossRef]
  28. Szegedy, C.; Vanhoucke, V.; Ioffe, S.; Shlens, J.; Wojna, Z. Rethinking the Inception Architecture for Computer Vision. arXiv 2015, arXiv:1512.00567. [Google Scholar]
  29. Lawry, J. A voting mechanism for fuzzy logic. Int. J. Approx. Reason. 1998, 19, 315–333. [Google Scholar] [CrossRef]
  30. Young, S.I.; Girod, B.; Taubman, D. Gaussian Lifting for Fast Bilateral and Nonlocal Means Filtering. IEEE Trans. Image Process. 2020, 29, 6082–6095. [Google Scholar] [CrossRef] [PubMed]
  31. Yelmanov, S.; Romanyshyn, Y. Image Enhancement in Automatic Mode by Piecewise NonLinear Contrast Stretching. In Proceedings of the 2018 IEEE First International Conference on System Analysis & Intelligent Computing (SAIC), Kyiv, Ukraine, 8–12 October 2018; pp. 1–6. [Google Scholar] [CrossRef]
  32. Liao, M.; Zou, Z.; Wan, Z.; Yao, C.; Bai, X. Real-Time Scene Text Detection with Differentiable Binarization and Adaptive Scale Fusion. IEEE Trans. Pattern Anal. Mach. Intell. 2023, 45, 919–931. [Google Scholar] [CrossRef] [PubMed]
  33. Kisacanin, B.; Schonfeld, D. A fast thresholded linear convolution representation of morphological operations. IEEE Trans. Image Process. 1994, 3, 455–457. [Google Scholar] [CrossRef] [PubMed]
  34. Ochotorena, C.N.; Yamashita, Y. Anisotropic Guided Filtering. IEEE Trans. Image Process. 2020, 29, 1397–1412. [Google Scholar] [CrossRef] [PubMed]
  35. Xu, Q.; Varadarajan, S.; Chakrabarti, C.; Karam, L.J. A Distributed Canny Edge Detector: Algorithm and FPGA Implementation. IEEE Trans. Image Process. 2014, 23, 2944–2960. [Google Scholar] [CrossRef] [PubMed]
  36. Lin, N.-H.; Lin, T.-L.; Wang, X.; Kao, W.-T.; Tseng, H.-W.; Chen, S.-L.; Chiou, Y.-S.; Lin, S.-Y.; Villaverde, J.F.; Kuo, Y.-F. Teeth Detection Algorithm and Teeth Condition Classification Based on Convolutional Neural Networks for Dental Panoramic Radiographs. J. Med. Imaging Health Inform. 2018, 8, 507–515. [Google Scholar] [CrossRef]
  37. Zhu, T.; Chen, D.; Wu, F.; Zhu, F.; Zhu, H. Artificial Intelligence Model to Detect Real Contact Relationship between Mandibular Third Molars and Inferior Alveolar Nerve Based on Panoramic Radiographs. Diagnostics 2021, 11, 1664. [Google Scholar] [CrossRef] [PubMed]
Figure 1. DPR image in which the red circle encompasses the impacted tooth and the inferior alveolar nerve.
Electronics 13 00702 g001
Figure 2. Research flowchart.
Electronics 13 00702 g002
Figure 3. Image segmentation: (a) region segmentation and (b) the lower teeth using masking.
Electronics 13 00702 g003
Figure 4. The Gaussian high-pass filter result.
Electronics 13 00702 g004
Figure 5. Images after contrast stretching (a), histogram equalization (b), square balancing (c), flat field correction (d), and adaptive histogram equalization.
Electronics 13 00702 g005
Figure 6. The binarization result.
Electronics 13 00702 g006
Figure 7. Morphological operation results after (a) median filtering and (b) opening operation.
Electronics 13 00702 g007
Figure 8. Vertical grayscale projection algorithm (a), vertical grayscale projection, (b) left impacted tooth, and (c) right impacted tooth.
Electronics 13 00702 g008
Figure 9. The results of YOLO_V4 detection for impacted teeth and the position of the IAN.
Electronics 13 00702 g009
Figure 10. The single tooth enhances preprocessing.
Electronics 13 00702 g010
Figure 11. Masking result: (a) lines on both sides of the impacted tooth and (b) the mask for the adjacent non-impacted tooth area.
Electronics 13 00702 g011
Figure 12. The training process of the ShuffleNet model.
Electronics 13 00702 g012
Figure 13. The training loss process for ShuffleNet.
Electronics 13 00702 g013
Figure 14. Single tooth testing image.
Electronics 13 00702 g014
Figure 15. Validation in the relationship between the impacted tooth and the IAN.
Electronics 13 00702 g015
Table 1. The comparison of impacted tooth position.
MethodThis Study AlgorithmYOLO_V4Method [19]
Accuracy93.15%88.13%90.9%
Table 2. The hardware and software platform.
HardwareSpecifications
CPUIntel(R) core i7-8700
GPUNVIDIA GeForce GTX 1060
DRAM32 GB
MATLABR2022b
Deep Network designer14.5
Table 3. The input and output of ShuffleNet model.
LayerOutput SizeKSizeStrideRepeatOutput Channels
0.5×
Image224 × 224 3333
Conv1
Max Pool
112 × 1123 × 32124242424
56 × 563 × 32
Stage228 × 28 2148116176224
28 × 2813
Stage314 × 14 2196232353488
14 × 1417
Stage47 × 7 21192464704976
7 × 713
Conv57 × 71 × 1111024102410241024
Global Pool1 × 17 × 7
Fc 2222
Table 4. Hyperparameter in the CNN model.
HyperparameterValue
Initial Learning Rate0.0001
Max Epoch30
Mini Batch Size32
Validation Frequency10
Learning Drop Period10
Learning Rate Drop Factor0.1
Table 5. The SuffleNet training process.
EpochIterationTime ElapsedMini-BatchValidation
1100:00:0353.12%51.63%
59000:00:43100.00%83.01%
1020000:01:31100.00%84.31%
1531000:02:20100.00%84.64%
2042000:03:08100.00%86.93%
2553000:03:57100.00%87.95%
3064000:04:45100.00%89.92%
Table 6. SuffleNet confusion matrix.
Not TouchTouch
Not touch43.5 (Tp)2.9 (Fp)93.7%
Touch7.2 (Tn)46.4 (Tn)86.6%
85.8%94.0%89.9%
Table 7. Training result evaluation metrics.
AlexNetGoogleNetShuffleNetMobileNet v2 Method in [37]
Accuracy89.24%91.63%91.63%92.43%85.05%
Precision88.70%92.74%93.54%93.54%87.18%
Recall89.43%90.55%89.92%91.33%82.93%
Table 8. CNN training result after image enhancement.
AlexNetGoogleNetShuffleNetMobileNet V2
Original87.58%87.58%89.90%89.54%
F1-score87.35%87.47%89.46%89.53%
Training time3:253:044:494:58
After masking90.24%91.63%91.63%92.43%
F1-score89.06%91.63%91.69%92.42%
Training time3′302′585′325′46
Table 9. Comparison with other research.
AlexNetGoogleNetShuffleNetMobileNet v2Method in [36]
Accuracy93.51%93.48%93.90%93.42%87.20
Disclaimer/Publisher’s Note: The statements, opinions and data contained in all publications are solely those of the individual author(s) and contributor(s) and not of MDPI and/or the editor(s). MDPI and/or the editor(s) disclaim responsibility for any injury to people or property resulting from any ideas, methods, instructions or products referred to in the content.

