Article

EnNuSegNet: Enhancing Weakly Supervised Nucleus Segmentation through Feature Preservation and Edge Refinement

1
Hubei Key Laboratory of Intelligent Vision Based Monitoring for Hydroelectric Engineering, China Three Gorges University, Yichang 443002, China
2
College of Computer and Information Technology, China Three Gorges University, Yichang 443002, China
3
Yichang Power Supply Company, State Grid Hubei Electric Power Co., Ltd., Yichang 443002, China
*
Author to whom correspondence should be addressed.
Electronics 2024, 13(3), 504; https://doi.org/10.3390/electronics13030504
Submission received: 13 December 2023 / Revised: 19 January 2024 / Accepted: 23 January 2024 / Published: 25 January 2024
(This article belongs to the Special Issue Revolutionizing Medical Image Analysis with Deep Learning)

Abstract

:
Nucleus segmentation plays a crucial role in tissue pathology image analysis. Despite significant progress in cell nucleus image segmentation algorithms based on fully supervised learning, the large number and small size of cell nuclei pose a considerable challenge in terms of the substantial workload required for label annotation. This difficulty in acquiring datasets has become exceptionally challenging. This paper proposes a novel weakly supervised nucleus segmentation method that only requires point annotations of the nuclei. The technique is an encoder–decoder network which enhances the weakly supervised nucleus segmentation performance (EnNuSegNet). Firstly, we introduce the Feature Preservation Module (FPM) in both encoder and decoder, which preserves more low-level features from the shallow layers of the network during the early stages of training while enhancing the network’s expressive capability. Secondly, we incorporate a Scale-Aware Module (SAM) in the bottleneck part of the network to improve the model’s perception of cell nuclei at different scales. Lastly, we propose a training strategy for nucleus edge regression (NER), which guides the model to optimize the segmented edges during training, effectively compensating for the loss of nucleus edge information and achieving higher-quality nucleus segmentation. Experimental results on two publicly available datasets demonstrate that our proposed method outperforms state-of-the-art approaches, with improvements of 2.02%, 1.41%, and 1.59% in terms of F1 score, Dice coefficient, and Average Jaccard Index (AJI), respectively. This indicates the effectiveness of our method in improving segmentation performance.

1. Introduction

Pathological examination results serve as the gold standard for cancer diagnosis. Cell nuclei carry crucial pathological information, and traditional pathological examination methods require pathologists to manually search for regions of cell nucleus lesions and then make judgments. This process often consumes a significant amount of time and concentration, making pathologists prone to fatigue and misdiagnosis. Therefore, there is a strong interest in computer-aided diagnosis in the field of computational pathology [1], aiming to improve the efficiency and accuracy of pathological diagnosis.
Automated segmentation of cell nuclei images is an important step in computer-aided pathological diagnosis. Several methods for automated nucleus segmentation have been proposed in the literature [2,3,4,5,6,7], greatly advancing the development of computer-aided diagnosis in the field of computational pathology. For example, Wang et al. [2] significantly improved cell segmentation performance by incorporating gene expression information and imaging information, and they employed a recursive training strategy to correct incorrect labels, addressing the challenge of noisy training labels, which has guiding significance for subsequent work. Naylor et al. [3] formulated the segmentation problem as a regression task of distance mapping and used convolutional neural networks (CNN) to segment cell nuclei from histopathological images. Aatresh et al. [4] introduced a novel CNN architecture for nucleus segmentation. Kiran et al. [5] proposed a deep learning framework with dense blocks and residual connections to effectively address the segmentation of overlapping cell nuclei. In cell nucleus image segmentation, methods based on CNN have achieved competitive results. In recent years, Ahmad et al. [6] improved the UNet architecture with spatial channel attention, enhancing cell nucleus segmentation performance by addressing tissue variability. Hancer et al. [7] designed a novel preprocessing scheme and a lightweight UNet architecture, effectively improving cell nucleus segmentation performance. However, the performance of the aforementioned studies heavily relies on the scale of the dataset and the quality of the labels. Unfortunately, unlike natural images, histopathology images contain thousands of cell nuclei, making it extremely challenging to acquire high-quality pixel-level labeled datasets for pathology images.
Due to the difficulty in obtaining pixel-level labeled datasets, weakly supervised learning [8] has gained significant attention. Weakly supervised learning allows for the use of simpler labels instead of pixel-level labeled to perform segmentation tasks. As shown in Figure 1, the annotations in fully supervised learning are pixel-level mask annotations, while weakly supervised learning labels are relatively simpler and often take the form of image-level annotations [9], point annotations [10], bounding box annotations [11], or scribble annotations [12]. Point annotations are easier to obtain but contain relatively limited information, which is insufficient for comprehensive model training. Researchers have become interested in this problem and have proposed various methods to address it. For example, Qu et al. [13] derived two types of pixel-level coarse labels, voronoi labels and cluster labels, from point annotations, which provide valuable information for segmentation training, although the quality of these derived labels is not as high as pixel-level labels. Unlike Qu et al., Yoo et al. [14] first use point annotations for cell nucleus detection and then employ a shallow CNN to effectively activate the edge information of cell nuclei for weakly supervised segmentation. Nishimura et al. [15] train a CNN with point annotations to estimate cell nucleus likelihood maps. They then use region-based backpropagation to extract cell nucleus relevance maps and combine them with graph-cut techniques for segmentation. These methods were among the first to utilize point annotations for cell nucleus image segmentation, significantly reducing the annotation cost of cell nucleus image datasets. However, these methods did not consider the complexity of cell nucleus images, resulting in a limited ability to distinguish cell nucleus regions from the background and leaving room for improvement in segmentation accuracy.
Subsequently, Liu et al. [16] proposed a two-stage method that achieved satisfactory segmentation results by training the network with instance-sensitive loss. Recently, Lin et al. [17] introduced an exponential moving average strategy in co-training to achieve more stable and accurate supervision. These methods can learn more semantic features in complex cell nucleus images and effectively improve nucleus segmentation. However, these methods did not address the issue of point annotations missing cell nucleus edge information, which hinders high-quality segmentation. Additionally, they did not consider the variations in size and shape among different cell nuclei, which negatively impacts nucleus segmentation.
To address the aforementioned issues, this paper proposes an encoder–decoder network which enhances the weakly supervised nucleus segmentation performance (EnNuSegNet). Firstly, considering the variations in cell nucleus shape and color across different images, we generate voronoi labels and cluster labels from the point annotations to overcome the lack of effective supervision information during network training. Considering the complexity of cell nucleus images, we optimized the generation process of cluster labels to adapt to the variations in shape and color of different cell nuclei. Secondly, we introduce Feature Preservation Module (FPM) and Scale-Aware Module (SAM) in EnNuSegNet to address the challenge of preserving low-level features such as cell nucleus shape and size during training, enhancing the model’s scale awareness of cell nuclei. Additionally, we incorporate the Nucleus Edge Regression Module (NER) to optimize the cell nucleus edges during training, compensating for the loss of cell nucleus edge information. We conducted experiments on the MultiOrgan and TNBC datasets to evaluate the proposed method. The experimental results demonstrate that our method achieves higher-quality segmentation performance compared to existing state-of-the-art methods.
The main contributions of this paper are as follows:
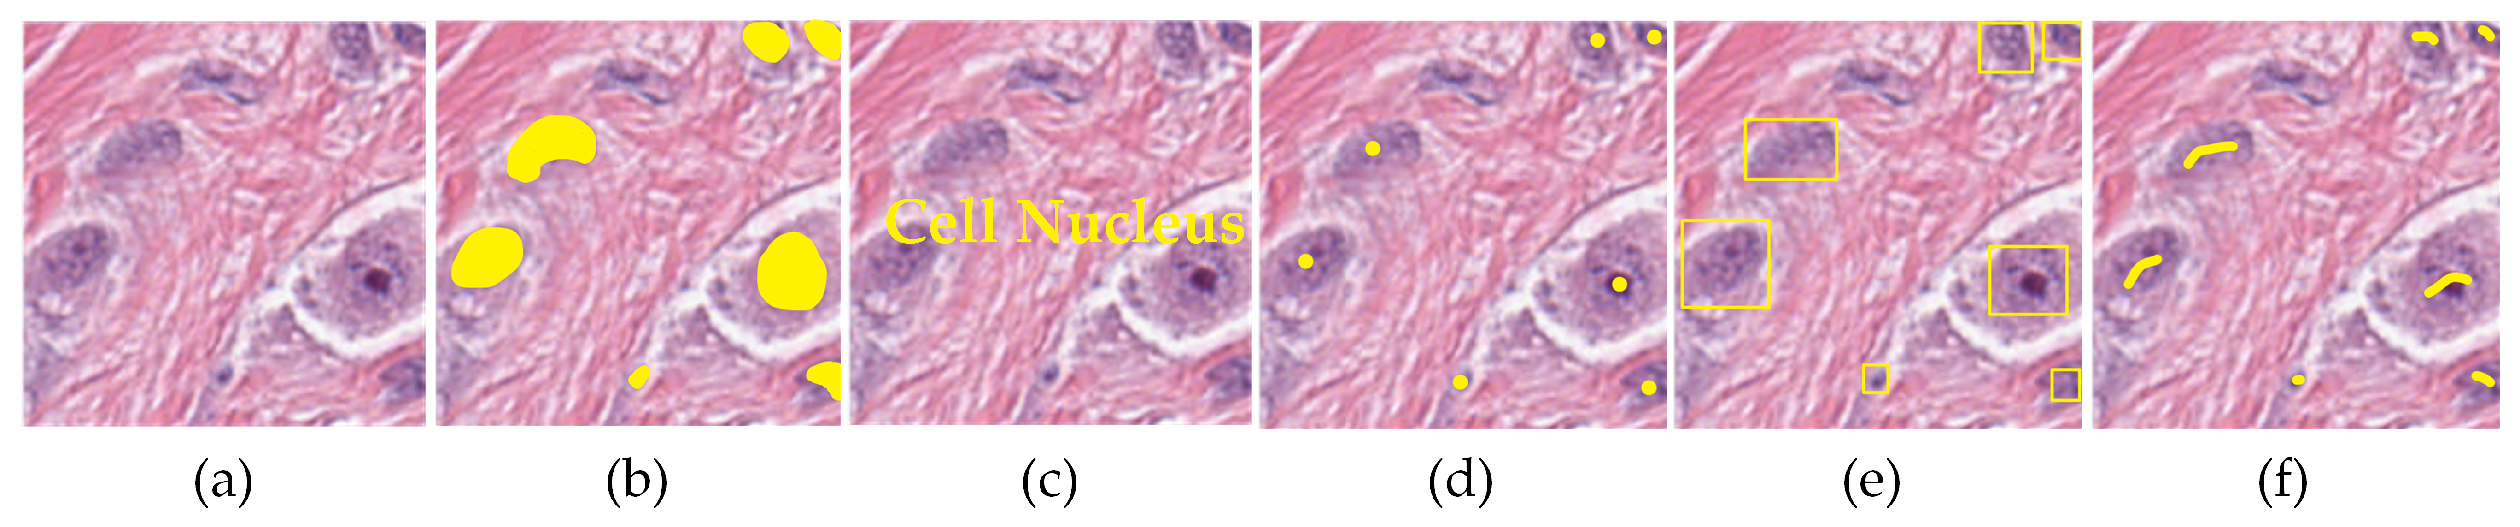
  • In response to the labor-intensive and time-consuming nature of pixel-level annotation, we propose a weakly supervised cell nucleus image segmentation method that solely relies on point annotation.
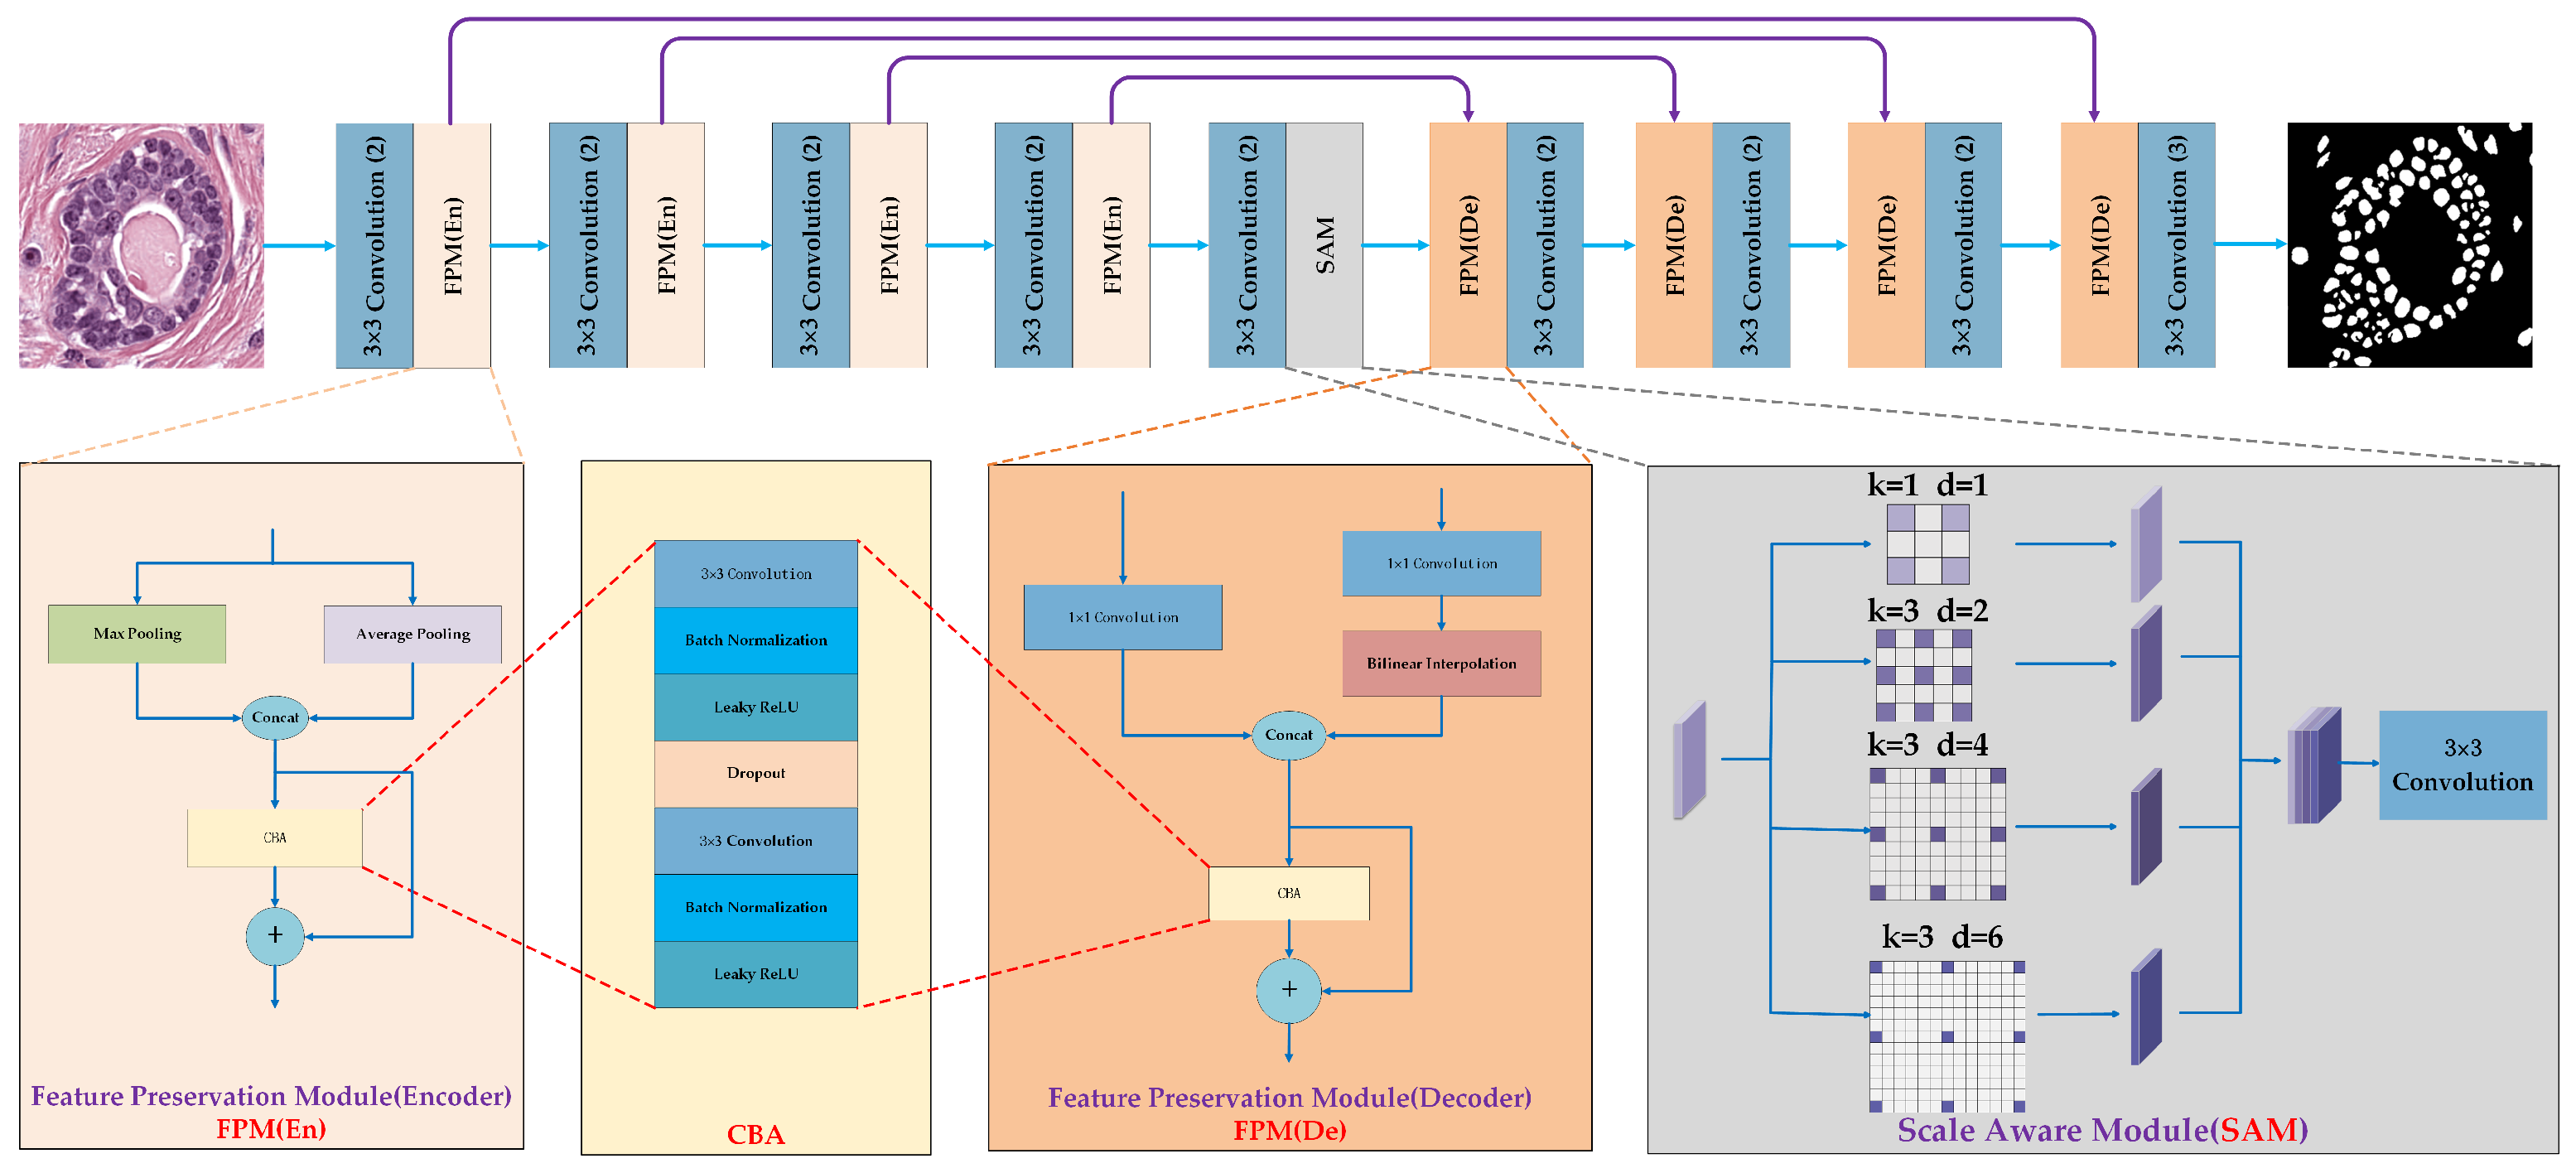
  • To fully exploit the information provided by point annotations, we introduce a novel network structure, including the Feature Preservation Module (FPM) and Scale-Aware Module (SAM), enhancing segmentation performance under weak supervision conditions.
  • To effectively segment the edges of cell nuclei under weakly supervised conditions, we propose the Nucleus Edge Regression module (NER) to guide the model in further optimizing segmentation results.

2. Related Work

2.1. Weakly Supervised Learning

Weakly supervised learning aims to train models using limited or incomplete labeling information. Unlike fully supervised learning, weakly supervised learning does not require accurate labels for every training sample. Weakly supervised learning methods can be implemented through different annotation approaches, including image-level annotation, point annotation, bounding box annotation, and scribble annotation, among others.
Researchers have proposed different weakly supervised segmentation methods to address different types of weakly supervised labels. For image-level labels, the labels only indicate the presence or absence of a specific object. Wang et al. [18] introduce a co-attention classification network for image-level weakly supervised semantic segmentation, which exploits cross-image semantic relations, employing two neural co-attentions to capture both shared and unique semantics. This not only enhances object pattern learning but also improves object localization map inference, showcasing its efficacy in discovering comprehensive object regions. Most of the studies are similar to the approach proposed by Ahn et al. [19]. First, generate seed regions using class activation maps and then propagate the information from these seed regions to the entire image, generating pseudo labels for training. Unlike methods relying on image-level labels, some works annotate labels using points, bounding boxes, scribbles, etc., incurring additional partial annotation costs and providing positional information for the targets. This represents a trade-off between segmentation performance and the difficulty of label annotation. For instance, Bearman et al. [20] proposed a method for segmentation using point labels and introduced prior knowledge in the loss function to infer the object extent. Dai et al. [21] presented a method that only requires bounding box annotations for segmentation. The basic idea is to generate pseudo segmentation labels using the bounding box annotations and assign semantic class labels to all pixels inside the bounding boxes, thereby training a CNN with pseudo labels. Vernaza et al. [22] employed scribble-level annotations and achieved semantic segmentation of images using a random walk label propagation mechanism. These methods utilize techniques such as class activation maps, region proposal generation, and random walk label propagation to generate segmentation labels and train models, achieving good segmentation results in natural images. Compared to natural images, cell nucleus image data is larger and more complex, making the research on weakly supervised cell nucleus image segmentation highly urgent.

2.2. Weakly Supervised Cell Nucleus Image Segmentation
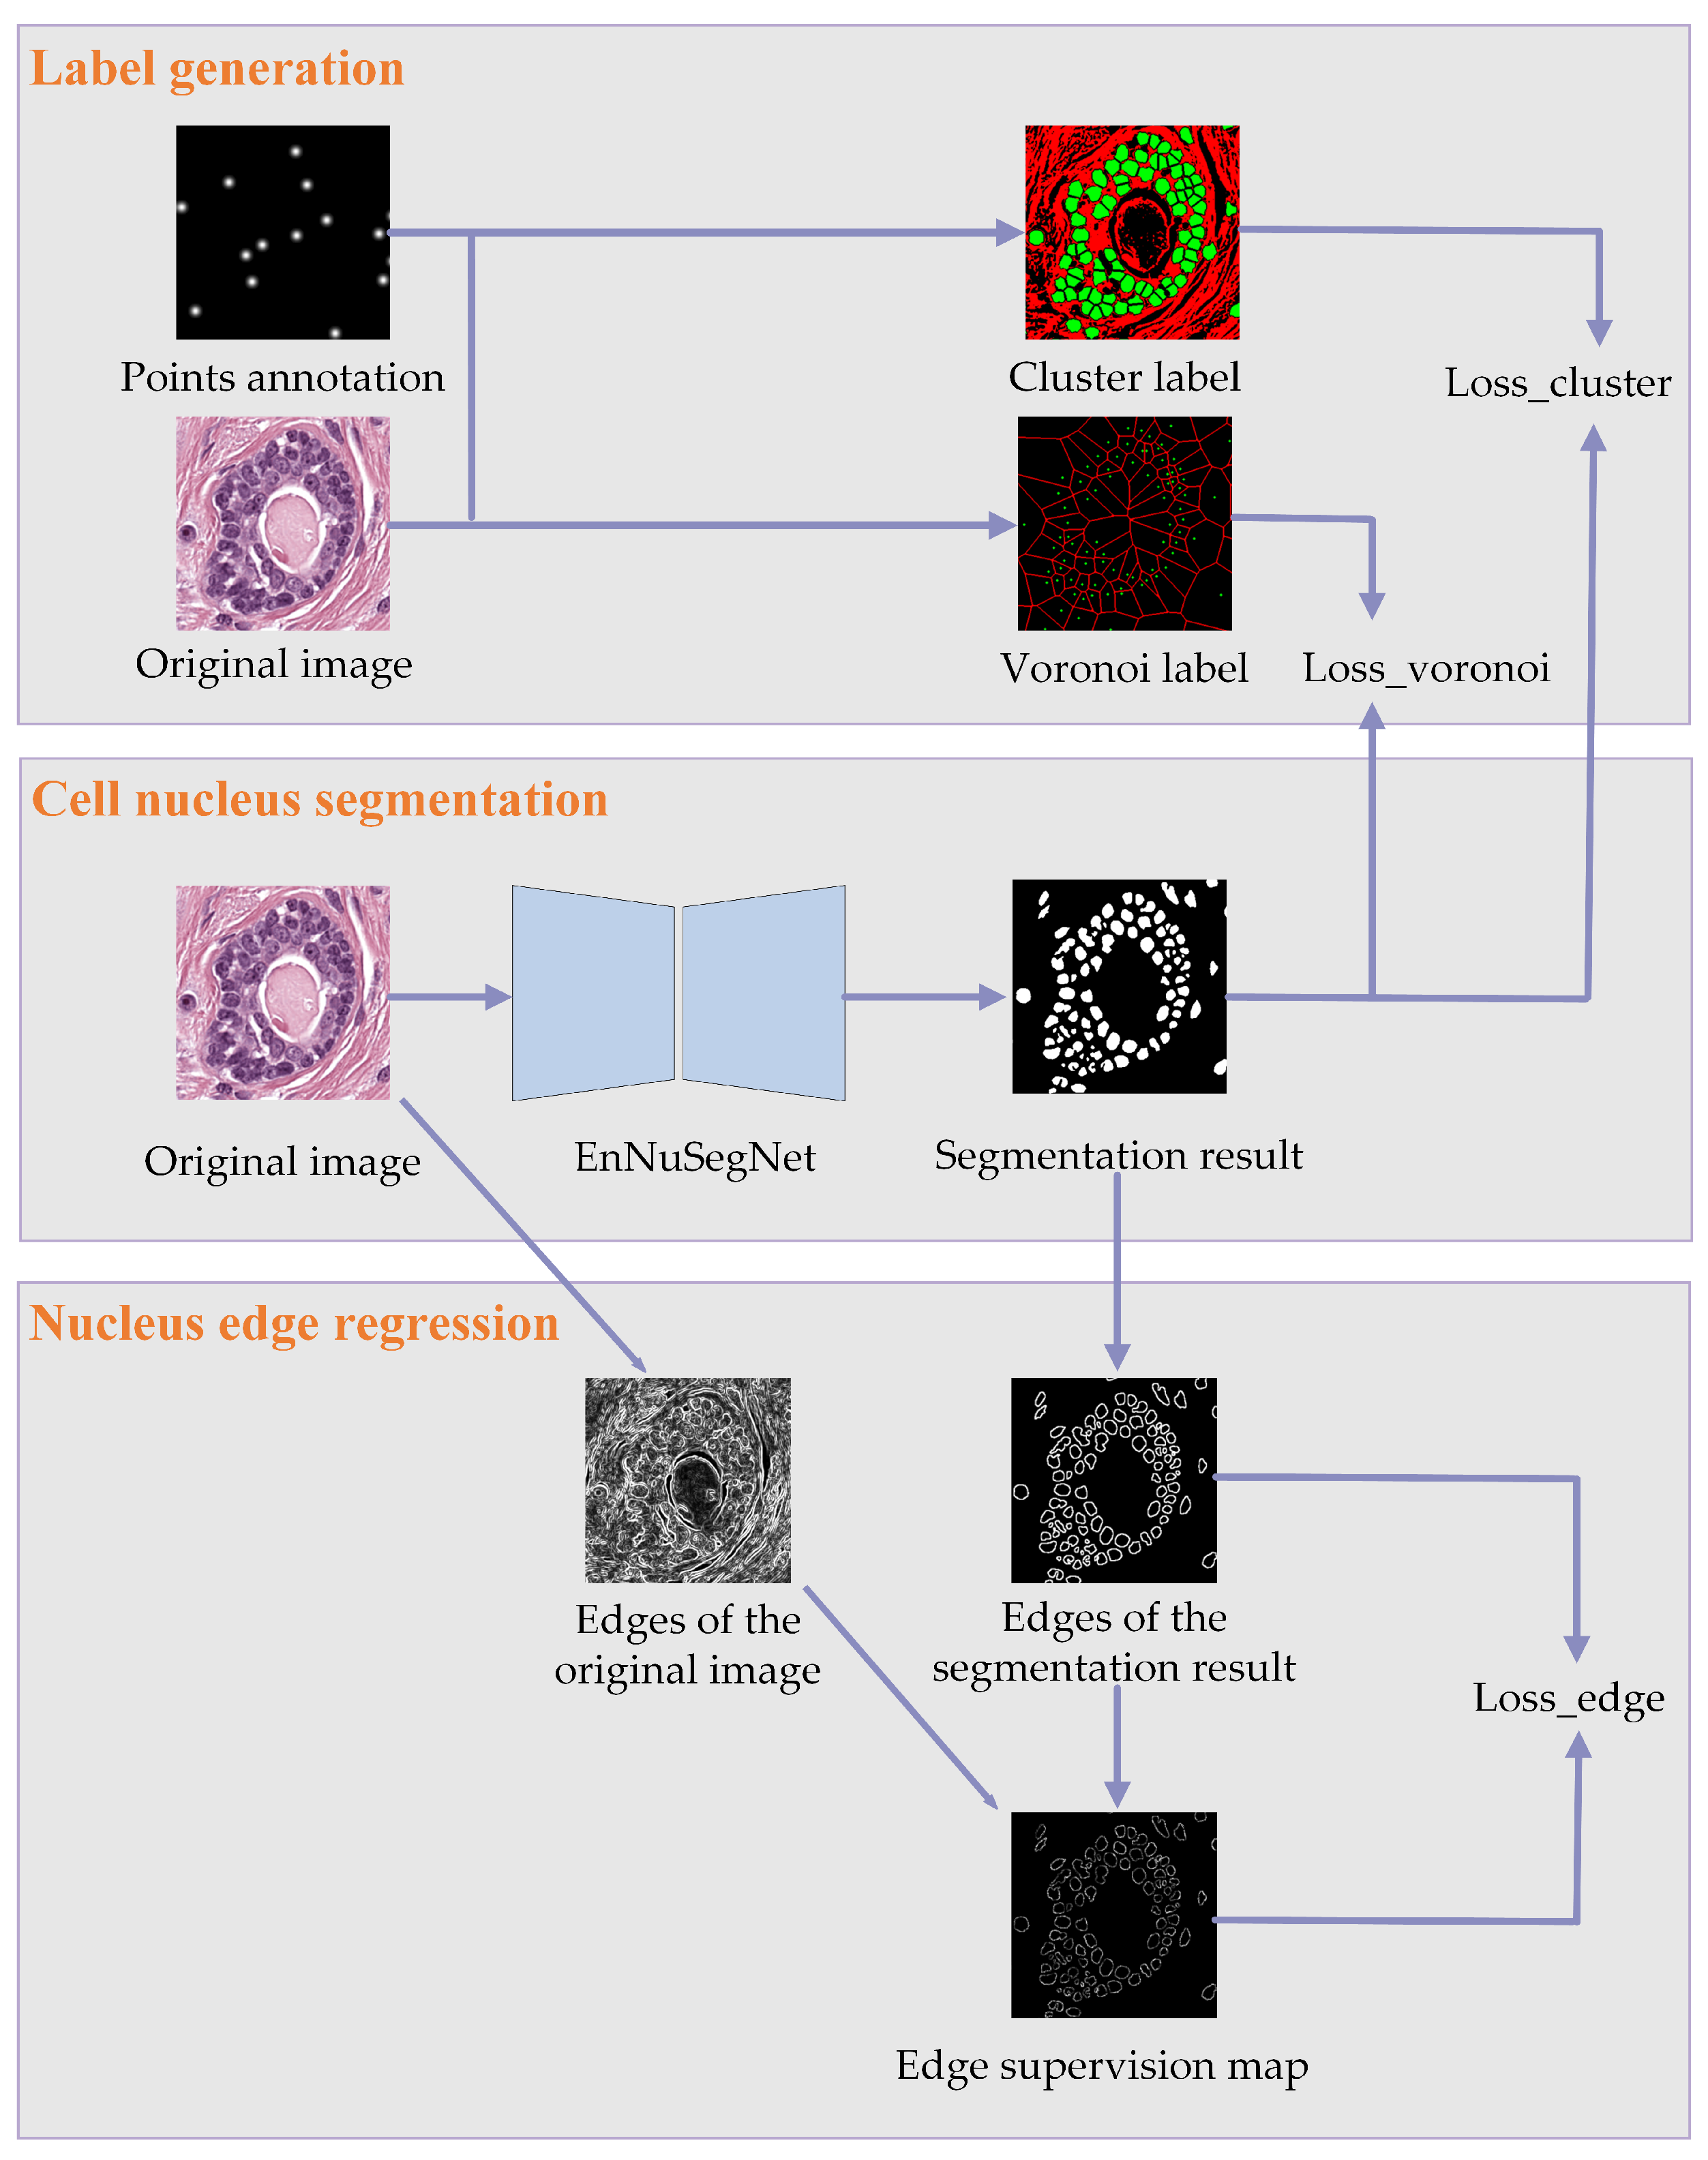
Pixel-level labeling has severely hindered the development of cell nucleus image segmentation. To address the challenges of annotation difficulty and time consumption in fully supervised learning, researchers have applied weakly supervised learning methods to accomplish cell nucleus image segmentation tasks. Feng et al. [23] proposed a weakly supervised learning framework that utilizes image-level annotations. By combining class activation mapping with multiple instance learning, they generated pseudo segmentation labels and trained the model, minimizing the burden of annotation. Zhao et al. [24] used bounding box annotations to predict instance positions and probabilities, incorporating a small amount of fully annotated data to optimize training during the segmentation process. In contrast to Zhao et al., Khalid et al. [25] combined bounding box and point annotations to further reduce the annotation workload at the expense of increased training difficulty. Lee et al. [26] achieved weakly supervised cell nucleus segmentation by combining pseudo labels with a consistency strategy that involves label filtering, utilizing a small number of scribble-level annotations.
Different from the aforementioned methods, our approach utilizes point annotations for cell nucleus image segmentation. Point annotations not only greatly alleviate the annotation pressure but also provide information about the location of cell nuclei. Therefore, the majority of the research in this field is based on point annotations [13,14,15,16,17]. In the study by Chen et al. [27], point annotations were used as prior knowledge to learn hierarchical features, which enabled the representation and classification of pixels and superpixels in the image, effectively segmenting different cell nuclei. Guo et al. [28] generated Voronoi labels and superpixel labels using point annotations and trained a segmentation model using a two-stage refinement framework. In contrast to the aforementioned methods, our approach focuses on addressing the issue of edge information loss during the training process and improving the segmentation capability of the model for cell nuclei of different shapes and sizes.

3. Methods

The overall architecture of the proposed method in this paper is illustrated in Figure 2, which consists of three main parts: label generation, nucleus segmentation, and nucleus edge regression. In the label generation part, two types of labels are generated from nucleus point annotations for training purposes. In the nucleus segmentation part, a segmentation network is constructed to perform the segmentation of cell nucleus images. In the nucleus edge regression stage, further optimization is applied to refine the segmentation results. The following sections will provide a detailed description of the three parts of the proposed method in this paper.

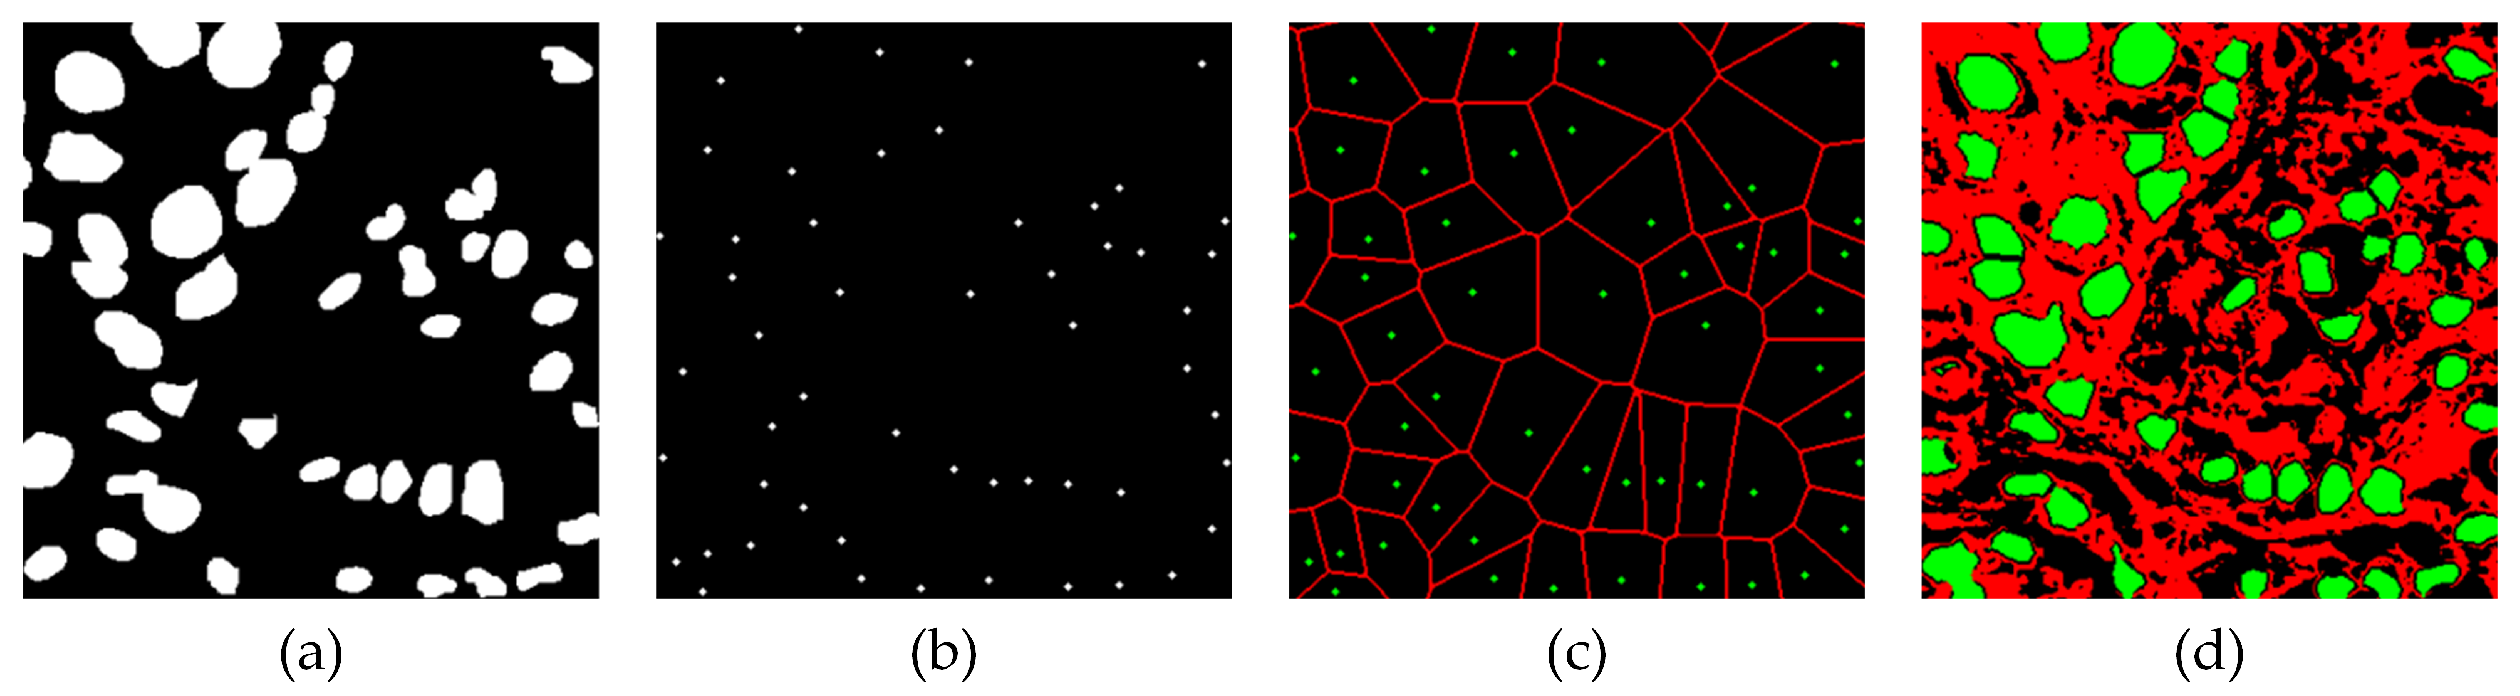
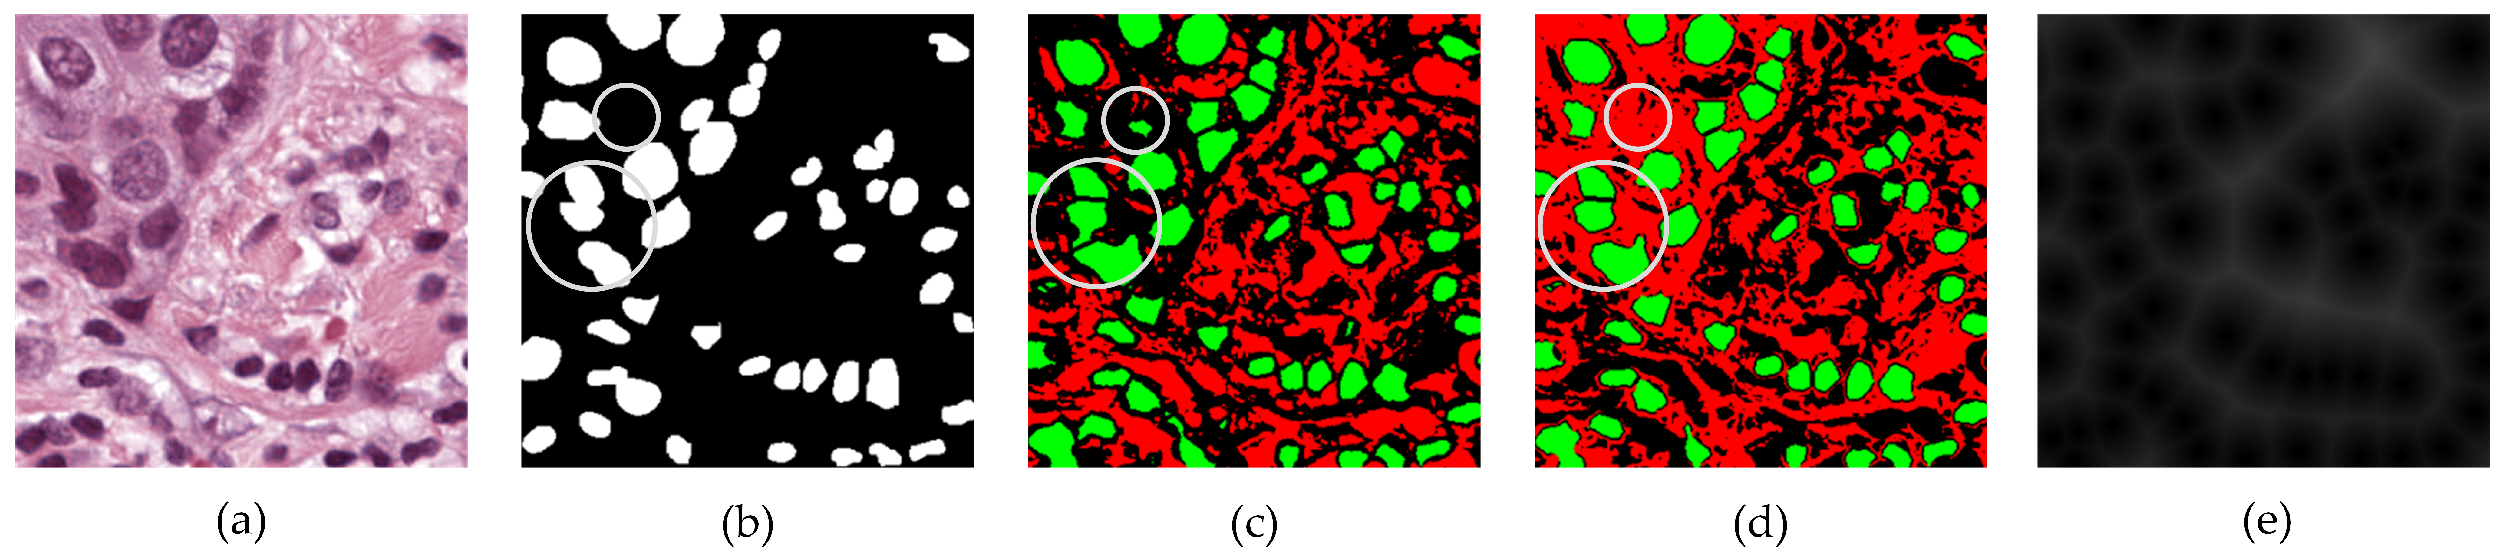
3.1. Label Generation

In our work, point annotation is obtained by capturing the centroid points of cell nuclei in the instance labels. This simulates the process of manually annotating points, and we have annotated all cell nuclei with points. For the weakly supervised cell nucleus segmentation task, point annotations save annotation costs but contain limited information. As shown in Figure 3a, each point annotation can only represent a foreground cell nucleus belonging to the positive class, lacking cell nucleus shape information and background information. It is not directly feasible to utilize point annotations for nucleus segmentation. Inspired by [13], we generate more informative labels from the point annotations, namely voronoi labels and cluster labels.
In the cell nucleus images, the distances between adjacent cell nuclei vary, as shown in Figure 3c, the voronoi labels effectively distinguish all cell nuclei and provide their positional information. Each cell in the voronoi label contains a point representing a cell nucleus, while the boundary regions of the cells typically belong to the background. However, since the voronoi labels do not provide information about the shape of cell nuclei and have limited background information, relying solely on voronoi labels cannot achieve precise segmentation of cell nuclei. To address this issue, we perform cluster within each cell, extracting information about cell nucleus pixels and background pixels to generate cluster labels, thereby supplementing the shape information of cell nuclei. The combined use of voronoi labels and cluster labels contributes to better segmentation results.
To generate cluster labels, it is necessary to construct effective feature vectors for clustering. Initially, considering the significant color differences between cell nucleus pixels and the surrounding background pixels, we built a color feature vector for clustering. Subsequently, acknowledging the variations in cell nucleus sizes across different images, we augmented the color features with distance features, resulting in the final color-distance feature vector. We employed this color-distance feature vector in k-means clustering to generate cluster labels. The subsequent sections will provide a detailed description of the process of obtaining color-distance features.
Unlike [13], in the generation process of cluster labels, we took into full consideration the complexity of cell nucleus images. By observing the cell nucleus images, it can be noticed that there are significant differences in cell nucleus size and color among different images. Considering the color differences in different images, we constructed a color feature vector for k-means clustering purposes. We constructed a color feature vector for k-means clustering purposes. The color feature vector of the image I k can be represented as:
f c o l o r = ( r i , g i , b i ) / ( 255 λ k )
where λ k represents the color standard deviation of the input nuclear image I k (the calculation of λ k is described in detail in Formulas (2)–(4)), ( r i , g i , b i ) represents the color values of pixel i in I k , we normalize the color values to the range of [ 0 , 1 ] to make the differences between color values more comparable.
By introducing λ k , the generated cluster labels can better adapt to the color distribution of each cell nucleus image. To calculate λ k , we iterate over each pixel i in the image I k to compute the color dissimilarity between pixel i and its neighboring pixels j within a P × P region. Assuming there are a total of m pixels in I k and n pixels within the P × P region. To ensure the inclusion of individual cell nuclei in the P × P region, it is necessary to make P sufficiently large. Simultaneously, to retain details of local color variations, P must be small enough. Therefore, we set P = 60 and P = 80 based on the size characteristics of cell nuclei in the MultiOrgan and TNBC datasets, respectively. We can use the following formula to calculate the color dissimilarity between i and j:
c i j = a = 1 b ( v i a v j a ) 2
where b represents the number of color channels, v i a and v j a represent the color values of pixel i and pixel j in the a-th color channel, and i = 1 , 2 , , m , j = 1 , 2 , , n . The color dissimilarity array of the image I k can be represented by the following array:
C k = [ c 11 , c 12 , , c 1 n , c 21 , c 22 , , c 2 n , , c m 1 , c m 2 , , c m n ]
where m represents the number of pixels in the image I k , and n represents the number of pixels in the P × P region. Finally, the color standard deviation λ k of the image I k can be calculated based on C k , and the formula is expressed as follows:
λ k = 1 N i = 1 N ( C i C K ¯ ) 2
where N represents the number of elements in the array C k , C i represents the i-th element in the array C k , and C k ¯ represents the average value of the array C k .
The cluster labels obtained using the color feature vector we constructed are shown in Figure 4c. As indicated by the circled area, some pixels are prone to being incorrectly assigned as cell nucleus pixels, indicating that using only color features for clustering may not yield satisfactory results.
Therefore, considering the differences in cell nucleus size across different images, we augment the color feature with a distance feature. Specifically, we first perform distance transformation using the point annotations to obtain the distance map shown in Figure 4e. In this map, the value of each pixel represents the distance d i from that pixel to the nearest point representing a cell nucleus. We then calculate the average radius r of the cell nuclei and truncate the distance d i to the maximum value at r, obtaining the distance feature f d for each cell nucleus. Finally, we combine the distance feature with the color feature to obtain the final color-distance feature:
f = ( f c o l o r , f d )
where f c o l o r and f d represent the color feature vector and distance feature vector we constructed, respectively. The cluster labels obtained using the color-distance feature are shown in Figure 4d, demonstrating improved labeling results compared to clustering based solely on color features. Assuming there are a total of n pixels, we perform k-means clustering using color-distance features.

3.2. Nucleus Segmentation

By observing cell nucleus images, we noticed that cell nuclei have distinct edges, mostly exhibiting elliptical or elongated shapes, and they vary significantly in size. Based on these observations, we designed an encoder–decoder segmentation network to effectively accomplish the weakly supervised nucleus segmentation task. This network aims to preserve more low-level features from the shallow layers while better perceiving cell nuclei of various sizes. The nucleus segmentation network constructed in this study is depicted in Figure 5. We employed this network to segment cell nuclei, and the following description will provide a detailed account of its construction process.

3.2.1. Feature Preservation Module (FPM)

In weakly supervised tasks for cell nucleus segmentation, low-level features are crucial for preserving detailed information about the cell nuclei. These low-level features are transmitted through skip connections to the decoder. However, at this stage, the decoder features are of a higher level, and when merging the two sets of features, the inconsistency in feature levels hinders the effective preservation of low-level features from the encoder. To address this, we have developed a Feature Preservation Module (FPM). By introducing FPM module in both the downsampling blocks of the encoder and the upsampling blocks of the decoder, we enhance the preservation and fusion of low-level features. The FPM module excels in resolving the challenges of low-level feature preservation and feature-level inconsistency, enabling the network to better capture detailed information in weakly supervised cell nucleus segmentation tasks.
Downsampling block. The downsampling block is responsible for gradually reducing the resolution of the feature maps while extracting higher-level feature representations. As shown in the bottom left corner of Figure 5, we incorporate the FPM(En). Considering that max pooling may lose a significant amount of nucleus information, to retain more low-level features from the encoder in weakly supervised nucleus segmentation tasks, we adopted a combination of max pooling and average pooling for pooling. The pooled features are then concatenated and fed into a convolutional block, while introducing residual connections to enhance the network’s expressive power. The formula expression for the pooling operation in the downsampling block is as follows:
P = C P a v g ( x ) , P m a x ( x )
where x represents the input feature map, P a v g represents average pooling, P m a x represents max pooling, and C represents concatenation operation. The complete formulation of the downsampling block is as follows:
F P M E n = P + f C B A ( P )
where f C B A ( · ) represents CBA block, which contains 3 × 3 convolution, Batch Normalization, LeakyReLU, and Dropout operation.
Upsampling block. The upsampling block combines the encoder features from the same layer and the decoder features from the previous layer. To ensure a better alignment between these two sets of features during merging, we employ different processing strategies for each. In the EnNuSegNet network structure, as shown in the middle of the bottom part of Figure 5, we introduce the FPM(De). For encoder features from the same layer, we use a 1 × 1 convolution to map low-level features from the encoder to a lower dimension. As for decoder features from the previous layer, we employ a combination of 1 × 1 convolution and bilinear interpolation operations, ensuring better matching and fusion between features from the same encoder layer and features from the previous decoder layer. This dual processing approach is crucial for FPM to preserve low-level features while enhancing feature matching . The formula describing this process is as follows:
Q = C ϕ 1 × 1 ( x 1 ) , υ ϕ 1 × 1 ( x 2 )
where x 1 and x 2 are represent the encoder features from the same layer and the decoder features from the previous layer, respectively; ϕ 1 × 1 ( · ) represents 1 × 1 convolution operation; υ represents bilinear interpolation; and C represents concatenation operation. The complete formulation of the upsampling block is as follows:
F P M D e = Q + f C B A ( Q )
where f C B A ( · ) represents CBA block.

3.2.2. Scale-Aware Module (SAM)

Considering the significant scale variations of cell nuclei in the images, we introduce the Scale-Aware Module (SAM), as depicted in the bottom right corner of Figure 5. The SAM processes features through four dilated convolutions with distinct kernel sizes and sampling rates. This results in four feature maps of the same size, which are concatenated and further processed through a convolutional block to produce the final output.
It is important to note that the SAM shares some similarities with the ASPP module [29], but it incorporates specific innovations and advantages in its detailed design and application context. Firstly, we emphasize the importance of local details over global context in weakly supervised cell nucleus segmentation tasks. Thus, the SAM module omits an ASPP pooling layer present in the ASPP module, allowing it to focus more on extracting local features without introducing context information from the entire image through global average pooling. Secondly, the dilation rates of the dilated convolutions in the SAM module differ from those in the ASPP module. Considering the characteristics of our task, where cell nuclei are typically distributed in limited image regions, we employ smaller dilation rates to enhance sensitivity to subtle structures and edges, better serving our task requirements. Thirdly, we position the SAM module at the bottleneck of the encoder–decoder structure. This ensures that SAM captures multi-scale information throughout the network, facilitating the integration of semantic features from different levels. In weakly supervised tasks, this is crucial for the model to better comprehend and utilize multi-scale information. The design of the SAM module enables the model to adapt effectively to cell nuclei of varying scales. The SAM module can be formulated using the following equations:
S = C ϕ ( k , d ) ( x )
where x represents the input features, ϕ ( · ) represents convolution operation with different-sized kernels and sampling rates, k represents the kernel size, d represents the sampling rate, ( k , d ) = ( ( 1 , 1 ) , ( 2 , 3 ) , ( 4 , 3 ) , ( 6 , 3 ) ) , and C represents the concatenation operation.
S A M = f 3 × 3 ( S )
where f 3 × 3 ( · ) represent the 3 × 3 convolution operation.

3.3. Nucleus Edge Regression (NER)

In the previous description, we utilized point annotations to provide preliminary positional information for cell nuclei. Subsequently, we generated voronoi labels and cluster labels for segmentation training. After completing the initial segmentation of cell nuclei, to further refine the segmentation boundaries, we introduced the Nucleus Edge Regression module (NER). This facilitated a more precise segmentation of cell nuclei.
Specifically, as shown at the bottom of Figure 2, we first used the Sobel operator to extract the edges from the original image as an additional supervisory signal. However, the edges obtained from the original image often contain noisy edges. To address this, we applied morphological opening operation on the coarse segmentation results from the previous stage to obtain an edge mask, which was used to refine the edges extracted from the original image and eliminate noisy edges. This resulted in an edge supervision map. Finally, we performed edge regression using the obtained edge supervision map to guide the model in optimizing the segmentation boundaries, thereby achieving a finer segmentation result. The formula description for the edge supervision map is as follows:
E = d S e S ε I
where S represents the segmentation result of the model, and I represents the original cell nucleus image. d ( · ) and e ( · ) represent the dilation and erosion operations, respectively, while ∩ represents the pixel-level intersection operation, and ε ( · ) represents the Sobel operations.

4. Experiments and Results

4.1. Datasets and Performance Evaluation

We conducted experiments on two publicly available nucleus segmentation datasets: MultiOrgan [30] and TNBC [31]. The MultiOrgan dataset consists of 30 images with a resolution of 1000 × 1000 pixels, covering seven different organs including breast, liver, kidney, prostate, bladder, brain, and stomach. Each image in the dataset has complete and accurate pixel-level annotations. The TNBC dataset is derived from patients with triple-negative breast cancer and contains 50 images with a resolution of 512 × 512 pixels. The dataset includes various cell types such as normal epithelial and myoepithelial breast cells (located in ducts and lobules), invasive cancer cells, fibroblasts, endothelial cells, adipocytes, macrophages, and inflammatory cells (lymphocytes and plasma cells). In our experiments, point labels were obtained by extracting the centroid coordinates of each cell nucleus from the pixel-level annotations, simulating the process of manually acquiring point labels. We evaluated our method using both pixel-level metrics (F1 score) and object-level metrics (Dice coefficient and Aggregated Jaccard Index (AJI) [32]). By employing these evaluation metrics, we assessed the performance of our method on both datasets.

4.2. Implementation Details

The experiment was conducted in a virtual environment with PyTorch 1.1.0, CUDA 10.3, Python 3.6, and Ubuntu 18.04. The batch size was set to 32, and the training was performed for 130 epochs using the Adam optimizer. During the training process, the first 100 epochs were dedicated to training the segmentation network for nucleus segmentation using cross-entropy loss. The remaining 30 epochs focused on nucleus edge regression using binary cross-entropy loss. The initial learning rate was set to 1 × 10 3 . The study by Rukundo [33] indicates that training models on larger images can result in outputs closer to the target vector, thereby improving accuracy. Considering the GPU computational capacity, we extracted 16 image patches of size 250 × 250 from each training image, which were then randomly cropped to 224 × 224 as the network’s input. Additionally, data augmentation techniques such as scaling, rotation, flipping, and affine transformations were applied to further enhance the training data.

4.3. Results Analysis

4.3.1. Ablation Study

To validate the effectiveness of different modules, we conducted an ablation study based on the UNet [34] model. The study was performed on both the MultiOrgan and TNBC datasets. The results of the ablation experiments are shown in Table 1, where it can be observed that each module contributes to the improvement of the evaluation metrics. The inclusion of each individual module led to a significant enhancement in all evaluation metrics. Moreover, when all modules were simultaneously incorporated, the best experimental results were achieved.
Specifically, compared to the scenario where no modules are added, when the FPM module was added alone, the F1 score, Dice coefficient, and AJI improved by 1.07%, 2.89%, and 3.07%, respectively, on the MultiOrgan dataset (1.1%, 1.8%, and 1.94% on the TNBC dataset). This improvement can be attributed to the FPM module retaining more shallow features from the encoder, which are beneficial for nucleus segmentation. When the SAM module was added alone, the F1 score, Dice coefficient, and AJI improved by 2.99%, 0.28%, and 1.78%, respectively, on the MultiOrgan dataset (2.96%, 1.56%, and 1.55% on the TNBC dataset). This indicates that the introduction of SAM enhanced the model’s ability to perceive cell nuclei of different scales.After adding the NER module, the F1 score, Dice coefficient, and AJI improved by 2.24%, 1.73%, and 3.83%, respectively, on the MultiOrgan dataset (1.87%, 2.94%, and 4.85% on the TNBC dataset). This suggests that after performing edge regression for cell nuclei, the segmentation capability of the model was further optimized.The best experimental results were achieved when all three modules were added simultaneously. In this case, the F1 score, Dice coefficient, and AJI improved by 3.54%, 3.42%, and 4.42%, respectively, on the MultiOrgan dataset (3.41%, 3.6%, and 6.24% on the TNBC dataset). These results demonstrate the effectiveness of the proposed method in improving nucleus segmentation performance.
Furthermore, Figure 6 presents the qualitative results of the ablation study conducted on the MultiOrgan dataset and TNBC dataset. By observing the orange boxed regions in Figure 6b–f, it can be observed that when the Feature Preservation Module (FPM) is individually added, the segmented cell nuclei exhibit similar shapes to the ground-truth labels. Similarly, when the Nucleus Edge Regression Module (NER) is added individually, it also produces similar effects. This indicates that FPM plays a role in preserving shallow features, while NER contributes to edge regression. By observing the blue boxed regions, it can be noticed that in Figure 6d, after incorporating the Scale-Aware Module (SAM), the model is better able to segment smaller cell nuclei. This demonstrates that the inclusion of SAM improves the extraction of global and multi-scale information, enabling the segmentation of smaller cell nuclei.
By observing the circled regions in Figure 6, it can be observed that after the addition of the NER module, the segmentation of cell nucleus edges becomes more refined and smooth. In Figure 6f, when all three modules are combined, it integrates the advantages of the previous three modules, allowing for the perception of cell nuclei at different scales and more accurate edge segmentation. These results effectively demonstrate the effectiveness of the proposed method in this paper. Finally, as illustrated in Figure 7, we present the results of the ablation study in another way, providing a visual comparison with the ground truth labels.

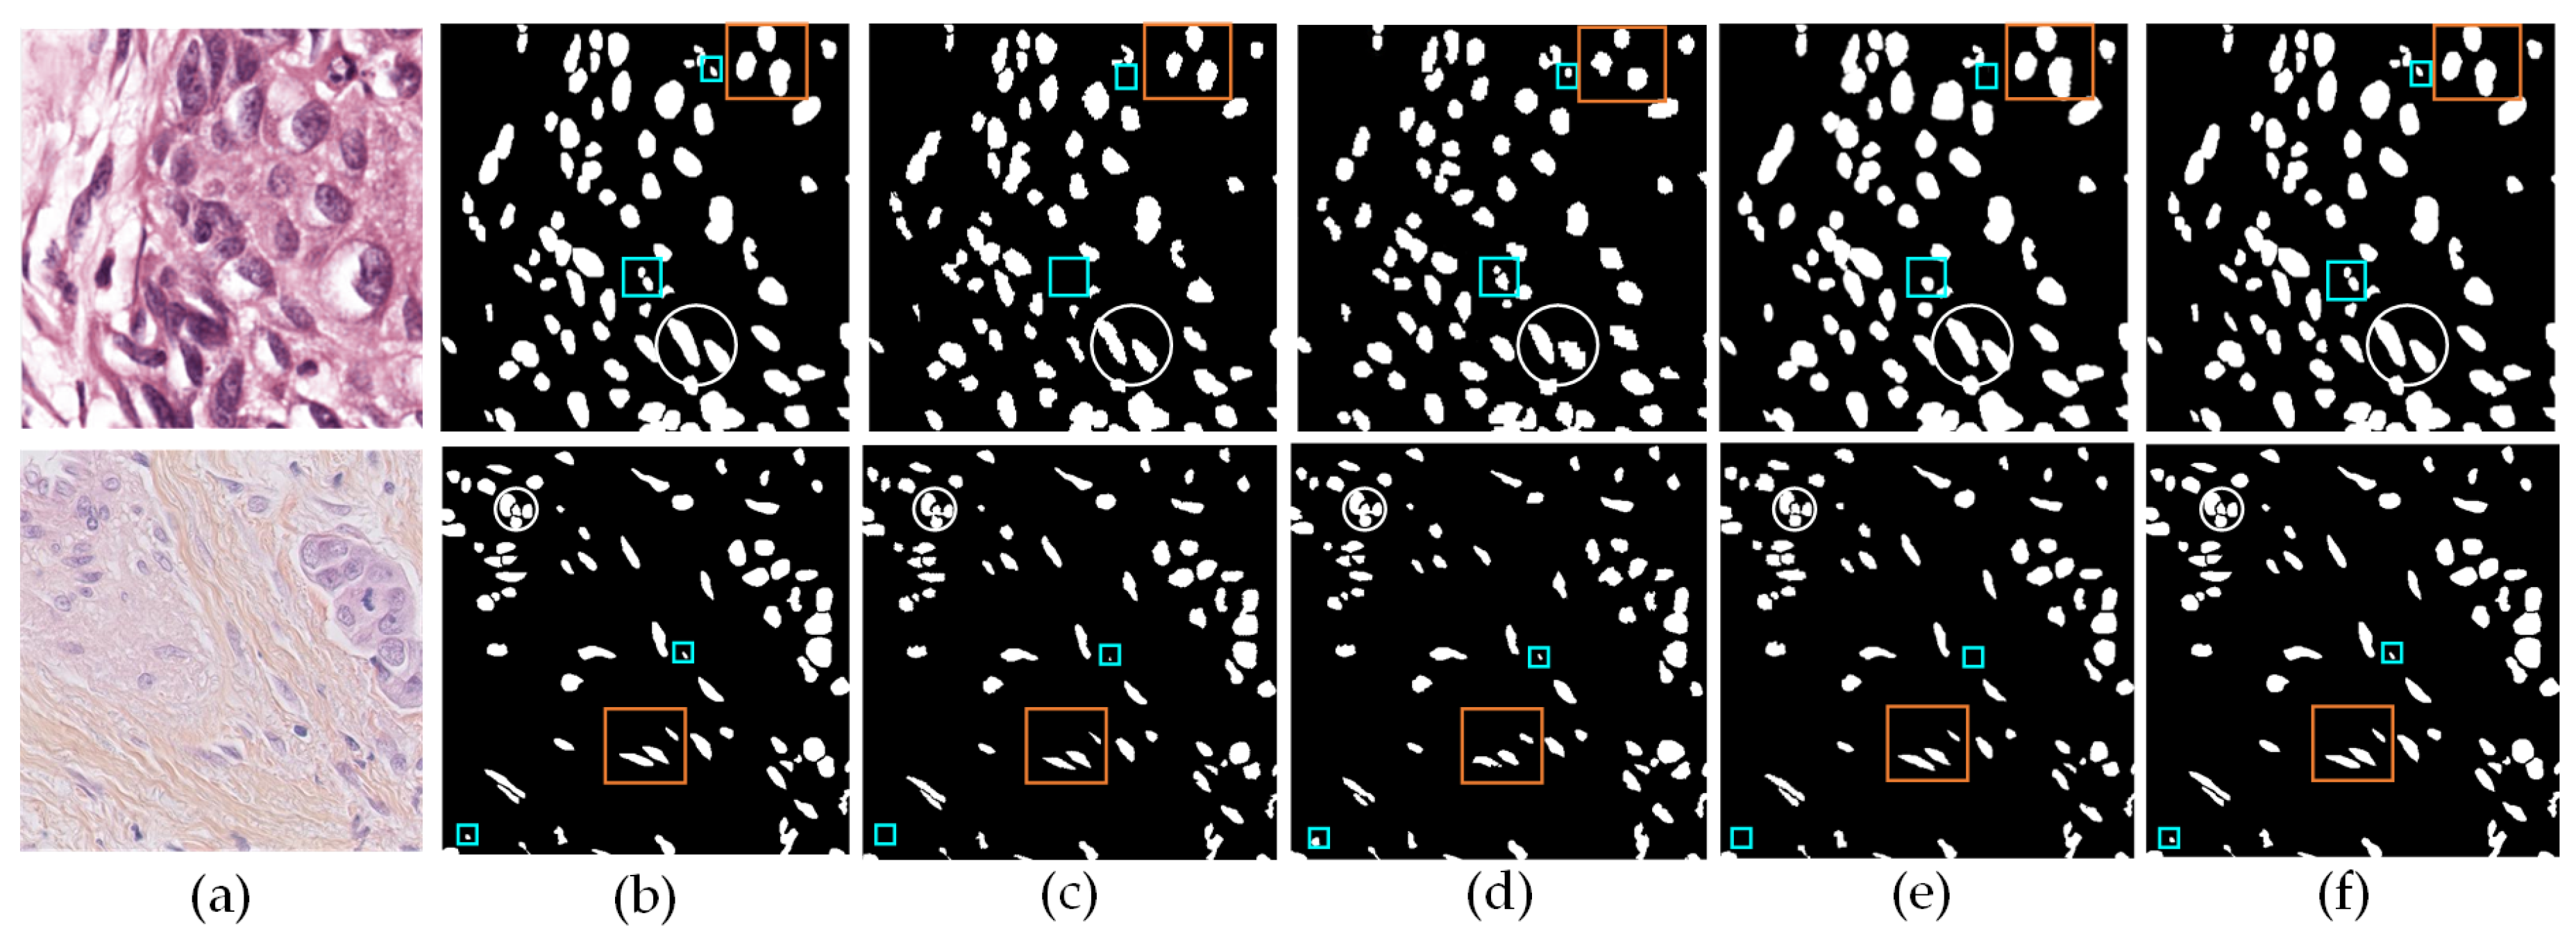
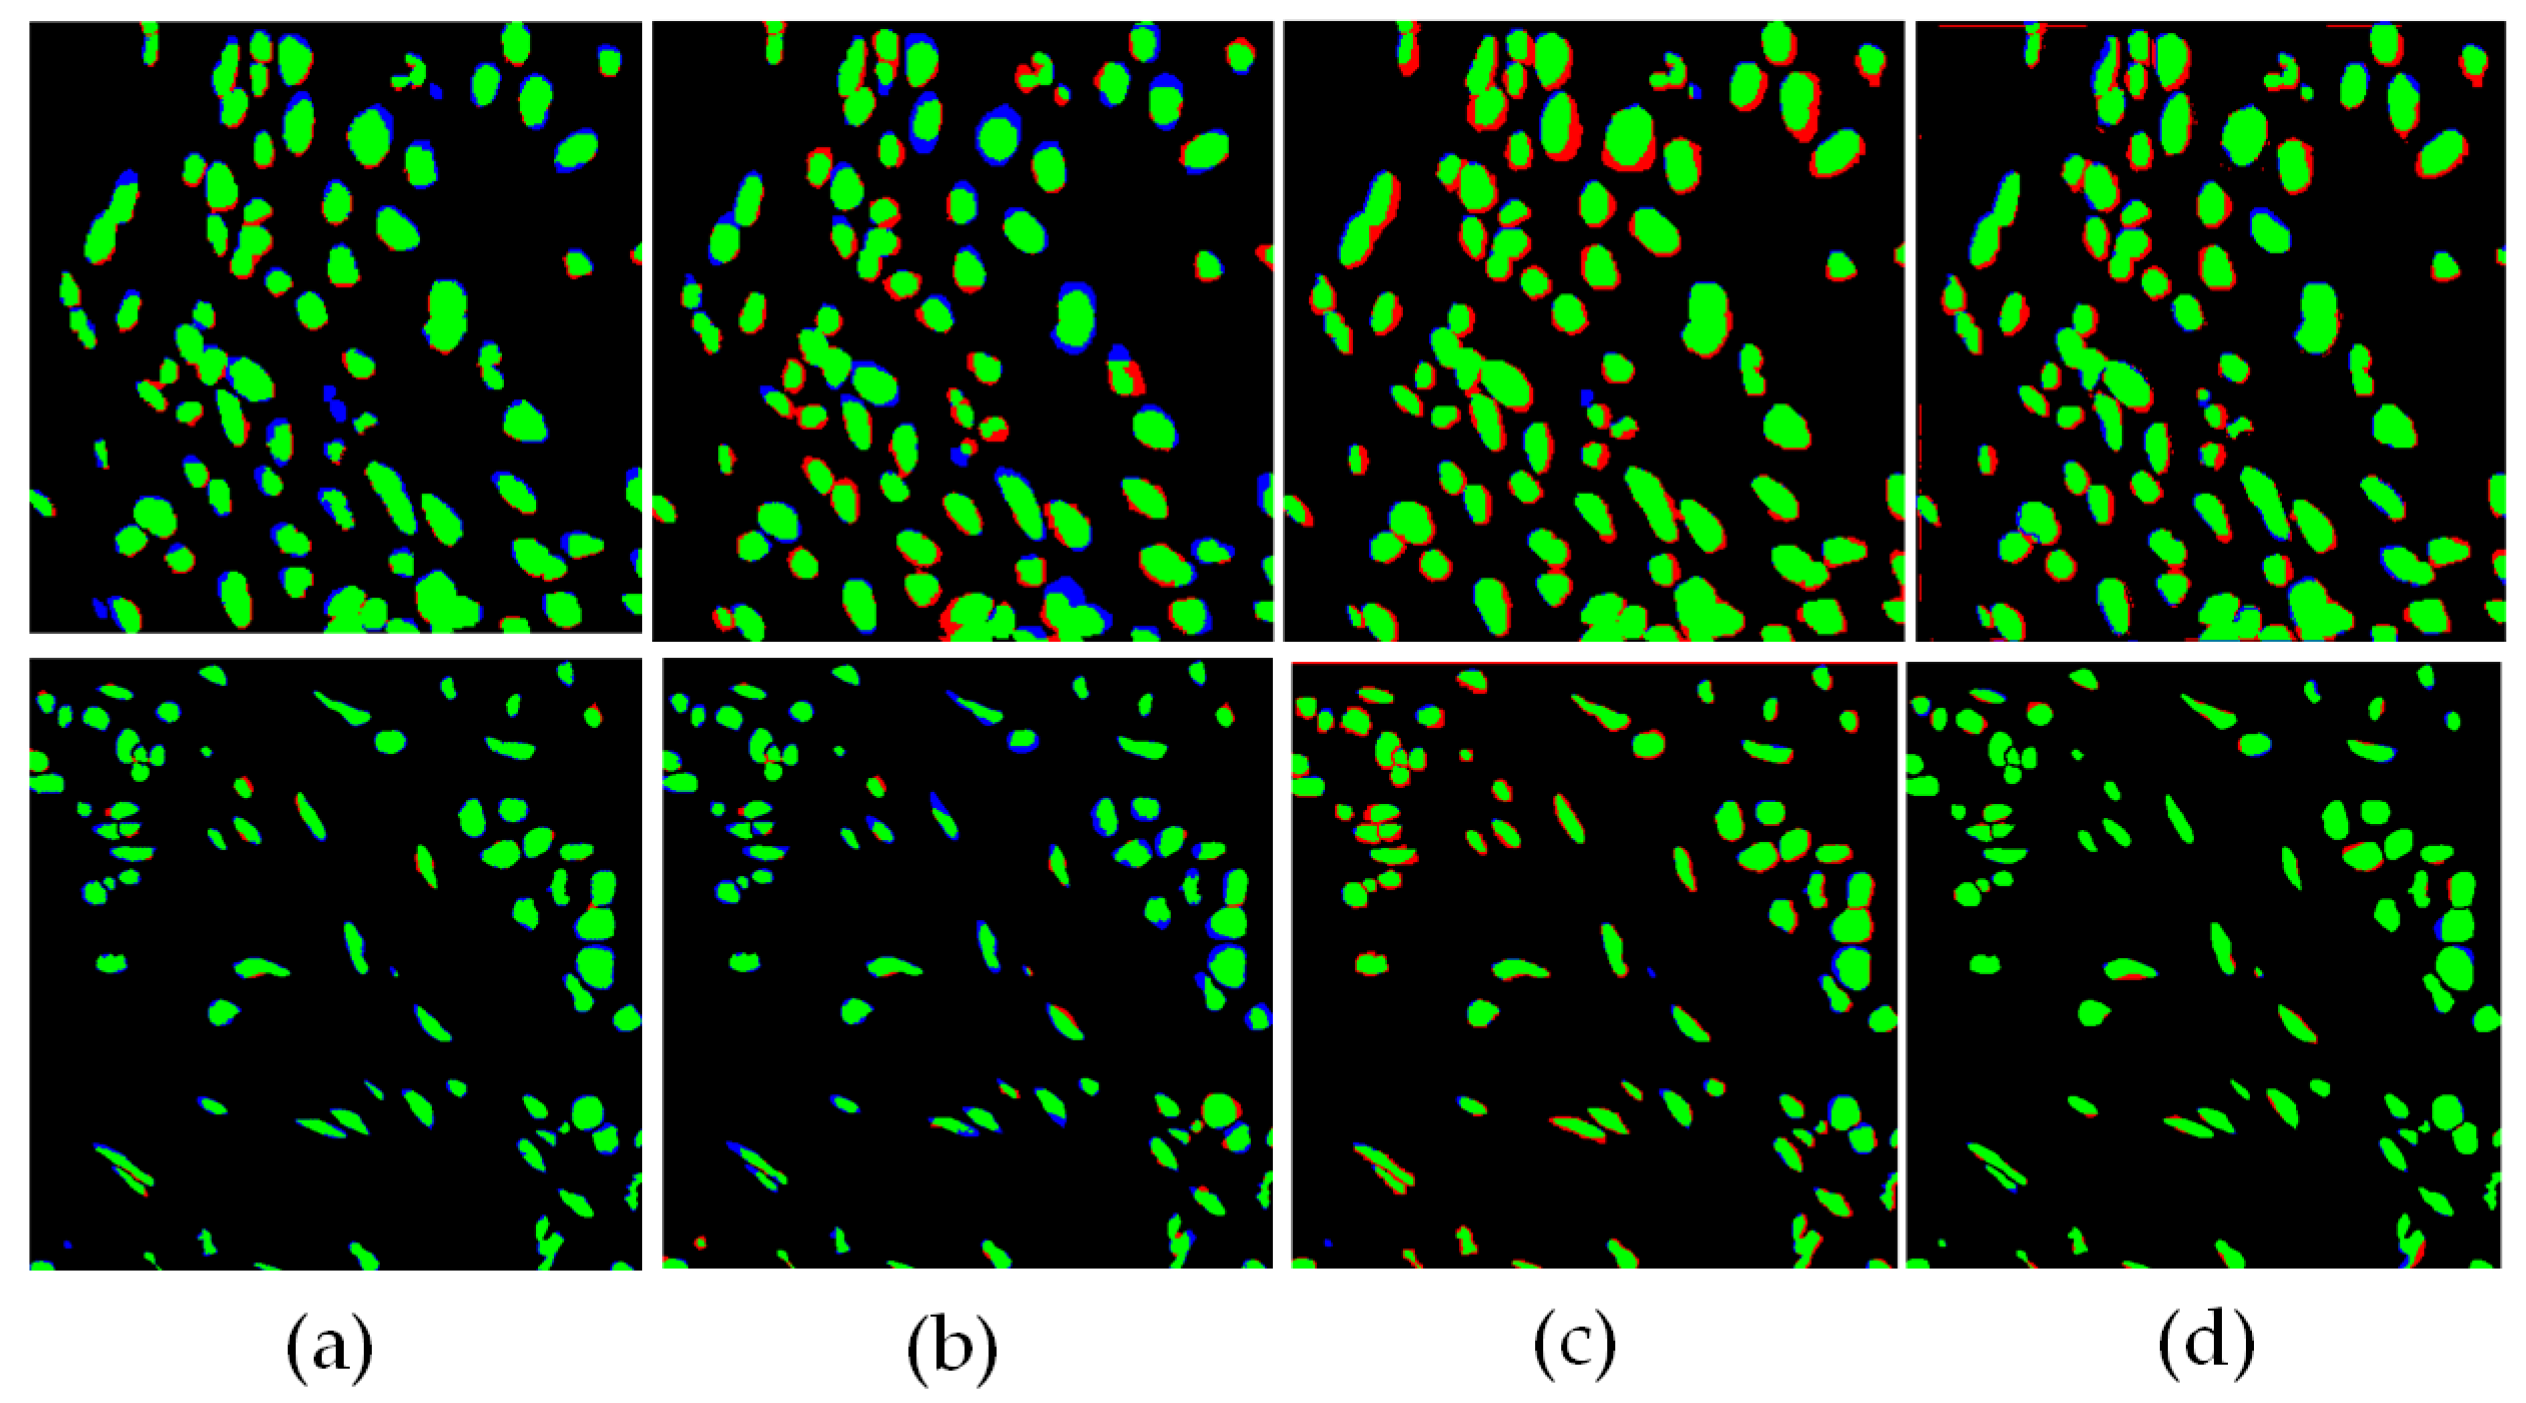
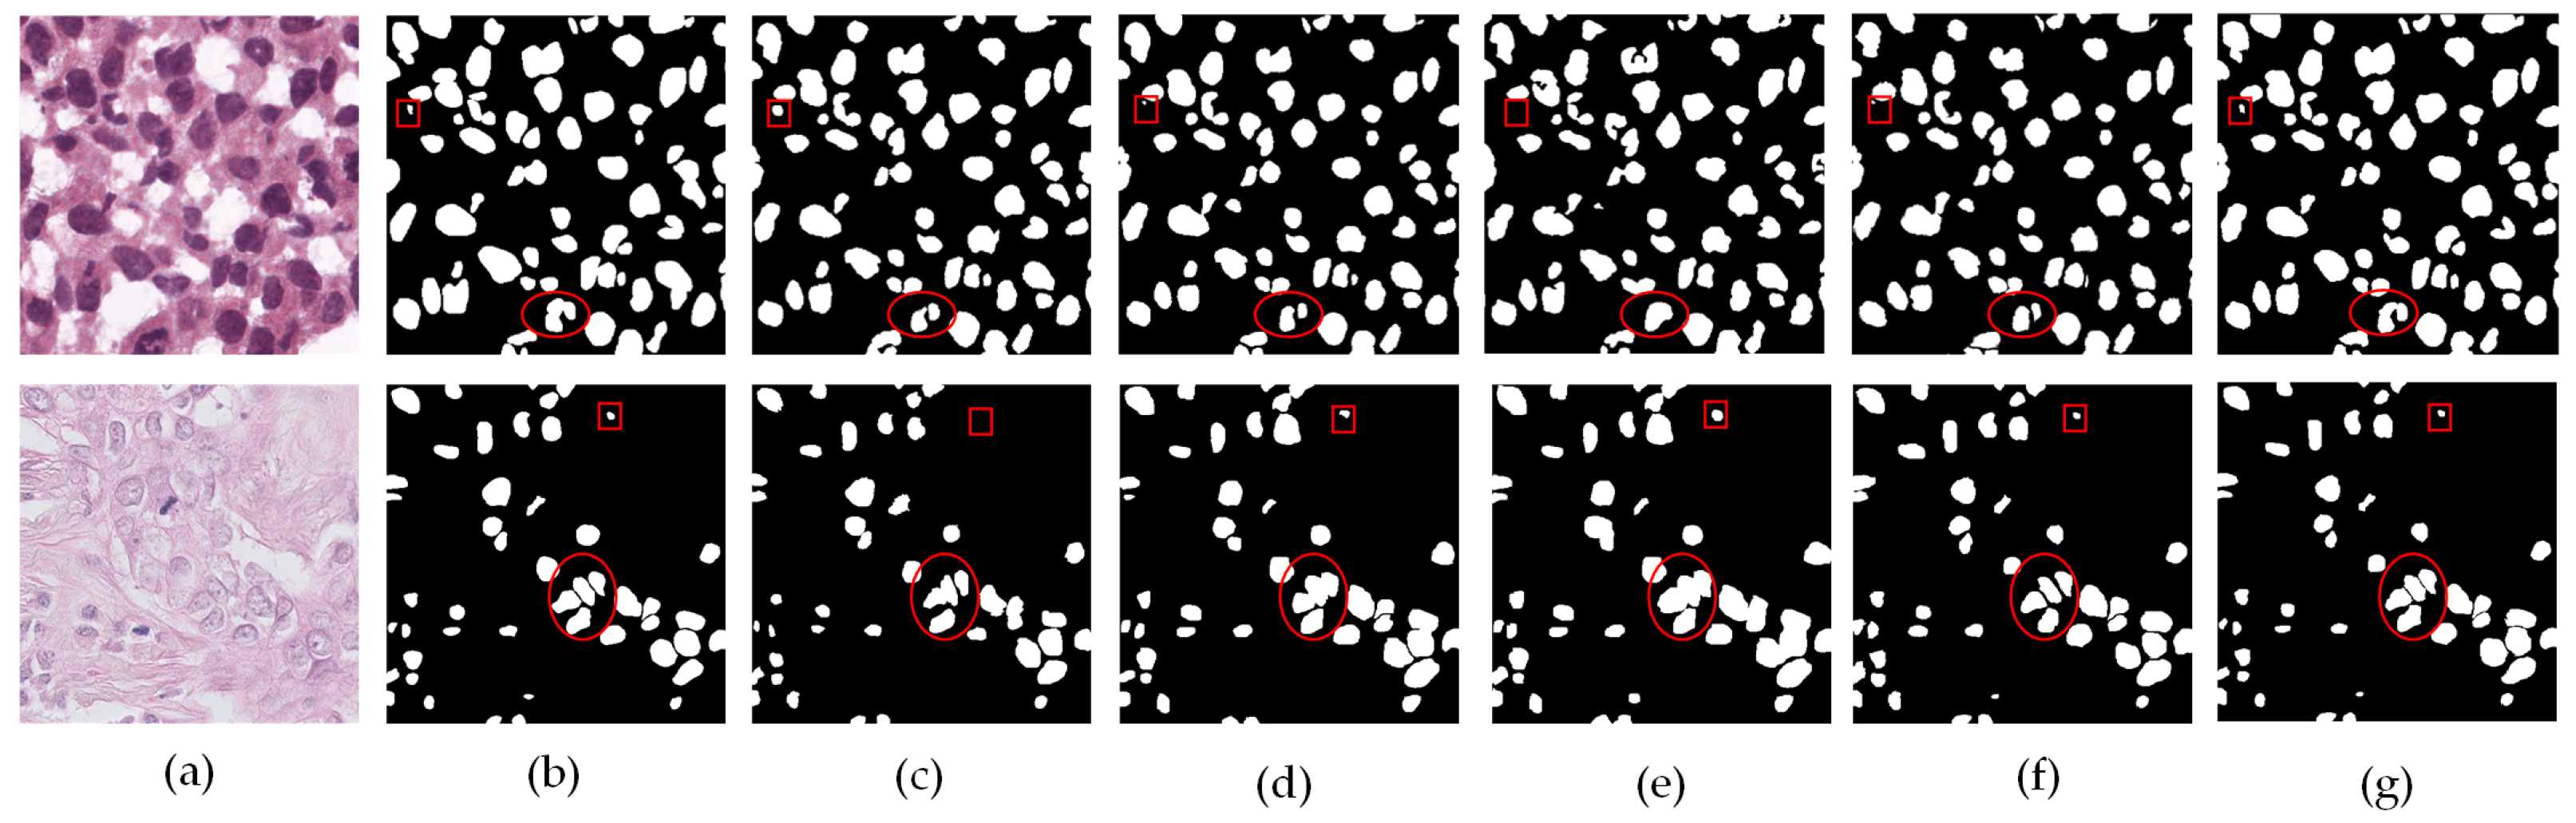
4.3.2. Comparison to Other Methods

In this study, we compared our method with four state-of-the-art weakly supervised cell nucleus image segmentation algorithms, namely the methods proposed by Qu et al. [13], Liu et al. [16], Chen et al. [27], and Guo et al. [28], all of which provide publicly available code. Additionally, we trained a fully supervised UNet [34] model as a baseline for performance evaluation of our method.
Based on the results in Table 2 and Table 3, it is evident that our method outperforms other weakly supervised methods in all evaluation metrics. For the MultiOrgan dataset, compared to the most competitive method [28], our method achieved improvements of 2.02%, 1.41%, and 1.59% in terms of F1, Dice, and AJI, respectively. For the TNBC dataset, compared to the most competitive method [28], our method achieved improvements of 1.04%, 1.81%, and 2.18% in F1, Dice, and AJI, respectively.
These results indicate that our method, compared to the two-stage training strategy in reference [28], avoids error accumulation and helps improve segmentation performance. Moreover, compared to the method in reference [13], our method optimizes the quality of label generation while having stronger feature extraction capabilities, preserving more low-level information beneficial for segmentation. Compared to the method in reference [16], our method additionally addresses the issue of variations in cell nucleus shape and size, resulting in better segmentation performance. Compared to the method in reference [27], our method also optimizes the segmentation of edges, leading to more refined segmentation. Furthermore, it can be noticed that our proposed method exhibits closer performance to the fully supervised approach in terms of F1 , Dice, and AJI.
In Figure 8, we present the qualitative comparison results of our method with other weakly supervised methods. Whether it is the MultiOrgan or the TNBC dataset, it can be observed from the regions circled that in Figure 8g, our method achieves more accurate segmentation of cell nuclei in terms of shape and boundary compared to the other methods in Figure 8c–f. Moreover, by examining the boxed regions in Figure 8, it can be noticed that in the other methods (Figure 8c–f), the segmented cell nuclei tend to be either oversized or undersized, and in some cases, they fail to segment the nuclei within the boxed regions. However, in Figure 8g, our method not only successfully segments the nuclei within the boxed region but also exhibits shapes that are closer to the ground-truth labels, indicating the superior segmentation performance of our method. These results further validate the effectiveness of our method in the task of nucleus segmentation. Additionally, as illustrated in Figure 9, we present the results of the comparative experiments and visually compare them with the ground truth labels in another way.

5. Conclusions

We propose a novel weakly supervised nucleus segmentation method in this paper. Firstly, considering the shape characteristics of cell nuclei as well as the variations in colors and sizes of nuclei in the image, we incorporated voronoi diagrams and k-means clustering to generate two types of labels that contain more comprehensive information, building upon the point annotations. Then, we constructed a network called EnNuSegNet, which aimed to enhance the performance of weakly supervised nucleus segmentation. It effectively retained the low-level features of cell nuclei and improved the ability to perceive nuclei of different scales, resulting in accurate segmentation of cell nuclei. Lastly, during the training process, we performed edge regression on the nucleus boundaries to obtain finer segmentation results. Experimental results on two publicly available datasets demonstrate that our proposed method is more effective in nucleus segmentation compared to other weakly supervised methods. In the future, we aim to further reduce the workload of label annotation while ensuring high-quality nucleus segmentation performance.

Author Contributions

Conceptualization, X.C.; Methodology, X.C. and Q.R.; Validation, L.C., G.S. and P.C.; Investigation, X.C., Q.R. and L.C.; Writing—original draft, Q.R.; Supervision, L.C. and G.S.; Funding acquisition, P.C. All authors have read and agreed to the published version of the manuscript.

Funding

This research was funded by The National Key Research and Development Program of China grant 2016YFC0802500 and National Natural Science Foundation of China (NSFC) grant 42204111.

Data Availability Statement

The MultiOrgan and TNBC dataset are available at following URLs: https://doi.org/10.1186/s13059-023-03054-0 and https://members.cbio.mines-paristech.fr/~pnaylor/BNS.zip, accessed on 18 January 2024.

Conflicts of Interest

Author Lingjun Chen was employed by the company Yichang Power Supply Company. The remaining authors declare that the research was conducted in the absence of any commercial or financial relationships that could be construed as a potential conflict of interest.

References

  1. Wong, A.N.N.; He, Z.; Leung, K.L.; To, C.C.K.; Wong, C.Y.; Wong, S.C.C.; Yoo, J.S.; Chan, C.K.R.; Chan, A.Z.; Lacambra, M.D.; et al. Current developments of artificial intelligence in digital pathology and its future clinical applications in gastrointestinal cancers. Cancers 2022, 14, 3780. [Google Scholar] [CrossRef] [PubMed]
  2. Wang, Y.; Wang, W.; Liu, D.; Hou, W.; Zhou, T.; Ji, Z. GeneSegNet: A deep learning framework for cell segmentation by integrating gene expression and imaging. Genome Biol. 2023, 24, 235. [Google Scholar] [CrossRef] [PubMed]
  3. Naylor, P.; Laé, M.; Reyal, F.; Walter, T. Segmentation of nuclei in histopathology images by deep regression of the distance map. IEEE Trans. Med. Imaging 2018, 38, 448–459. [Google Scholar] [CrossRef] [PubMed]
  4. Aatresh, A.A.; Yatgiri, R.p.; Chanchal, A.K.; Kumar, A.; Ravi, A.; Das, D.; BS, R.; Lal, S.; Kini, J. Efficient deep learning architecture with dimension-wise pyramid pooling for nuclei segmentation of histopathology images. Comput. Med. Imaging Graph. 2021, 93, 101975. [Google Scholar] [CrossRef] [PubMed]
  5. Kiran, I.; Raza, B.; Ijaz, A.; Khan, M.A. DenseRes-Unet: Segmentation of overlapped/clustered nuclei from multi organ histopathology images. Comput. Biol. Med. 2022, 143, 105267. [Google Scholar] [CrossRef] [PubMed]
  6. Ahmad, I.; Xia, Y.; Cui, H.; Islam, Z.U. DAN-NucNet: A dual attention based framework for nuclei segmentation in cancer histology images under wild clinical conditions. Expert Syst. Appl. 2023, 213, 118945. [Google Scholar] [CrossRef]
  7. Hancer, E.; Traoré, M.; Samet, R.; Yıldırım, Z.; Nemati, N. An imbalance-aware nuclei segmentation methodology for H&E stained histopathology images. Biomed. Signal Process. Control 2023, 83, 104720. [Google Scholar] [CrossRef]
  8. Zhou, Z.H. A brief introduction to weakly supervised learning. Natl. Sci. Rev. 2023, 5, 44–53. [Google Scholar] [CrossRef]
  9. Ghiasi, G.; Gu, X.Y.; Cui, Y.; Lin, T.Y. Scaling open-vocabulary image segmentation with image-level labels. In Proceedings of the European Conference on Computer Vision, Tel Aviv, Israel, 23–27 October 2022; Springer Nature: Cham, Switzerland, 2022; pp. 540–557. [Google Scholar] [CrossRef]
  10. Laradji, I.H.; Rostamzadeh, N.; Pinheiro, P.O.; Vazquez, D.; Schmidt, M. Where are the blobs: Counting by localization with point supervision. In Proceedings of the European Conference on Computer Vision (ECCV), Tel Aviv, Israel, 23–27 October 2022; pp. 547–562. [Google Scholar]
  11. Li, W.; Liu, W.; Zhu, J.; Cui, M.; Hua, X.S.; Zhang, L. Box-supervised instance segmentation with level set evolution. In Proceedings of the European Conference on Computer Vision, Tel Aviv, Israel, 23–27 October 2022; Springer Nature: Cham, Switzerland, 2022; pp. 1–18. [Google Scholar]
  12. Lin, D.; Dai, J.; Jia, J.; He, K.; Sun, J. Scaling open-vocabulary image segmentation with image-level labels. In Proceedings of the IEEE Conference on Computer Vision and Pattern Recognition, Las Vegas, NV, USA, 27–30 June 2016; pp. 3159–3167. [Google Scholar]
  13. Qu, H.; Wu, P.; Huang, Q.; Yi, J.; Riedlinger, G.M.; De, S.; Metaxas, D.N. Weakly supervised deep nuclei segmentation using points annotation in histopathology images. In Proceedings of the International Conference on Medical Imaging with Deep Learning, London, UK, 8–10 July 2019; pp. 390–400. [Google Scholar]
  14. Yoo, I.; Yoo, D.; Paeng, K. Pseudoedgenet: Nuclei segmentation only with point annotations. In Proceedings of the Medical Image Computing and Computer Assisted Intervention—MICCAI 2019: 22nd International Conference, Shenzhen, China, 13–17 October 2019; Proceedings, Part I 22. pp. 731–739. [Google Scholar] [CrossRef]
  15. Nishimura, K.; Wang, C.; Watanabe, K.; Bise, R. Weakly supervised cell instance segmentation under various conditions. Med. Image Anal. 2021, 73, 102182. [Google Scholar] [CrossRef] [PubMed]
  16. Liu, W.; He, Q.; He, X. Weakly supervised nuclei segmentation via instance learning. In Proceedings of the 2022 IEEE 19th International Symposium on Biomedical Imaging (ISBI), Kolkata, India, 28–31 March 2022; pp. 1–5. [Google Scholar] [CrossRef]
  17. Lin, Y.; Qu, Z.; Chen, H.; Gao, Z.; Li, Y.; Xia, L.; Ma, K.; Zheng, Y.; Cheng, K.T. Nuclei segmentation with point annotations from pathology images via self-supervised learning and co-training. Med. Image Anal. 2023, 89, 102933. [Google Scholar] [CrossRef] [PubMed]
  18. Wang, W.; Sun, G.; Van, G.L. Looking beyond single images for weakly supervised semantic segmentation learning. IEEE Trans. Pattern Anal. Mach. Intell. 2022, 99, 1. [Google Scholar] [CrossRef] [PubMed]
  19. Ahn, J.; Kwak, S. Learning pixel-level semantic affinity with image-level supervision for weakly supervised semantic segmentation. In Proceedings of the IEEE Conference on Computer Vision and Pattern Recognition, Salt Lake City, UT, USA, 18–22 June 2018; pp. 4981–4990. [Google Scholar] [CrossRef]
  20. Bearman, A.; Russakovsky, O.; Ferrari, V.; Fei-Fei, L. What’s the point: Semantic segmentation with point supervision. In Proceedings of the European Conference on Computer Vision, Amsterdam, The Netherlands, 11–14 October 2016; Springer International Publishing: Cham, Switzerland, 2016; pp. 549–565. [Google Scholar] [CrossRef]
  21. Dai, J.; He, K.; Sun, J. Boxsup: Exploiting bounding boxes to supervise convolutional networks for semantic segmentation. In Proceedings of the IEEE International Conference on Computer Vision, Santiago, Chile, 7–13 December 2015; pp. 1635–1643. [Google Scholar] [CrossRef]
  22. Vernaza, P.; Chandraker, M. Learning random-walk label propagation for weakly-supervised semantic segmentation. In Proceedings of the IEEE Conference on Computer Vision and Pattern Recognition, Honolulu, HI, USA, 21–26 July 2017; pp. 7158–7166. [Google Scholar] [CrossRef]
  23. Feng, J.; Li, C.; Wang, J. CAM-TMIL: A Weakly-Supervised Segmentation Framework for Histopathology based on CAMs and MIL. J. Phys. Conf. Ser. 2017, 2547, 012014. [Google Scholar] [CrossRef]
  24. Zhao, Z.; Yang, L.; Zheng, H.; Guldner, I.H.; Zhang, S.; Chen, D.Z. Deep learning based instance segmentation in 3D biomedical images using weak annotation. In Proceedings of the Medical Image Computing and Computer Assisted Intervention—MICCAI 2018: 21st International Conference, Granada, Spain, 16–20 September 2018; Proceedings, Part IV 11. Springer International Publishing: Cham, Switzerland, 2018; pp. 352–360. [Google Scholar] [CrossRef]
  25. Khalid, N.; Froes, T.C.; Caroprese, M.; Lovell, G.; Trygg, J.; Dengel, A.; Ahmed, S. PACE: Point Annotation-Based Cell Segmentation for Efficient Microscopic Image Analysis. In Proceedings of the International Conference on Artificial Neural Networks, Heraklion, Greece, 26 September 2023; Springer Nature: Cham, Switzerland, 2023; pp. 545–557. [Google Scholar]
  26. Zhao, Z.; Yang, L.; Zheng, H.; Guldner, I.H.; Zhang, S.; Chen, D.Z. Scribble2label: Scribble-supervised cell segmentation via self-generating pseudo-labels with consistency. In Proceedings of the Medical Image Computing and Computer Assisted Intervention—MICCAI 2020: 23rd International Conference, Lima, Peru, 4–8 October 2020; Proceedings, Part I 23. Springer International Publishing: Cham, Switzerland, 2020; pp. 14–23. [Google Scholar] [CrossRef]
  27. Chen, Z.; Chen, Z.; Liu, J.; Zheng, Q.; Zhu, Y.; Zuo, Y.; Wang, Z.; Guan, X.; Wang, Y.; Li, Y. Weakly supervised histopathology image segmentation with sparse point annotations. IEEE J. Biomed. Health Inform. 2020, 25, 1673–1685. [Google Scholar] [CrossRef] [PubMed]
  28. Guo, R.; Xie, K.; Pagnucco, M.; Song, Y. SAC-Net: Learning with weak and noisy labels in histopathology image segmentation. Med. Image Anal. 2023, 86, 102790. [Google Scholar] [CrossRef] [PubMed]
  29. Guo, R.; Xie, K.; Pagnucco, M.; Song, Y. Deeplab: Semantic image segmentation with deep convolutional nets, atrous convolution, and fully connected crfs. IEEE Trans. Pattern Anal. Mach. Intell. 2017, 40, 834–848. [Google Scholar] [CrossRef]
  30. Kumar, N.; Verma, R.; Sharma, S.; Bhargava, S.; Vahadane, A.; Sethi, A. A dataset and a technique for generalized nuclear segmentation for computational pathology. IEEE Trans. Med. Imaging 2023, 36, 1550–1560. [Google Scholar] [CrossRef] [PubMed]
  31. Naylor, P.; Laé, M.; Reyal, F.; Walter, T. Nuclei segmentation in histopathology images using deep neural networks. In Proceedings of the 2017 IEEE 14th International Symposium on Biomedical Imaging (ISBI 2017), Melbourne, Australia, 18–21 April 2017; pp. 933–936. [Google Scholar] [CrossRef]
  32. Sirinukunwattana, K.; Snead, D.R.; Rajpoot, N.M. A stochastic polygons model for glandular structures in colon histology images. IEEE Trans. Med. Imaging 2015, 34, 2366–2378. [Google Scholar] [CrossRef] [PubMed]
  33. Rukundo, O. Effects of Image Size on Deep Learning. A stochastic polygons model for glandular structures in colon histology images. Electronics 2023, 12, 985. [Google Scholar] [CrossRef]
  34. Ronneberger, O.; Fischer, P.; Brox, T. U-net: Convolutional networks for biomedical image segmentation. In Proceedings of the Medical Image Computing and Computer-Assisted Intervention—MICCAI 2015: 18th International Conference, Munich, Germany, 5–9 October 2015; Proceedings, Part III 18. Springer International Publishing: Cham, Switzerland, 2015; pp. 234–241. [Google Scholar] [CrossRef]
Figure 1. Annotation Examples. (a) Original image, (b) fully supervised pixel-level mask annotation, and weakly supervised annotations include: (c) image-level annotation, (d) point annotation, (e) bounding box annotation, and (f) scribble annotation.
Electronics 13 00504 g001
Figure 2. The overall architecture of the proposed method.
Electronics 13 00504 g002
Figure 3. Label Examples. (a) Fully supervised pixel-level annotation, (b) point annotations, (c) voronoi labels, and (d) cluster labels. In the labels, green pixels represent cell nuclei, red pixels represent the background, and black pixels are ignored and not included in the loss calculation.
Electronics 13 00504 g003
Figure 4. Optimization of cluster labels. (a) Original cell nucleus image, (b) fully supervised pixel-level annotation, (c,d) are cluster labels, where (d) represents the final generated cluster labels, which exhibits higher label quality, and (e) distance map.
Electronics 13 00504 g004
Figure 5. The network structure of EnNuSegNet. It also showcases the Feature Preservation Module (FPM) and the Scale-Aware Module (SAM). The FPM is divided into FPM (En) for the encoder part and FPM (De) for the decoder part. The CBA block exists within the FPM, which contains 3 × 3 convolution, Batch Normalization, LeakyReLU, and Dropout operation. k represents the kernel size, and d represents the sampling rate of the dilated convolution.
Electronics 13 00504 g005
Figure 6. The qualitative results of the ablation study conducted on the MultiOrgan dataset (top row) and TNBC dataset (bottom row). (a) Input image, (b) ground-truth, segmentation mask predicted after incorporating the (c) FPM module, (d) SAM module and (e) NER module, and (f) is the segmentation mask predicted after incorporating all modules (i.e., our proposed EnNuSegNet).
Electronics 13 00504 g006
Figure 7. The visualizations of the discrepancies between each ablation scheme and the ground truth labels on the MultiOrgan dataset (top row) and TNBC dataset (bottom row). (a) FPM, (b) SAM, (c) NER, and (d) the results after incorporating all modules (green: intersection of segmentation results and ground truth labels; red: only present in segmentation results; and blue: only present in ground truth labels).
Electronics 13 00504 g007
Figure 8. The qualitative results of the comparative experiments on the MultiOrgan dataset (top row) and TNBC dataset (bottom row). (a) Input image, (b) ground-truth, (c) Qu et al. [13], (d) Liu et al. [16], (e) Chen et al. [27], (f) Guo et al. [28], and (g) EnNuSegNet (ours).
Electronics 13 00504 g008
Figure 9. The comparative results of different methods visualized for the discrepancies with ground truth labels on the MultiOrgan dataset (top row) and TNBC dataset (bottom row). The images show the differences in segmentation results compared to the ground truth labels for methods (a) Qu et al. [13], (b) Liu et al. [16], (c) Chen et al. [27], (d) Guo et al. [28], and (e) EnNuSegNet (ours) (green: intersection of segmentation results and ground truth labels, red: only present in segmentation results, blue: only present in ground truth labels).
Electronics 13 00504 g009
Table 1. Ablation study conducted on the MultiOrgan and TNBC datasets.
FPMSAMNERMultiOrganTNBC
F1 Dice AJI F1 Dice AJI
0.76370.71450.50590.74210.72280.5241
0.77440.74340.53660.75310.74080.5435
0.79360.71730.52370.77170.73840.5396
0.78610.73180.54420.76080.75220.5726
0.79910.74870.55010.77620.75880.5745
Table 2. Comparison to other methods on the MultiOrgan dataset. “f” represents fully supervised, and “w” represents weakly supervised in the table.
MethodsSupervision ModeF1DiceAJI
UNet [34]f0.83540.77250.5723
Qu et al. [13] (2019)w0.77440.73160.5265
Liu et al. [16] (2022)w0.76870.71790.5197
Chen et al. [27] (2023)w0.74730.71220.5145
Guo et al. [28] (2023)w0.77890.73460.5342
Ourw0.79910.74870.5501
Table 3. Comparison to other methods on the TNBC dataset. “f” represents fully supervised, and “w” represents weakly supervised in the table.
MethodsSupervision ModeF1DiceAJI
UNet [34]f0.81270.78420.5945
Qu et al. [13] (2019)w0.76320.73750.5413
Liu et al. [16] (2022)w0.75830.73160.5389
Chen et al. [27] (2023)w0.73970.72740.5316
Guo et al. [28] (2023)w0.76580.74070.5528
Ourw0.77620.75880.5746
Disclaimer/Publisher’s Note: The statements, opinions and data contained in all publications are solely those of the individual author(s) and contributor(s) and not of MDPI and/or the editor(s). MDPI and/or the editor(s) disclaim responsibility for any injury to people or property resulting from any ideas, methods, instructions or products referred to in the content.

