

Detection of Secondary Side Position for Segmented Dynamic Wireless Charging Systems Based on Primary Phase Angle Sensing

Abstract
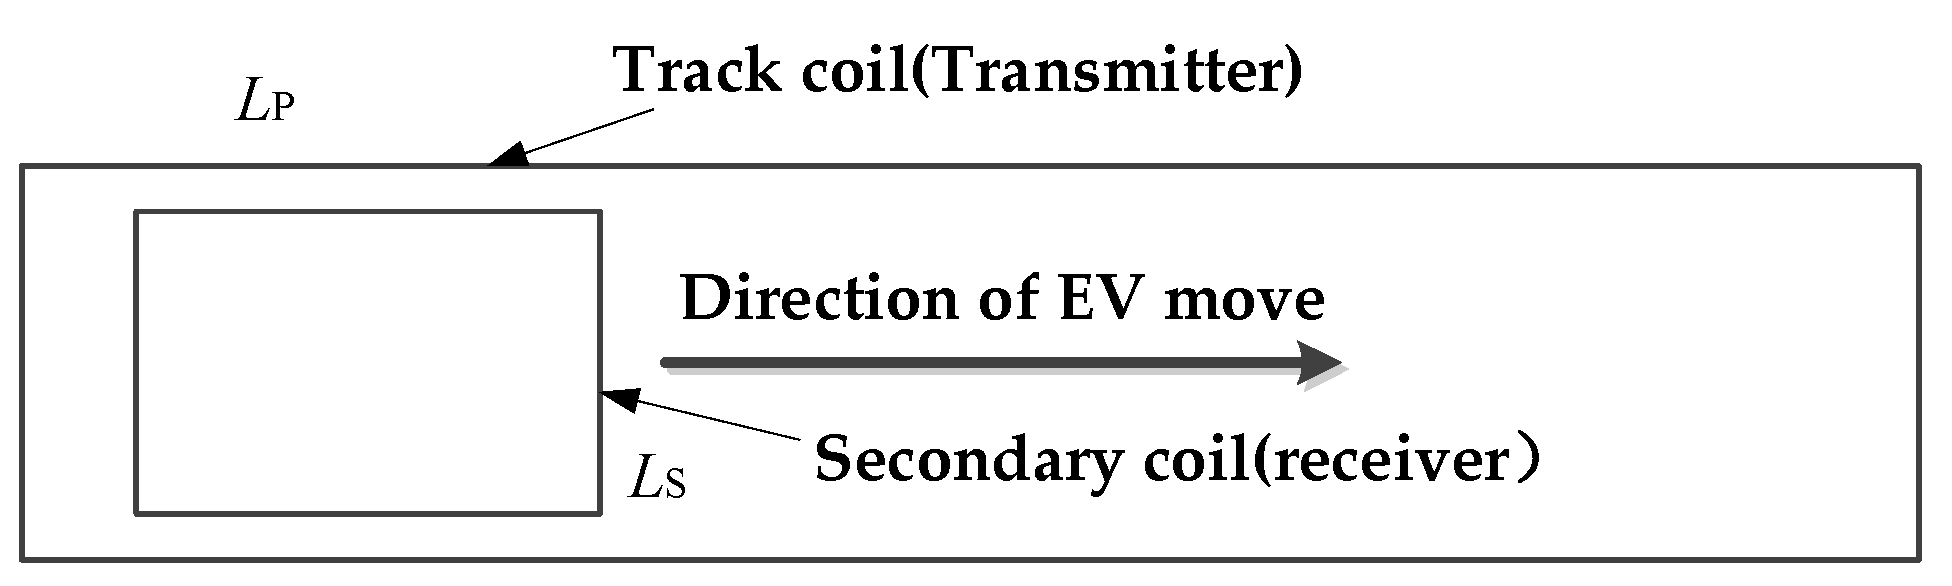
:1. Introduction
2. Analysis of the Impedance Phase Angle Model of the Resonant Port
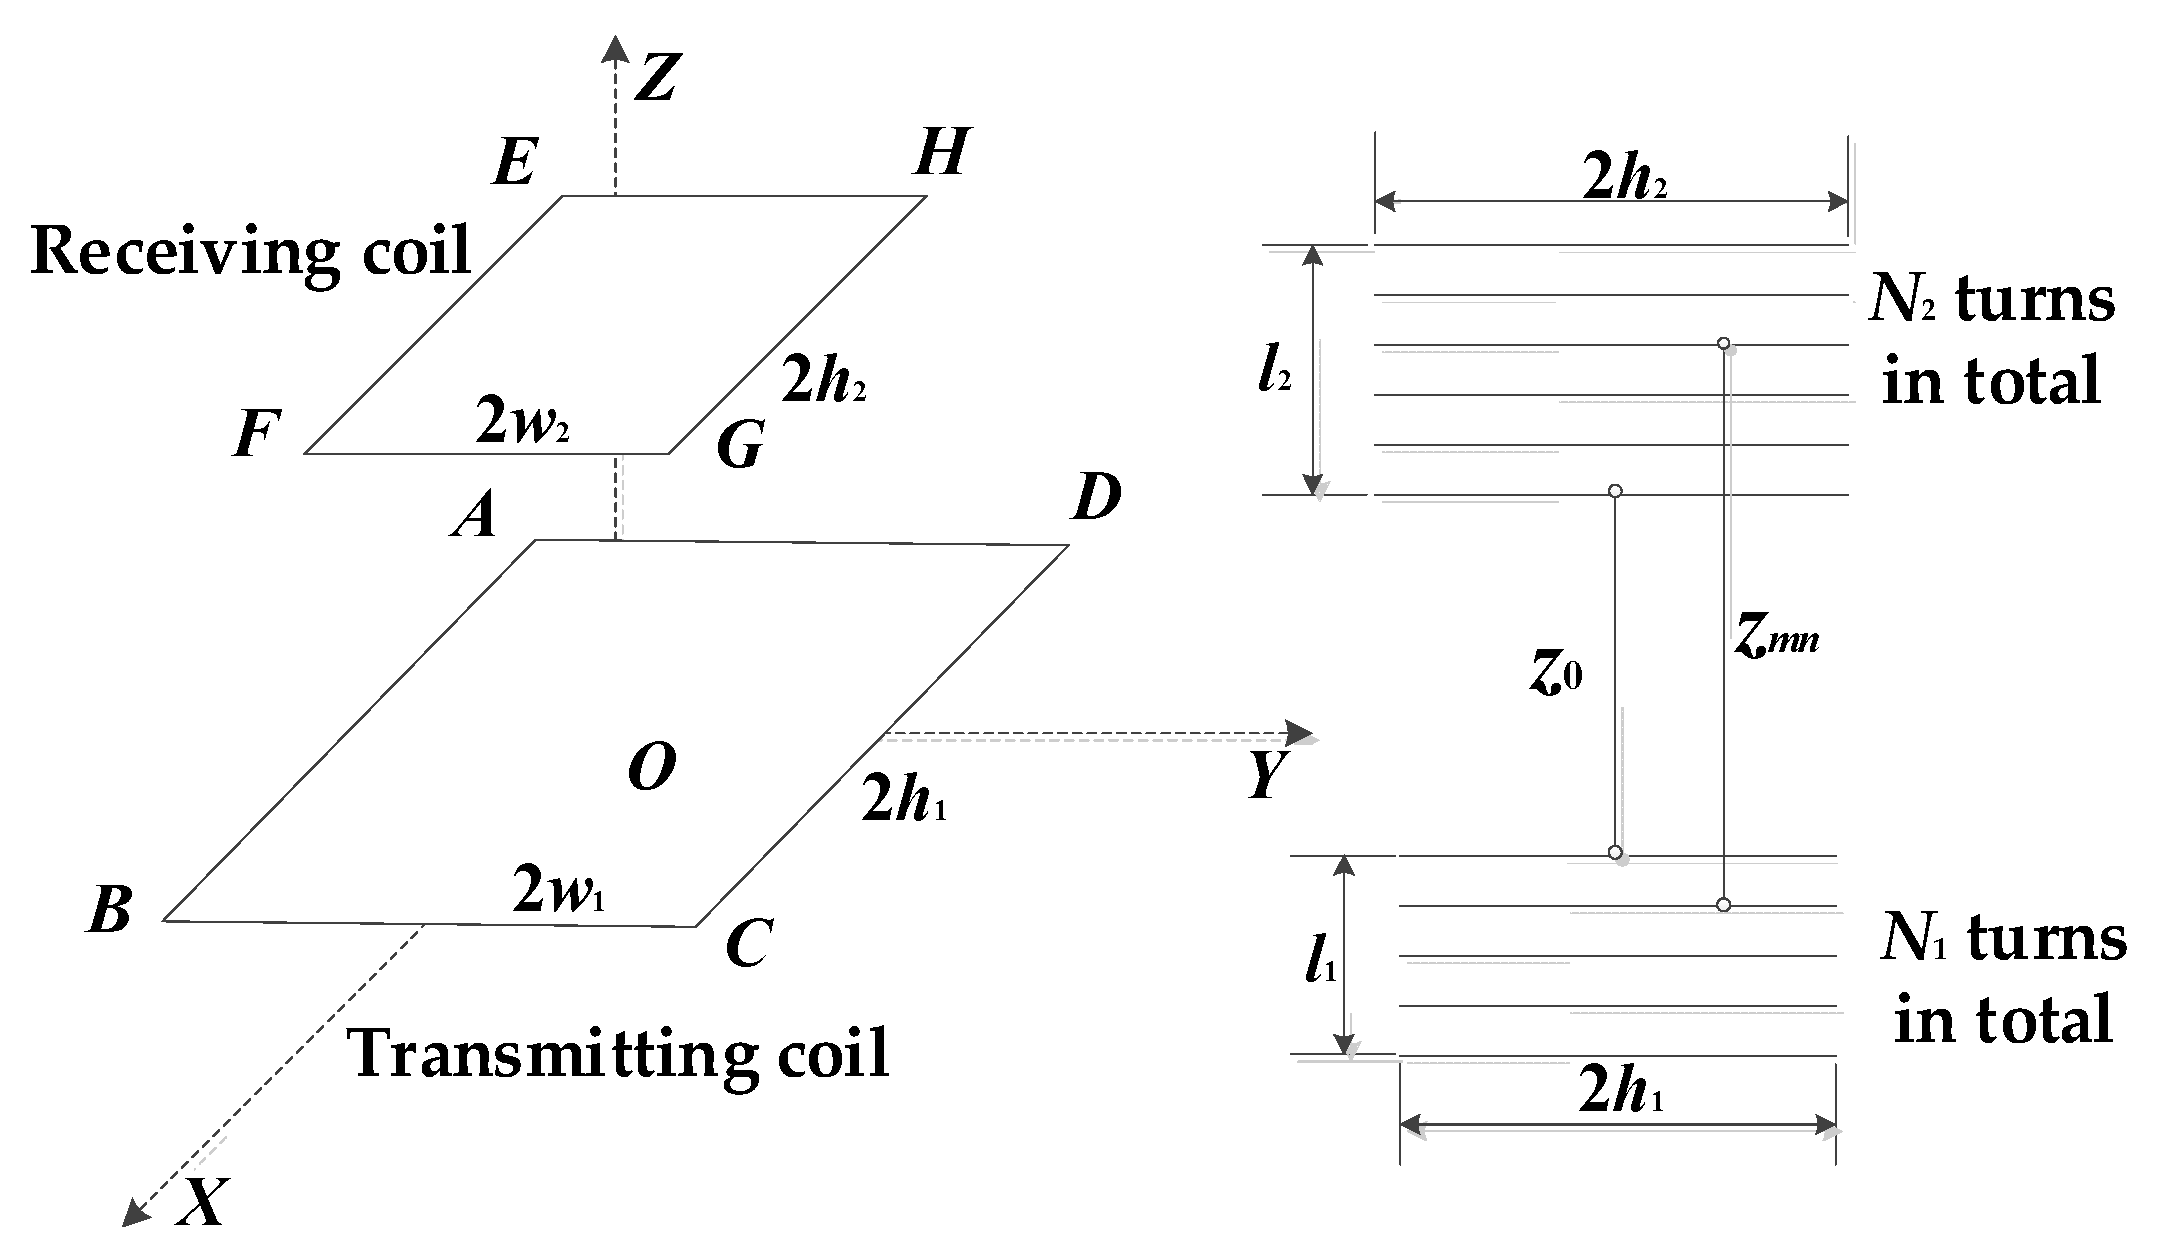
3. Analysis of the Model between Coupling Coefficient and Vehicle Position
4. Analysis of Impedance Phase Angle Sensing Scheme of Parameter Sensitivity and Robustness
4.1. Simulation of Varying with System Frequency and Coupling Coefficient k
4.2. System Robustness
5. Experimental Verification
5.1. Construction of Test Bench
5.2. Experimental Verification
6. Conclusions
Author Contributions
Funding
Data Availability Statement
Conflicts of Interest
References
- Hu, J.S.; Lu, F.; Zhu, C.; Cheng, C.Y.; Chen, S.L.; Ren, T.J.; Mi, C.C. Hybrid Energy Storage System of an Electric Scooter Based on Wireless Power Transfer. IEEE Trans. Ind. Inform. 2018, 14, 4169–4178. [Google Scholar] [CrossRef]
- Li, Y.; Mai, R.; Lu, L.; He, Z. Active and Reactive Currents Decomposition-Based Control of Angle and Magnitude of Current for a Parallel Multiinverter IPT System. IEEE Trans. Power Electron. 2016, 32, 1602–1614. [Google Scholar] [CrossRef]
- Fu, M.; Ma, C.; Zhu, X. A Cascaded Boost–Buck Converter for High-Efficiency Wireless Power Transfer Systems. IEEE Trans. Ind. Inform. 2013, 10, 1972–1980. [Google Scholar] [CrossRef]
- Fu, M.; Zhang, T.; Zhu, X.; Luk, P.C.K.; Ma, C. Compensation of Cross Coupling in Multiple-Receiver Wireless Power Transfer Systems. IEEE Trans. Ind. Inform. 2016, 12, 474–482. [Google Scholar] [CrossRef]
- Khutwad, S.R.; Gaur, S. Wireless charging system for electric vehicle. In Proceedings of the 2016 International Conference on Signal Processing, Communication, Power and Embedded System (SCOPES), Paralakhemundi, India, 3–5 October 2016; pp. 441–445. [Google Scholar]
- Ruffo, R.; Cirimele, V.; Diana, M.; Khalilian, M.; La Ganga, A.; Guglielmi, P. Sensorless Control of the Charging Process of a Dynamic Inductive Power Transfer System with an Interleaved Nine-Phase Boost Converter. IEEE Trans. Ind. Electron. 2018, 65, 7630–7639. [Google Scholar] [CrossRef]
- Danping, Z.; Juan, L.; Yuchun, C.; Yuhang, L.; Zhongjian, C. Research on Electric Energy Metering and Charging System for Dynamic Wireless Charging of Electric Vehicle. In Proceedings of the 2019 4th International Conference on Intelligent Transportation Engineering (ICITE), Singapore, 6–8 September 2019; pp. 252–255. [Google Scholar]
- Mi, C.C.; Buja, G.; Choi, S.Y.; Rim, C.T. Modern advances inwireless power transfer systems for roadway powered electric vehicles. IEEE Trans. Ind. Electron. 2016, 63, 6533–6545. [Google Scholar] [CrossRef]
- Huh, J.; Lee, W.; Cho, G.H.; Lee, B.; Rim, C.T. Characterization of novel Inductive Power Transfer Systems for On-Line Electric Vehicles. In Proceedings of the 2011 Twenty-Sixth Annual IEEE Applied Power Electronics Conference and Exposition (APEC), Fort Worth, TX, USA, 6–11 March 2011; pp. 1975–1979. [Google Scholar]
- Nguyen, T.T.; Pham, X.D.; Song, J.H.; Jin, S.; Kim, D.; Jeon, J.W. Compensating Background for Noise due to Camera Vibration in Uncalibrated-Camera-Based Vehicle Speed Measurement System. IEEE Trans. Veh. Technol. 2010, 60, 30–43. [Google Scholar] [CrossRef]
- Mei, T.X.; Li, H. Measurement of Absolute Vehicle Speed with a Simplified Inverse Model. IEEE Trans. Veh. Technol. 2010, 59, 1164–1171. [Google Scholar] [CrossRef]
- Ki, Y.-K.; Baik, D.-K. Model for accurate speed measurement using double-loop detectors. IEEE Trans. Veh. Technol. 2006, 55, 1094–1101. [Google Scholar] [CrossRef]
- Nagendra, G.R.; Chen, L.; Covic, G.A.; Boys, J.T. Detection of EVs on IPT Highways. IEEE J. Emerg. Sel. Top. Power Electron. 2014, 2, 584–597. [Google Scholar] [CrossRef]
- Hasan, N.; Wang, H.; Saha, T.; Pantic, Z. A novel position sensorless power transfer control of lumped coil-based in-motion wireless power transfer systems. In Proceedings of the 2015 IEEE Energy Conversion Congress and Exposition (ECCE), Montreal, QC, Canada, 20–24 September 2015; pp. 586–593. [Google Scholar]
- Dai, X.; Jiang, J.; Li, Y.; Yang, T. A Phase-Shifted Control for Wireless Power Transfer System by Using Dual Excitation Units. Energies 2017, 10, 1000. [Google Scholar] [CrossRef]
- Cheng, Y.; Shu, Y. A New Analytical Calculation of the Mutual Inductance of the Coaxial Spiral Rectangular Coils. IEEE Trans. Magn. 2013, 50, 1–6. [Google Scholar] [CrossRef]
- Villa, J.L.; Sallán, J.; Llombart, A.; Sanz, J.F. Design of a high frequency Inductively Coupled Power Transfer system for electric vehicle battery charge. Appl. Energy 2009, 86, 355–363. [Google Scholar] [CrossRef]
- Grover, F. Inductance Calculations; D. Van Nostrand Company: New York, NY, USA, 1946. [Google Scholar]


| Parameter | Attribute | Value |
|---|---|---|
| fres | resonant frequency | 85 kHz |
| RP | resistance of the transmitter coil | 0.5 Ω |
| LP | coil inductance at the transmitter | 191.82 μH |
| CP | compensation capacitance at the transmitter | 18.28 nF |
| RS | resistance of receiver coil | 0.5 Ω |
| LS | coil inductance at the receiver | 64.21 μH |
| CS | compensation capacitance at the receiver | 54.61 nF |
| RL | load | 10 Ω |
| Parameter | Attribute | Value |
|---|---|---|
| L1 | coil inductance value of NO.1 transmitter | 186.7μH |
| C1 | compensation capacitance value of NO.1 transmitter | 18.76 nF |
| R1 | resistance of NO.1 transmitter coil | 0.642 Ω |
| f1 | resonant frequency value of NO.1 transmitter | 85.0 kHz |
| L2 | coil inductance value of NO.2 transmitter | 194.73 μH |
| C2 | compensation capacitance value of NO.2 transmitter | 19.76 nF |
| R2 | resistance of NO.2 transmitter coil | 0.612 Ω |
| f2 | resonant frequency value of NO.2 transmitter | 85.0 kHz |
| LS | inductance value of receiving coil | 81.41 μH |
| CS | compensation capacitance value of receiving coil | 43.99 nF |
| RS | load resistance value of receiving coil | 10.27 Ω |
| RESR | resistance of receiving coil | 0.51 Ω |
| fS | resonant frequency value of receiving coil | 85.0 kHz |
| NP | number of turns—transmitter | 15 |
| NS | number of turns—receiver | 18 |
| f | system working frequency | 88.4 kHz |
| M1 | mutual inductance between NO.1 transmitting and receiving when coaxial | 20.75 μH |
| M2 | mutual inductance between NO.2 transmitting and receiving when coaxial | 20.80 μH |
| C | supercapacitance value of energy storage module | 2.5 F |
| Parameter | Attribute | Value |
|---|---|---|
| L1 | coil inductance value of NO.1 transmitter | 184.18 μH |
| 185.80 μH | ||
| C1 | compensation capacitance value of NO.1 transmitter | 19.88 nF |
| 18.14 nF | ||
| f1 | resonant frequency value of NO.1 transmitter | 83.2 kHz |
| 86.7 kHz | ||
| L2 | coil inductance value of NO.2 transmitter | 194.56 μH |
| 195.49 μH | ||
| C2 | compensation capacitance value of NO.2 transmitter | 18.76 nF |
| 17.24 nF | ||
| f2 | resonant frequency value of NO.2 transmitter | 83.4 kHz |
| 86.7 kHz |
Disclaimer/Publisher’s Note: The statements, opinions and data contained in all publications are solely those of the individual author(s) and contributor(s) and not of MDPI and/or the editor(s). MDPI and/or the editor(s) disclaim responsibility for any injury to people or property resulting from any ideas, methods, instructions or products referred to in the content. |
© 2023 by the authors. Licensee MDPI, Basel, Switzerland. This article is an open access article distributed under the terms and conditions of the Creative Commons Attribution (CC BY) license (https://creativecommons.org/licenses/by/4.0/).
Share and Cite
Xiong, W.; Liu, J.; Chen, J.; Hu, D. Detection of Secondary Side Position for Segmented Dynamic Wireless Charging Systems Based on Primary Phase Angle Sensing. Electronics 2023, 12, 2148. https://doi.org/10.3390/electronics12092148
Xiong W, Liu J, Chen J, Hu D. Detection of Secondary Side Position for Segmented Dynamic Wireless Charging Systems Based on Primary Phase Angle Sensing. Electronics. 2023; 12(9):2148. https://doi.org/10.3390/electronics12092148
Chicago/Turabian StyleXiong, Wei, Jiangtao Liu, Jing Chen, and Dewang Hu. 2023. "Detection of Secondary Side Position for Segmented Dynamic Wireless Charging Systems Based on Primary Phase Angle Sensing" Electronics 12, no. 9: 2148. https://doi.org/10.3390/electronics12092148