Article

Research on the Effects of Different Electrolyte Ratios on Heat Loss Control in Lithium-Ion Batteries

1
School of Mechanical Engineering, University of Science and Technology Beijing, Beijing 100083, China
2
Beijing Key Laboratory of Lightweight Metal Forming, Beijing 100083, China
3
Shunde Graduate School, University of Science and Technology Beijing, Foshan 528000, China
*
Author to whom correspondence should be addressed.
Electronics 2023, 12(8), 1876; https://doi.org/10.3390/electronics12081876
Submission received: 26 February 2023 / Revised: 1 April 2023 / Accepted: 14 April 2023 / Published: 16 April 2023

Abstract

:
As the demand for high-performance battery technology increases, the new energy vehicle industry has an urgent need for safer and more efficient battery systems. A model combining five side reactions was developed to be applied to the studies related to this paper. In this paper, the thermal runaway triggering process of Li-ion batteries is simulated, and the relationship between the local heating of the cathode collector surface and the change of the high-temperature area distribution of the diaphragm layer is analyzed. The thermal runaway mechanism is further revealed. Based on the simulation results, the following conclusions can be drawn: phosphonitene compounds can delay the decomposition of the solid electrolyte interphase membrane and reduce the energy yield of battery-side reactions. Compared with the phosphonitene compound, the optimized structure of adding phosphonitene has little effect on the thermal stability of the battery.

1. Introduction

Currently, most of the new energy vehicle battery systems use refilled lead-acid batteries. The technology for these two types of batteries is relatively mature [1,2,3], and the search for higher-performance batteries is imminent. Due to the increasing demand for higher-performance batteries, lithium-ion batteries are challenging these new battery systems. Compared to conventional lead-zinc batteries, lithium-ion batteries have a better energy density [4,5,6]. Given their superior performance, lithium-ion batteries have attracted much attention recently as a power source for electric vehicles and electronic load devices [7,8,9,10]. While chemical properties such as battery capacity and high-magnification performance have improved due to the thermal runaway prognosis of battery systems using the modified multi-scale entropy in real-world electric vehicles, the thorny issue of lithium-ion battery safety has not yet been addressed [11,12,13,14].
The safety of lithium-ion batteries has been a serious impediment to their widespread use in electric and hybrid vehicles [15,16,17]. Because the electrolyte in high-energy batteries is a flammable organic solvent, lithium-ion batteries can suffer thermal runaway under various electromechanical-electrical-thermal abuse conditions, such as overcharging, external shocks, and thermal shock. Thermal runaways in lithium-ion batteries can cause high temperatures, smoke, explosions, and fires [18,19]. In recent years, many efforts have been made to improve the safety of battery materials. In order to obtain a more stable and safer high-energy lithium-ion battery, a more stable and high-performance electrolyte needs to be applied to the battery system. Systematic approaches and technological breakthroughs based on electrolyte research are essential in studying lithium-ion batteries, and better electrolytes facilitate stable improvements in high-energy lithium-ion battery systems [20].
The addition of flame retardants to the electrolyte is one of the most effective ways to improve the safety of lithium-ion batteries today. It has elucidated the mechanism of action of trimethyl phosphate (TMP) by studying the effect of TMP on the thermal stability of electrolytes. The results showed that TMP, when subjected to thermal decomposition and vaporization, produces free radicals of both phosphorus, which can combine with hydrogen radicals and reduce the content of hydrogen radicals in the reaction system, effectively inhibiting the combustion process of electrolytes [21]. A large number of new organic films have been used as flame retardants for lithium-ion batteries and have been verified to have better flame retardancy, providing a safer electrolyte for lithium-ion batteries [22,23]. From the above studies, it can be seen that conducting research on composite flame retardants with characteristics such as a low melting point, a high flash point, a low viscosity, stable electrochemical properties, and efficient flame retardant properties is one of the critical development directions for flame retardant additives for lithium-ion batteries.
Therefore, in this paper, a thermal model combining five side reactions is established in COMSOL to simulate the thermal runaway process of lithium-ion battery cells, and the effect of local heating of lithium-ion batteries under different heat dissipation conditions on the change in the distribution of the high-temperature region of the diaphragm is mainly analyzed to reveal further the effect of varying electrolyte ratios on the thermal runaway of lithium-ion batteries.

2. Model Design and Construction

2.1. Numerical Model

Consider a cylindrical lithium-ion cell of radius R, radial thermal conductivity kr, heat capacity Cp, and mass density r. The cell experiences a temperature-dependent internal heat generation rate Q(T) throughout its volume and is being cooled at the outside surface with a convective heat transfer h due to a mechanism such as a coolant flow. The interest is in determining the parameter space within which the cell will not undergo thermal runaway, i.e., the cell temperature does not become unbounded. In this case, the governing energy equation for the temperature rise T(r,t) in the cell is given by:
Q ( T ) = Q S E I ( t ) + Q a n o d e ( t ) + Q P V D F ( t ) + Q c a t h o d e ( t ) + Q e
where Q(T) is the total heat yield of the reaction. QSEI is the heat generated by the decomposition of the SEI membrane, and Qanode/Qcathode is the heat generated by the reaction between the anode/cathode and the electrolyte, respectively. QPVDF is the heat generated by the reaction of the binder. Qe is the heat generated by the reaction of the electrolyte.
k r ( 2 T r 2 + 1 r T r ) + Q ( T ) = ρ · C P T t
T r = 0   at   r = 0
k r ( T r ) = h ( T T 0 )   at   r = R
Equations (1)–(3) can be used to determine whether a set of preconditions can prevent thermal runaway by ensuring that T is a bounded solution at all times. A Taylor series expansion with T = ¼ T0 is first performed for Q(T), where the terms of second-order and higher are ignored.
k r ( 2 T r 2 + 1 r T r ) + Q ( T 0 ) + β ( T T 0 ) = ρ C p T t
where β = d Q d T is the slope of Q(T).
To solve Equation (4), we note that the heat generation term can be linearly divided into two components, (Q(T0) − bT0) and bT. The first component is a constant, which is known from heat conduction theory and will lead to a stable temperature field. However, the second heat generation component bT increases with temperature and may lead to an unbounded temperature. T2(r,t) represents the temperature increase caused by the second heat-generating component, using the variable separation technique in the following equation:
T 2 ( r , t ) = n = 1 C n J O ( μ n r R ) · exp ( k r ρ · C P ( β k r μ n 2 R 2 ) · t )
where J0 is the Bessel function of the first kind of order 0, Cn is constant coefficients, and μ n are the non-dimensional eigenvalues given by the roots of the equation.
B i · J 0 ( x ) x J 1 ( x ) = 0
where B i = h R K r is the Biot number. Note that Cn is obtained using orthogonality and the initial condition of the temperature field. The temperature solution in Equation (5) may be either bounded or unbounded depending on the sign of the term within the exponential function in Equation (6).
The negative electrode is protected from direct reaction with solvent by an ionically conducting film called SEI. Solid electrolyte films are formed during the initial cycle of a lithium-ion battery. SEI films that are too thick or so thin that they are non-existent are not suitable for lithium battery applications. The presence of a reasonable SEI film protects the cathode active material from reacting with the electrolyte. Regarding the cycle life and safety of Li-ion batteries, when the internal temperature of the battery reaches about 130 °C, the SEI film decomposes, resulting in a completely exposed negative electrode and a large amount of exothermic decomposition of the electrolyte on the electrode surface, leading to a rapid increase in the internal temperature of the battery. This is the first exothermic side reaction inside the Li-ion battery and the starting point of a series of thermal runaway problems. The heat generation equation is shown in Equation (7):
R s e i = A s e i exp [ E a , s e i R T ] c s e i m s e i
where cSEI is the dimensionless number of lithium-containing meta-stable products in the SEI.
At elevated temperatures (>120 °C), an exothermic reaction between intercalated lithium and electrolyte can occur. The heat generation equation is shown in Equation (8):
R n e = A n e exp [ E a , n e R T ] c n e m n e
where cne is the dimensionless number of the lithium-containing meta-stable products in the reaction.
The cathode material reacts with the electrolyte under oxidizing conditions. It is mainly various types of lithium compounds, which always react with the electrolyte in trace amounts under different environmental conditions and with different intensities of reaction. The cathode material reacts with the electrolyte to produce insoluble products, making the reaction irreversible. The cathode material involved in the reaction loses its original structure, and the lithium power battery loses its corresponding power and permanent capacity. The reaction is called the positive-solvent reaction. The heat generation equation is shown in Equation (9):
R p e = A p e exp [ E a , p e R T ] c p e m p e
where cpe is the dimensionless number of the lithium-containing meta-stable products in the reaction.
Due to the exothermic side reactions of the electrolyte at the negative electrode, the internal temperature of the cell is increasing, which in turn leads to further thermal decomposition of LiPF6 and the solvent within the electrolyte. The electrolyte can decompose exothermically at elevated temperatures (>200 °C), as expressed in Equation (10):
R e = A e exp [ E a , e R T ] c e m e
where ce is the dimensionless number of the lithium-containing meta-stable products in the SEI.
When the temperature is about 513.15 K, the binder starts to react. The reaction can be expressed in Equation (11).
R p v d f = A p v d f exp [ E a , p v d f R T ] c p v d f m p v d f
The five mentioned reactions are SEI-decomposition, negative-solvent, positive-solvent, electrolyte decomposition, and the binder reaction. These are the five reactions in the model that have the most significant effect on the thermal phenomena in the reaction. In this simulation, the thermal runaway phenomenon will be analyzed under the above five reactions and the heat transfer of the lithium battery itself. The specific simulation parameters for the five layers are shown in Table 1. The specific simulation parameters for the five layers are shown in Table 2 [24].
The SEI membrane is insoluble in organic solvents and effectively prevents the co-embedding of solvent molecules, thus greatly improving the cycling performance and service life of the electrode. The crystallinity of the material has a great influence on the formation of the SEI film during the first charging process. The electrolyte conductive agent inside the battery also has an important influence on the SEI film. If the conductive agent in the electrode is not uniformly dispersed, it will lead to an uneven SEI film, and different conductivity will be generated in each part.

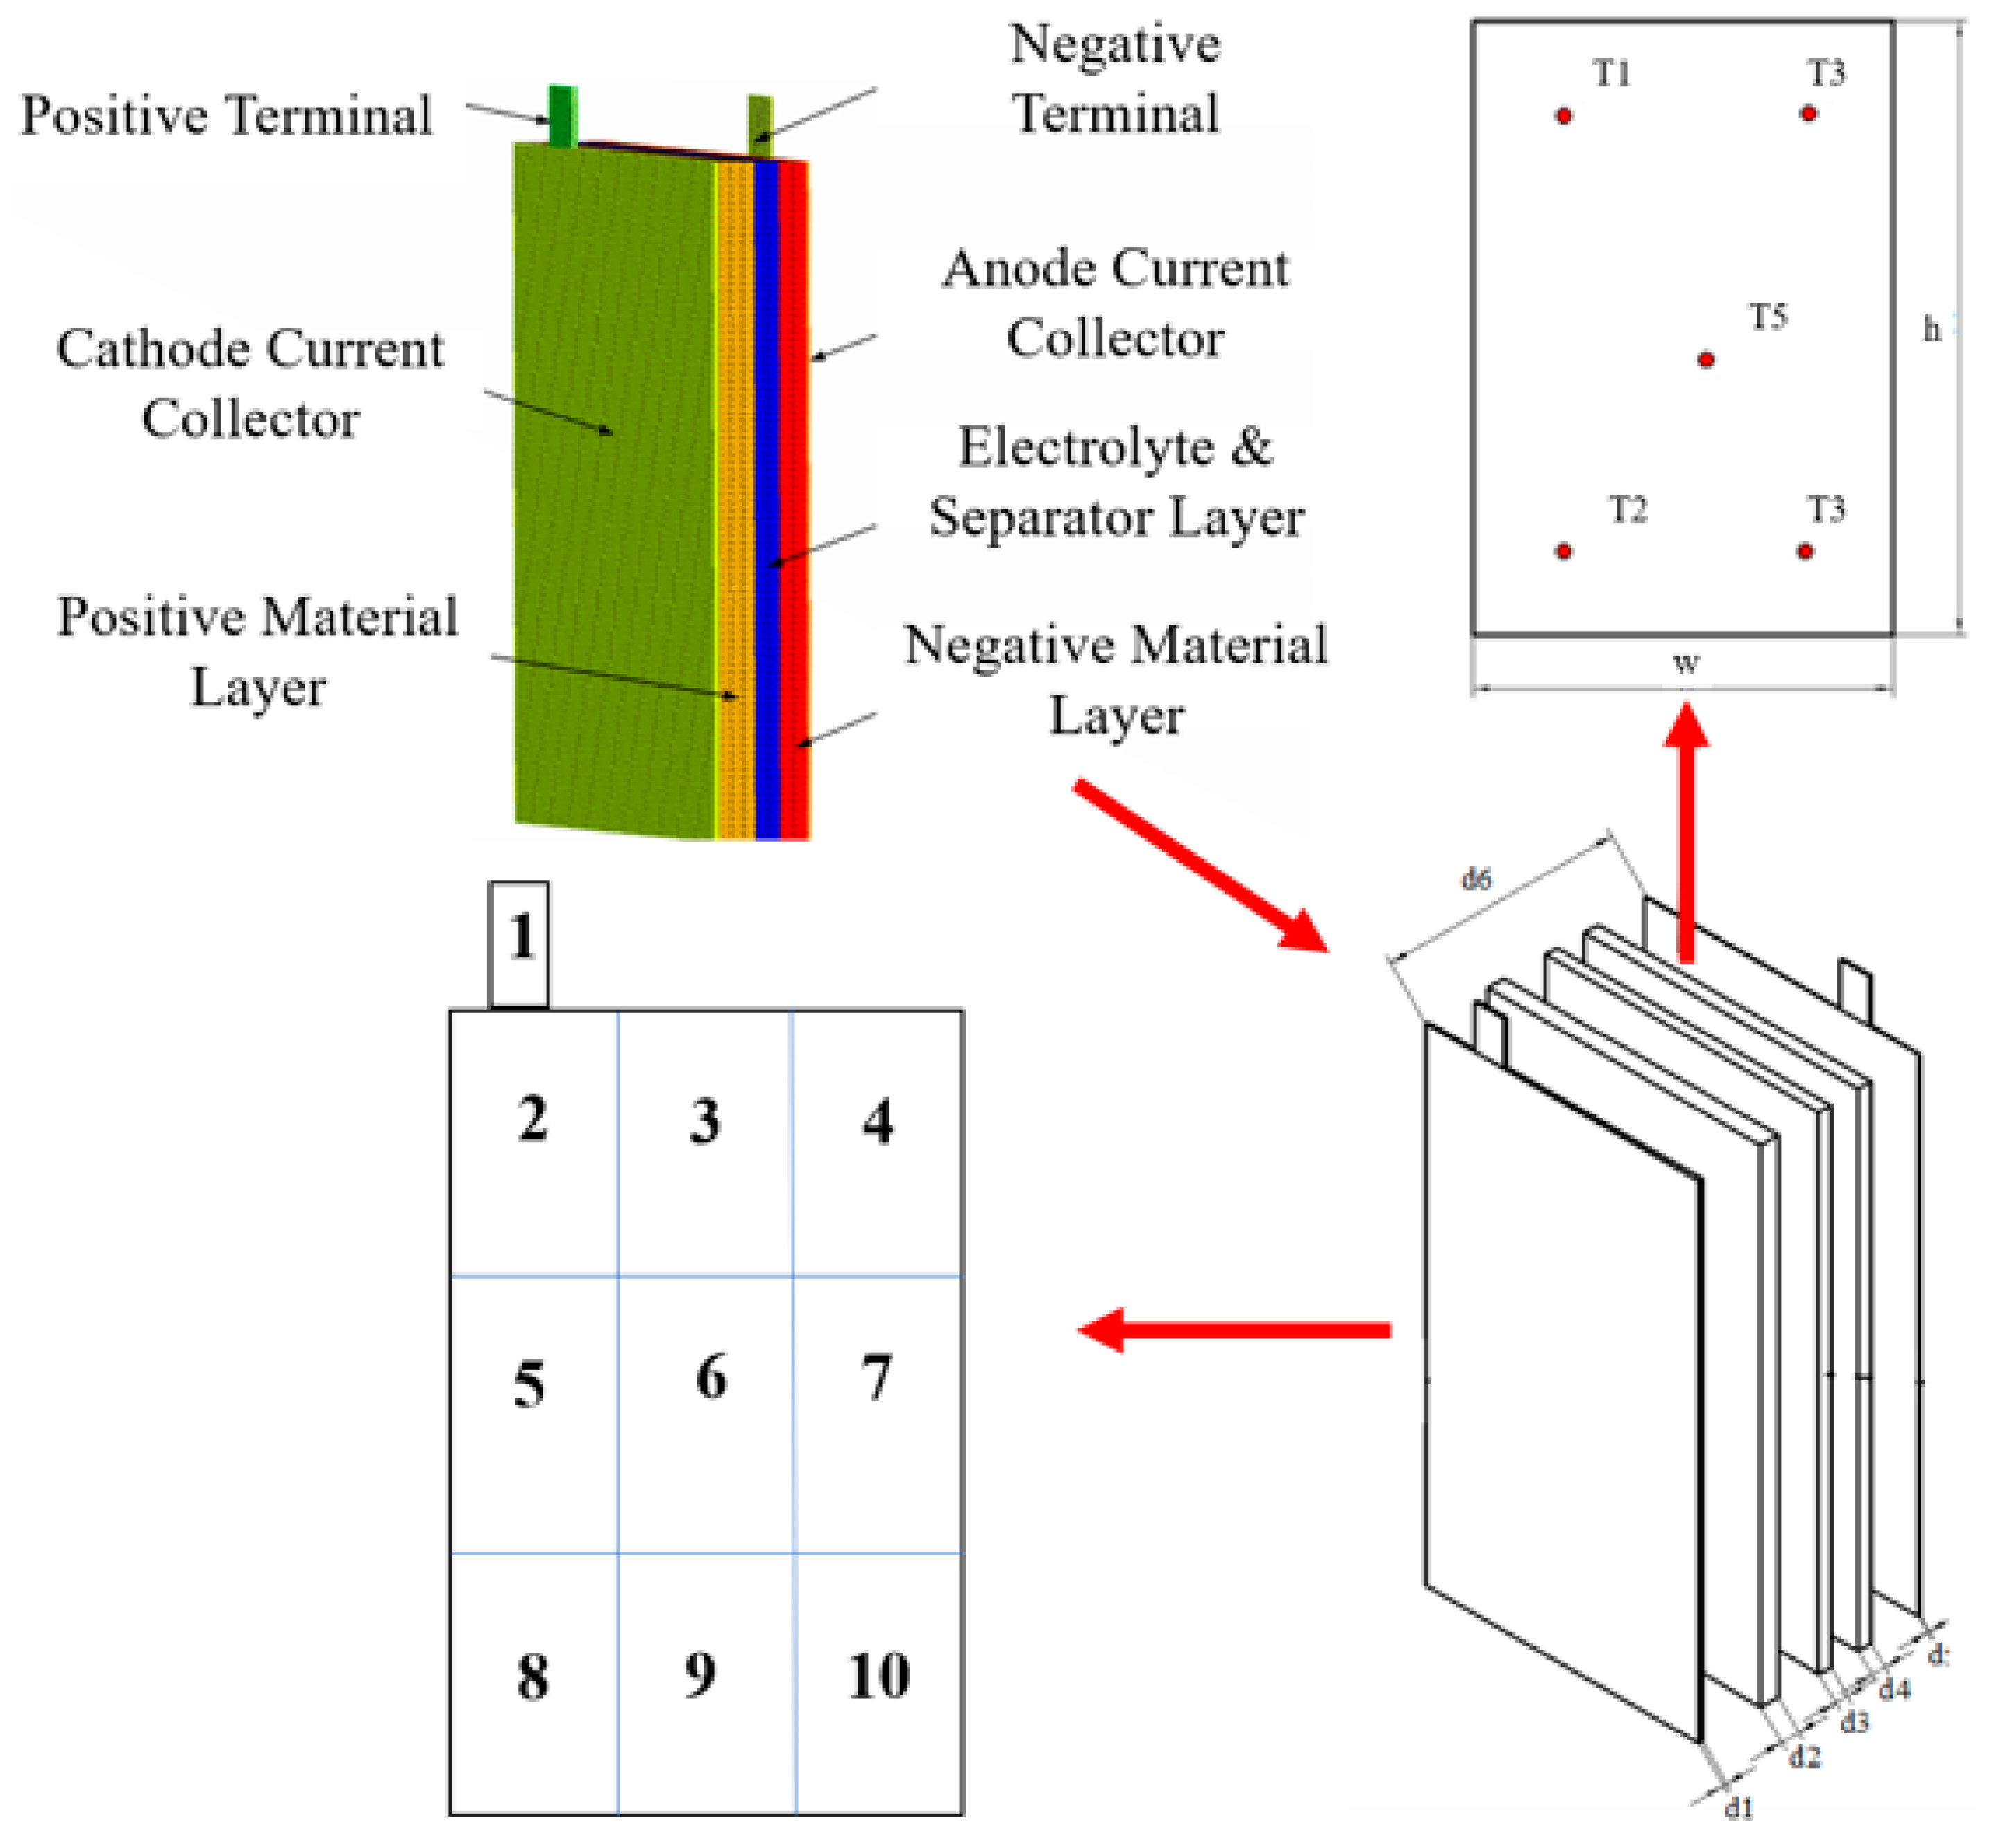
2.2. Three-Dimensional Model

In the previous section, a heat transfer model was developed based on the object of study in this paper, which is a mathematical model created after taking into account the factors ignored by this paper. In this section, the three-dimensional physical model that was input into COMSOL is presented. The simulations involved in this study were then performed after inputting the mathematical model into the physical model. The parameters of the numerical model are set to describe the thermochemical reactions, such as heat production and heat transfer in the reaction. Based on the parameter settings and the numerical model described above, a 3D model that can simulate the 3D shape of the object and visualize the simulation results is created. Both use the same Cartesian coordinate system. The 3D model is an external feature of the numerical model simulation results.
The mathematical model established in the previous section can describe the variation of heat production and heat dissipation in the simplified lithium battery.
Actually, the internal structure of a lithium-ion battery has many layers, and the thickness of each layer is skinny. The computation will be extensive if it is modeled as the actual battery. As a result, a 3D model has been established in COMSOL Multiphysics that has five layers (the cathode current collector layer, the positive material layer, the electrolyte and separator layer, the negative material layer, and the anode current collector layer) and two terminals (the positive terminal and the negative terminal) according to the different side reactions of different parts of the lithium-ion battery in this paper. Figure 1 shows the simplified model geometry, the five temperature measuring points on the separator layer, and the computational mesh, and the total number is 375,793. The specific size of each layer and the battery cell are listed in Table 2.

2.3. Boundary Condition

The heating location is the cathode current collector, which is divided into ten zones (shown in Figure 1 and numbered 1 to 10), and the heating is listed in Table 3. The boundary conditions for some of the simulations are shown in Table 4. In these tests, the test locations are 1, 2, and 3. The environment is assumed to be air with an ambient temperature of 293.15 K.
The object of the modeling study is a cobalt-manganese lithium battery with a rated voltage of 3.4 V. The cathode material is a mixture of nickel, cobalt, and manganese graphite anode material. The electrolyte is LiPF6.

3. Thermal Runaway Simulation

Tests 1, 2, and 3 are thermal runaway simulations for a battery without any flame retardant. Tests 4, 5, and 6 are thermal runaway simulation results for a battery with the addition of a phosphonitene compound. Tests 7, 8, and 9 had phosphorus and nitrogen added [25,26,27,28,29].

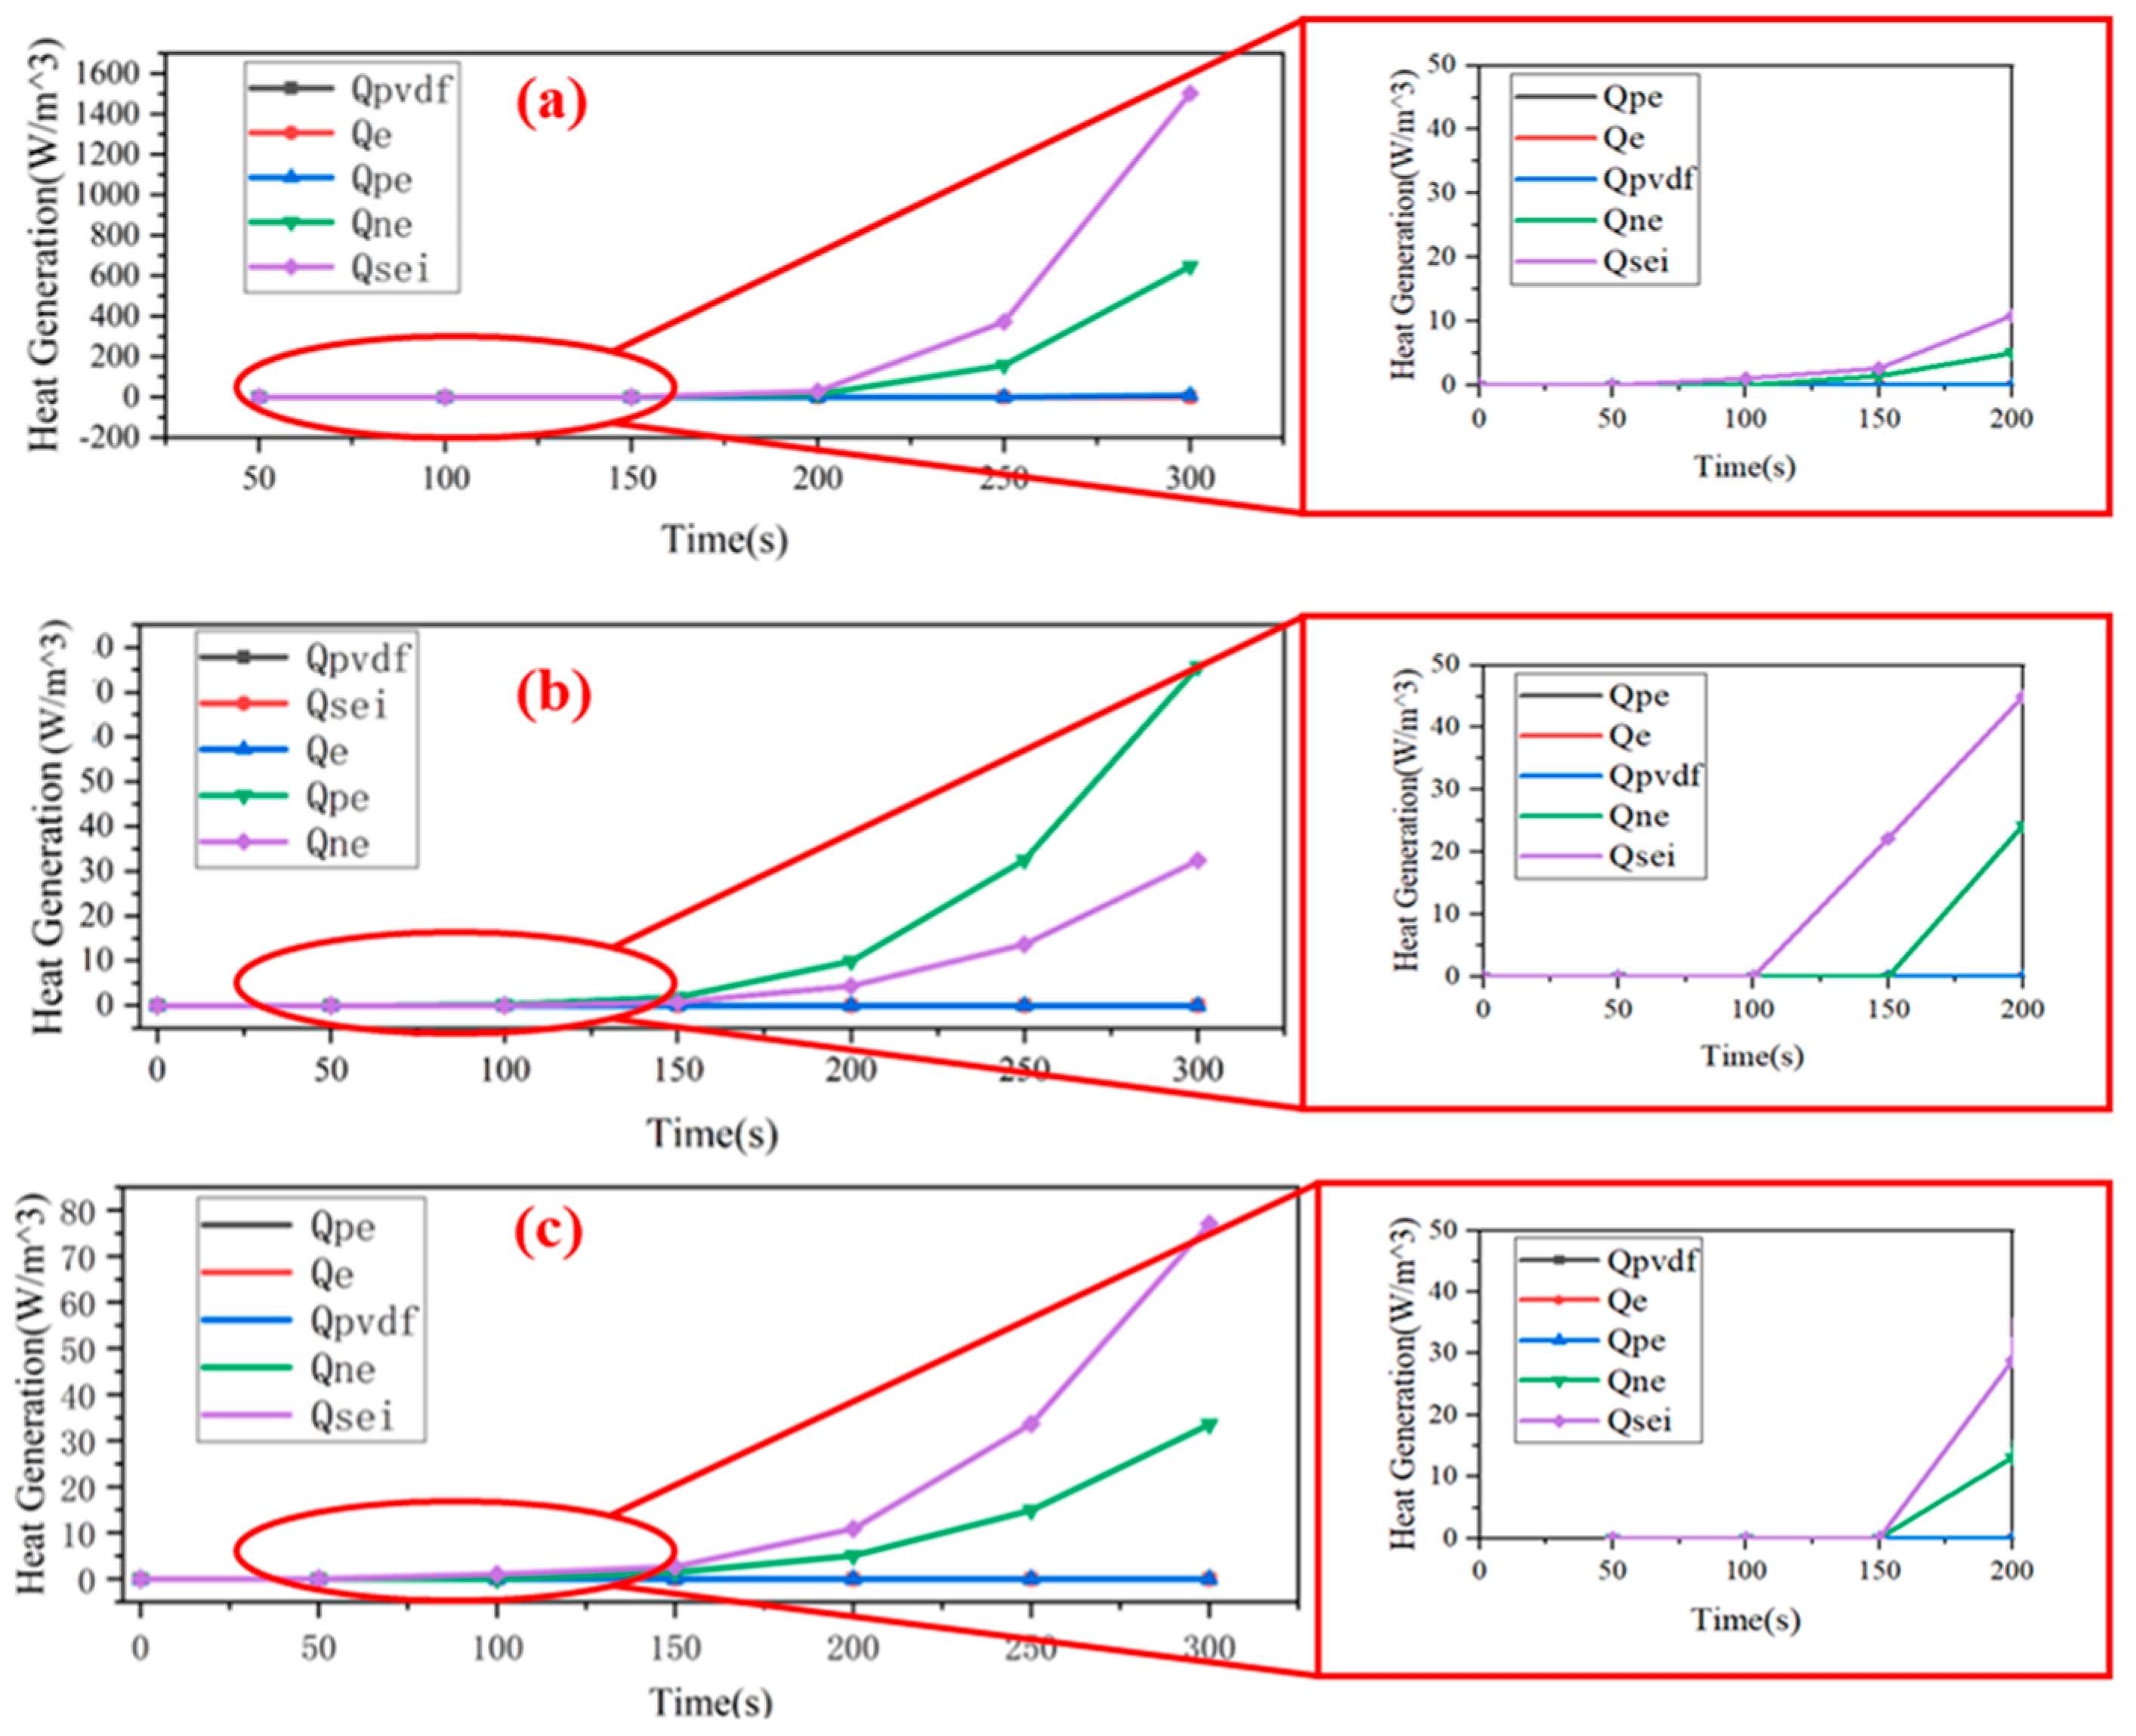
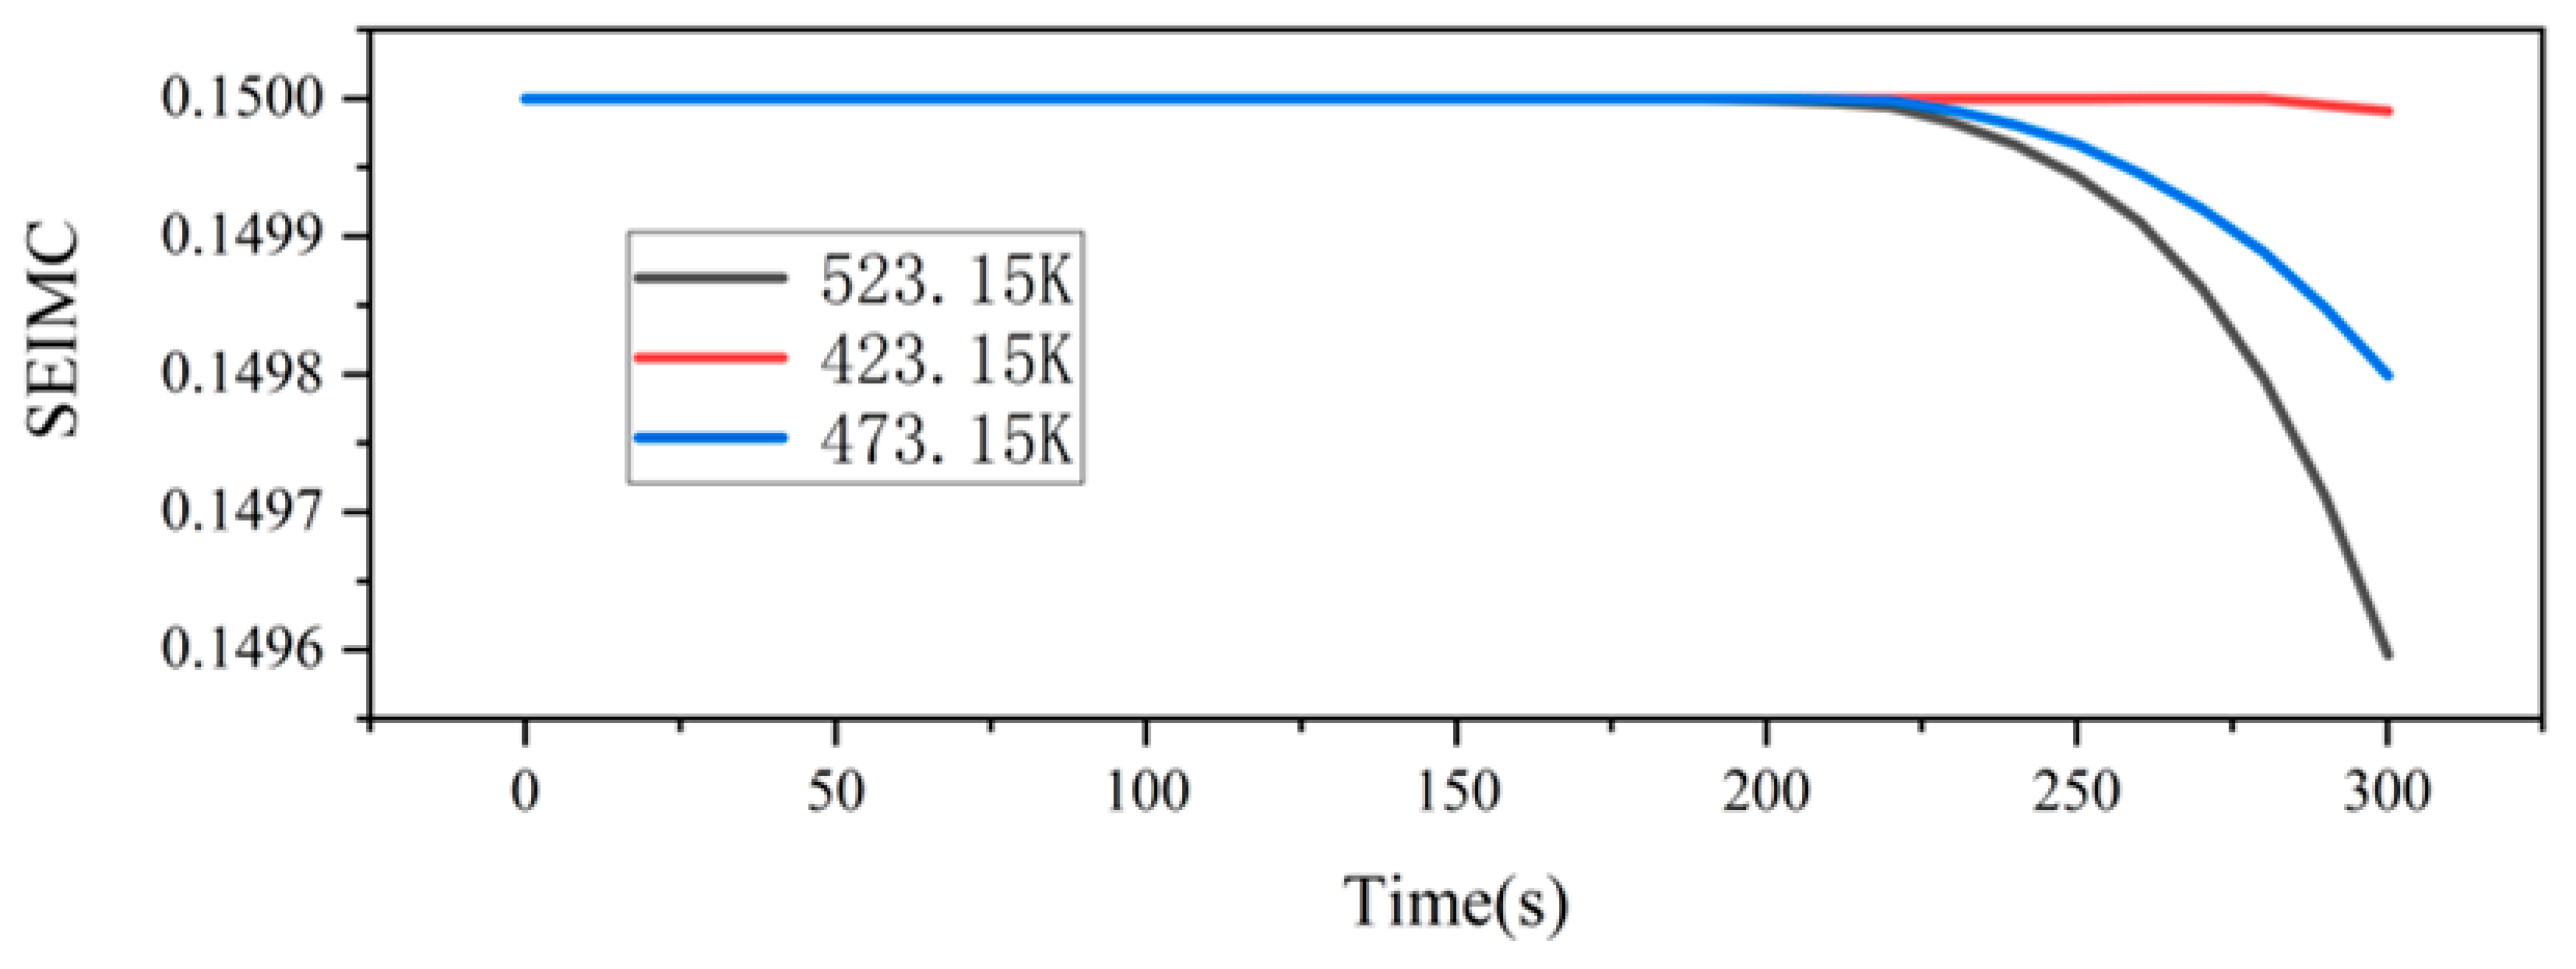
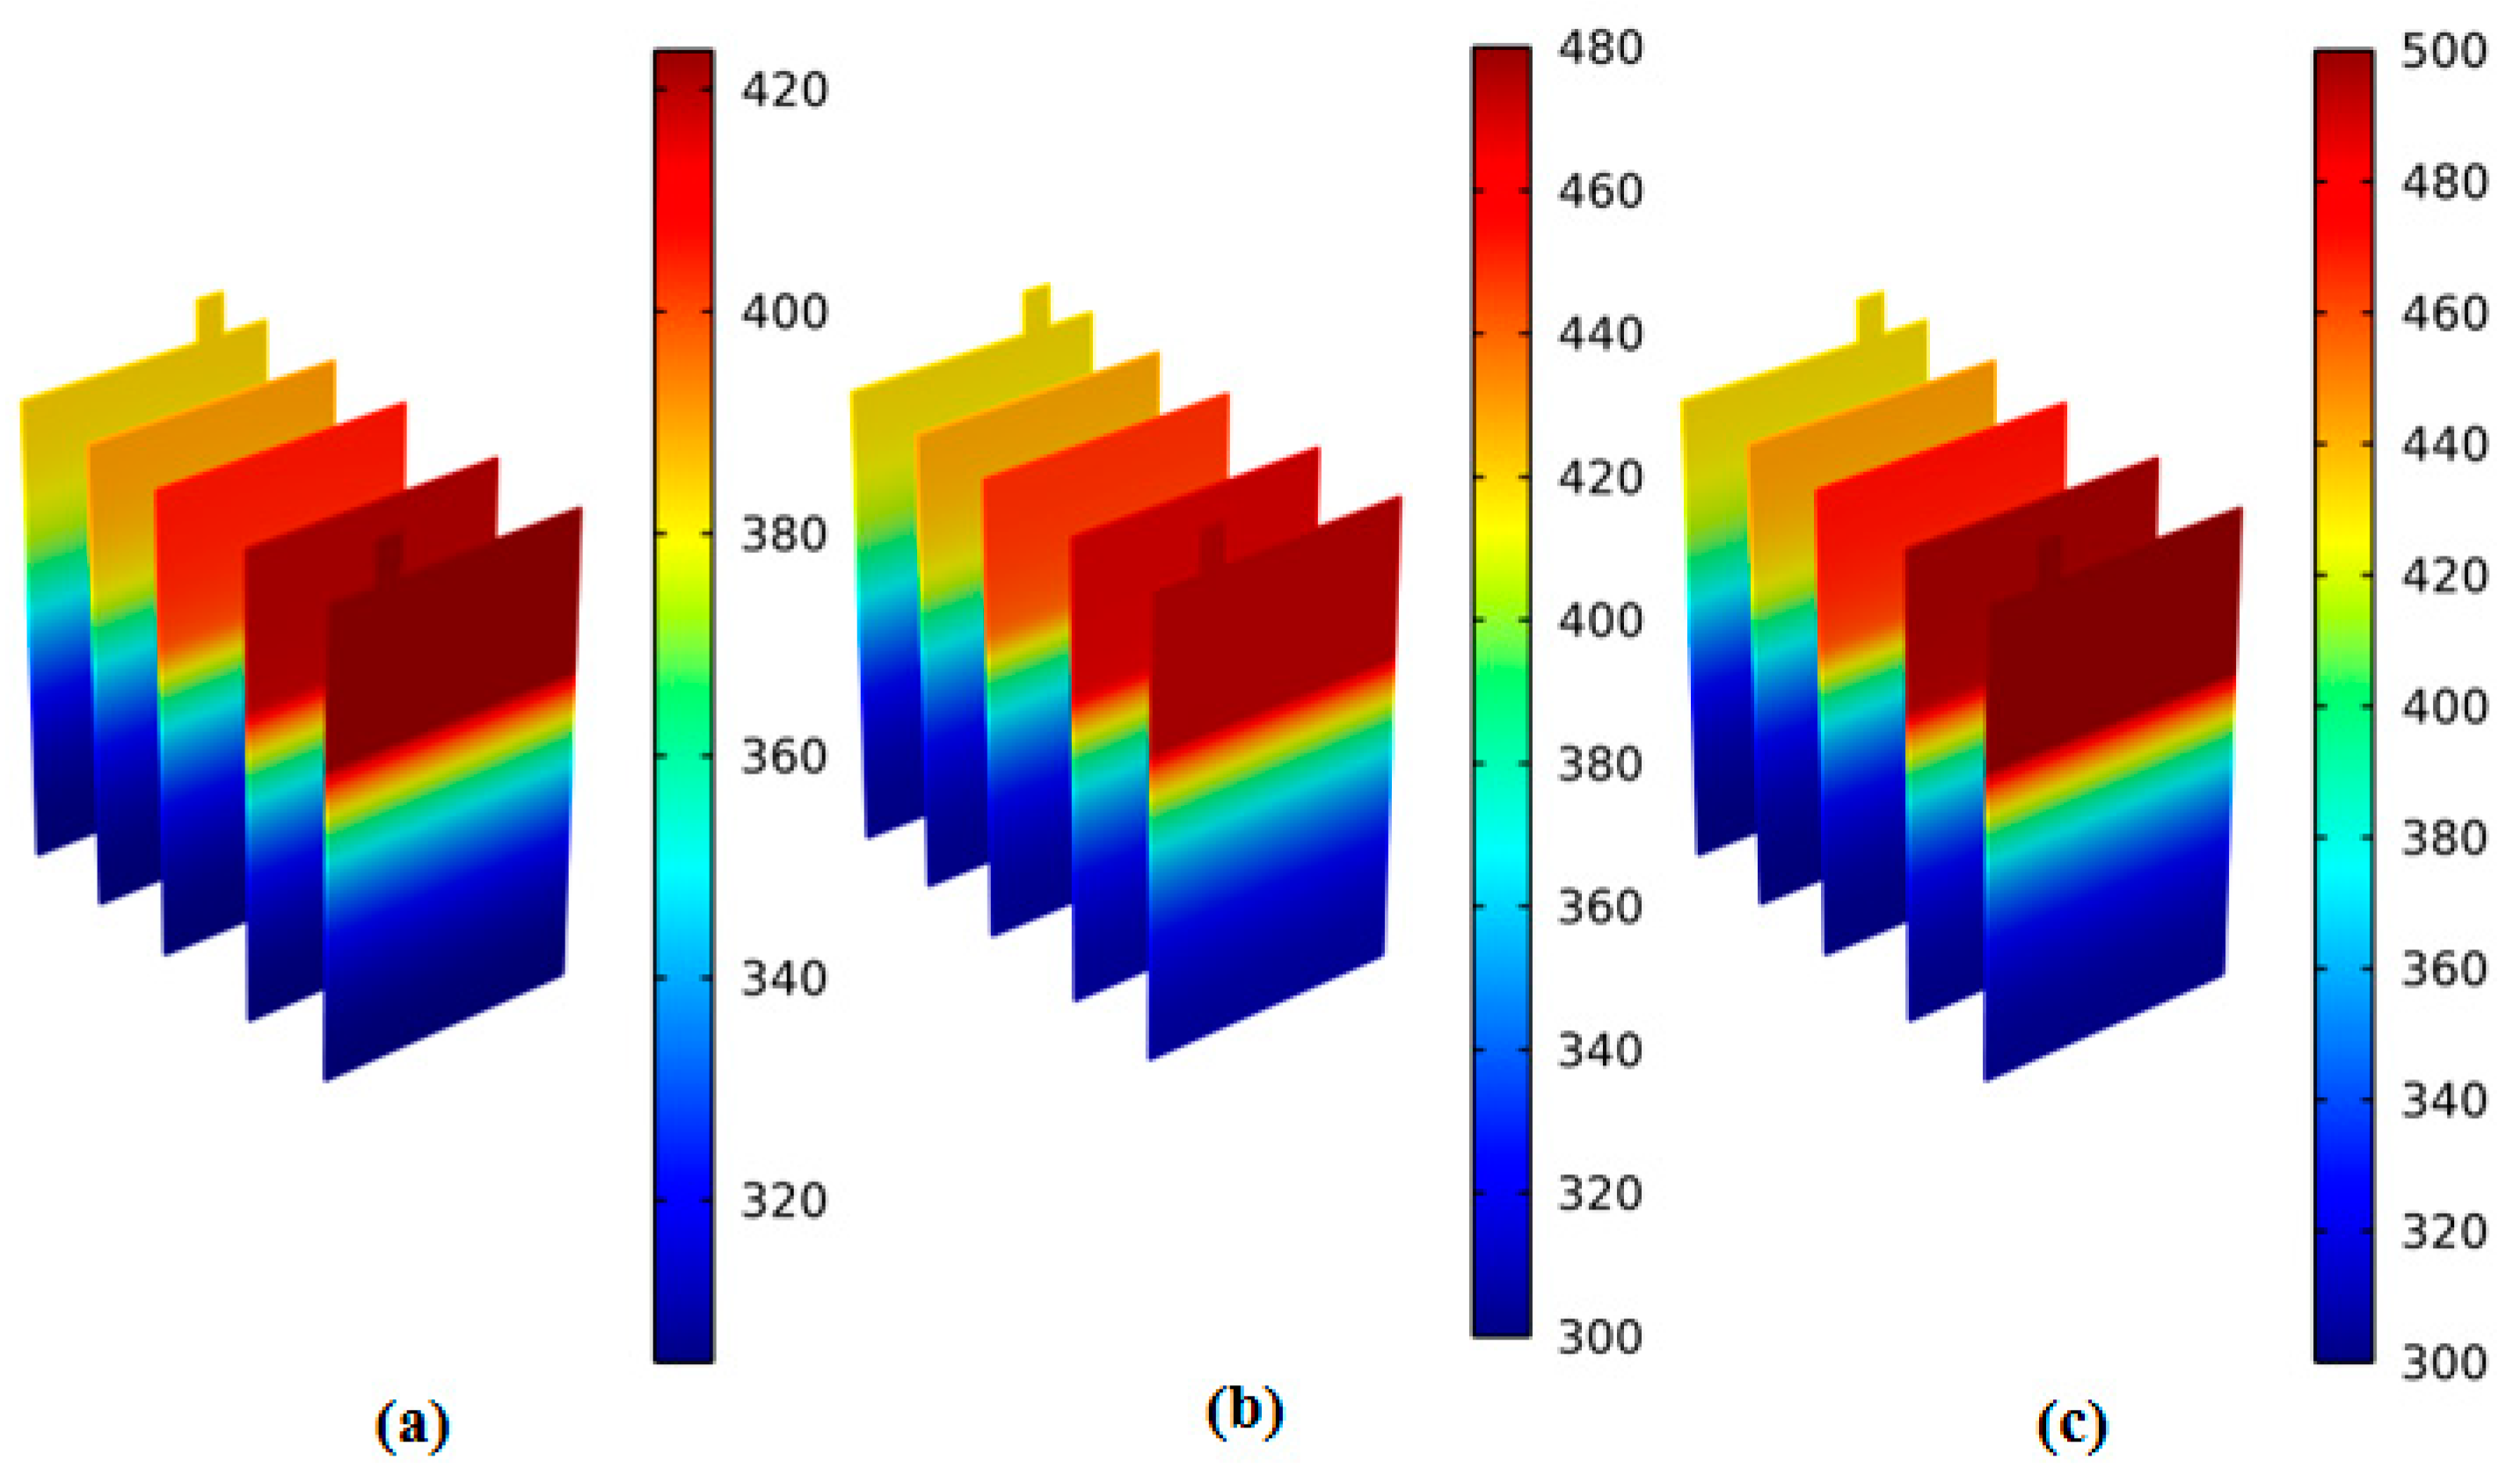
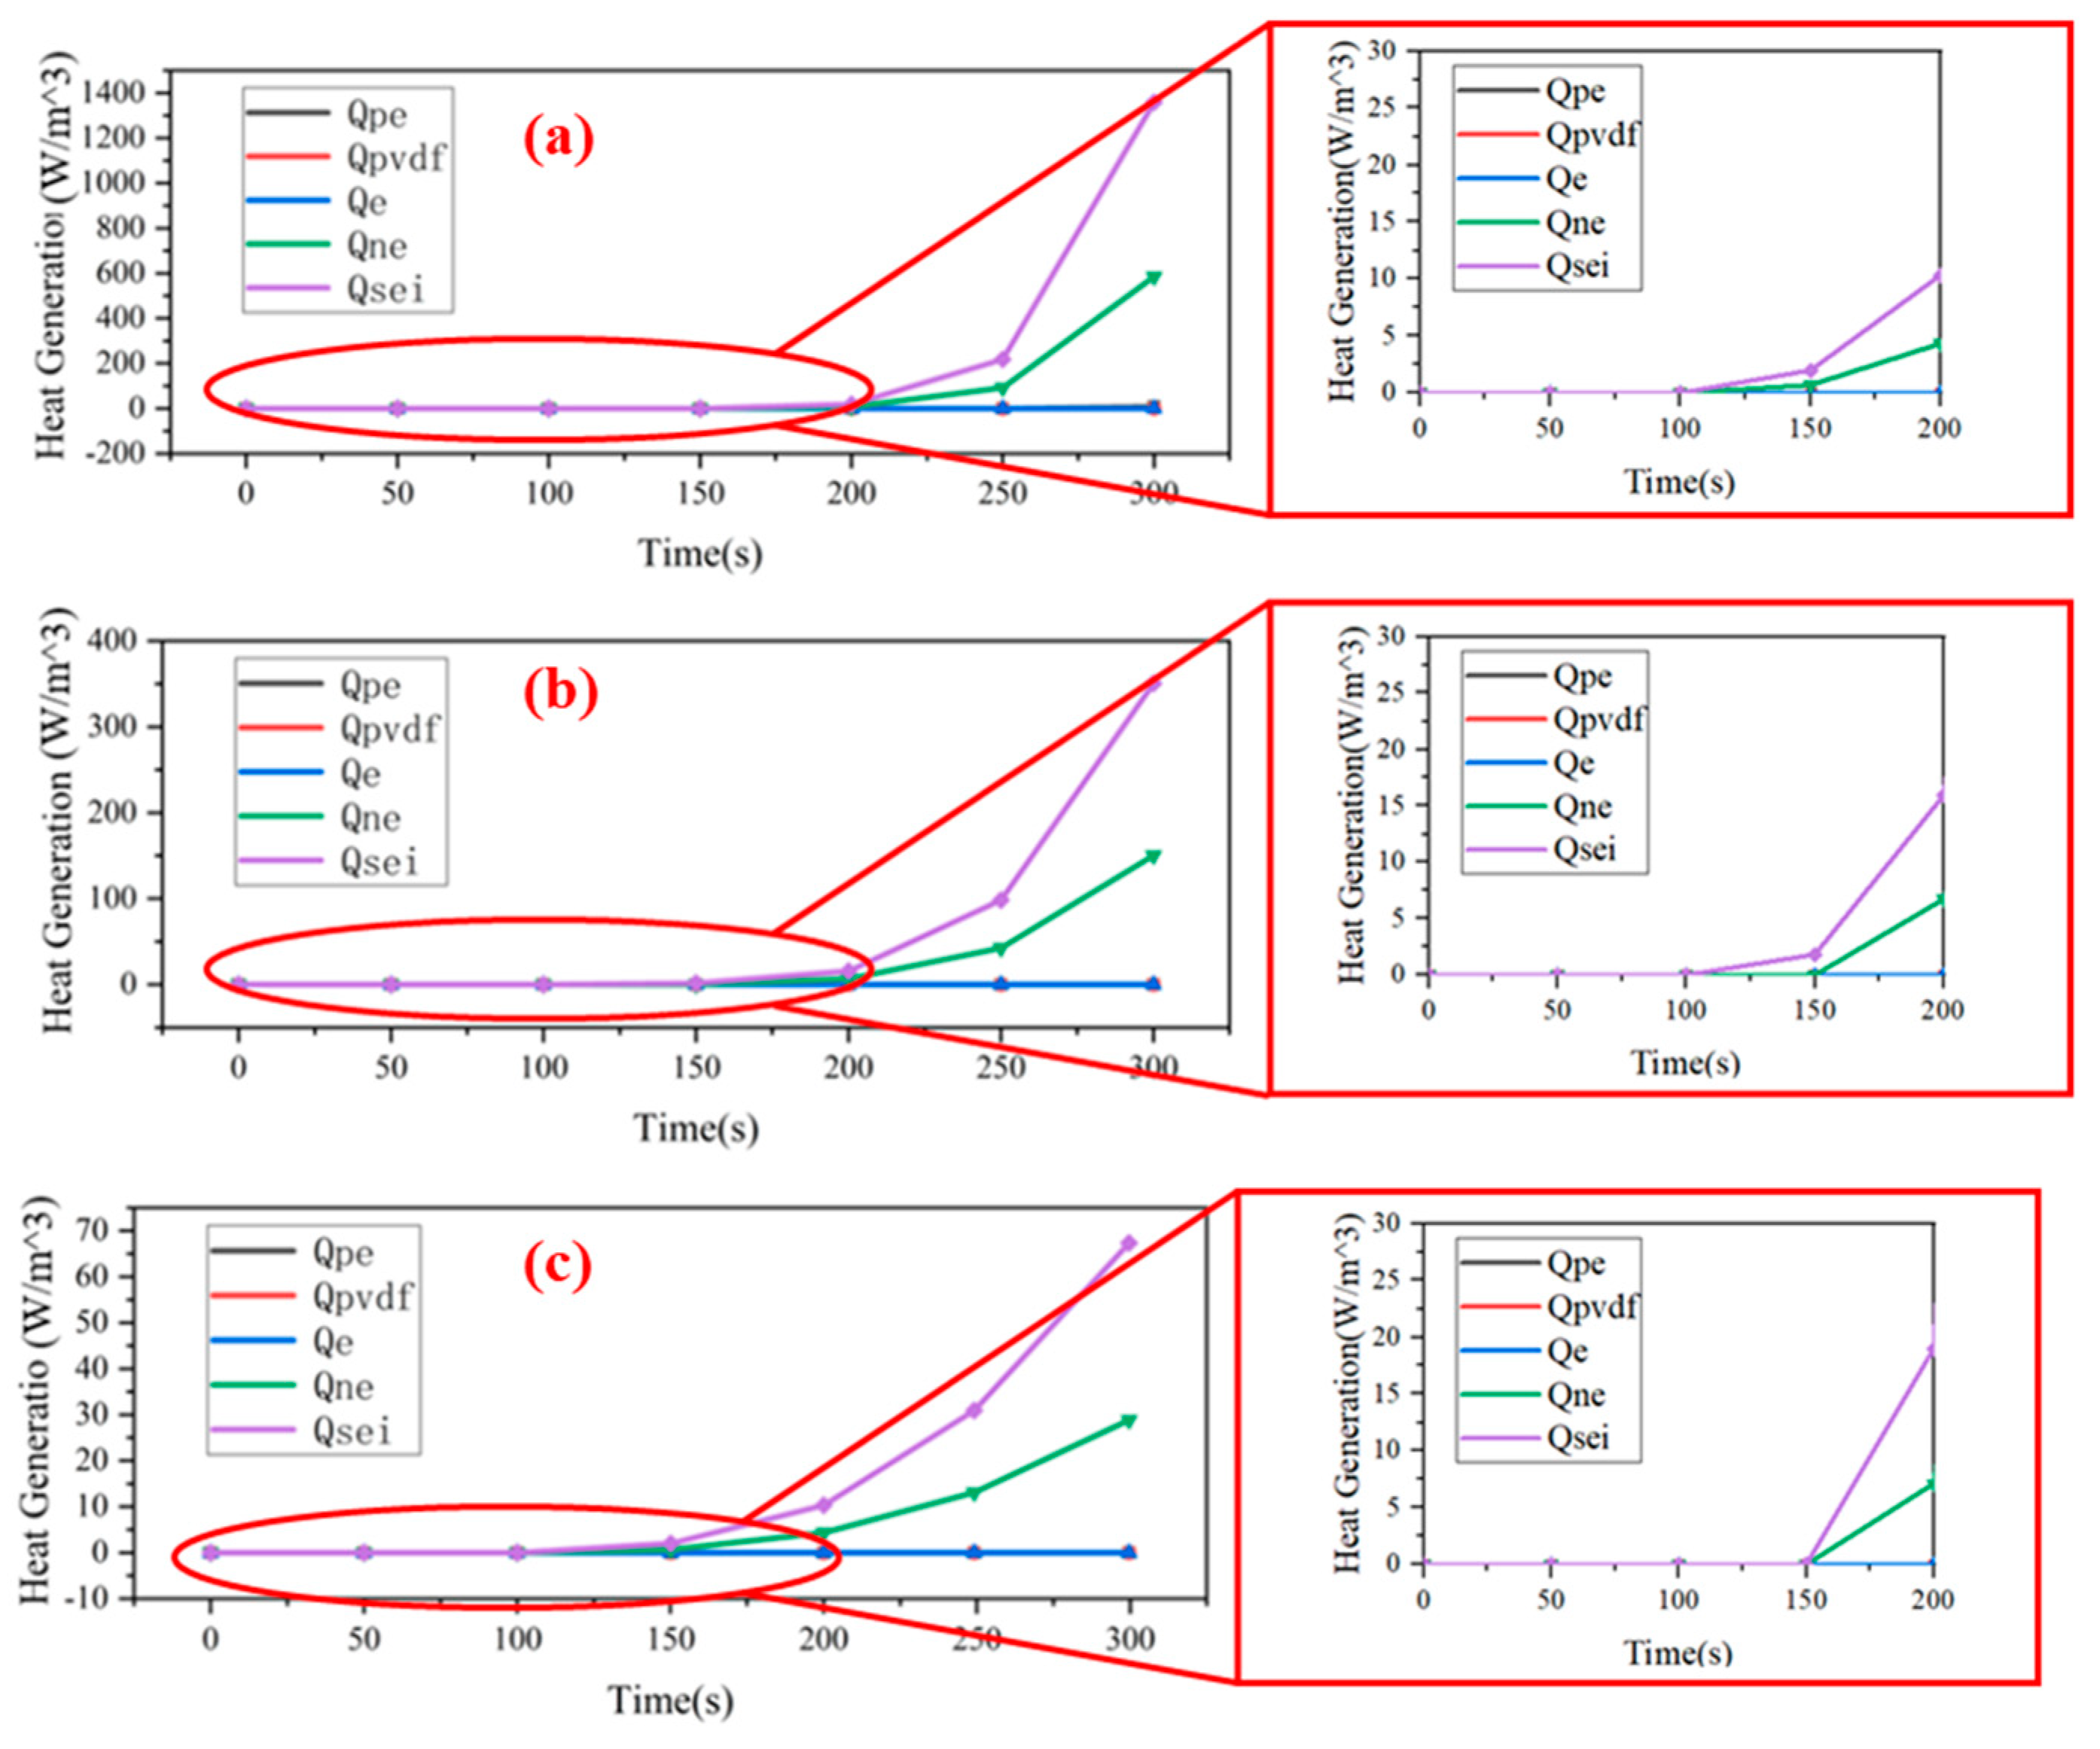
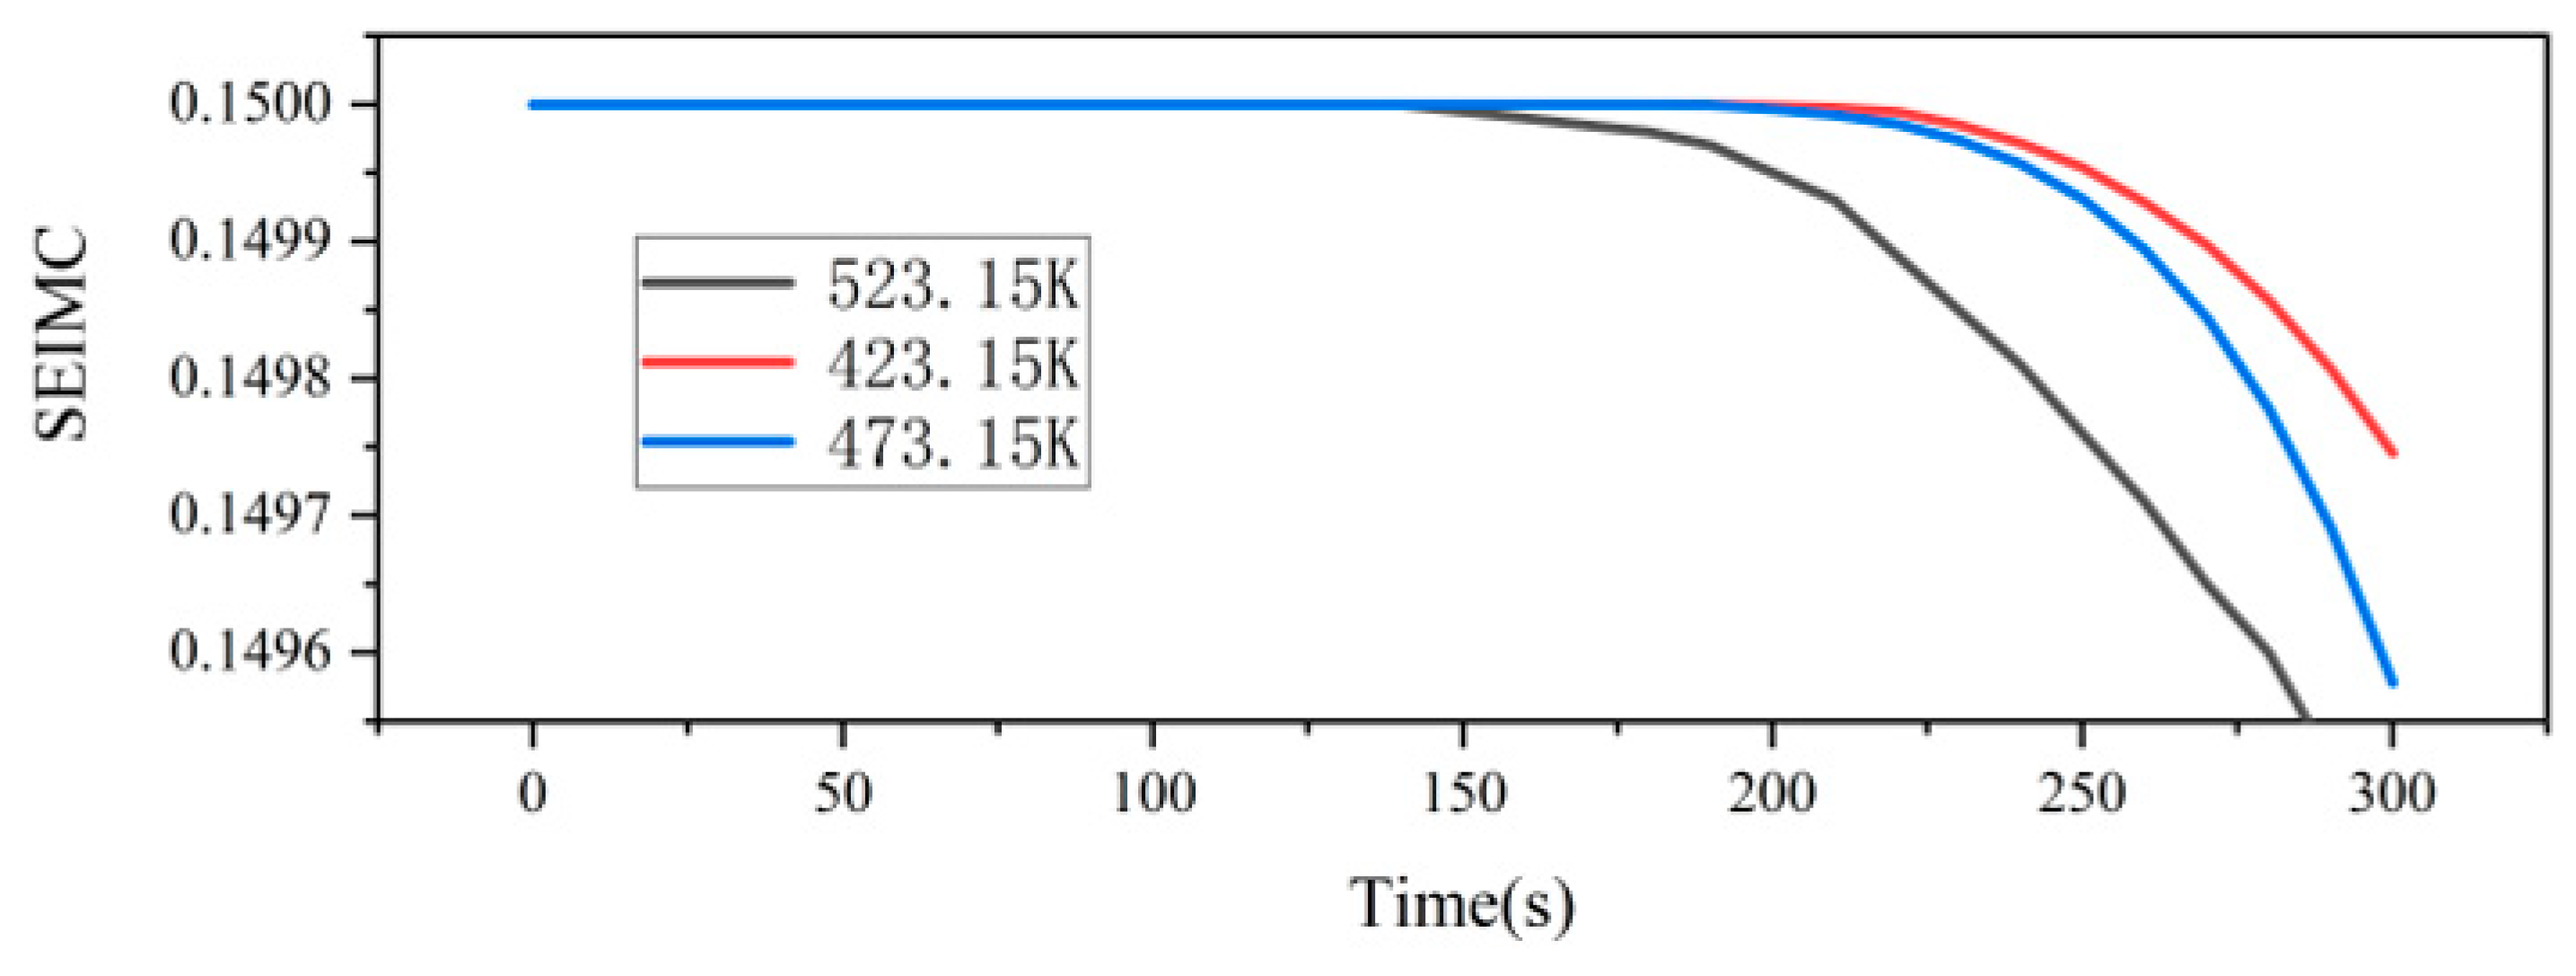
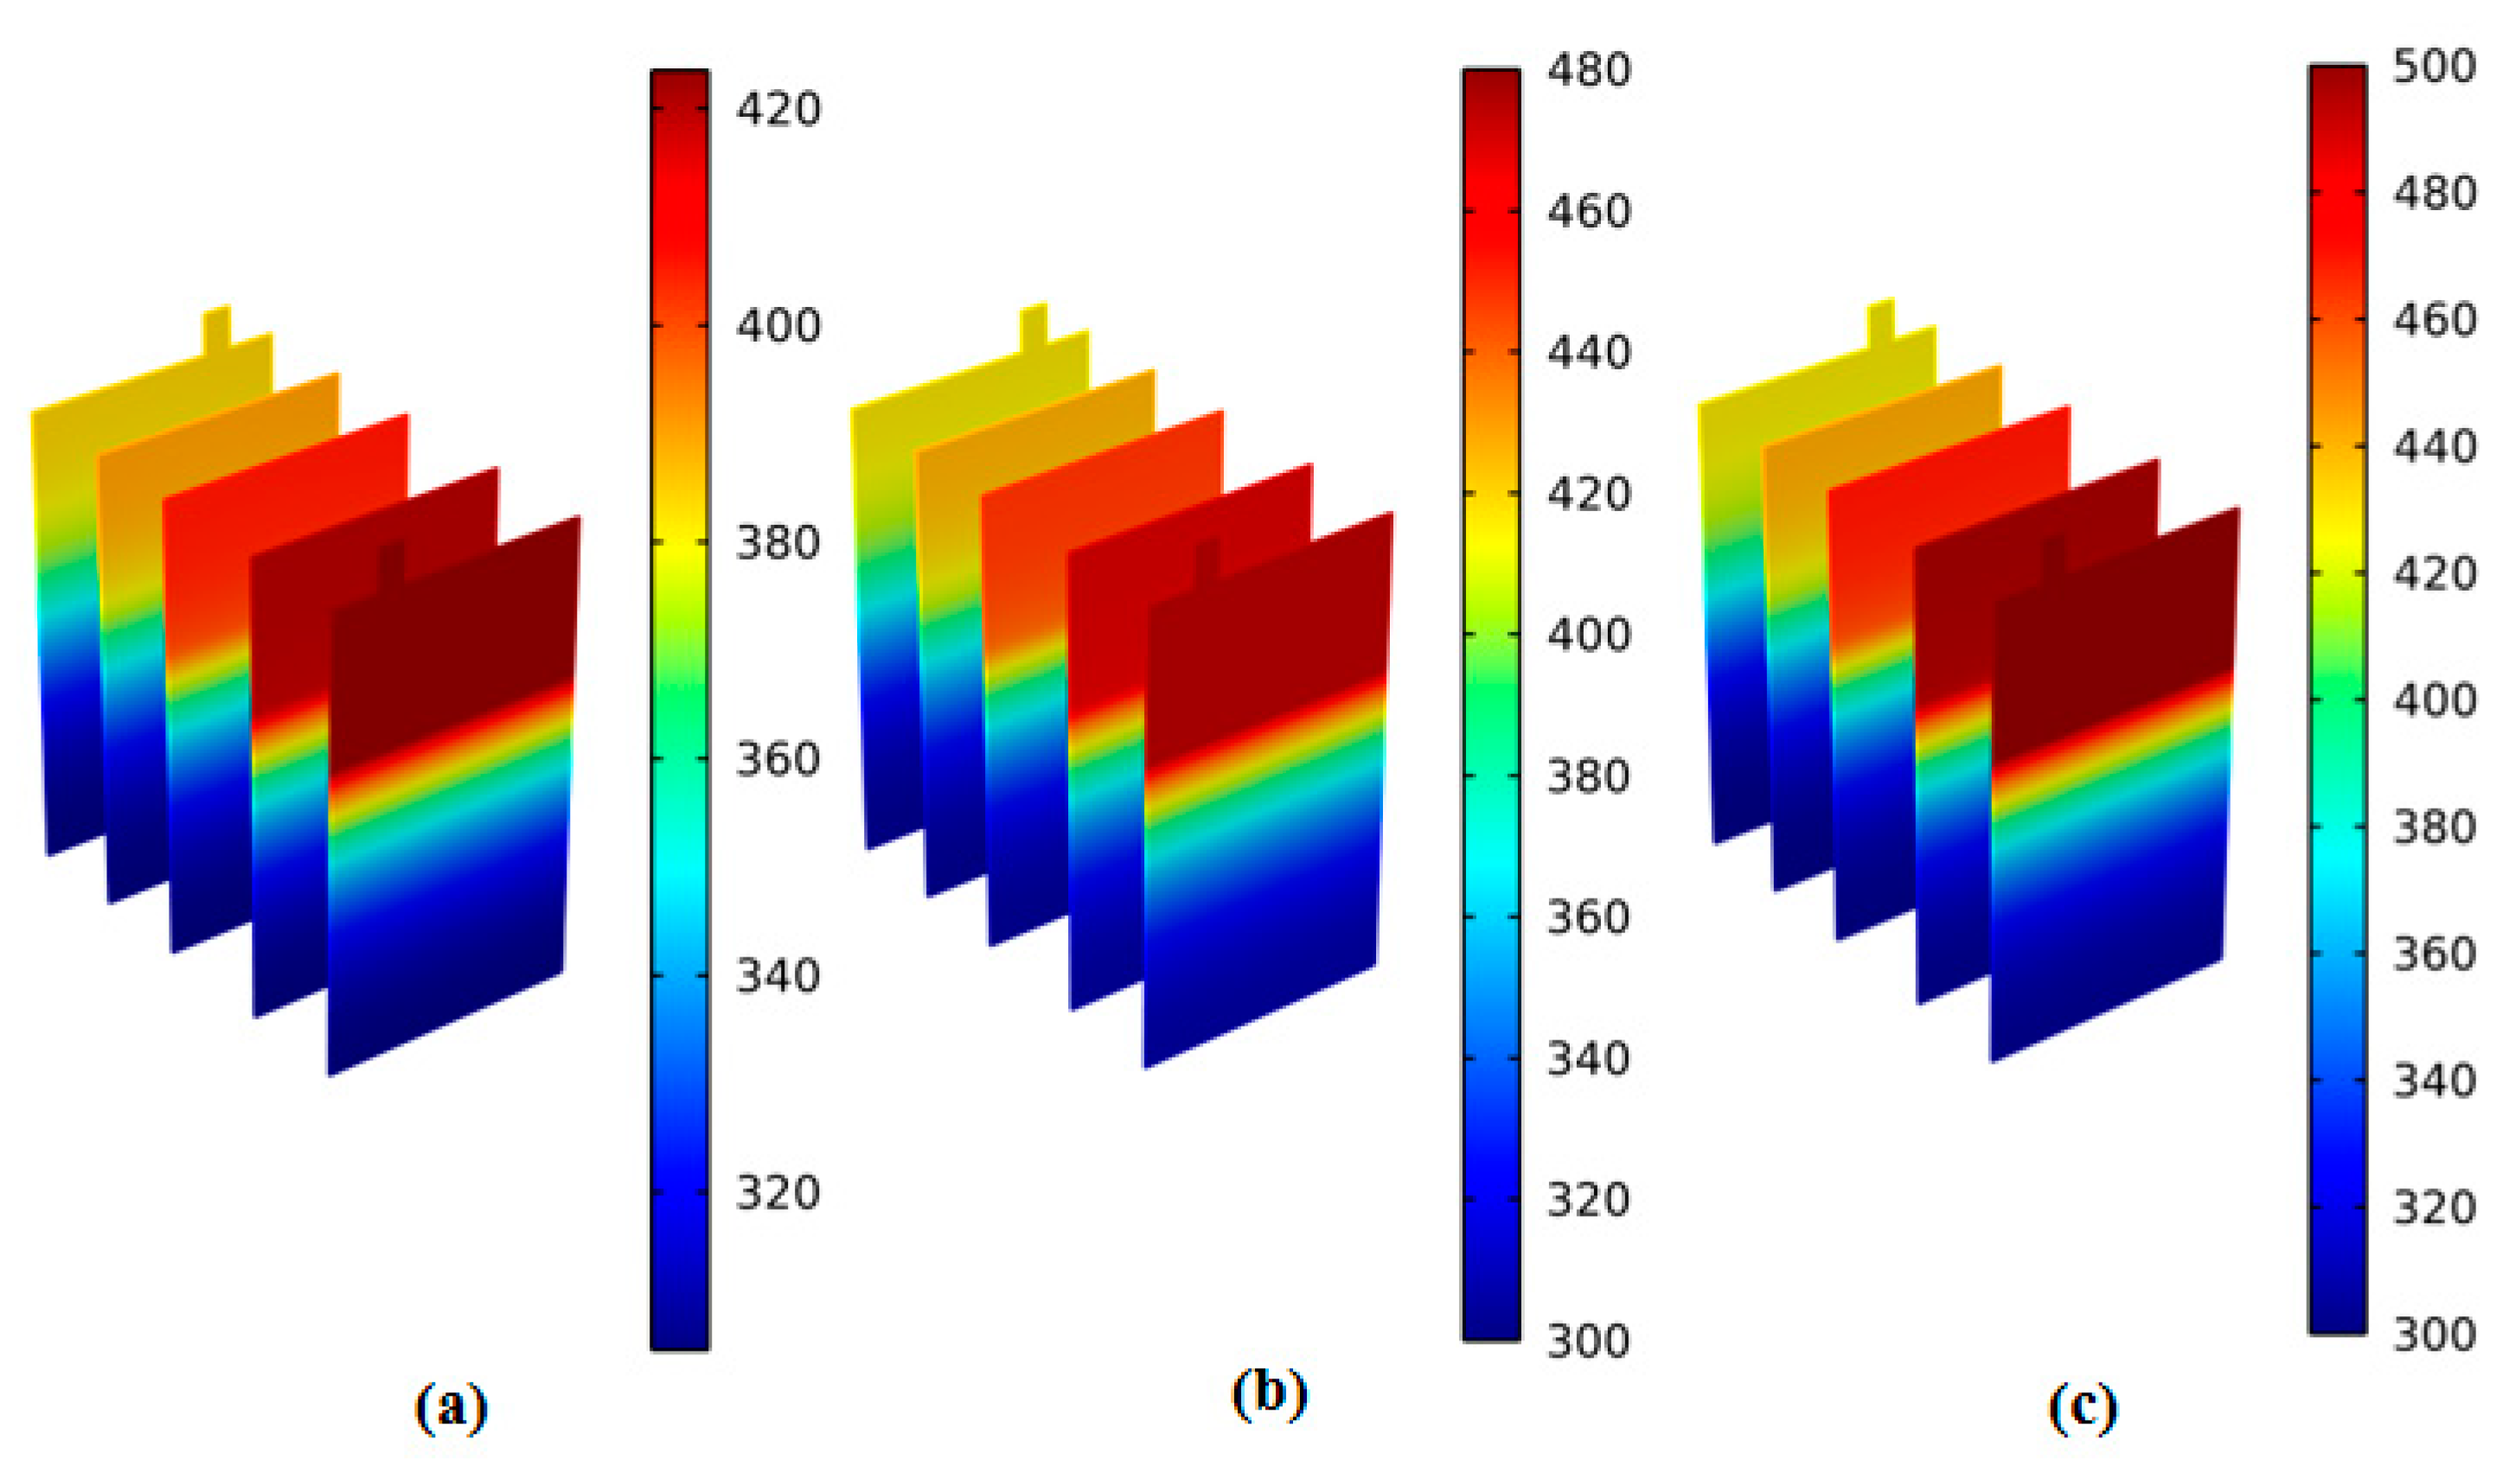
3.1. Locally Heating Tests 1, 2, and 3

The subplots (a, b, and c) of Figure 2 show the heat generation curves for each side reaction for tests 1, 2, and 3. It can be seen that SEI membrane decomposition and negative electrolyte reactions were the only side reactions that occurred in both trials. The other three curves did not change significantly during the healing process. However, in test 3, the SEI membrane completely decomposed, and the negative electrolyte reaction reached a heat generation of 1500 W/m3 [30,31].
As shown in Figure 2, the heat transfer process is affected by the different temperatures of the heating band while the reaction is taking place. When the heating band temperature increases, the SEI membrane temperature rises faster and decomposes more quickly, so the heat generation increases faster. The same law is used after replacing the electrolyte solute, so it is not repeated in the following two parts of the explanation. The changes in the content of SEI membranes in the model were then analyzed. SEI membrane content (SEIMC) was analyzed by COMSOL simulation. To further investigate the thermal behavior of the battery cell, SEI film curves are obtained and shown in Figure 3. It can be seen from Figure 3 that the SEI film starts to change at about 250 s under the heating condition of 423.15 K. The SEI film starts to change around 200 s under the heating condition of 473.15 K, and the SEI film starts to change around 180 s under the heating condition of 523.15 K. The curve of the SEI film in 423.15 K decreases linearly from 250 s, while in 473.15 K and 573.15 K, the curve of the SEI film decreases from 200 s to 180 s, respectively. Combining the three lines, it can be seen that as the temperature increases, the time point at which the SEI film begins to decrease becomes more and more advanced, and the decreasing curve of the SEI film becomes more and more tortuous [32,33].
The temperature distribution of each part of the battery heated at 423.15 K, 473.15 K, and 523.15 K, respectively, is shown in Figure 4. It can be seen from Figure 4 that after heating for 300 s, the battery has thermal runaway under various working conditions, and the temperature of each part of the battery reaches above 673.15 K. The temperature of the battery near the heating zone rises most sharply. In Figure 4a, the highest temperature is in the positive electrode of the battery, and the temperature has reached 693.15 K or more. In Figure 4b, the highest temperature is still the positive battery, and the temperature reached 1023.15 K or more. In Figure 4c, the area with the highest battery temperature is at the negative pole of the battery, and the temperature reaches 753.15 K. It can be seen from Figure 4a–c that the temperature change of each part of the battery does not increase with the increase in the heating temperature.

3.2. Locally Heating Tests 4, 5, and 6

The heat generation curves of each side reaction of tests 4, 5, and 6 are shown in Figure 5a–c. It can be seen that the SEI film decomposition and the negative electrolyte reaction are the only two side reactions that occur in the two tests. The other three curves did not change significantly during the heating process. However, the SEI film decomposes completely, and the heat generation of the negative electrolyte reaction reaches 1300 W/m3 in test 6, but the two side reactions are just in the beginning state in test 4.
To further investigate the thermal behavior of the battery cell, SEI film curves are obtained and shown in Figure 6. It can be seen from Figure 6 that the SEI film starts to change after about 500 s under the heating condition of 423.15 K. The SEI film starts to change around 400 s under the heating condition of 473.15 K, and the SEI film starts to change around 300 s under the heating condition of 523.15 K. The curve of the SEI film in 423.15 K decreases linearly from 500 s, while in 473.15 K and 573.15 K, the curve of the SEI film decreases from 400 s to 300 s, respectively.
The temperature distribution of each part of the battery heated at 423.15 K, 473.15 K, and 523.15 K, respectively, is shown in Figure 7. It can be seen from Figure 7 that after heating for 300 s, the battery has thermal runaway under various working conditions. The temperature of the battery near the heating zone rises most sharply. In (a), the highest temperature is in the negative electrode of the battery, and the temperature has reached 693.15 K or more. In (b), the highest temperature is still the negative battery, and the temperature reached 773.15 K or more. In (c), the area with the highest battery temperature is at the negative pole of the battery, and the temperature reaches 793.15 K. It can be seen from (a), (b), and (c) that the temperature change of each part of the battery does increase with the increase in the heating temperature.

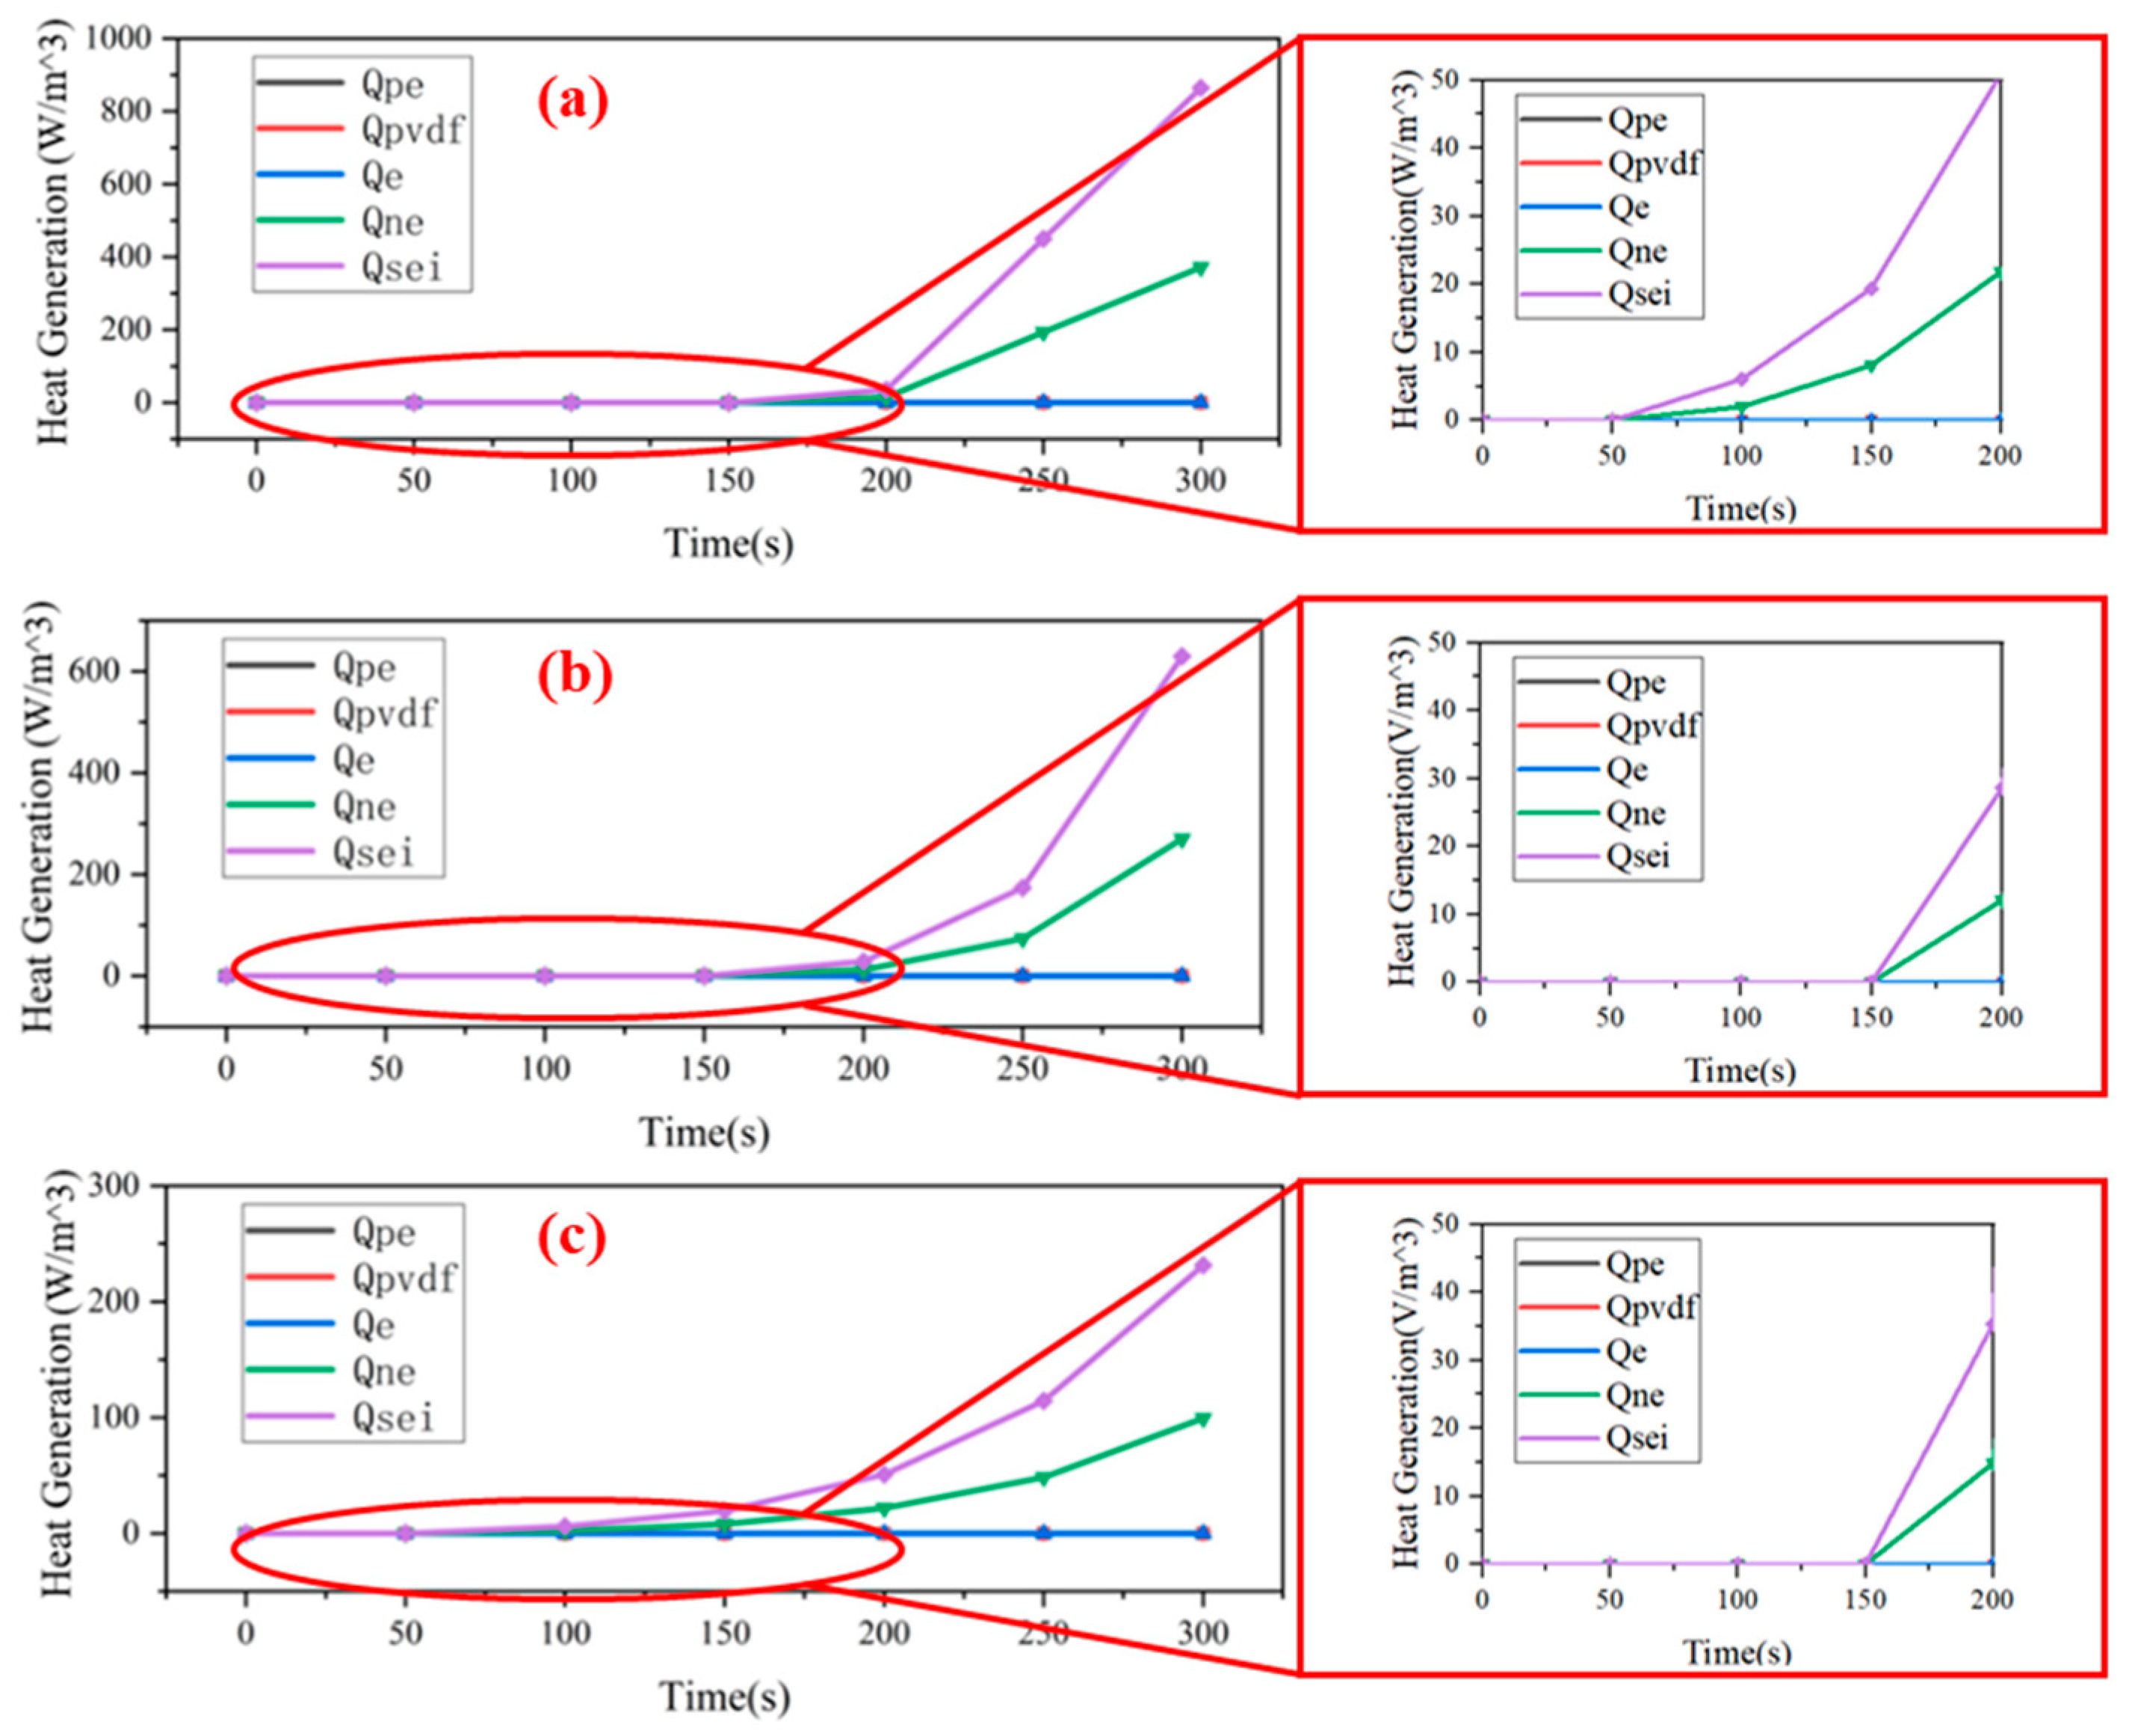
3.3. Locally Heating Tests 7, 8, and 9
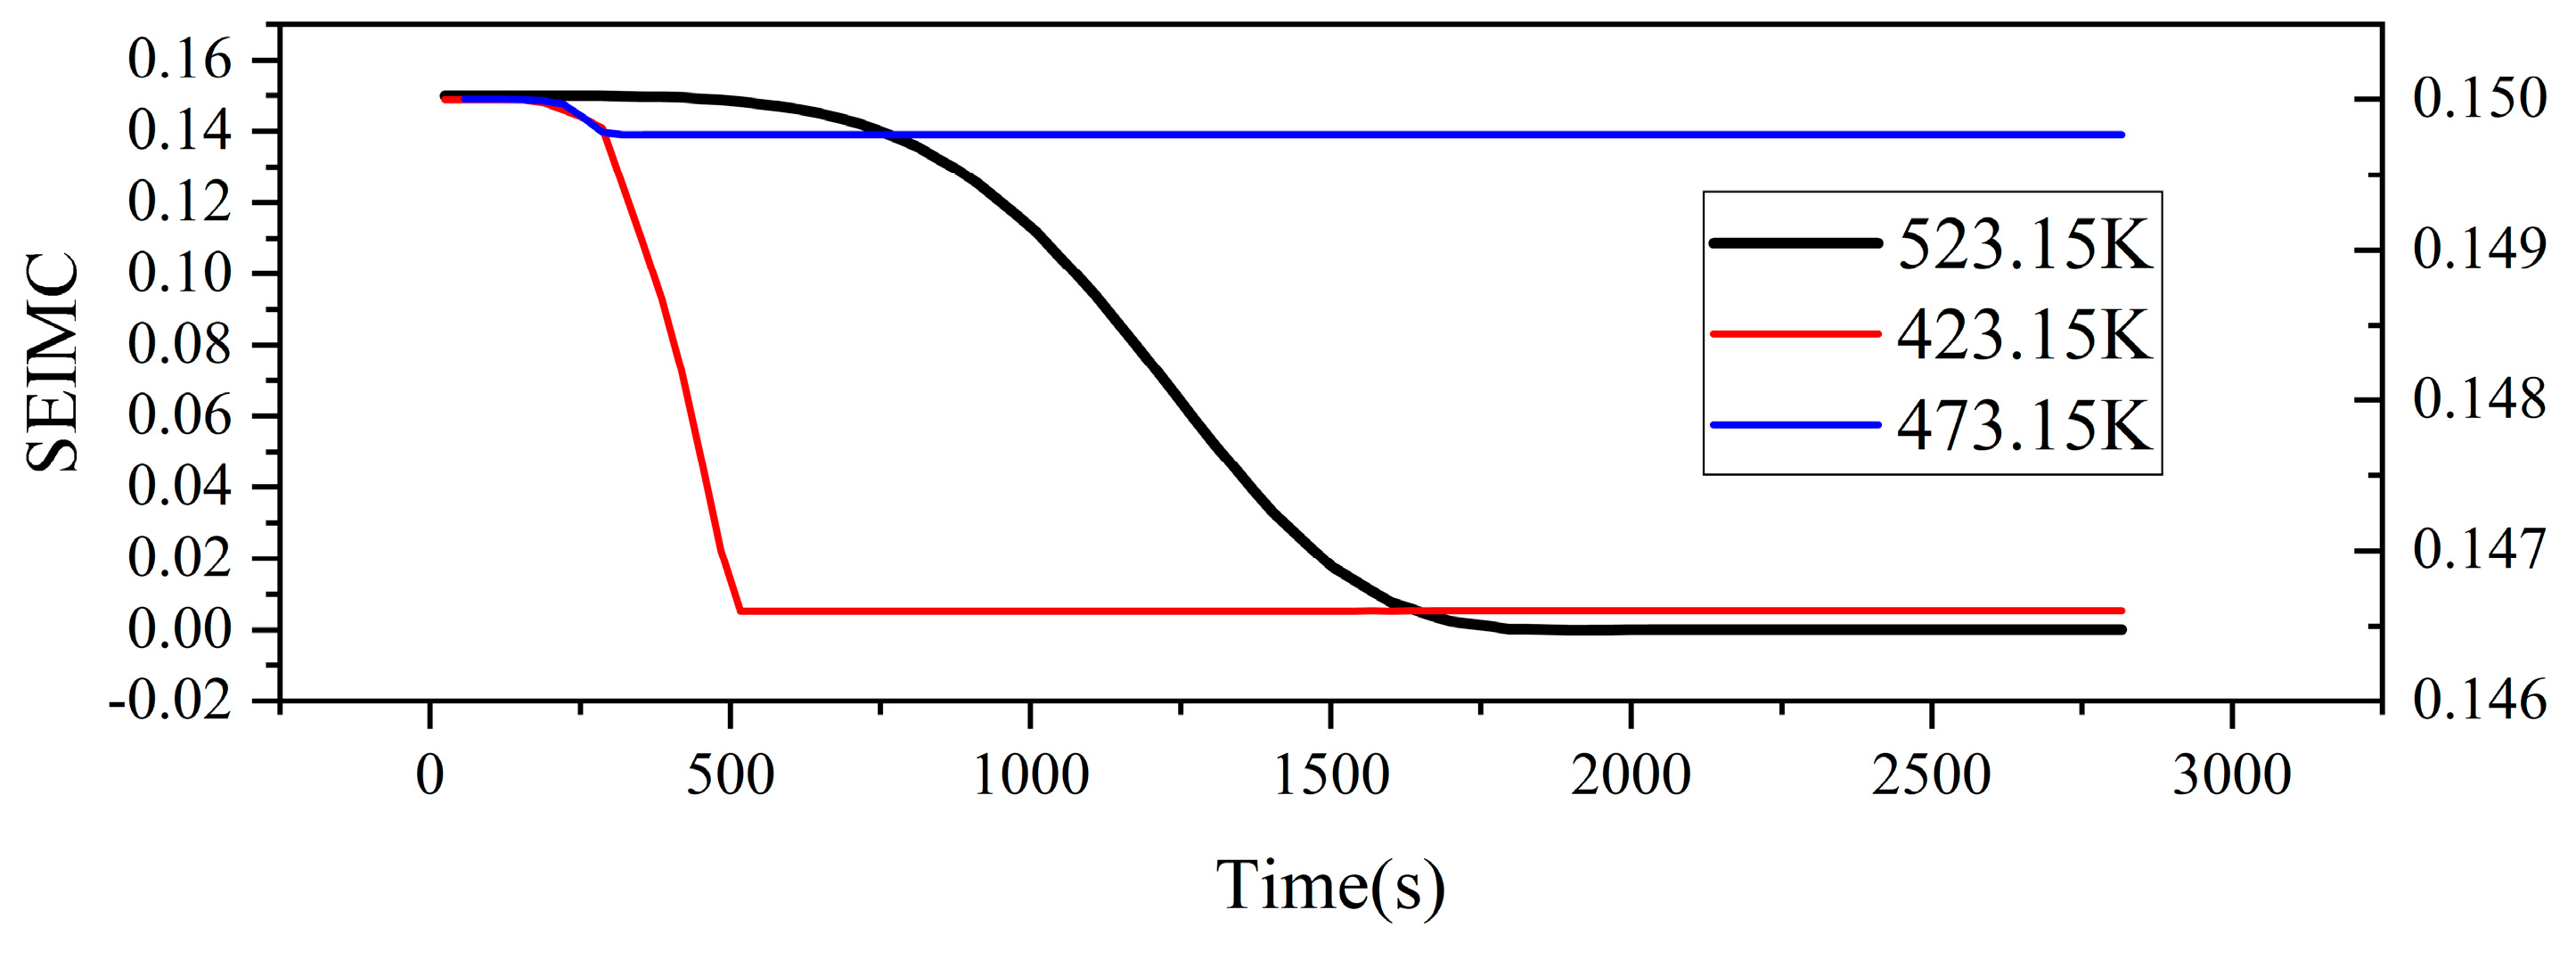
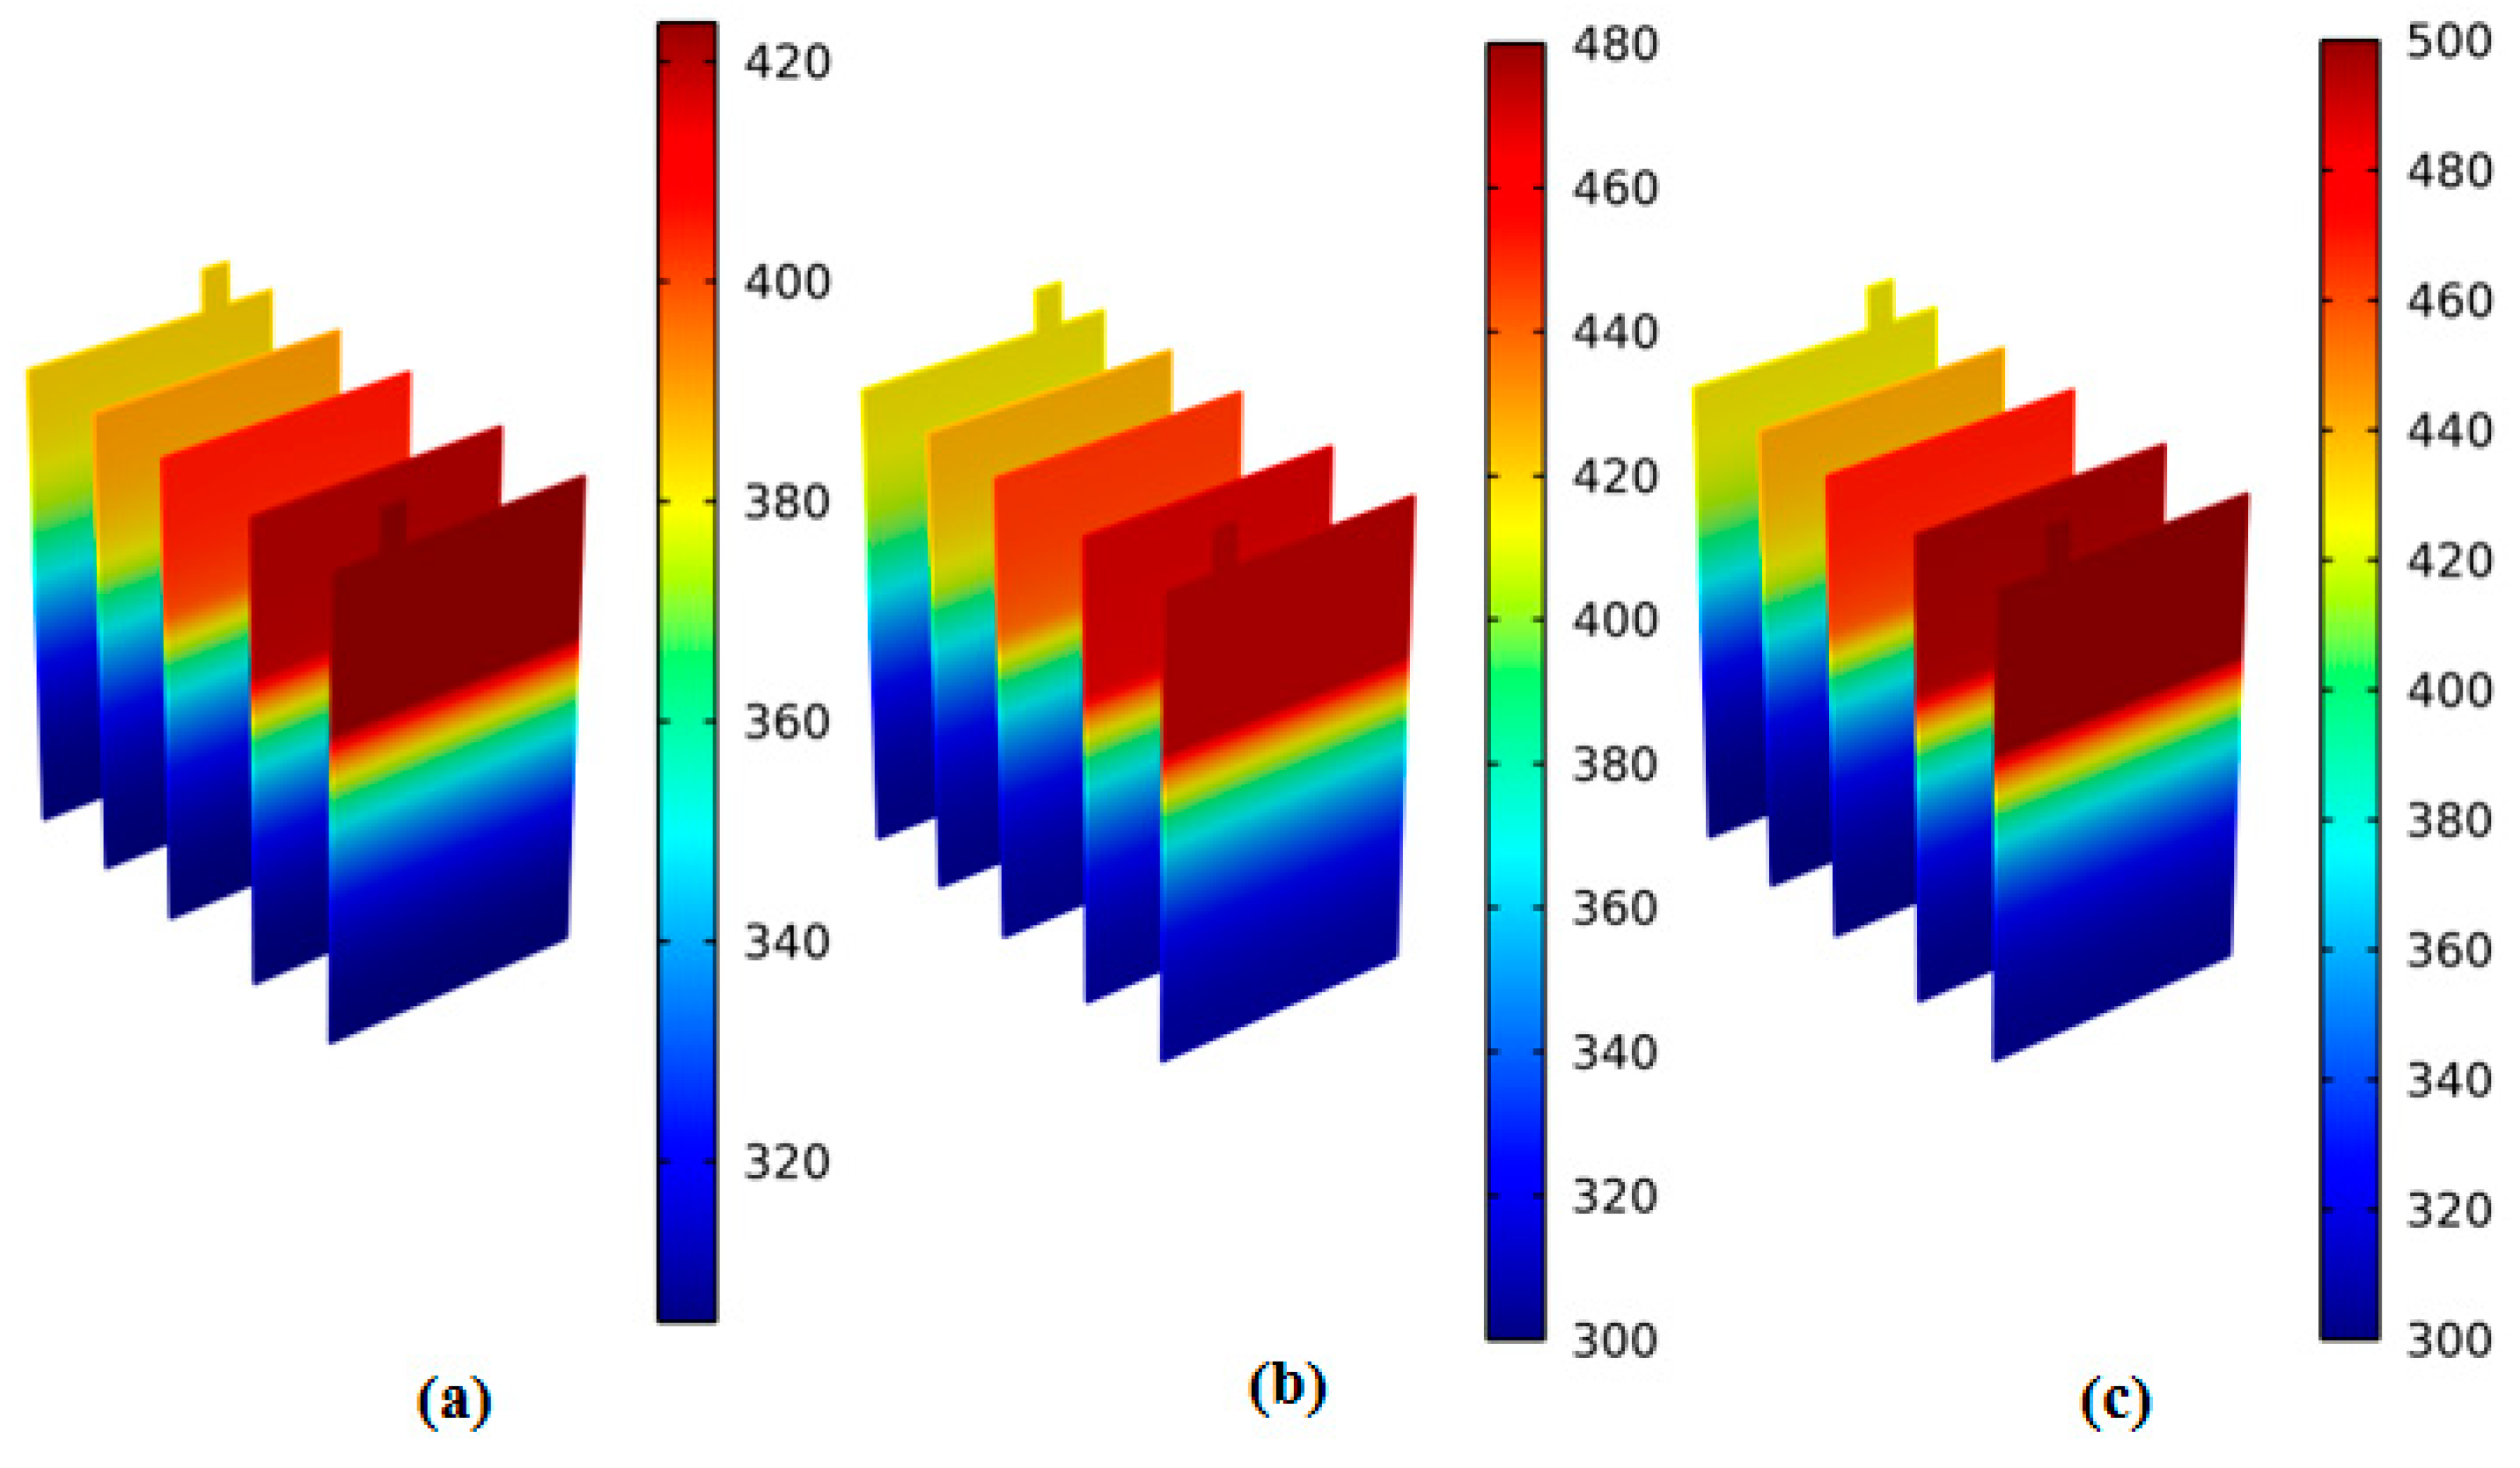
The heat generation curves for each side reaction of tests 7, 8, and 9 are shown in the subplots (a, b, and c) of Figure 8. It can be seen that SEI membrane decomposition and negative electrolyte reactions are the only two side reactions in both tests. The other three curves did not change significantly during the heating changes. However, the heat generation for the complete decomposition of the SEI membrane and the negative electrolyte reaction reached 850 W/m3 in test 9, but these two side reactions were only at the beginning of test 7.
To further investigate the thermal behavior of the battery cell, SEI film curves are obtained and shown in Figure 9. It can be seen from Figure 9 that the SEI film starts to change at about 400 s under the heating condition of 423.15 K. The SEI film starts to change around 300 s under the heating condition of 473.15 K, and the SEI film starts to change around 200 s under the heating condition of 523.15 K. The curve of the SEI film in (a) decreases linearly from 400 s, while in Figure 8b,c, the curve of the SEI film decreases from 300 s to 200 s, respectively.
The temperature distribution of each part of the battery heated at 423.15 K, 473.15 K, and 523.15 K, respectively, is shown in Figure 10. It can be seen from Figure 10 that after heating for 300 s, the battery has thermal runaway under various working conditions. The temperature of the battery near the heating zone rises most sharply. In (a), the highest temperature is in the positive electrode of the battery, and the temperature has reached 693.15 K or more. In (b), the highest temperature is still the positive battery, and the temperature reached 793.15 K or more. In (c), the area with the highest battery temperature is at the negative pole of the battery, and the temperature reaches 773.15 K. It can be seen from (a), (b), and (c) that the temperature change of each part of the battery does increase with the increase in the heating temperature.

3.4. Discussion

From the test results, the rate of change of the components of the battery and the heat production decreased after the addition of the flame retardant, mainly because the addition of the phosphonitene compound can effectively improve the thermal stability of the battery, the SEI film is not easily decomposed, and the heat production of the side reaction during heating is significantly reduced [32,33,34].
However, it can be seen from the heat loss control map that there is no significant difference between the two groups of test results when the phosphonate compound and the optimized structure are added, which indicates that the optimized design will not affect the thermal stability of the battery.
Above all, five thermal models concerning the side reactions of lithium-ion batteries were established, and numerical simulations of thermal runaway were carried out. The triggering condition for thermal runaway in this experiment is local heating, which can effectively simulate the heat exposure of the battery during a real thermal runaway.

4. Conclusions

In this paper, a thermal model containing five lateral reactions is developed to simulate the thermal runaway triggering process of lithium-ion batteries. The effect of local heating of the cathode collector surface on the change in the distribution of the high-temperature region of the diaphragm layer is analyzed by this model, and the thermal runaway mechanism is further revealed. From the simulation results, the following conclusions can be drawn: (1) Phosphonitene compounds can delay the decomposition of the cell SEI membrane; and (2) phosphonitene compounds can reduce the energy yield of the cell-side reaction.
In this paper, the changes in the distribution of the high-temperature region of the spacer when the lithium-ion battery is locally heated under different heat dissipation conditions are investigated. In the subsequent analysis, the thermal equilibrium capability of lithium-ion itself will be further investigated. Meanwhile, a separate mechanistic study of the reactions occurring on individual layers will be one of the subsequent research directions of this paper.

Author Contributions

Conceptualization, X.X. and X.Z.; methodology, X.Z.; software, X.Z.; validation, X.X., X.Z. and J.H.; resources, X.Z.; data curation, X.Z.; writing—original draft preparation, X.X.; writing—review and editing, J.H.; visualization, X.Z.; supervision, X.Z.; project administration, J.H.; funding acquisition, J.H. All authors have read and agreed to the published version of the manuscript.

Funding

The project is supported partly by the National Natural Science Foundation of China (No. 52107220), the Postdoctoral Research Fund Project of China (No. 2021M690353), the Foundation of State Key Laboratory of Automotive Simulation and Control (No. 20210211), the Scientific and Technological Innovation Foundation of Foshan (No. BK21BE012), the Postdoctoral Research Foundation of the Shunde Innovation School of the University of Science and Technology Beijing (No. 2021BH007), the Fundamental Research Funds for the Central Universities (No. FRF-BD-20-08A, NO. FRF-IDRY-21-013), and the Opening Foundation of the Key Laboratory of Advanced Manufacture Technology for Automobile Parts, Ministry of Education (No. 2022 KLMT03).

Data Availability Statement

Data sharing not applicable. No new data were created or analyzed in this study. Data sharing is not applicable to this article.

Conflicts of Interest

The authors declare no conflict of interest.

References

  1. Michele, B. Damage Investigation on the Upper Skin Composite Panels of Eurofighter Aircraft. Key Eng. Mater. 2019, 812, 9–16. [Google Scholar]
  2. Choi, W. A study on state of charge and state of health estimation in consideration of lithium-ion battery aging. Sustainability 2020, 12, 10451. [Google Scholar] [CrossRef]
  3. Doshi, N. Modeling of Thermal Dynamics in Chevrolet Volt Gen II Hybrid Electric Vehicle for Integrated Powertrain and HVAC Optimal Operation Through Connectivity. Master’s Thesis, Michigan Technological University, Houghton, MI, USA, 2019. [Google Scholar]
  4. Feng, X.; Ren, D.; Zhang, S.; He, X.; Wang, L.; Ouyang, M. Influence of aging paths on the thermal runaway features of lithium-ion batteries in accelerating rate calorimetry tests. Int. J. Electrochem. Sci. 2019, 14, 44–58. [Google Scholar] [CrossRef] [PubMed]
  5. Feng, Y.; Dong, Z. Optimal energy management with balanced fuel economy and battery life for large hybrid electric mining truck. J. Power Sources 2020, 454, 227948. [Google Scholar] [CrossRef]
  6. Gandoman, F.H.; Jaguemont, J.; Goutam, S.; Gopalakrishnan, R.; Firouz, Y.; Kalogiannis, T.; Omar, N.; Van Mierlo, J. Concept of reliability and safety assessment of lithium-ion batteries in electric vehicles: Basics, progress, and challenges. Appl. Energy 2019, 251, 113343. [Google Scholar] [CrossRef]
  7. Hong, J.; Wang, Z.; Qu, C.; Zhou, Y.; Shan, T.; Zhang, J.; Hou, Y. Investigation on Overcharge-caused Thermal Runaway of Lithium-Ion Batteries in Real-world Electric Vehicles. Appl. Energy 2022, 321, 119229. [Google Scholar] [CrossRef]
  8. Hong, J.; Wang, Z.; Chen, W.; Wang, L.; Lin, P.; Qu, C. Online accurate state of health estimation for battery systems on real-world electric vehicles with variable driving conditions considered. J. Clean. Prod. 2021, 294, 125814. [Google Scholar] [CrossRef]
  9. Hong, J.; Wang, Z.; Qu, C.; Ma, F.; Xu, X.; Yang, J.; Zhang, J.; Zhou, Y.; Shan, T.; Ho, Y. Fault Prognosis and Isolation of Lithium-ion Batteries in Electric Vehicles Considering Real-Scenario Thermal Runaway Risks. IEEE J. Emerg. Sel. Top. Power Electron. 2023, 11, 88–99. [Google Scholar] [CrossRef]
  10. Liu, Y.; Elias, Y.; Meng, J.; Aurbach, D.; Zou, R.; Xia, D.; Pang, Q. Electrolyte solutions design for lithium-sulfur batteries. Joule 2021, 5, 2323–2364. [Google Scholar] [CrossRef]
  11. Zou, F.; Manthiram, A. A review of the design of advanced binders for high-performance batteries. Adv. Energy Mater. 2020, 10, 2002508. [Google Scholar] [CrossRef]
  12. Shahjalal, M.; Roy, P.K.; Shams, T.; Fly, A.; Chowdhury, J.I.; Ahmed, R.; Liu, K. A review on second-life of Li-ion batteries: Prospects, challenges, and issues. Energy 2022, 241, 122881. [Google Scholar] [CrossRef]
  13. Li, W.; Xiong, S.; Zhou, X.; Shi, W.; Wang, C.; Lin, X.; Cheng, J. Design of Cylindrical Thermal Dummy Cell for Development of Lithium-Ion Battery Thermal Management System. Energies 2021, 14, 1357. [Google Scholar] [CrossRef]
  14. Tran, M.K.; Panchal, S.; Khang, T.D.; Panchal, K.; Fraser, R.; Fowler, M. Concept review of a cloud-based smart battery management system for lithium-ion batteries: Feasibility, logistics, and functionality. Batteries 2022, 8, 19. [Google Scholar] [CrossRef] [PubMed]
  15. Li, W.; Liao, K.; He, Q.; Xia, Y. Performance-aware cost-effective resource provisioning for future grid IoT-cloud system. J. Energy Eng. 2019, 145, 04019016. [Google Scholar] [CrossRef]
  16. Ma, F.; Fu, C.; Yang, J.; Yang, Q. Control strategy for adaptive active energy harvesting in sediment microbial fuel cells. J. Energy Eng. 2020, 146, 04019034. [Google Scholar] [CrossRef]
  17. Madani, S.S.; Schaltz, E.; Kær, S.K. Study of temperature impacts on a lithium-ion battery thermal behaviour by employing isothermal calorimeter. ECS Trans. 2018, 87, 295. [Google Scholar] [CrossRef]
  18. Rogall, M.; Barai, A.; Brucoli, M.; Luk, P.; Bhagat, R.; Greenwood, D. DREMUS: A Data-Restricted Multi-Physics Simulation Model for Lithium-Ion Battery Storage. J. Energy Storage 2020, 32, 102051. [Google Scholar] [CrossRef]
  19. Shen, Y.W.; Liang, L.Q.; Cui, M.; Shen, F.; Zhang, B.; Cui, T. Advanced control of DFIG to enhance the transient voltage support capability. J. Energy Eng. 2018, 144, 04018009. [Google Scholar] [CrossRef]
  20. Lin, W.; Zhu, M.; Fan, Y.; Wang, H.; Tao, G.; Ding, M.; Liu, N.; Yang, H.; Wu, J.; Fang, J.; et al. Low temperature lithium-ion batteries electrolytes: Rational design, advancements, and future perspectives. J. Alloy. Compd. 2022, 905, 164163. [Google Scholar] [CrossRef]
  21. Lu, D.; Lei, X.; Weng, S.; Li, R.; Li, J.; Lv, L.; Zhang, H.; Huang, Y.; Zhang, J.; Zhang, S.; et al. A self-purifying electrolyte enables high energy Li ion batteries. Energy Environ. Sci. 2022, 15, 3331–3342. [Google Scholar] [CrossRef]
  22. Kim, I.H.; Liu, Y.H.; Pallister, S.; Pol, W.; Roberts, S.; Lee, E. Fault-tolerant resource estimate for quantum chemical simulations: Case study on Li-ion battery electrolyte molecules. Phys. Rev. Res. 2022, 4, 023019. [Google Scholar] [CrossRef]
  23. Yang, W.; Zhou, F.; Zhou, H.; Wang, Q.; Kong, J. Thermal performance of cylindrical lithium-ion battery thermal management system integrated with mini-channel liquid cooling and air cooling. Appl. Therm. Eng. 2020, 175, 115331. [Google Scholar] [CrossRef]
  24. Xu, X.; Fu, J.; Jiang, H.; He, R. Research on the heat dissipation performance of lithium-ion cell with different operating conditions. Int. J. Energy Res. 2017, 41, 1642–1654. [Google Scholar]
  25. Shim, J.; Kostecki, R.; Richardson, T.; Song, X.; Striebel, K. Electrochemical analysis for cycle performance and capacity fading of a lithium-ion battery cycled at elevated temperature. J. Power Sources 2002, 112, 222–230. [Google Scholar] [CrossRef]
  26. Xiong, R.; Yu, Q.; Shen, W.; Lin, C.; Sun, F. A Sensor Fault Diagnosis Method for a Lithium-Ion Battery Pack in Electric Vehicles. IEEE Trans. Power Electron. 2019, 34, 9709–9718. [Google Scholar] [CrossRef]
  27. Yamanaka, T.; Takagishi, Y.; Tozuka, Y.; Yamaue, T. Modeling lithium ion battery nail penetration tests and quantitative evaluation of the degree of combustion risk. J. Power Sources 2019, 416, 132–140. [Google Scholar] [CrossRef]
  28. Singh, G.; Kaur, M.; Singh, B. Detection of epileptic seizure EEG signal using multiscale entropies and complete ensemble empirical mode decomposition. Wirel. Pers. Commun. 2021, 116, 845–864. [Google Scholar] [CrossRef]
  29. Fang, F.; Yu, S.; Xin, X. Data-Driven-Based Stochastic Robust Optimization for a Virtual Power Plant With Multiple Uncertainties. IEEE Trans. Power Syst. 2021, 37, 456–466. [Google Scholar] [CrossRef]
  30. Cho, S.; Gao, Z.; Torgeir, M. Model-based fault detection, fault isolation and fault-tolerant control of a blade pitch system in floating wind turbines. Renew. Energy 2018, 120, 306–321. [Google Scholar] [CrossRef]
  31. Sun, Z.; Wang, Z.; Liu, P.; Zhang, Z.; Chen, Y.; Qu, C. Overview of Fault Diagnosis in New Energy Vehicle Power Battery System. J. Mech. Eng. 2021, 57, 87–104. [Google Scholar]
  32. Chen, R.; Nolan, A.M.; Lu, J.; Wang, J.; Yu, X.; Mo, Y.; Chen, L.; Huang, X.; Li, H. The thermal stability of lithium solid electrolytes with metallic lithium. Joule 2020, 4, 812–821. [Google Scholar] [CrossRef]
  33. Vedhanarayanan, B.; Ji, X.; Lakshmi, K.S.; Lin, T.-W. Engineering solid-electrolyte interface from aqueous deep-eutectic solvent to enhance the capacity and lifetime of self-assembled heterostructures of 1T-MoS2/graphene. Chem. Eng. J. 2022, 427, 130966. [Google Scholar] [CrossRef]
  34. Zhang, Y.; Kitchaev, D.A.; Yang, J.; Chen, T.; Dacek, S.T.; Sarmiento-Pérez, R.A.; Marques, M.A.L.; Peng, H.; Ceder, G.; Perdew, J.P.; et al. Efficient first-principles prediction of solid stability: Towards chemical accuracy. Npj Comput. Mater. 2018, 4, 9. [Google Scholar] [CrossRef]
Figure 1. Schematic of model geometry and a computational mesh.
Electronics 12 01876 g001
Figure 2. Variation of each component of the different side reactions: (a) 423.15 K; (b) 473.15 K; and (c) 523.15 K.
Electronics 12 01876 g002
Figure 3. Conformational curves for changes in cell composition of SEI films at different temperatures in tests 1, 2, and 3.
Electronics 12 01876 g003
Figure 4. Temperature distribution curves for each part of the cell in tests 4, 5, and 6, for 300 s (a) 423.15 K; (b) 473.15 K; and (c) 523.15 K.
Electronics 12 01876 g004
Figure 5. Heat production curves for each component in tests 4, 5, and 6: (a) 423.15 K; (b) 473.15 K; and (c) 523.15 K.
Electronics 12 01876 g005
Figure 6. Conformational curves for changes in cell composition of SEI films at different temperatures in tests 4, 5, and 6.
Electronics 12 01876 g006
Figure 7. Temperature profiles of each part of the cell after heating for 300 s: (a) 423.15 K; (b) 473.15 K; and (c) 523.15 K.
Electronics 12 01876 g007
Figure 8. Heat production curves for the side reactions of each component: (a) 423.15 K; (b) 473.15 K; and (c) 523.15 K.
Electronics 12 01876 g008
Figure 9. Conformational curves for changes in cell composition of the SEI films at different temperatures in tests 7, 8, and 9.
Electronics 12 01876 g009
Figure 10. Temperature distribution of each part of the battery for 300 s: (a) 423.15 K; (b) 473.15 K; and (c) 523.15 K.
Electronics 12 01876 g010
Table 1. Heating situations.
LabelValueDescription
Asei1.667 × 1015 [1/s]SEI-decomposition frequency factor
Ane2.5 × 1013 [1/s]Negative-solvent frequency factor
Ape11.75 × 109 [1/s]Positive-solvent 1 frequency factor
Ape21.077 × 1012 [1/s]Positive-solvent 2 frequency factor
Ae5.14 × 1025 [1/s]Electrolyte decomposition frequency factor
Apvdf1.917 × 1025 [1/s]Binder frequency factor
Esei1.3508 × 105 [J/mol]SEI-decomposition activation energy
Ene1.3508 × 105 [J/mol]Negative-solvent activation energy
Epe11.1495 × 105 [J/mol]Positive-solvent 1 activation energy
Epe21.5888 × 105 [J/mol]Positive-solvent 2 activation energy
Ee2.74 × 105 [J/mol]Electrolyte decomposition activation energy
Epvdf2.86 × 105 [J/mol]Binder activation energy
Hsei257 [J/g]SEI-decomposition heat release
Hne1714 [J/g]Negative-solvent heat release
Hpe1277 [J/g]Positive-solvent 1 heat release
Hpe2284 [J/g]Positive-solvent 2 heat release
He155 [J/g]Electrolyte decomposition heat release
Hpvdf1500 [J/g]Binder decomposition heat release
Wc6.104 × 105 [g/m3]Specific carbon content
Wp1.221 × 106 [g/m3]Specific positive active content
We4.069 × 105 [g/m3]Specific electrolyte content
Table 2. Size of a three-dimensional model.
Parametersd1d2d3d4d5d6WH
Unit/mm1.015.894.044.540.521694168
Table 3. Heating situations.
Test NumberHeating Temperature (K)Density
(kg/m3)
Heat Capacity
(J/(kg·K))
Heat Conductivity Coefficient (w/(m·K))
Test 1423.151008.981978.160.344
Test 2473.151008.981978.160.344
Test 3523.151008.981978.160.344
Test 4423.15978.342467.340.344
Test 5473.15978.342467.340.344
Test 6523.15978.342467.340.344
Test 7423.151006.452345.650.546
Test 8473.151006.452345.650.546
Test 9523.151006.452345.650.546
Table 4. Part of the simulation boundary conditions.
LabelExpression/Value
Lcell94 [mm]
Hcell168 [mm]
Tcell16 [mm]
Wtab10 [mm]
kT_pos1.74 [W/(m × K)]
kT_neg1.04 [W/(m × K)]
kT_sep0.344 [W/(m × K)]
rho_pos2362.36 [kg/m3]
rho_neg1347.33 [kg/m3]
rho_sep1008.98 [kg/m3]
Cp_pos1142.29 [J/(kg × K)]
Cp_neg1437.4 [J/(kg × K)]
Cp_sep1978.16 [J/(kg × K)]
Asei1.667 × 1015 [s−1]
Ane2.5 × 1013 [s−1]
Ape11.75 × 109 [s−1]
Ape21.077 × 1012 [s−1]
Ae5.14 × 1025 [s−1]
Apvdf1.917 × 1025 [s−1]
Esei1.3508 × 105 [J/mol]
Ene1.3508 × 105 [J/mol]
Epe11.1495 × 105 [J/mol]
Epe21.5888 × 105 [J/mol]
Ee2.74 × 105 [J/mol]
Epvdf2.86 × 105 [J/mol]
Hsei257 [J/g]
Hne1714 [J/g]
Hpe1277 [J/g]
Hpe2284 [J/g]
He155 [J/g]
Hpvdf1500 [J/g]
Wc6.104 × 105 [g/m3]
Wp1.221 × 106 [g/m3]
We4.069 × 105 [g/m3]
Wpvdf8.14 × 104 [g/m3]
csei00.15
cne00.75
a00.04
ce01
cpvdf01
Tsei343.15 [K]
Tne393.15 [K]
Tpe1443.15 [K]
Tpe2493.15 [K]
Te523.15 [K]
Tpvdf513.15 [K]
Tsp403.15 [K]
Disclaimer/Publisher’s Note: The statements, opinions and data contained in all publications are solely those of the individual author(s) and contributor(s) and not of MDPI and/or the editor(s). MDPI and/or the editor(s) disclaim responsibility for any injury to people or property resulting from any ideas, methods, instructions or products referred to in the content.

