Technical Note

An Image Denoising Method for Arc-Scanning SAR for Airport Runway Foreign Object Debris Detection

1
School of Electronic and Communication Engineering, Sun Yat-sen University, Shenzhen 510006, China
2
College of Information Science and Engineering, Hunan Normal University, Changsha 410081, China
3
School of Electronic Science and Engineering, National University of Defense Technology, Changsha 410073, China
4
School of Electronic Information, Hunan First Normal University, Changsha 410205, China
5
Hunan GHz Information Technology Co., Ltd., Changsha 410073, China
*
Author to whom correspondence should be addressed.
Electronics 2023, 12(4), 984; https://doi.org/10.3390/electronics12040984
Submission received: 8 January 2023 / Revised: 12 February 2023 / Accepted: 14 February 2023 / Published: 16 February 2023
(This article belongs to the Special Issue Advances in Radar Technology for Remote Sensing)

Abstract

:
Arc-scanning synthetic aperture radar (AS-SAR) is an emerging technical means for detecting foreign object debris (FOD). Most FOD are small and appear as weak targets with a low signal-to-noise ratio (SNR) in AS-SAR images. Therefore, image noise is a fundamental challenge in detecting FOD on airport runways that leads to many false alarms. A weak scattering denoising method is proposed to aim at the noise caused by speckle and rough surface scattering. To enhance FOD detection, a transformation parameter concept is offered and adopted, which has different characteristics for the target and background. This paper estimates the transformation parameter through logarithms, normalization, and morphological erosion and optimizes them with edge-preserving filtering. The results show that despeckling and runway scattering suppression can be simultaneously implemented, and that field experiments validate the performance of this method.

1. Introduction

Foreign object debris (FOD) is any object in the wrong location on the airport runway that can injure airport or airline personnel and damage aircraft. Cutting aircraft tires, being sucked into engines, and so on are typical phenomena that can lead to catastrophic loss of life and airframe and increased maintenance and operating costs [1,2,3]. Therefore, the research on detecting FOD is important and has received much attention. The solution for FOD detection mainly includes photoelectric and radar technology [4,5]. Radar can work in weak-light-intensity and extreme weather conditions such as rain and snow, with a high sensitivity and detection range, causing it to be a vital research direction. However, a high false alarm rate is a primary challenge that radar detection technology is facing, often leading to the deterioration of radar performance. Therefore, improving the signal-to-noise ratio (SNR) and reducing false alarms is crucial for radar research.
Most existing radar systems are based on real apertures, with disadvantages such as low azimuth resolution and susceptibility to flicker clutter interference [6,7]. Synthetic aperture radar (SAR) has high-resolution imaging capability and is widely used in target monitoring [8,9]. Arc-scanning SAR (AS-SAR) is ground-based SAR (GB-SAR) with an arc aperture [10,11,12]. AS-FODR is the first equipment to apply AS-SAR to FOD detection [13,14]. In addition to the general advantages of SAR, it also has advantages such as easy installation using a small-size antenna, high-quality imaging with a small influence from the rotation accuracy of the mounting platform, high direction-finding accuracy, rich target information, and the ability to suppress flicker clutter. However, similar to other SAR systems, the existence of noise causes AS-SAR image interpretation to be more difficult and affects the accuracy of subsequent processing. Therefore, this paper presents a method to suppress noise and improve the signal-to-noise ratio (SNR).
The noise of the AS-SAR image is mainly composed of speckle noise and runway scattering. Speckle noise is a classical noise caused by imaging mechanisms that have been deeply studied, and many effective methods have emerged. There are few kinds of research on complex data processing algorithms [15]. More studies focus on real data. Classical speckle suppression methods include spatial filtering algorithms, such as Lee, Kuan, and Frost [16,17,18]; transform domain filtering algorithms, such as shearlet transform and wavelet transform [19,20]; multi-temporal processing algorithms [21]; and other algorithms such as total variation, which was proposed by Rudin et al. [22].
As an essential part of the aviation system, the quality of the airport runway can directly affect the regular operation of the airport. The ground materials of the airport runway usually include concrete and asphalt. The airport runway surface contains a rough frosted texture or engraving to increase the friction between the tires and the runway during takeoff and landing. At the same time, to ensure the service life of the runway, the runway often adopts a panel partition design, which will also lead to pavement gaps of a certain width and depth. Moreover, AS-SAR works in the W-band, the carrier frequency is 94 Ghz, and the wavelength is 3.2 mm. Additionally, they scan with low grazing incidence. Thus, the runway scattering is rough surface scattering and will lead to many false alarms in the subsequent detection algorithm. Many noise suppression algorithms have been developed. The Chinese Academy of Sciences developed an iterative adaptive approach (IAA) algorithm for interference suppression and false alarm reduction, a non-parametric, weighted least squares-based iterative adaptive processing approach [23]. The National University of Defense Technology proposed a clutter-analysis-based space-time adaptive processing (STAP) method to obtain effective suppression against an inhomogeneous clutter background [24]. Feil et al. designed a radar FOD detection system using FMCW, which acquires an empty scene measurement and subtracts these data from the actual measurements. It can considerably improve the SNR [25].
Therefore, despeckling and runway scattering suppression will be implemented at the same time in AS-SAR image denoising. In the process of FOD detection, the runway is the central monitoring area, which has consistency. To better use this feature, this paper proposes a weak scattering denoising algorithm, which can effectively improve the target SNR, has high computational efficiency, and can be realized in real-time. The remainder of this paper is organized as follows. Section 2 provides a description of the AS-SAR image model and the corresponding weak scattering denoising method. The experimental results are provided in Section 3. Then, the influence of the window size on denoising is discussed in Section 4. Finally, the conclusion is provided in Section 5.

2. AS-SAR Image Model and Weak Scattering Denoising Method

2.1. AS-SAR Image Model

The linear FMCW signal adopted by AS-SAR is provided as follows:
e T ( t ) = r e c t ( t T p u ) e x p [ j 2 π ( f c t + 1 2 k r t 2 ) ] ,   t [ 0 , T p u ]
where f c is the carrier frequency, T p u is the modulation period, k r is the chirp constant, and t is the time within a modulation period. R   is the distance from the target to the radar.
According to the result of the literature [13], which the AS-SAR imaging algorithm is derived from, the two-dimensional Fourier image is
E ( f r , f θ ) = A ( f r , f θ ) e x p [ j 4 π ( f r + f c ) R c ]
where f r is the frequency of fast time, f θ is the azimuth frequency, A ( f r , f θ ) is the amplitude attenuation coefficient, which is independent of the phase, and c is the speed of light. The two-dimensional inverse fast Fourier transform (IFFT) is performed on E ( f r , f θ ) , and the temporal SAR image f ( r , θ ) in polar coordinates can be obtained. r and θ represent the two-dimensional coordinates of the image pixels r is the range coordinate and θ is the azimuth coordinate. AS-SAR bandwidth B is 1 GHz. Then, it can be calculated that the range resolution of this system is:
Δ r = c 2 B = 3 e 8 2 × 1 e 9 = 0.15 m  
The carrier frequency is 94 Ghz, and the wavelength corresponds to the center frequency at 3.2 mm. So, the azimuth resolution of the system is as follows:
Δ a = arcsin ( c 4 f c L s i n ( h 2 ) ) = 0.06 °
where L is the length of the rotating arm and h is antenna horizontal beam angle. L = 1 m, and h = 90 ° . When FOD are placed on the runway and they are more than 200 m away from the radar, Δ a × 200   m = 0.21   m .
Both azimuth resolution and range resolution are greater than the wavelength. According to the multiplicative noise model [26,27,28], the value of each pixel in an image can be obtained using the sum of the FOD scattering and runway scattering multiplied by the speckle noise. The image model can be written as
f ( r , θ ) = ( s b ( r , θ ) + s f o d ( r , θ ) ) n ( r , θ )
where f ( r , θ ) is the AS-SAR image value and s b ( r , θ ) is the actual scattering of the airport runway. n ( r , θ ) is the speckle noise, which is independently identically distributed with the unit mean noise.
We calculate logarithms on both sides of Equation (1), and the equation will be converted as follows:
f l g ( r , θ ) = 10 lg ( f ( r , θ ) ) = 10 lg ( s b ( r , θ ) ) lg ( s f o d ( r , θ ) ) + 10 lg ( n ( r , θ ) )
A transformation parameter t ( r , θ ) is introduced here, for which the value range is [0,1]. It can suppress s b ( r , θ ) and preserve s f o d ( r , θ ) . Thus, the purpose of the runway scattering suppression and despeckling is achieved. A pre-process for f l g ( r , θ ) will be completed. Let B f be the minimum of f l g ( r , θ ) , and A f be the maximum of f l g ( r , θ ) , then
f u l g ( r , θ ) = f l g ( r , θ ) B f A f B f
where f u l g ( r , θ ) is the normalized f l g ( r , θ ) . If the runway is not a rough surfaces scatterer but rather a smooth surfaces scatterer, the radar scattering is very weak, and the m i n ( r , θ ) Ω ( r , θ ) ( f u l g ( r , θ ) ) will trend toward 0. Ω ( r , θ ) is the ( r , θ ) neighborhood. Thus, the transformation parameter t ( r , θ ) can be calculated by
t ( r , θ ) = 1 m i n ( r , θ ) Ω ( r , θ ) ( f u l g ( r , θ ) )
We divide both sides of Equation (2) by the t ( r , θ ) , and move the noise part to the left of this equation
f l g ( r , θ ) 10 lg ( n ( r , θ ) ) t ( r , θ ) = 10 lg ( s b ( r , θ ) ) lg ( s f o d ( r , θ ) ) t ( r , θ )
where lg ( n ( r , θ ) ) is estimated by
10 lg ( n ( r , θ ) ) = s t d ( r , θ ) Ω ( r , θ ) ( f u l g ( r , θ ) )
The s t d ( ) represents the standard deviation.
According to the definition of SNR, the FOD SNR in the image before denoising is
S N R f o d b = 10 lg ( s f o d ( r , θ ) ) m e a n Ω ( f o d ) ( 10 lg ( s b ( r , θ ) ) )
where m e a n Ω ( f o d ) ( 10 lg ( s b ( r , θ ) ) ) is the mean value of the FOD neighborhood in 10 lg ( s b ( r , θ ) ) without itself. The FOD SNR in the image after denoising is
S N R f o d a = 10 lg ( s f o d ( r , θ ) ) t ( r , θ ) m e a n Ω ( f o d ) ( 10 lg ( s b ( r , θ ) ) t ( r , θ ) )
If there is no FOD, t ( r , θ ) will trend toward 1; if FOD exists, the m i n ( r , θ ) Ω ( r , θ ) ( f u l g ( r , θ ) ) will trend toward 1, and t ( r , θ ) will trend toward to 0, 10 lg ( s f o d ( r , θ ) ) t ( r , θ ) will increase while m e a n Ω ( f o d ) ( 10 lg ( s b ( r , θ ) ) t ( r , θ ) ) will remain unchanged, and then S N R f o d a > S N R f o d b . When processing the measured data, m e a n Ω ( f o d ) ( 10 lg ( s b ( r , θ ) ) t ( r , θ ) ) also increases slightly. However, the smaller the lg ( s b ( r , θ ) ) is, the more the value of t ( r , θ ) will trend toward 1 and, thus, it will not affect the conclusion of the improvement of SNR. Dividing by the coefficient t ( r , θ ) can enhance the FOD image.

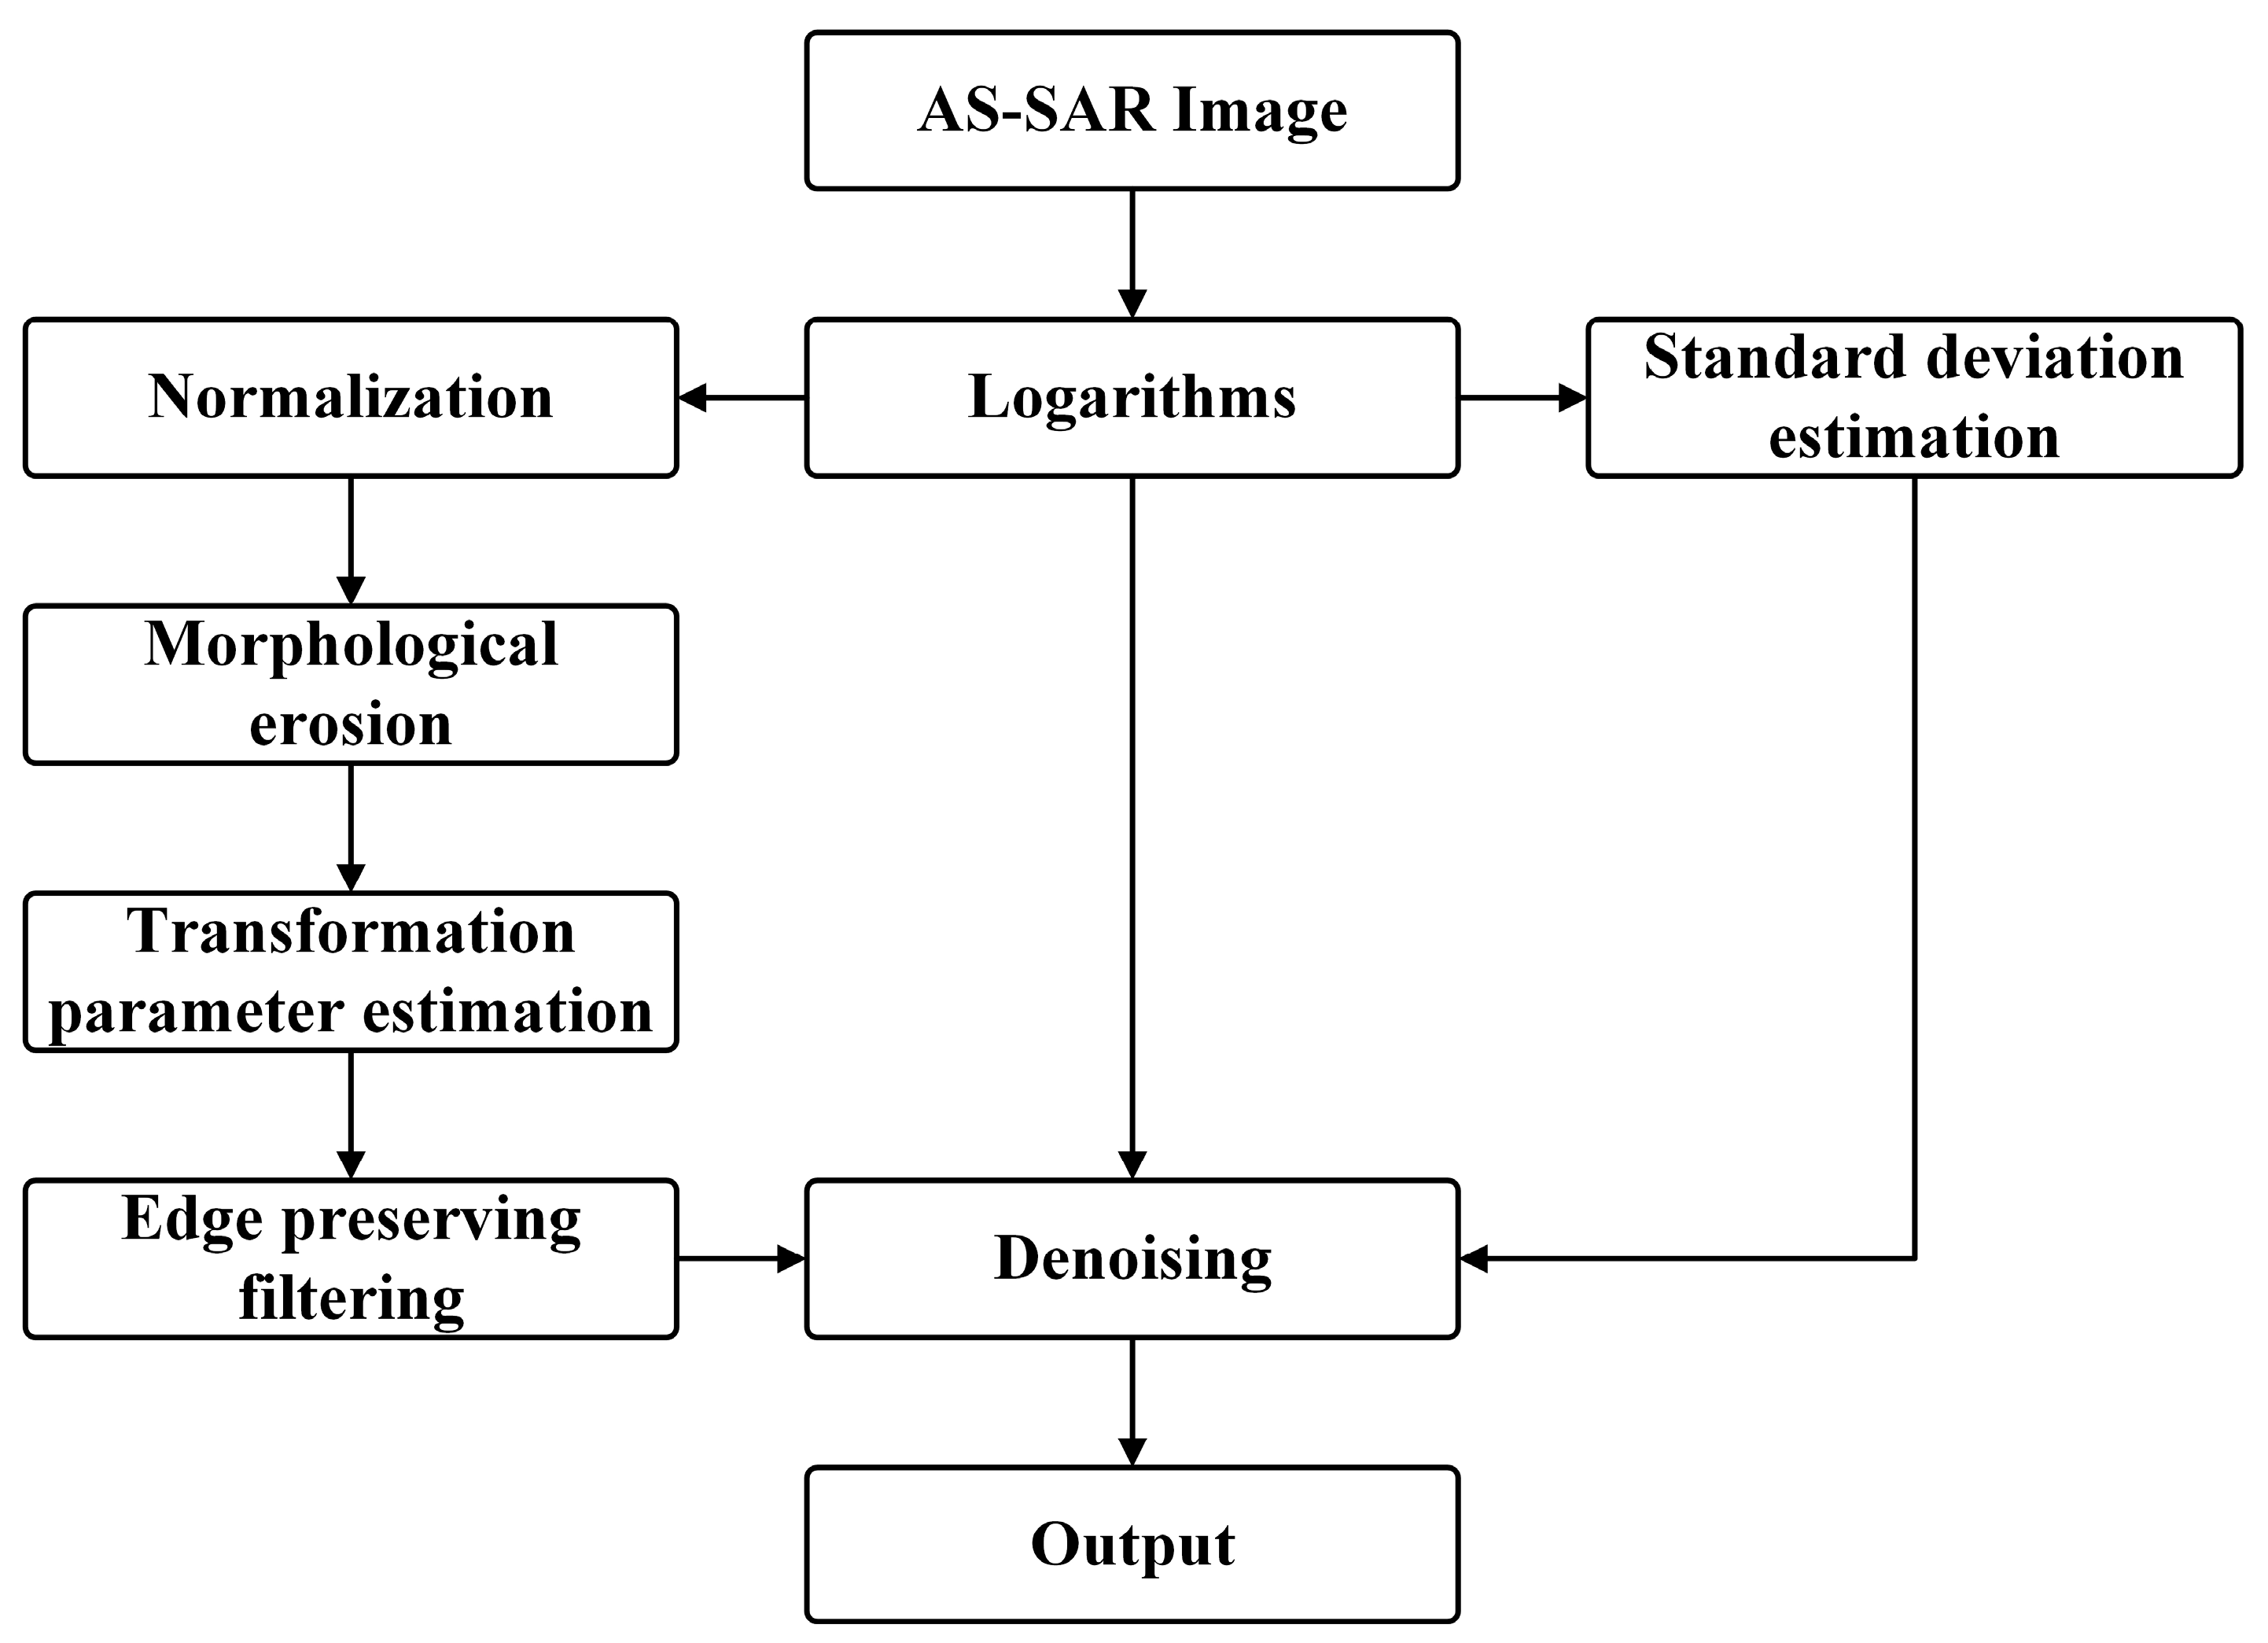
2.2. Weak Scattering Denoising Method

According to the image model, a denoising method flow based on weak scattering is proposed as follows, and the process flow is given in Figure 1.
  • Logarithms. The AS-SAR image is logarithmic.
  • Normalization. The logarithmic image is normalized using Equation (7).
  • Morphological erosion. The grayscale image f u l g ( r , θ ) is eroded by the mathematical morphology, and its structure element object is a rectangular window.
  • Transformation parameter estimation. Equation (4) is used to calculate the transformation parameter t ( r , θ ) .
  • Edge-preserving filtering. To effectively retain the edge information of FOD, a guided image filter [29,30] is adopted for t ( r , θ ) , which can maintain the relativity of the gradient. To simplify the expression, f u l g ( r , θ ) is represented by F . The guidance filter assumes that the filtering result and the guidance image have a linear relationship in the local area:
    g i = α r , θ F i + β r , θ ,   i Ω r , θ
    where F i is the guide image and g i is the output, Ω r , θ is a neighborhood window with ( r , θ ) as the center pixel, i is the index of pixels, and α r , θ and β r , θ are the corresponding linear coefficients of the window. The above linear relationship naturally guarantees the relativity of the image gradient. To achieve the effect of edge-preserving filtering, we expect α r , θ and   β r , θ to change with the image content. When using Equation (11) to solve the coefficients of linear functions, the constraint of the minimum mean square error between the output value g i and the actual value t i is added so that it can be transformed into an optimization problem as follows:
    E ( α r , θ , β r , θ ) = i Ω r , θ ( ( α r , θ F i + β r , θ t i ) 2 + ϵ α r , θ 2 )
    where ε is the regularization coefficient that punishes the larger α r , θ . In order to obtain the minimum value of the above equation, the two parameters β r , θ and α r , θ are derived, respectively,
    E β = i Ω r , θ 2 ( α r , θ F i + β r , θ t i )
    E α = i Ω r , θ ( 2 ( α r , θ F i + β r , θ t i ) F i + 2 ε α r , θ
    If Equation (14) is equal to zero, then
    β r , θ = i Ω r , θ 2 ( t i α r , θ F i ) | Ω r , θ | 0
    where | Ω r , θ | 0 is the number of pixels in window Ω r , θ . Further, using t ¯ r , θ and μ r , θ indicates the mean of t ( r , θ ) and F in the neighborhood window, respectively,
    β r , θ = t ¯ r , θ α r , θ μ r , θ
    Let Equation (16) be equal to zero and put the value of β r , θ into it. σ r , θ indicates that the guide image is the standard deviation in the neighborhood window. Then, find the value of α r , θ as follows:
    α r , θ = 1 | Ω r , θ | 0 i Ω r , θ t i F i μ r , θ t ¯ r , θ σ r , θ 2 + ε
    In the smooth area, α r , θ trends toward 0 and β r , θ tends to be the mean value, which is equivalent to the mean filtering of the image. In the edge area, α r , θ trends toward 1, β r , θ trends toward 0, and the output is equivalent to the original image.
  • Standard deviation estimation. The standard deviation of the logarithmic image in the rectangular window is counted to obtain the noise intensity estimation.
  • Denoising. FOD SNR is enhanced using Equation (9).
  • Output.

3. Results

The experimental results adopted the measured data of AS-FODR, which was designed in the literature [13]. The AS-FODR system was developed in 2021 in Changsha, Hunan province, China. The core design of AS-FODR is that the antenna phase center uses the rotating arm to form an arc aperture and then uses the synthetic aperture principle to generate high-resolution images. AS-FODR adopts a frequency-modulated continuous wave (FMCW) signal with a working frequency of 94 GHz, a bandwidth of 2 GHz, and a range resolution of 0.15 m. When the system turntable speed is 360°/min, the step size of each pulse is 0.02°, which corresponds to the center frequency, so the azimuth resolution of the system is 0.06°. A photograph of the AS-FODR system is provided in Figure 2, which is installed at the general airport in Dalu, Zhenjiang, Jiangsu province. Figure 3 shows the AS-FODR detection diagram in the corresponding satellite photograph.

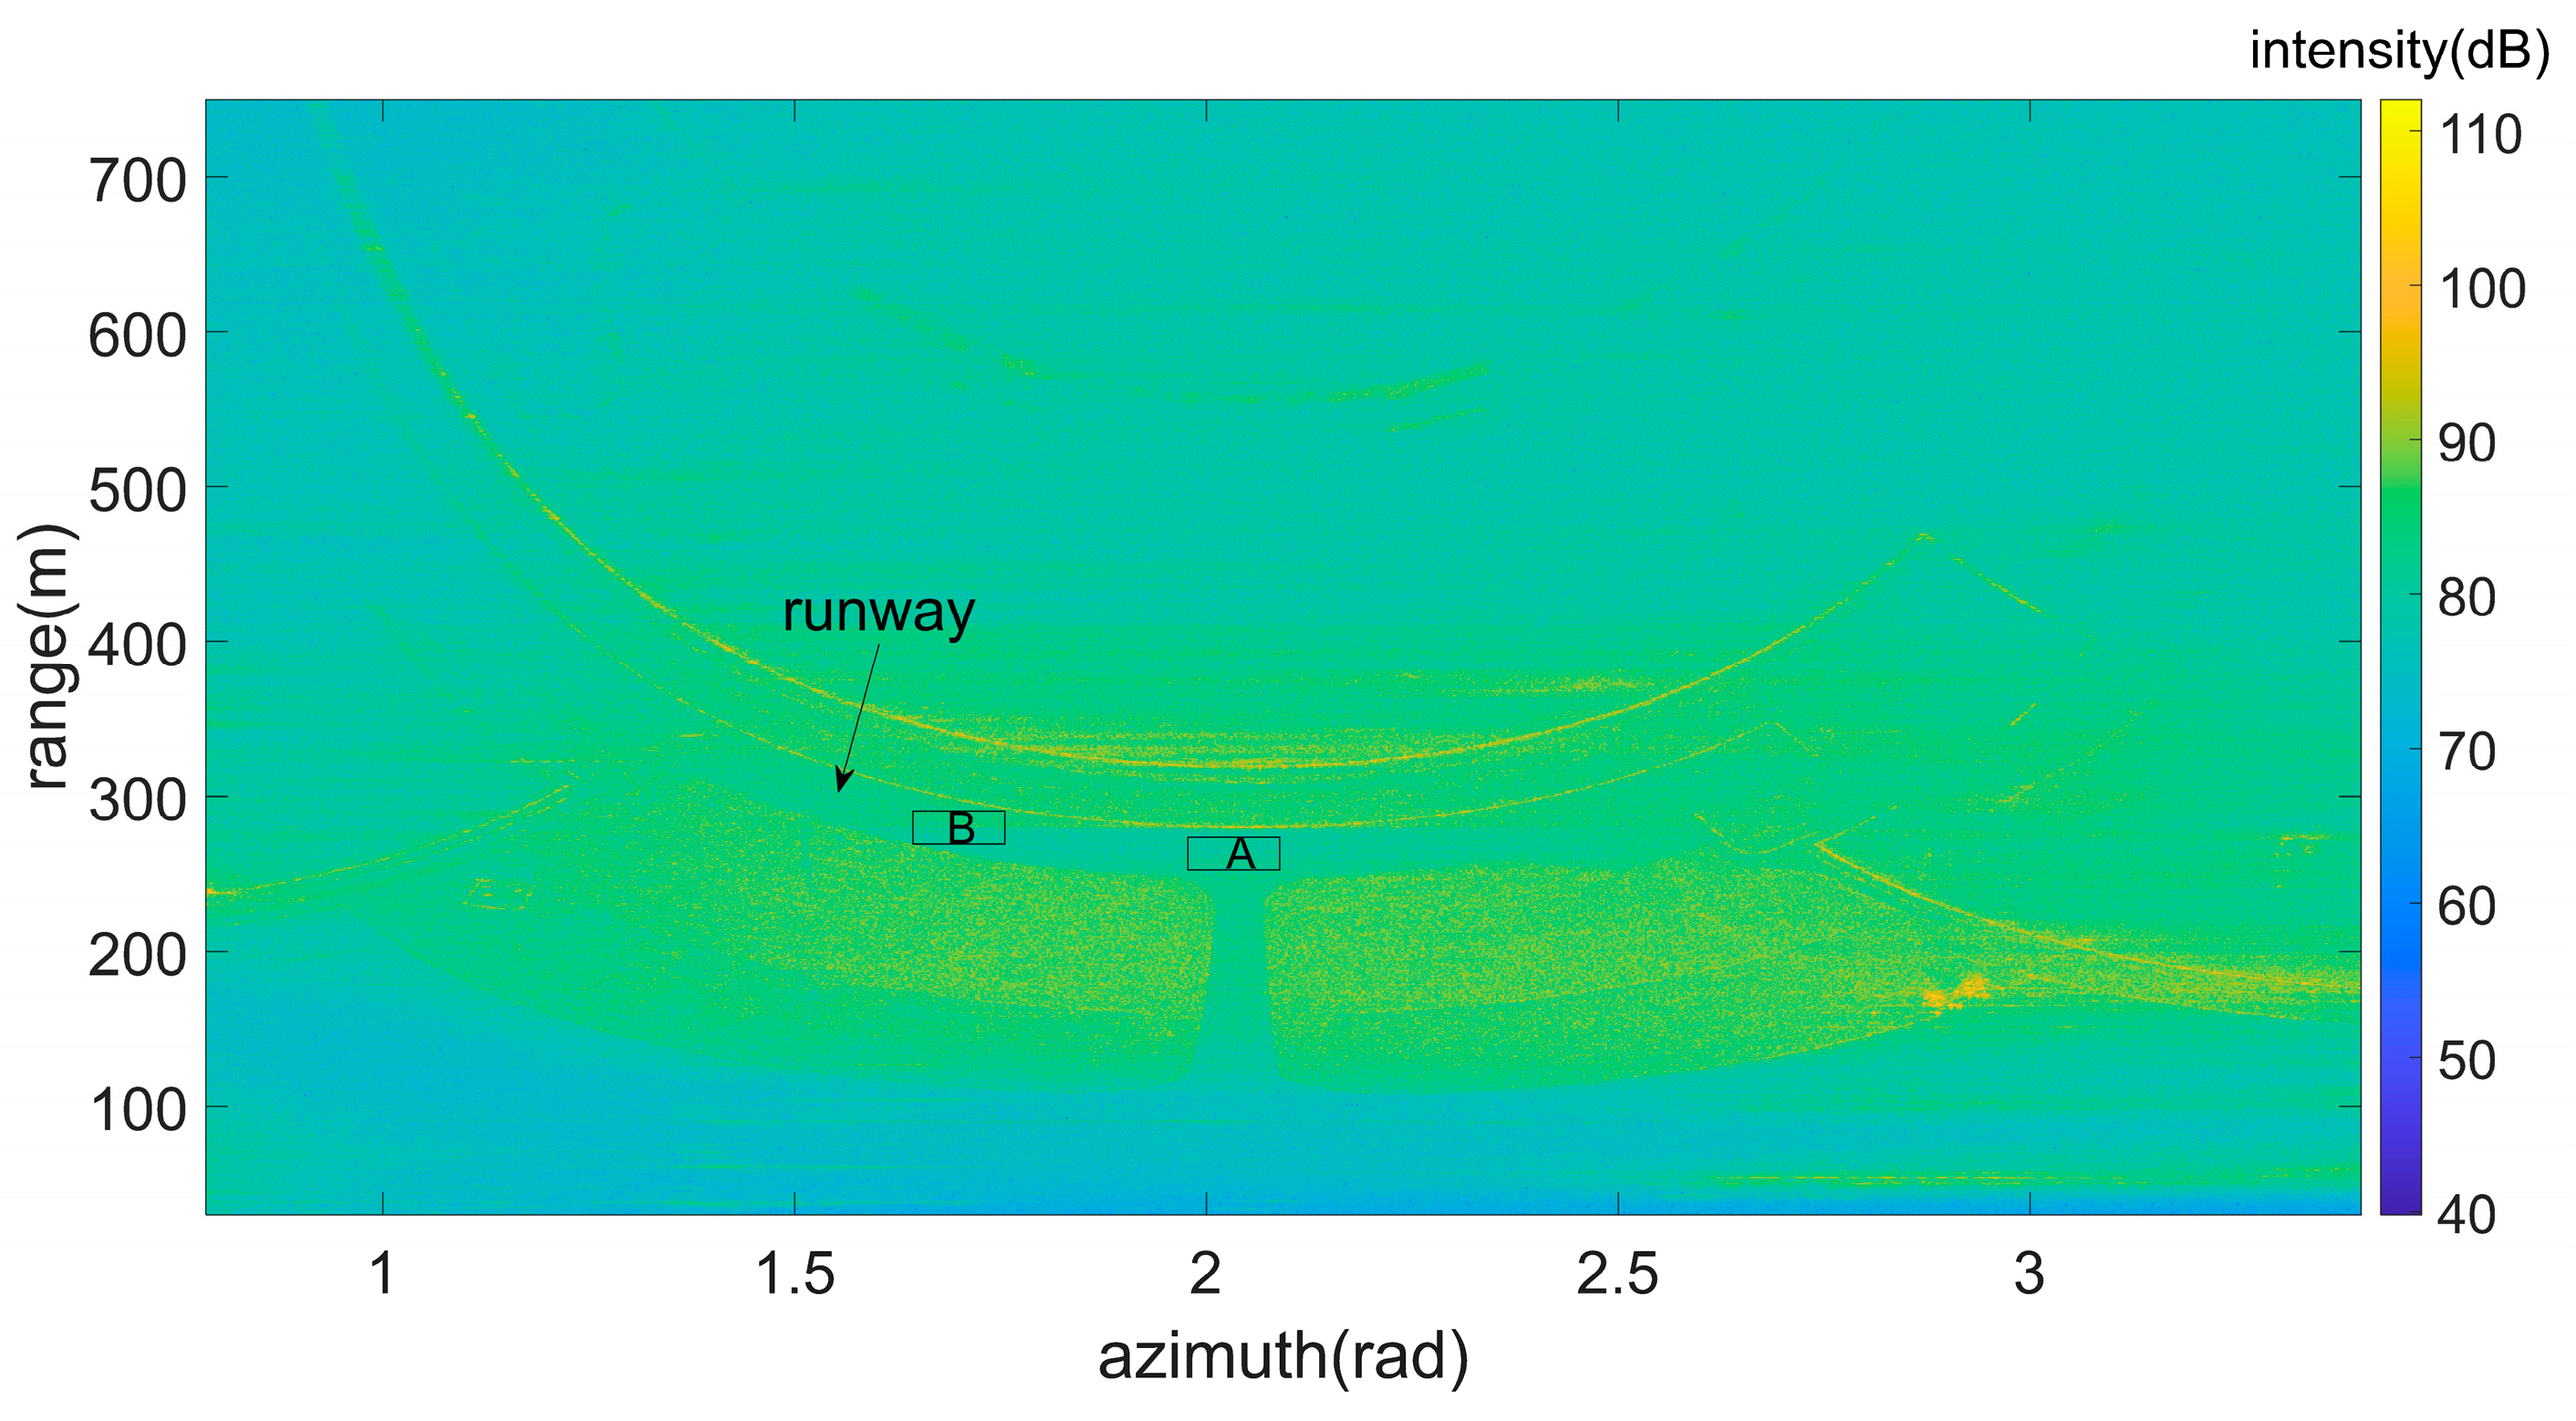
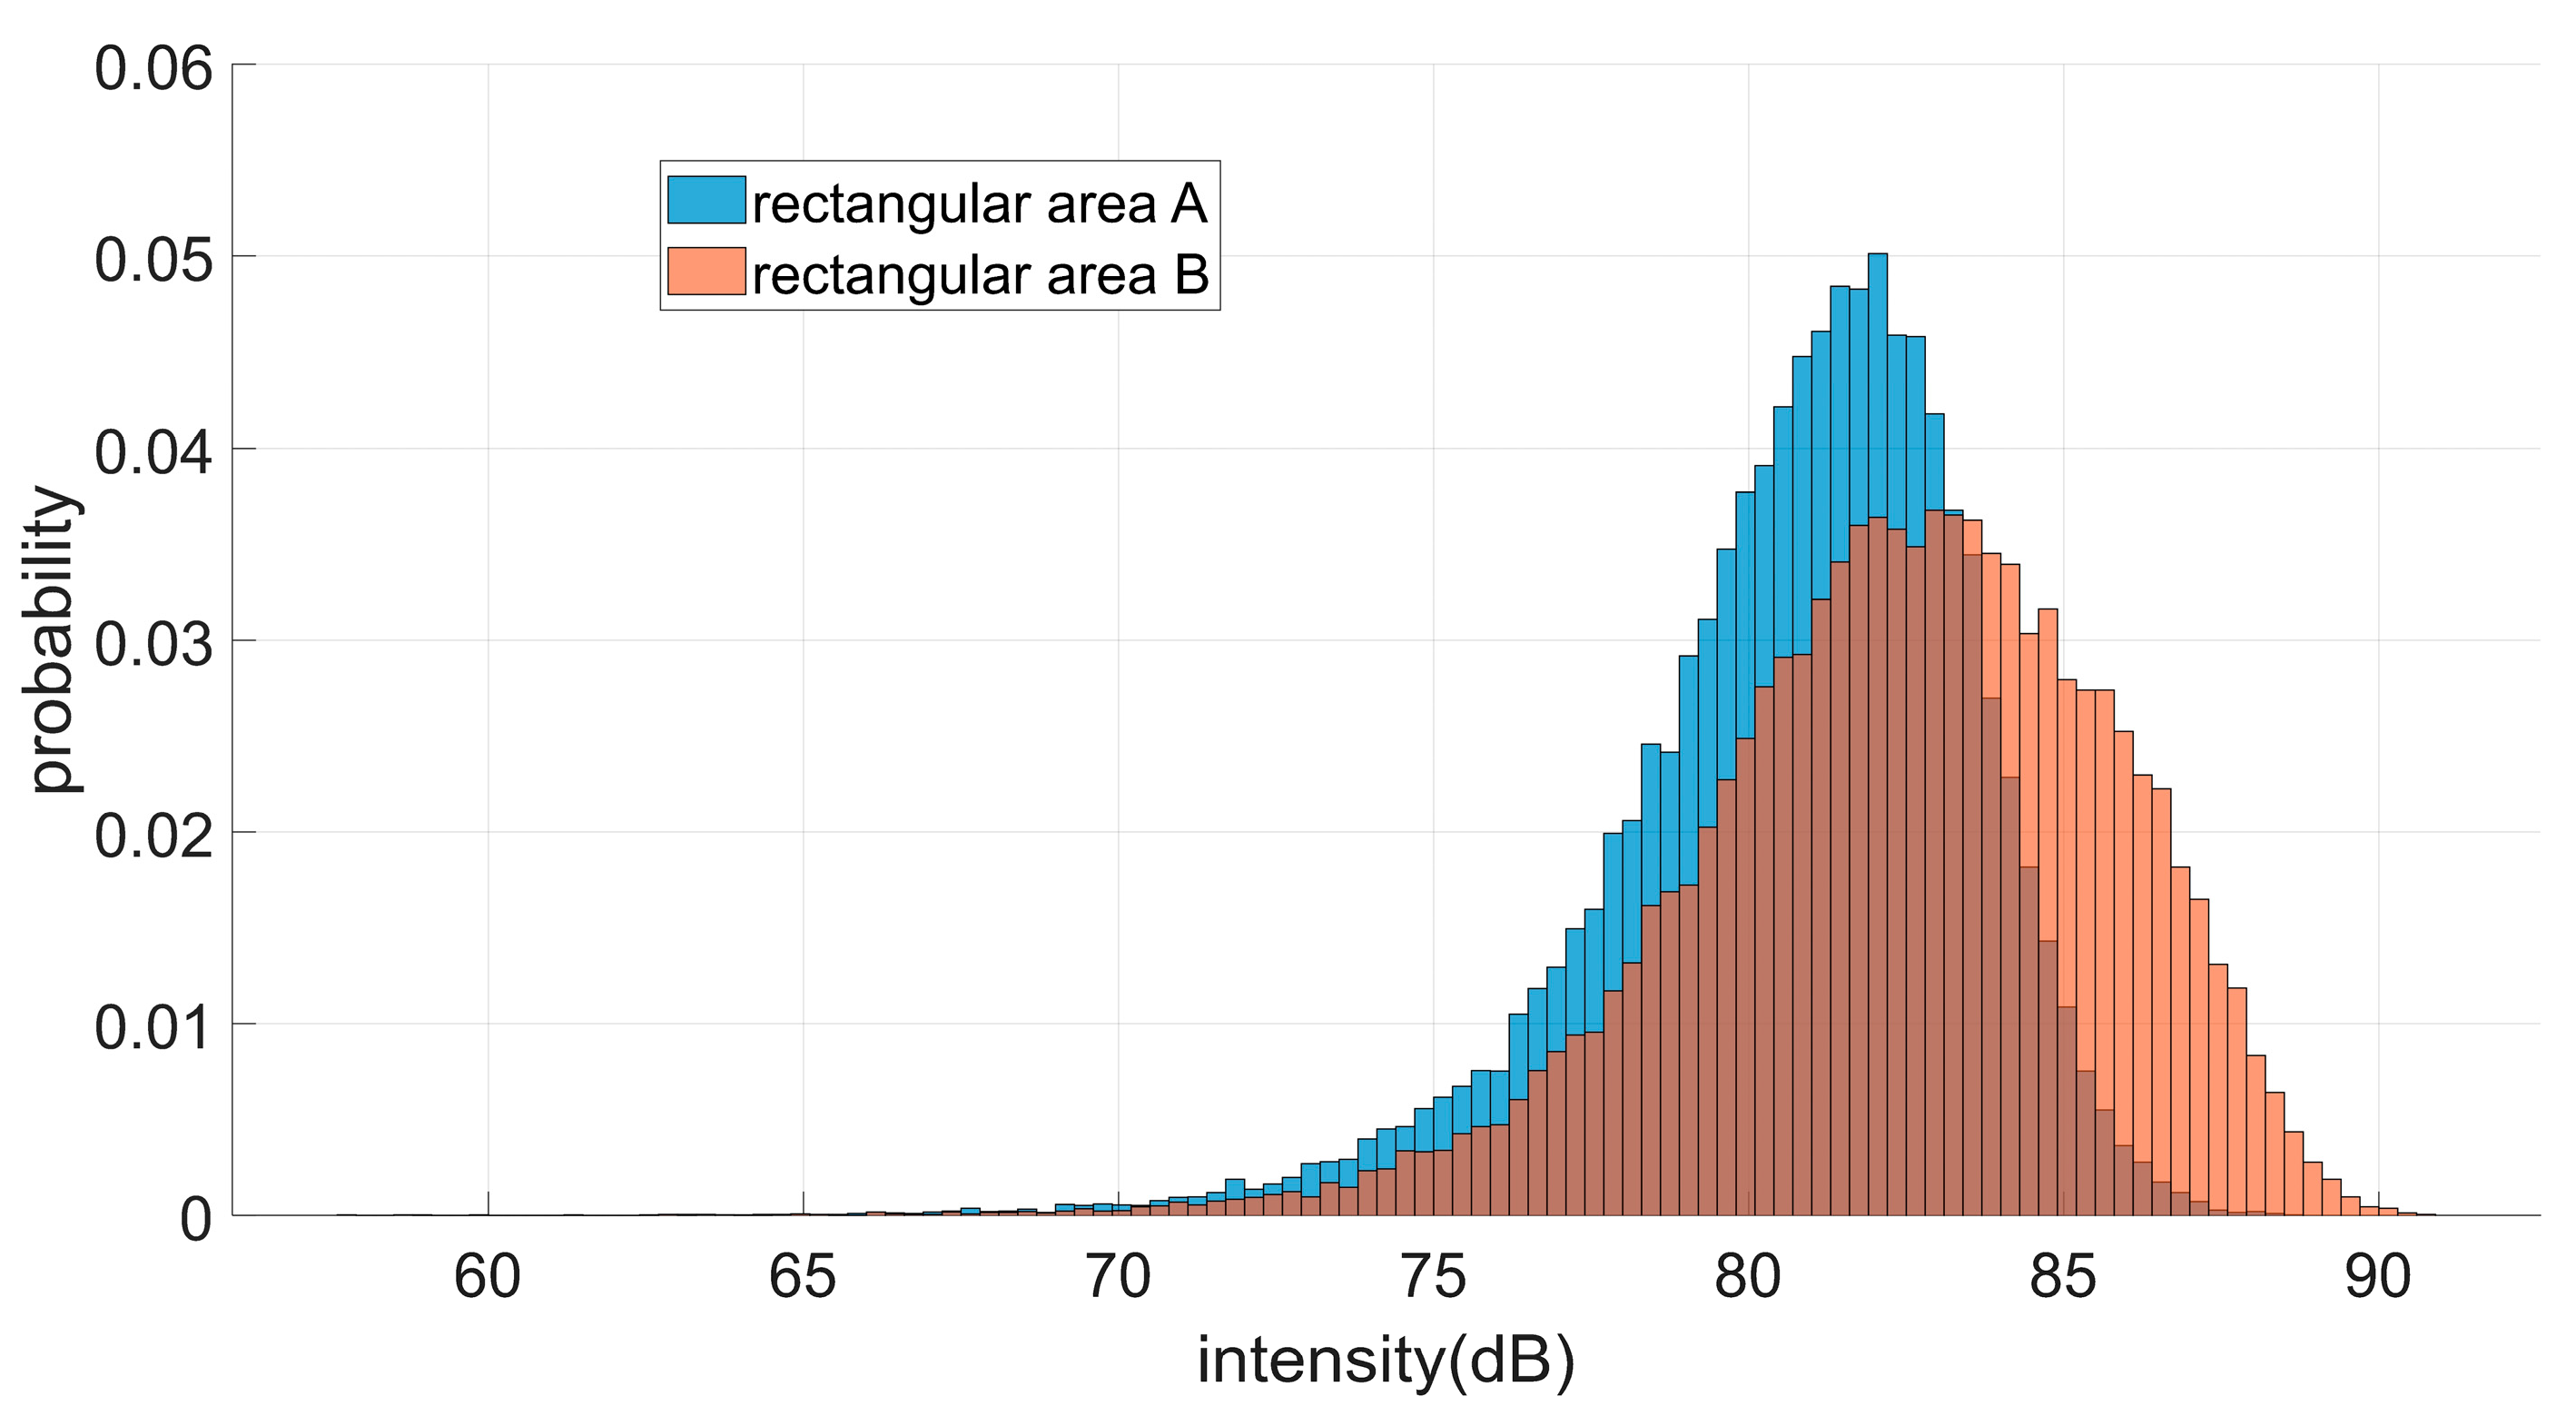
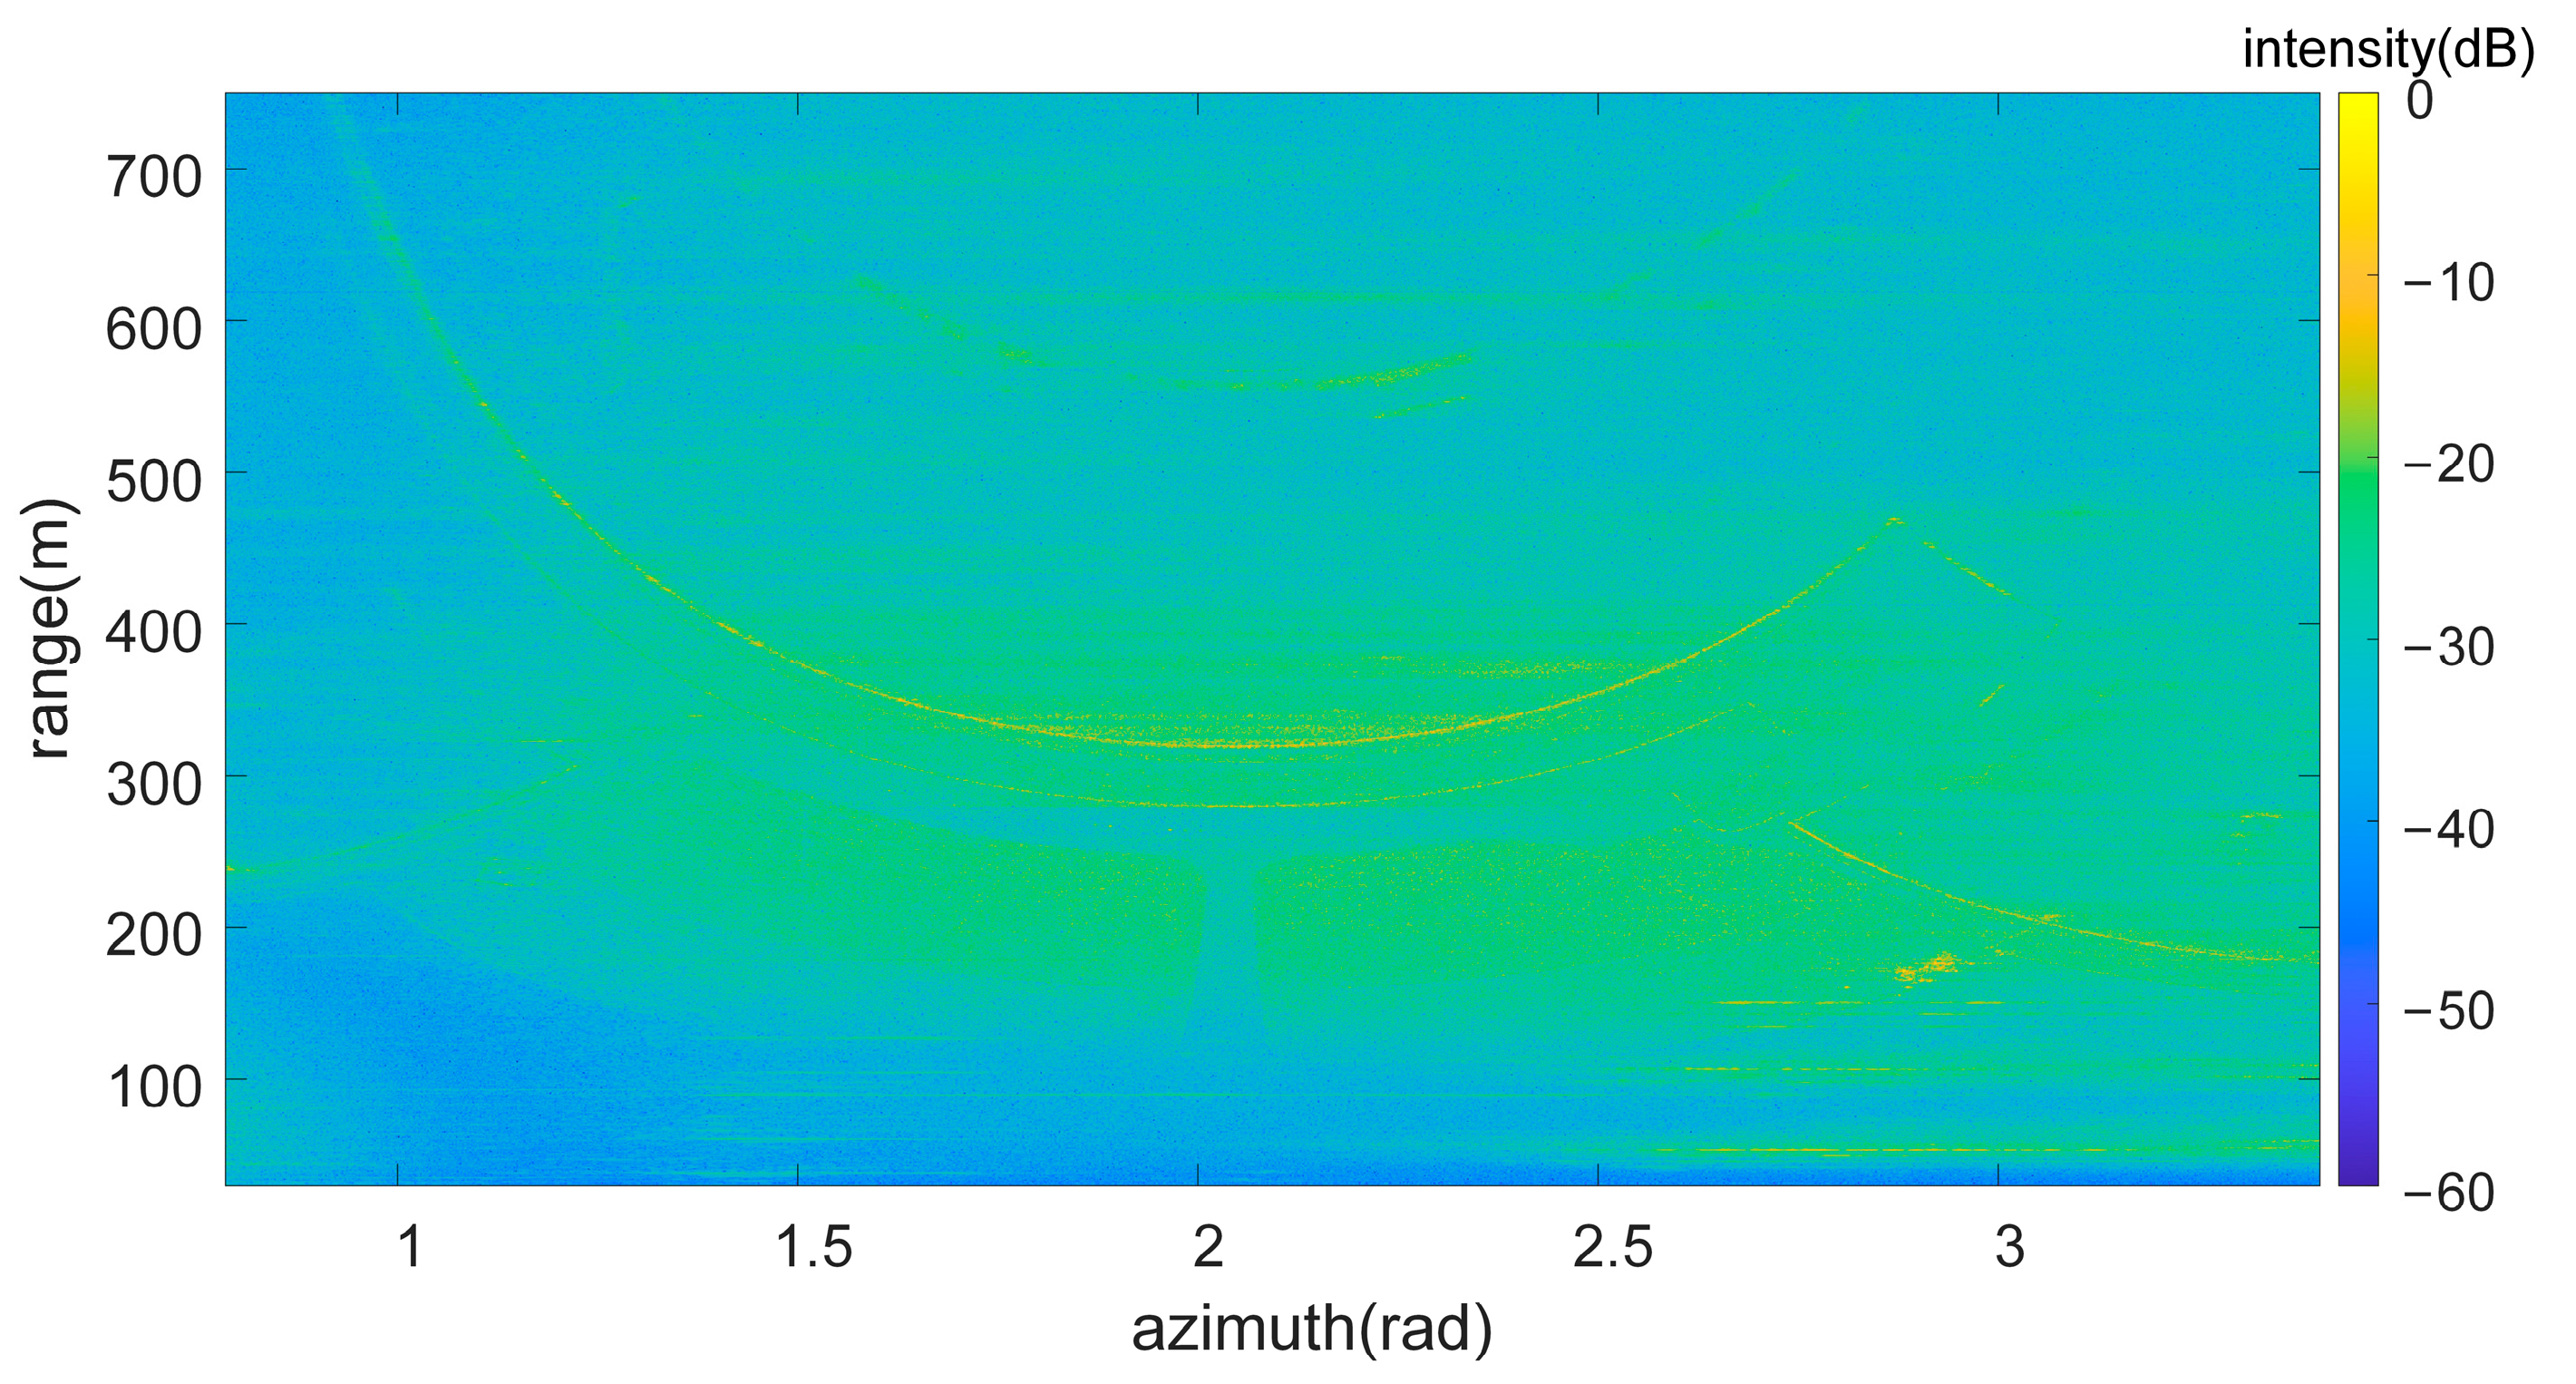
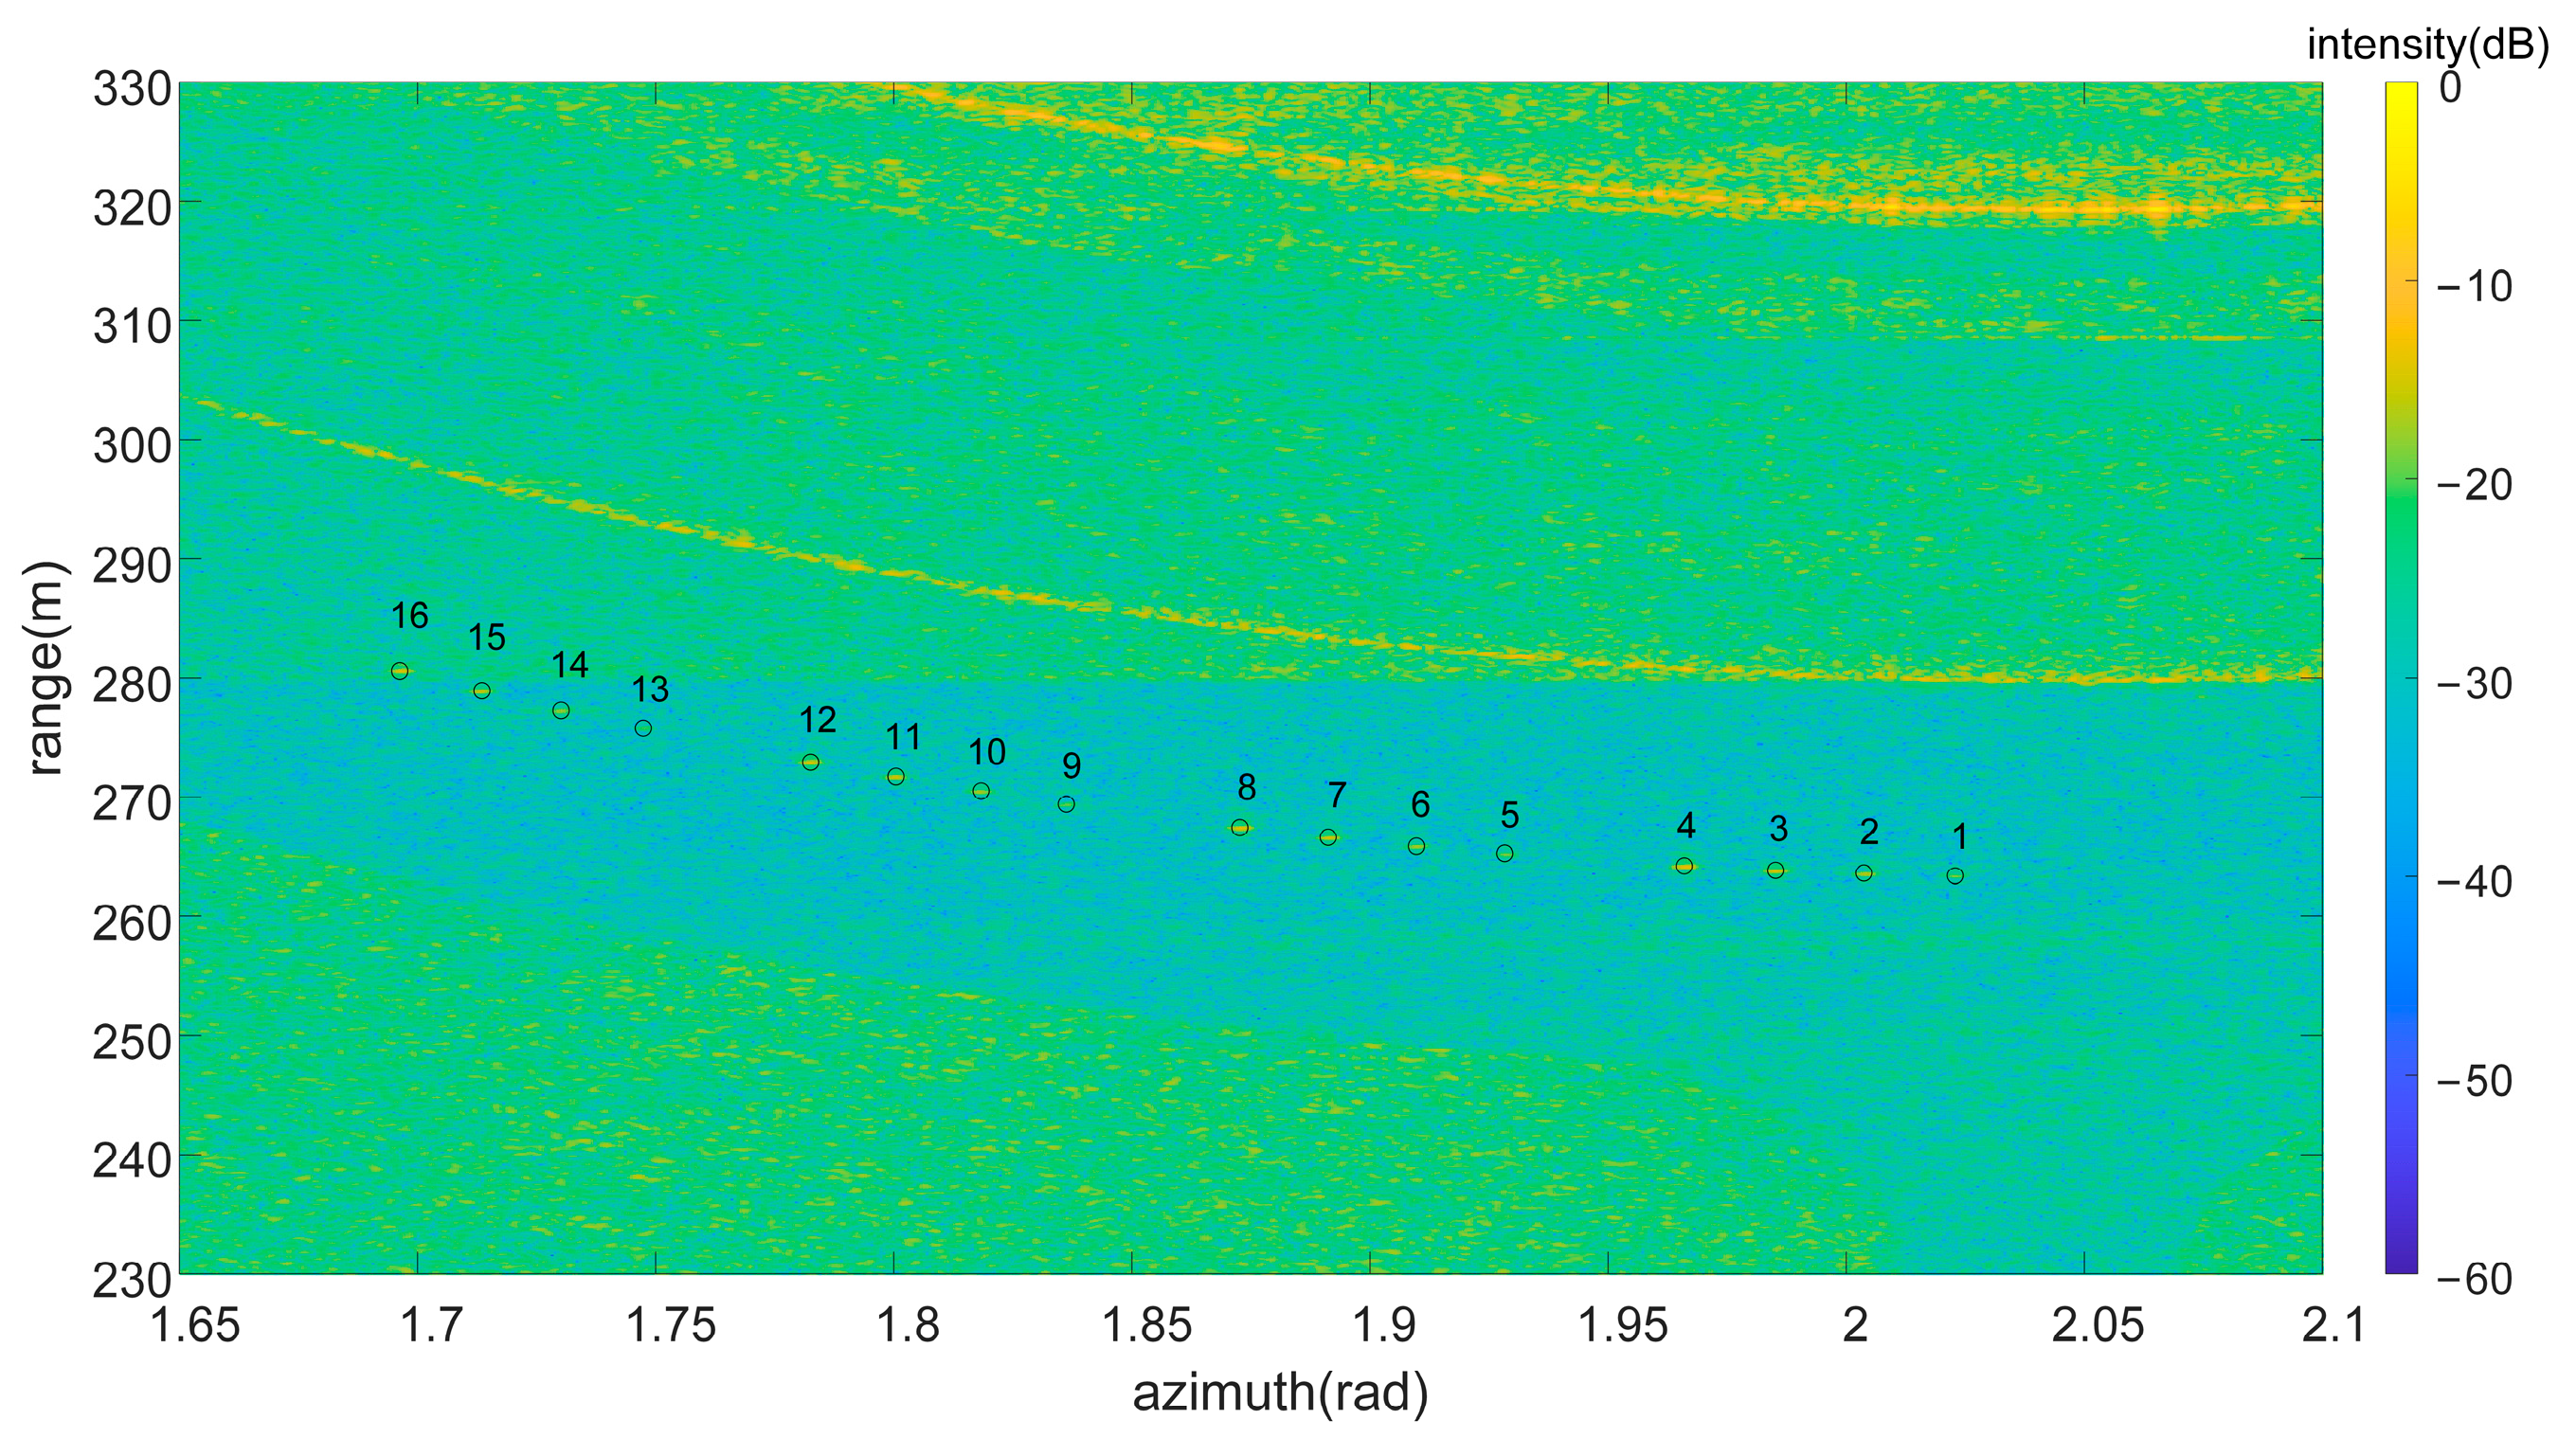
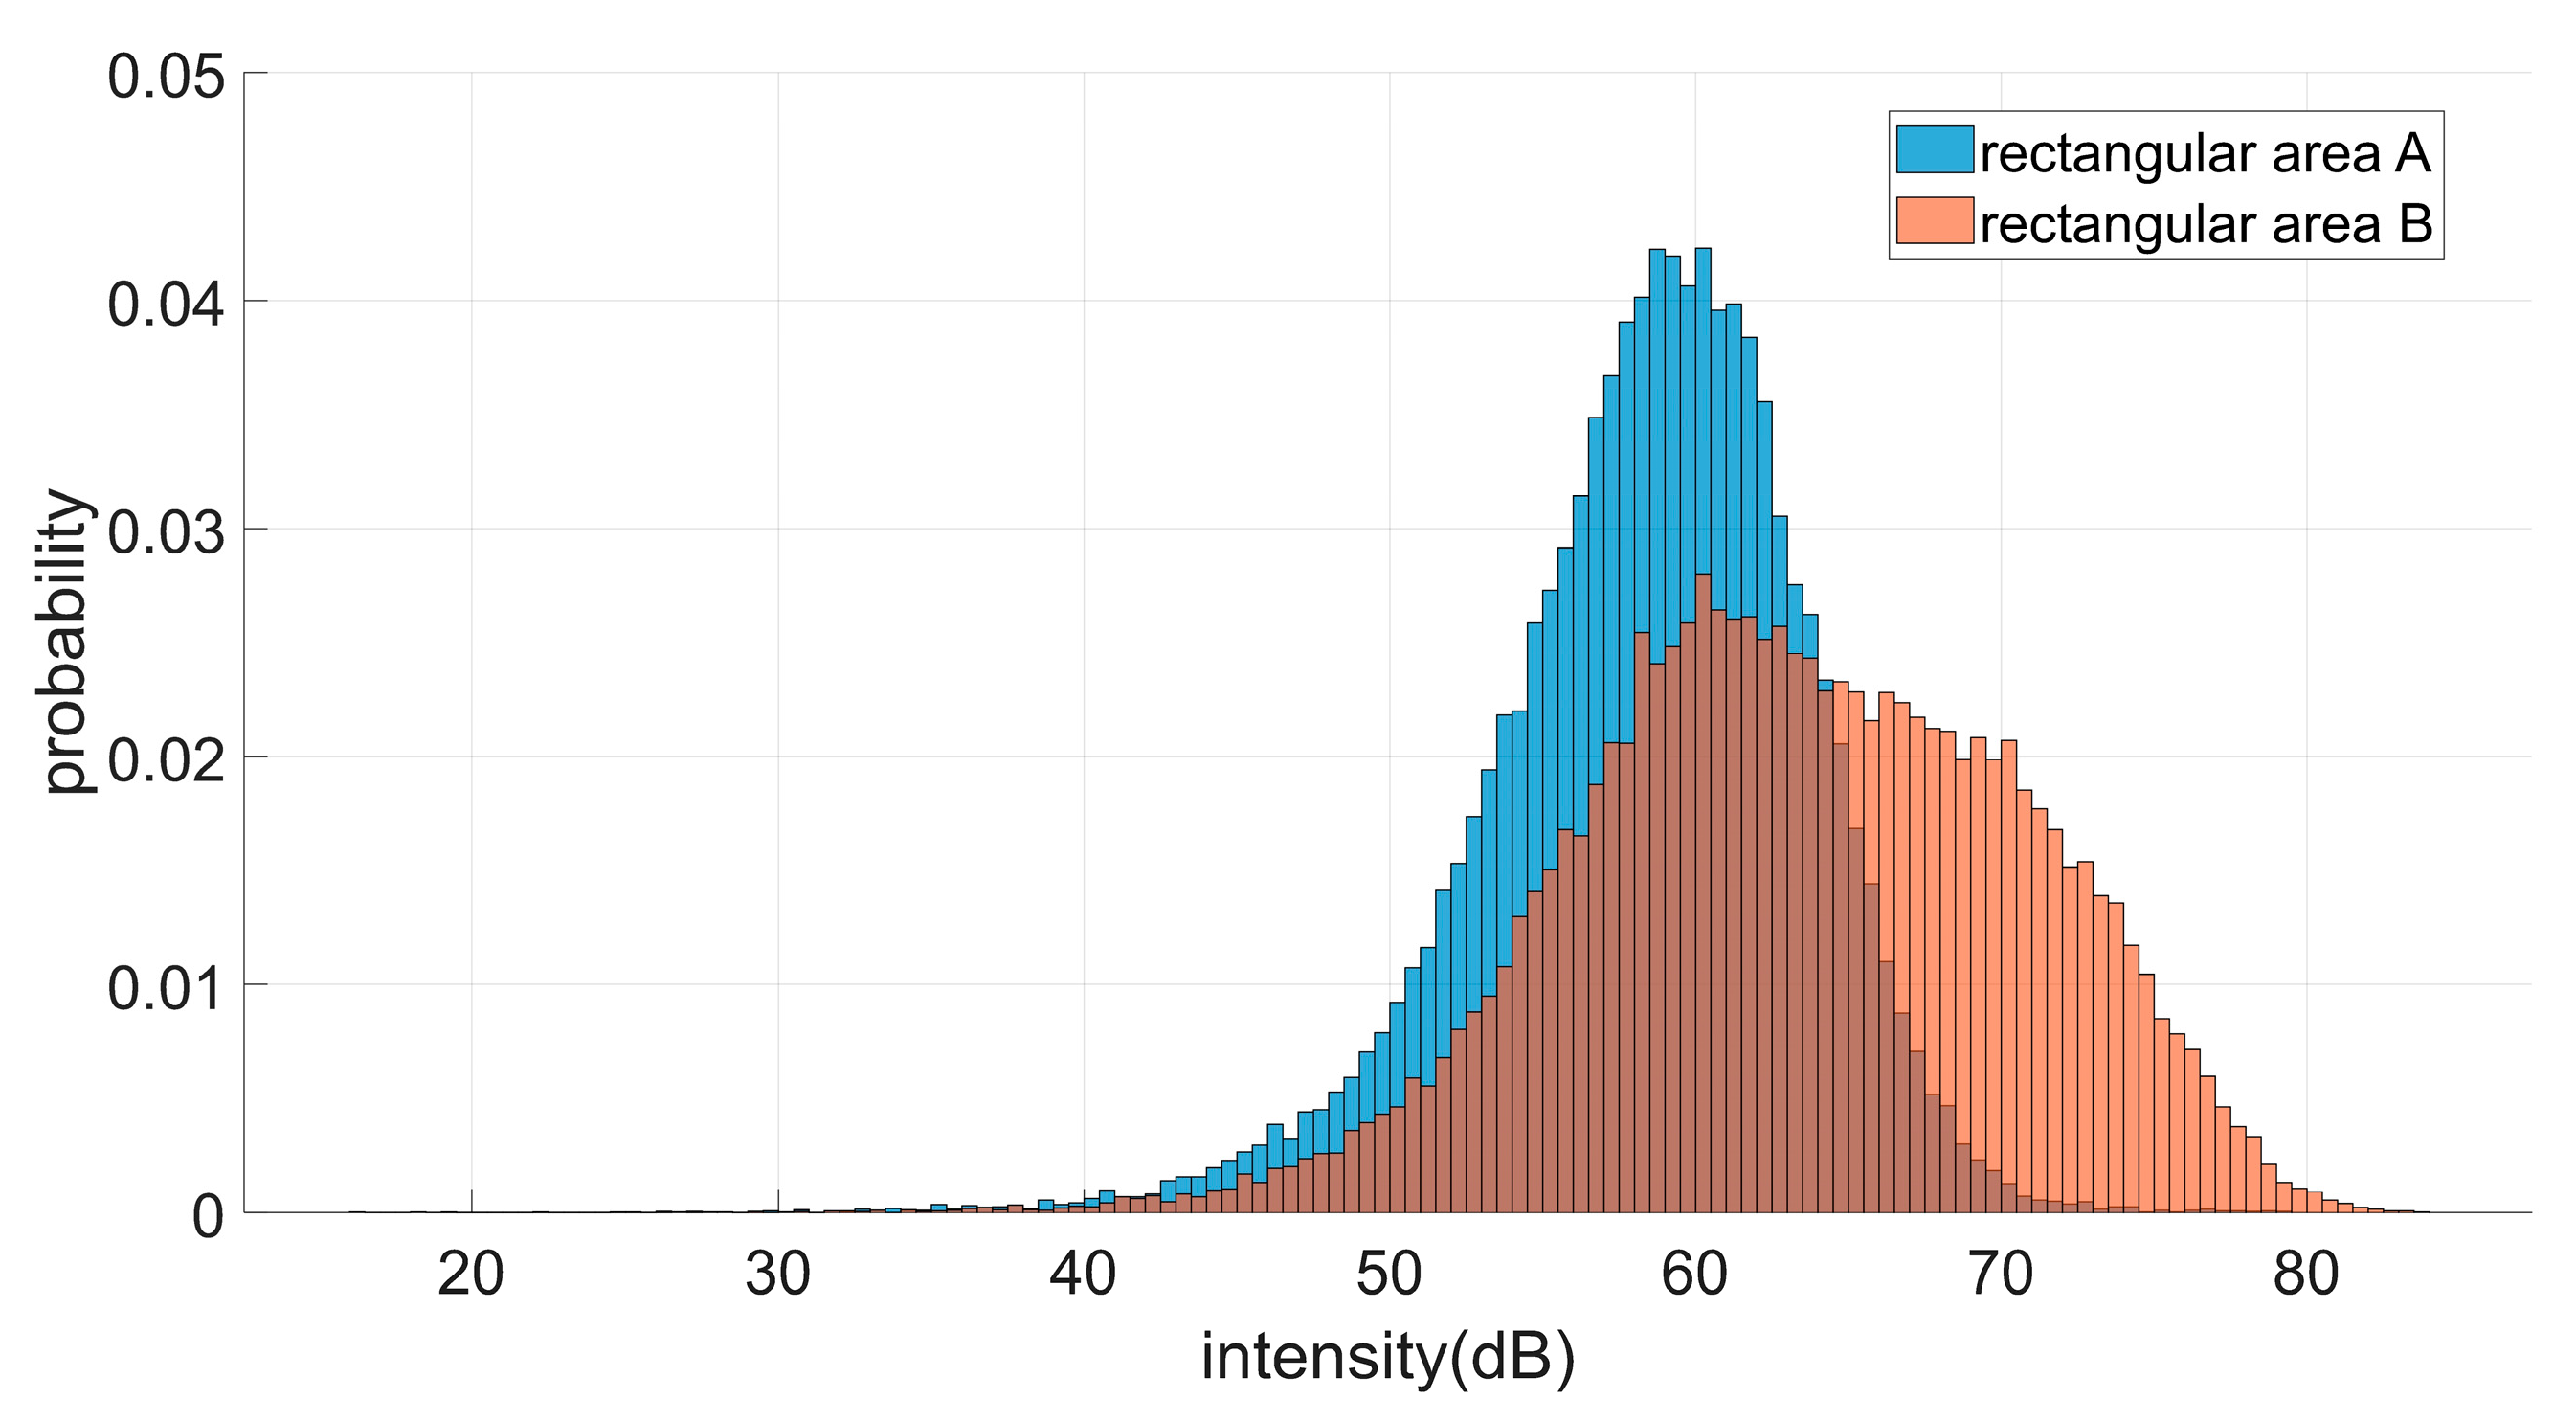
3.1. Statistical Characteristics of Runway Image

Figure 4 provides the AS-FODR logarithmic image of the runway without FOD in a polar coordinate system. AS-FODR can image various areas of the airport. Two rectangular areas, A and B, on the runway are selected in Figure 4, and Figure 5 provides their probability distribution of intensity. The greater the range is, the stronger the background noise is. However, their distribution forms are similar, with fewer small values and more large values. The influence of the runway surface scattering on the target’s SNR is greater than that of the speckle.

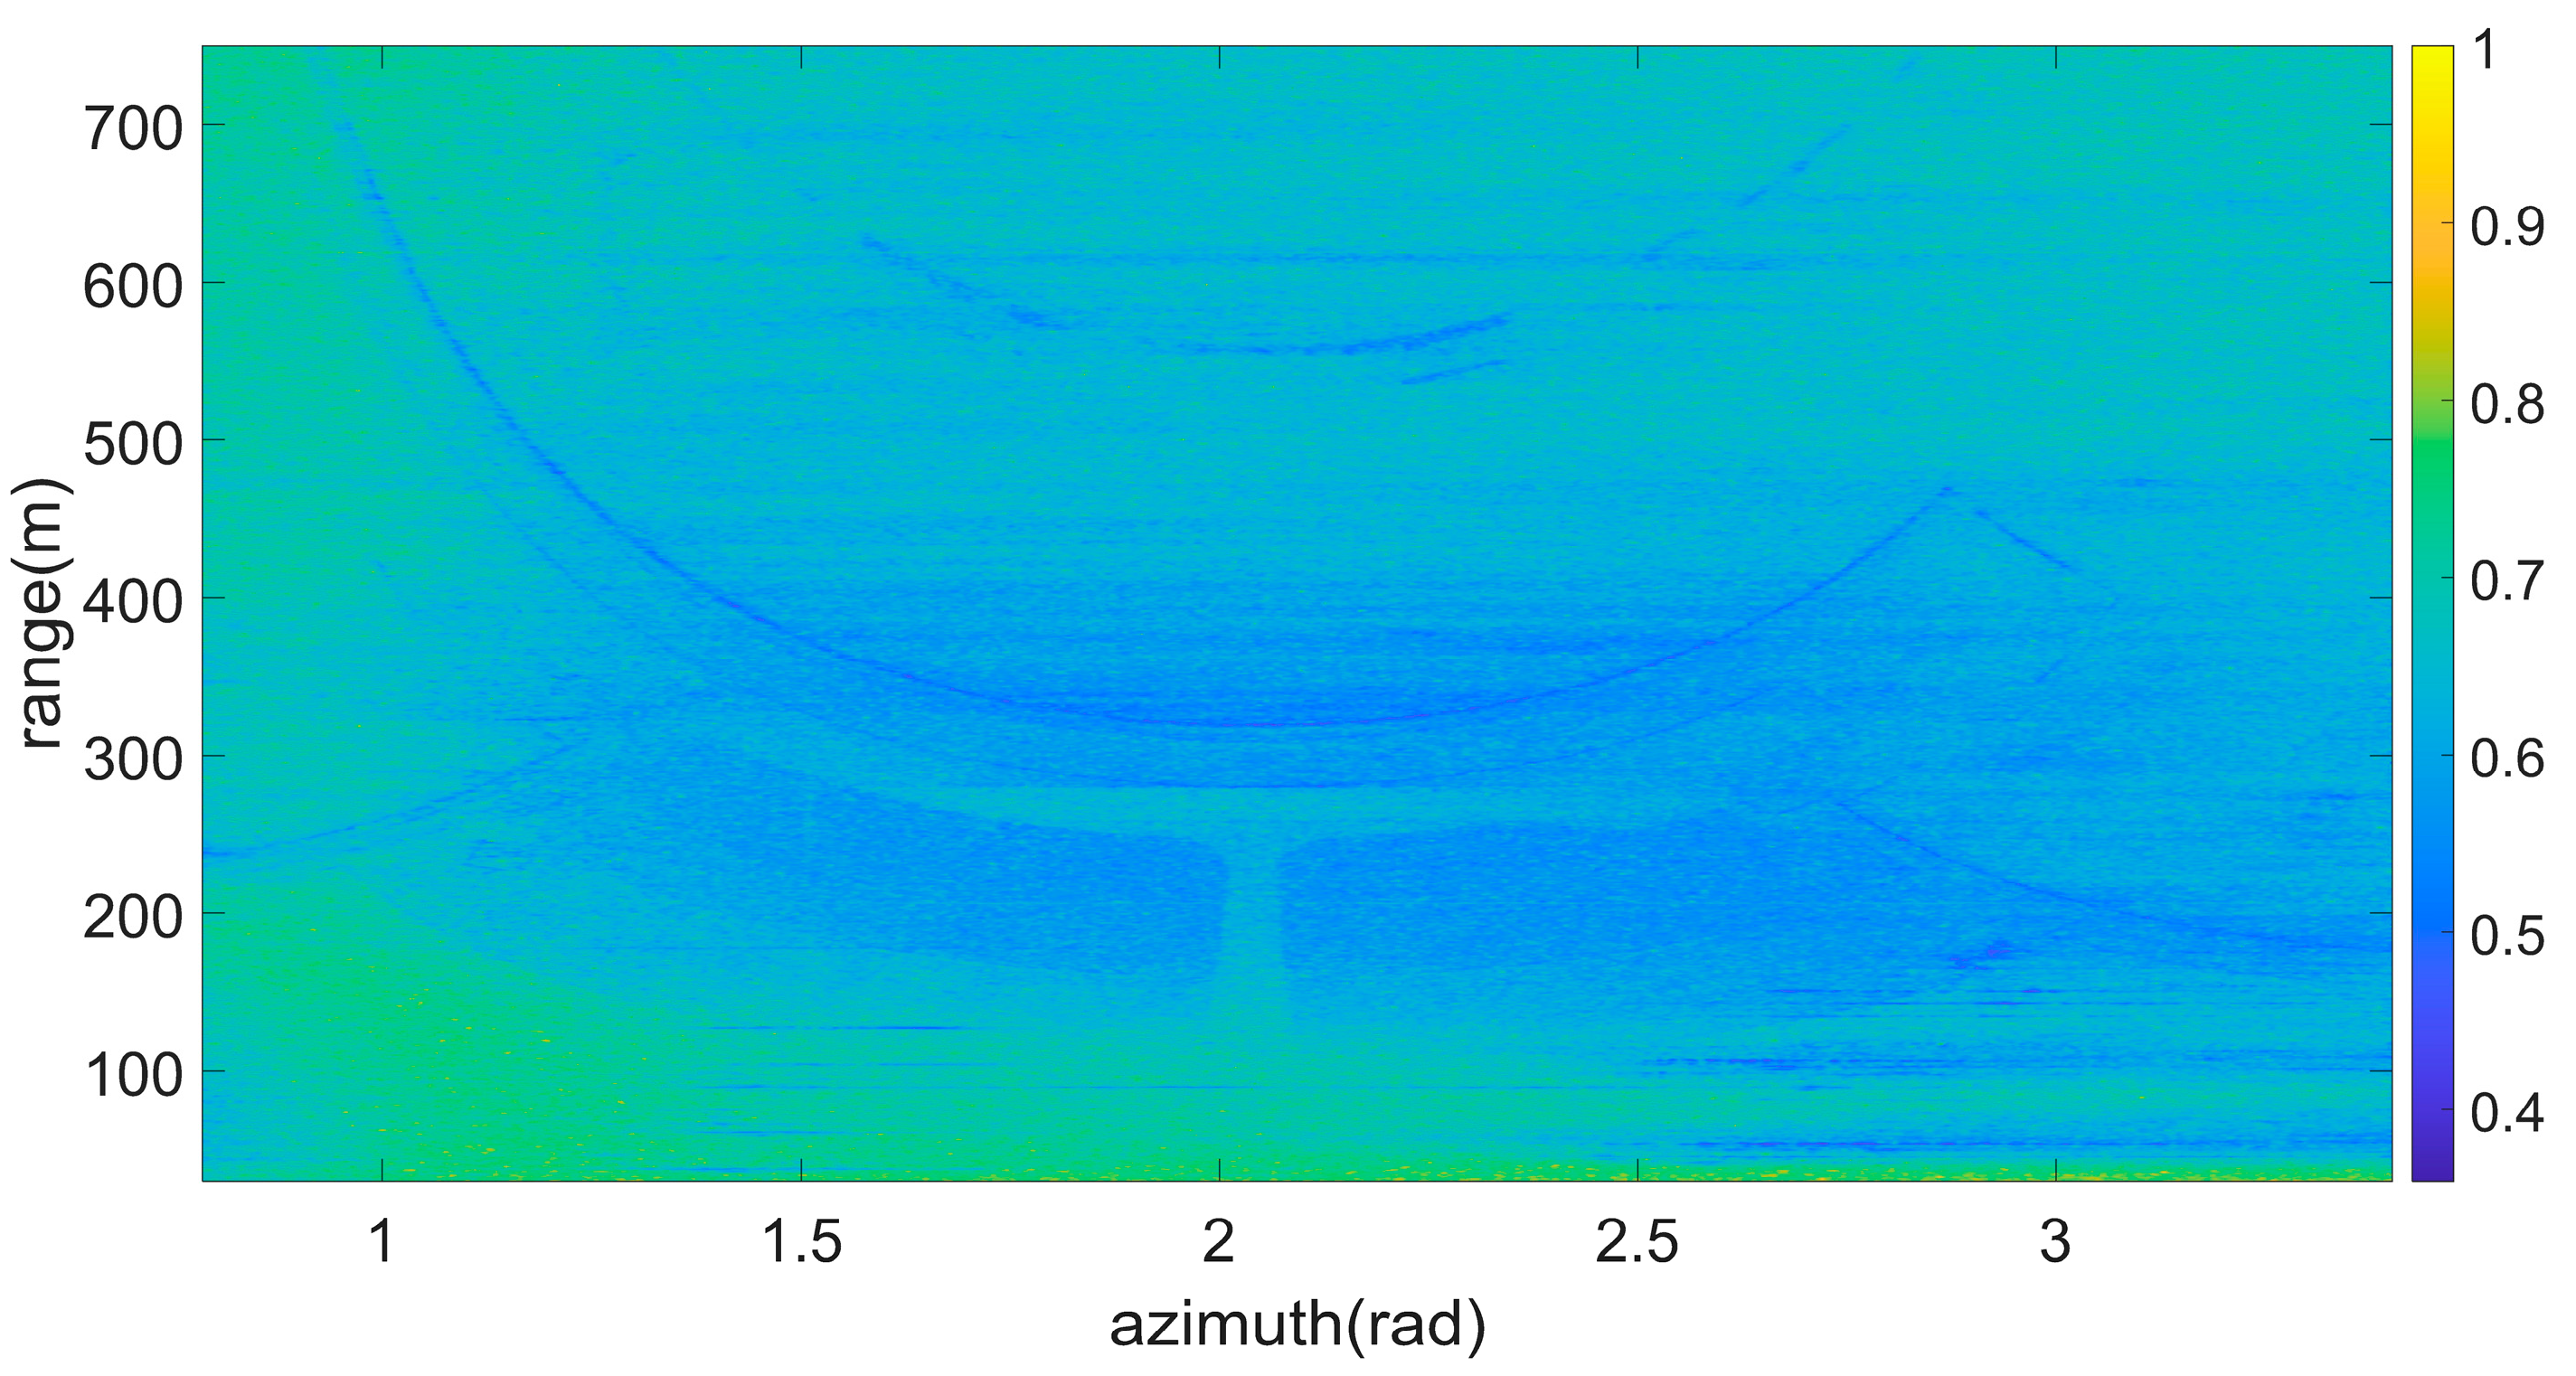
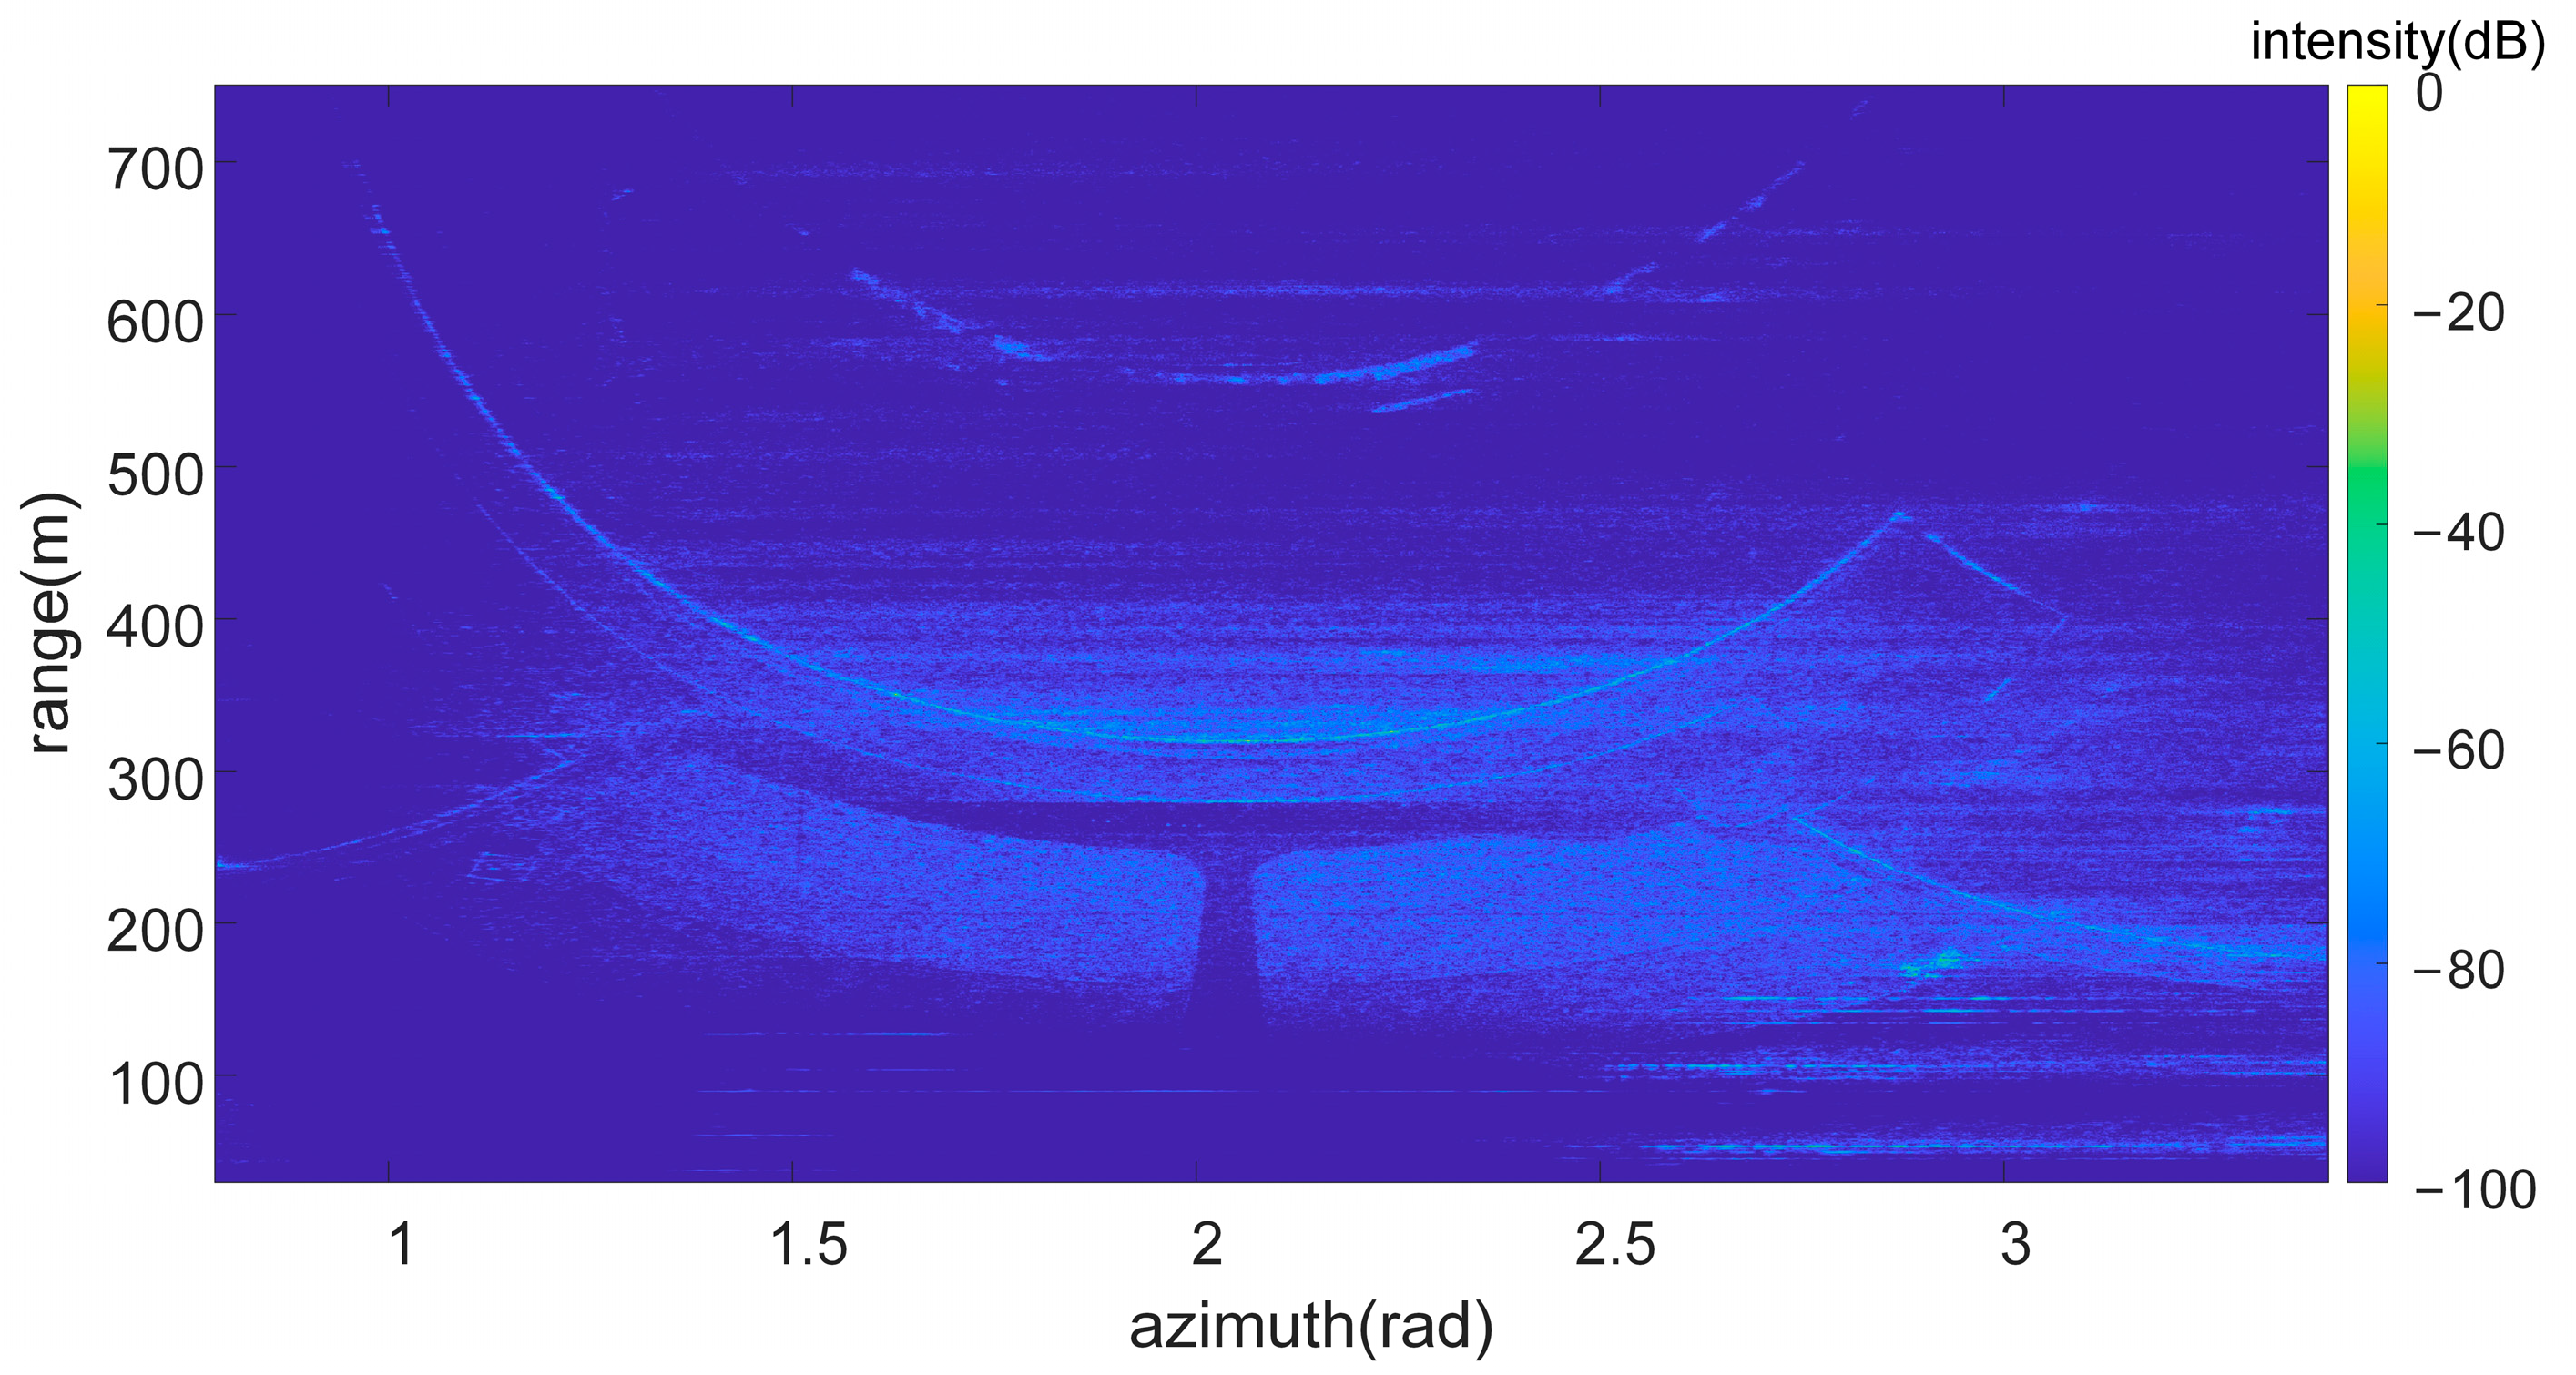
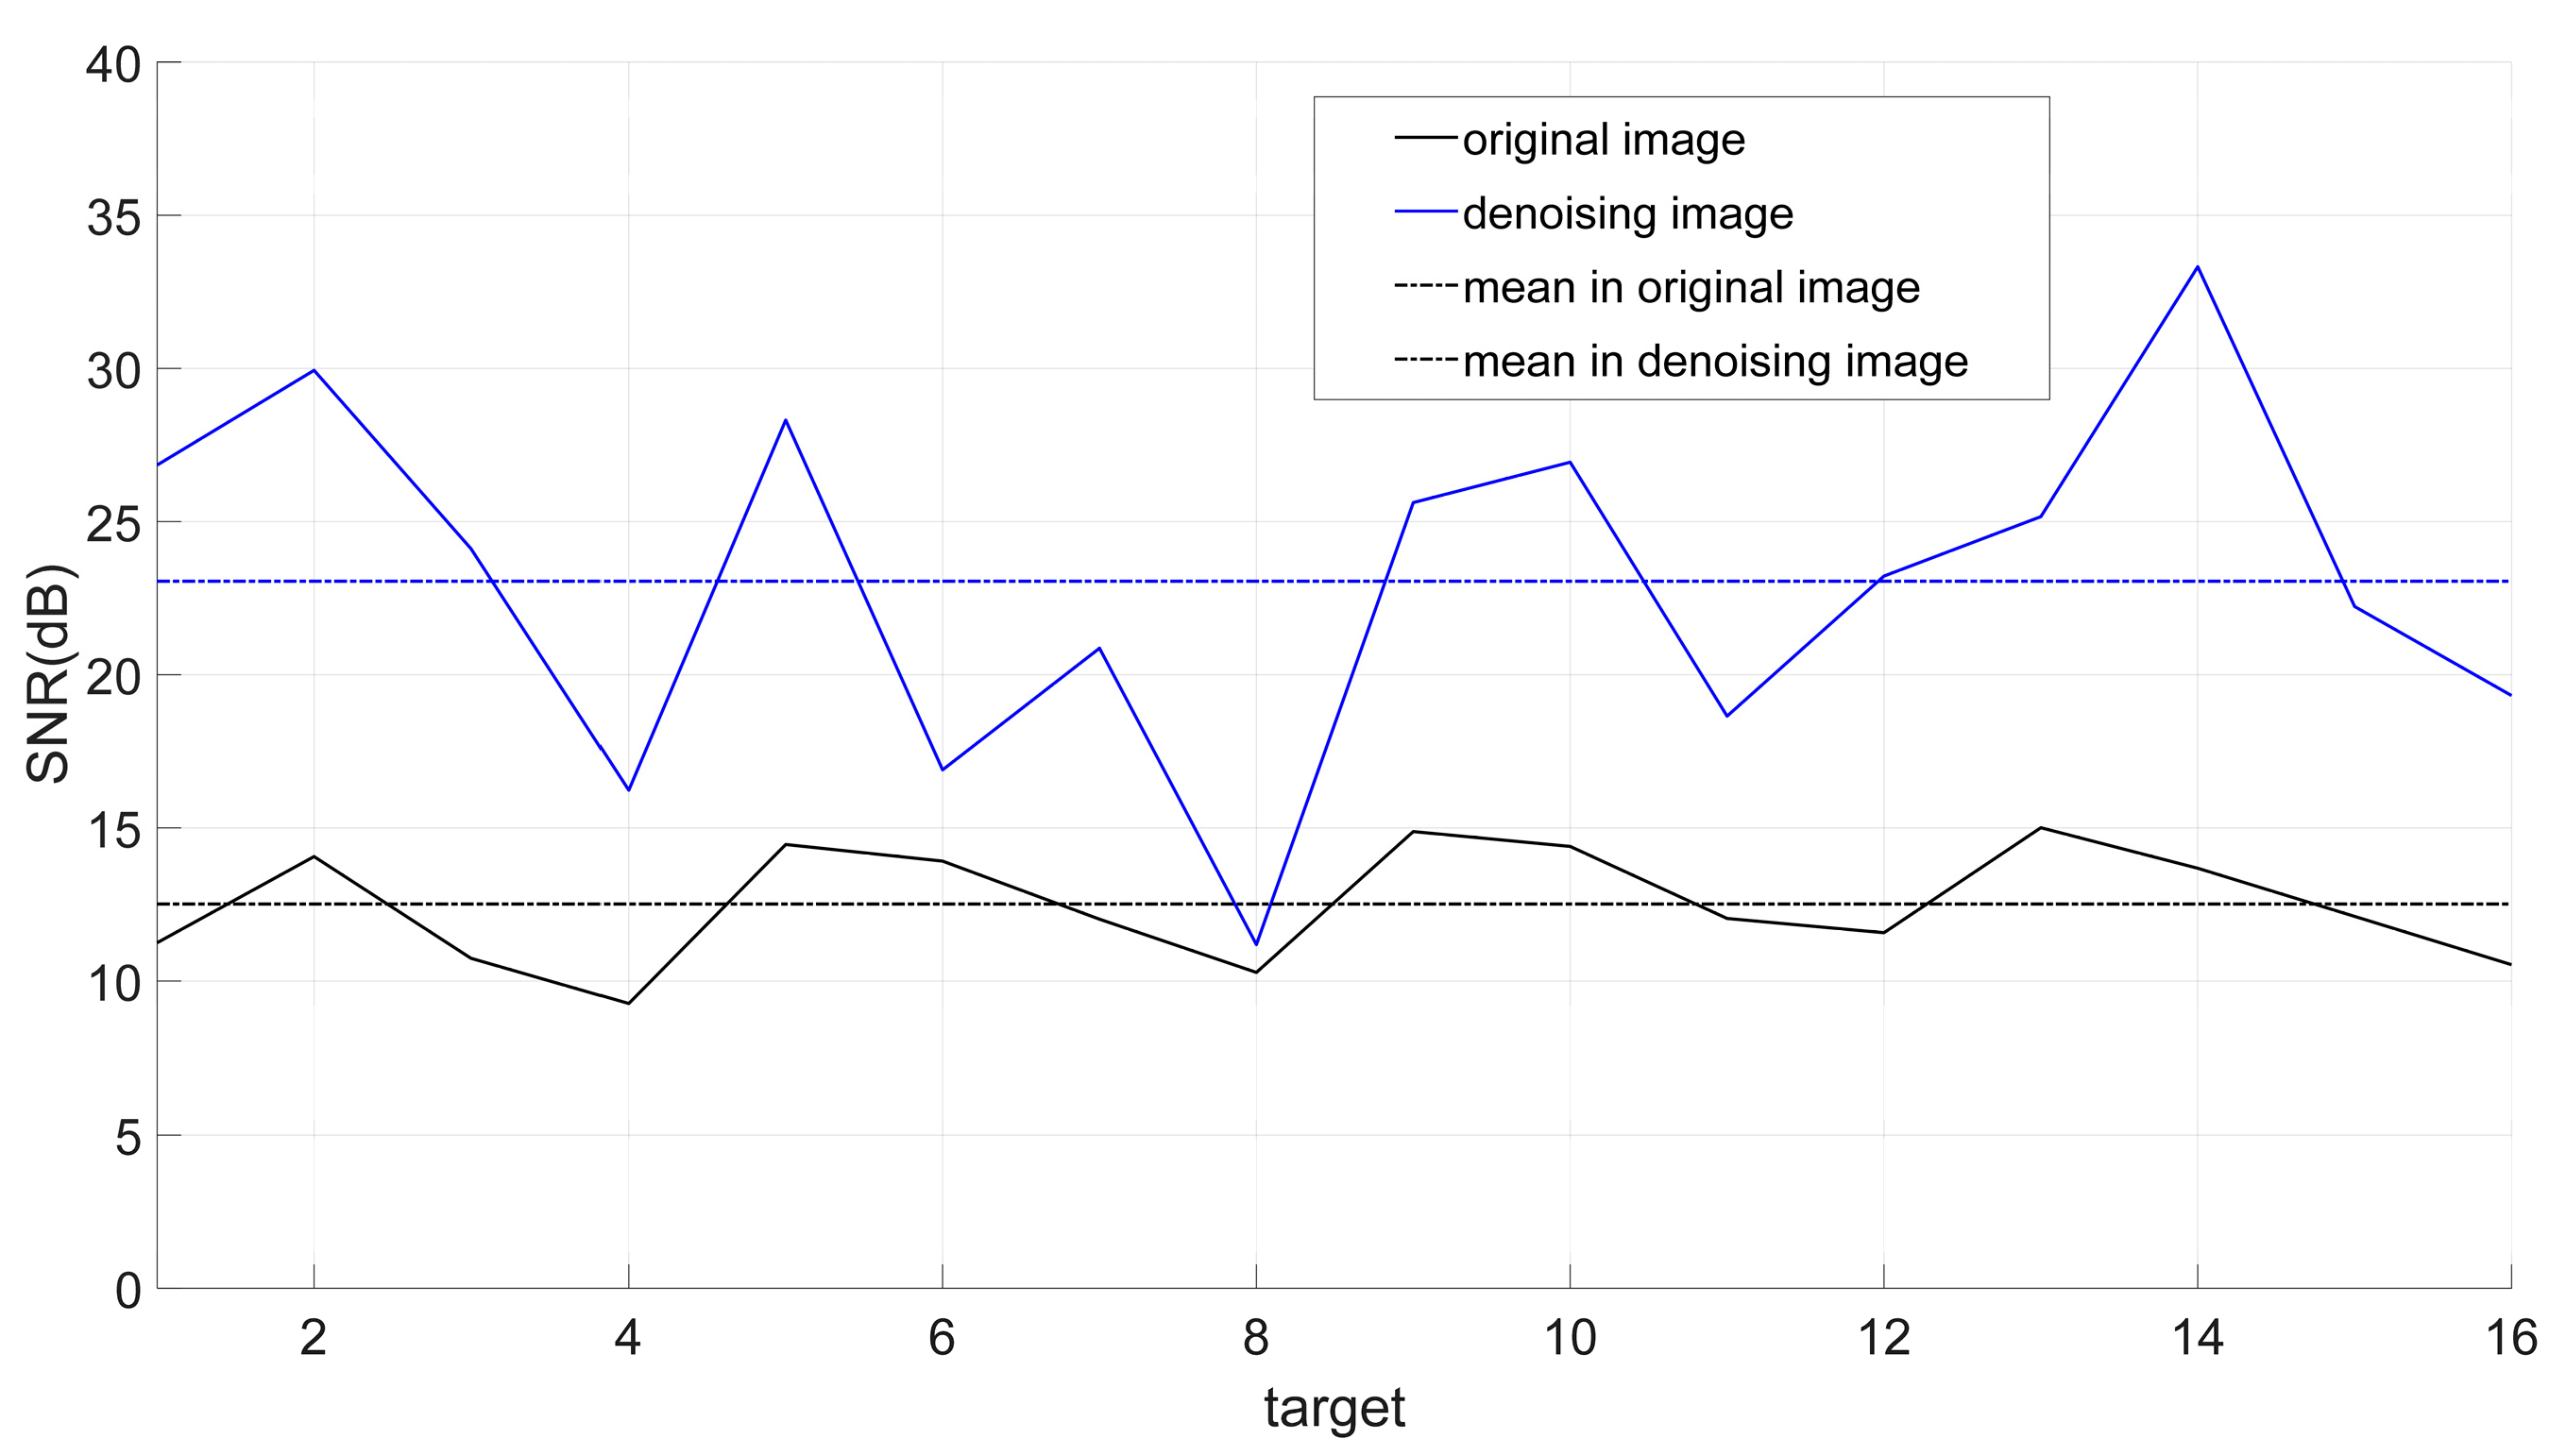
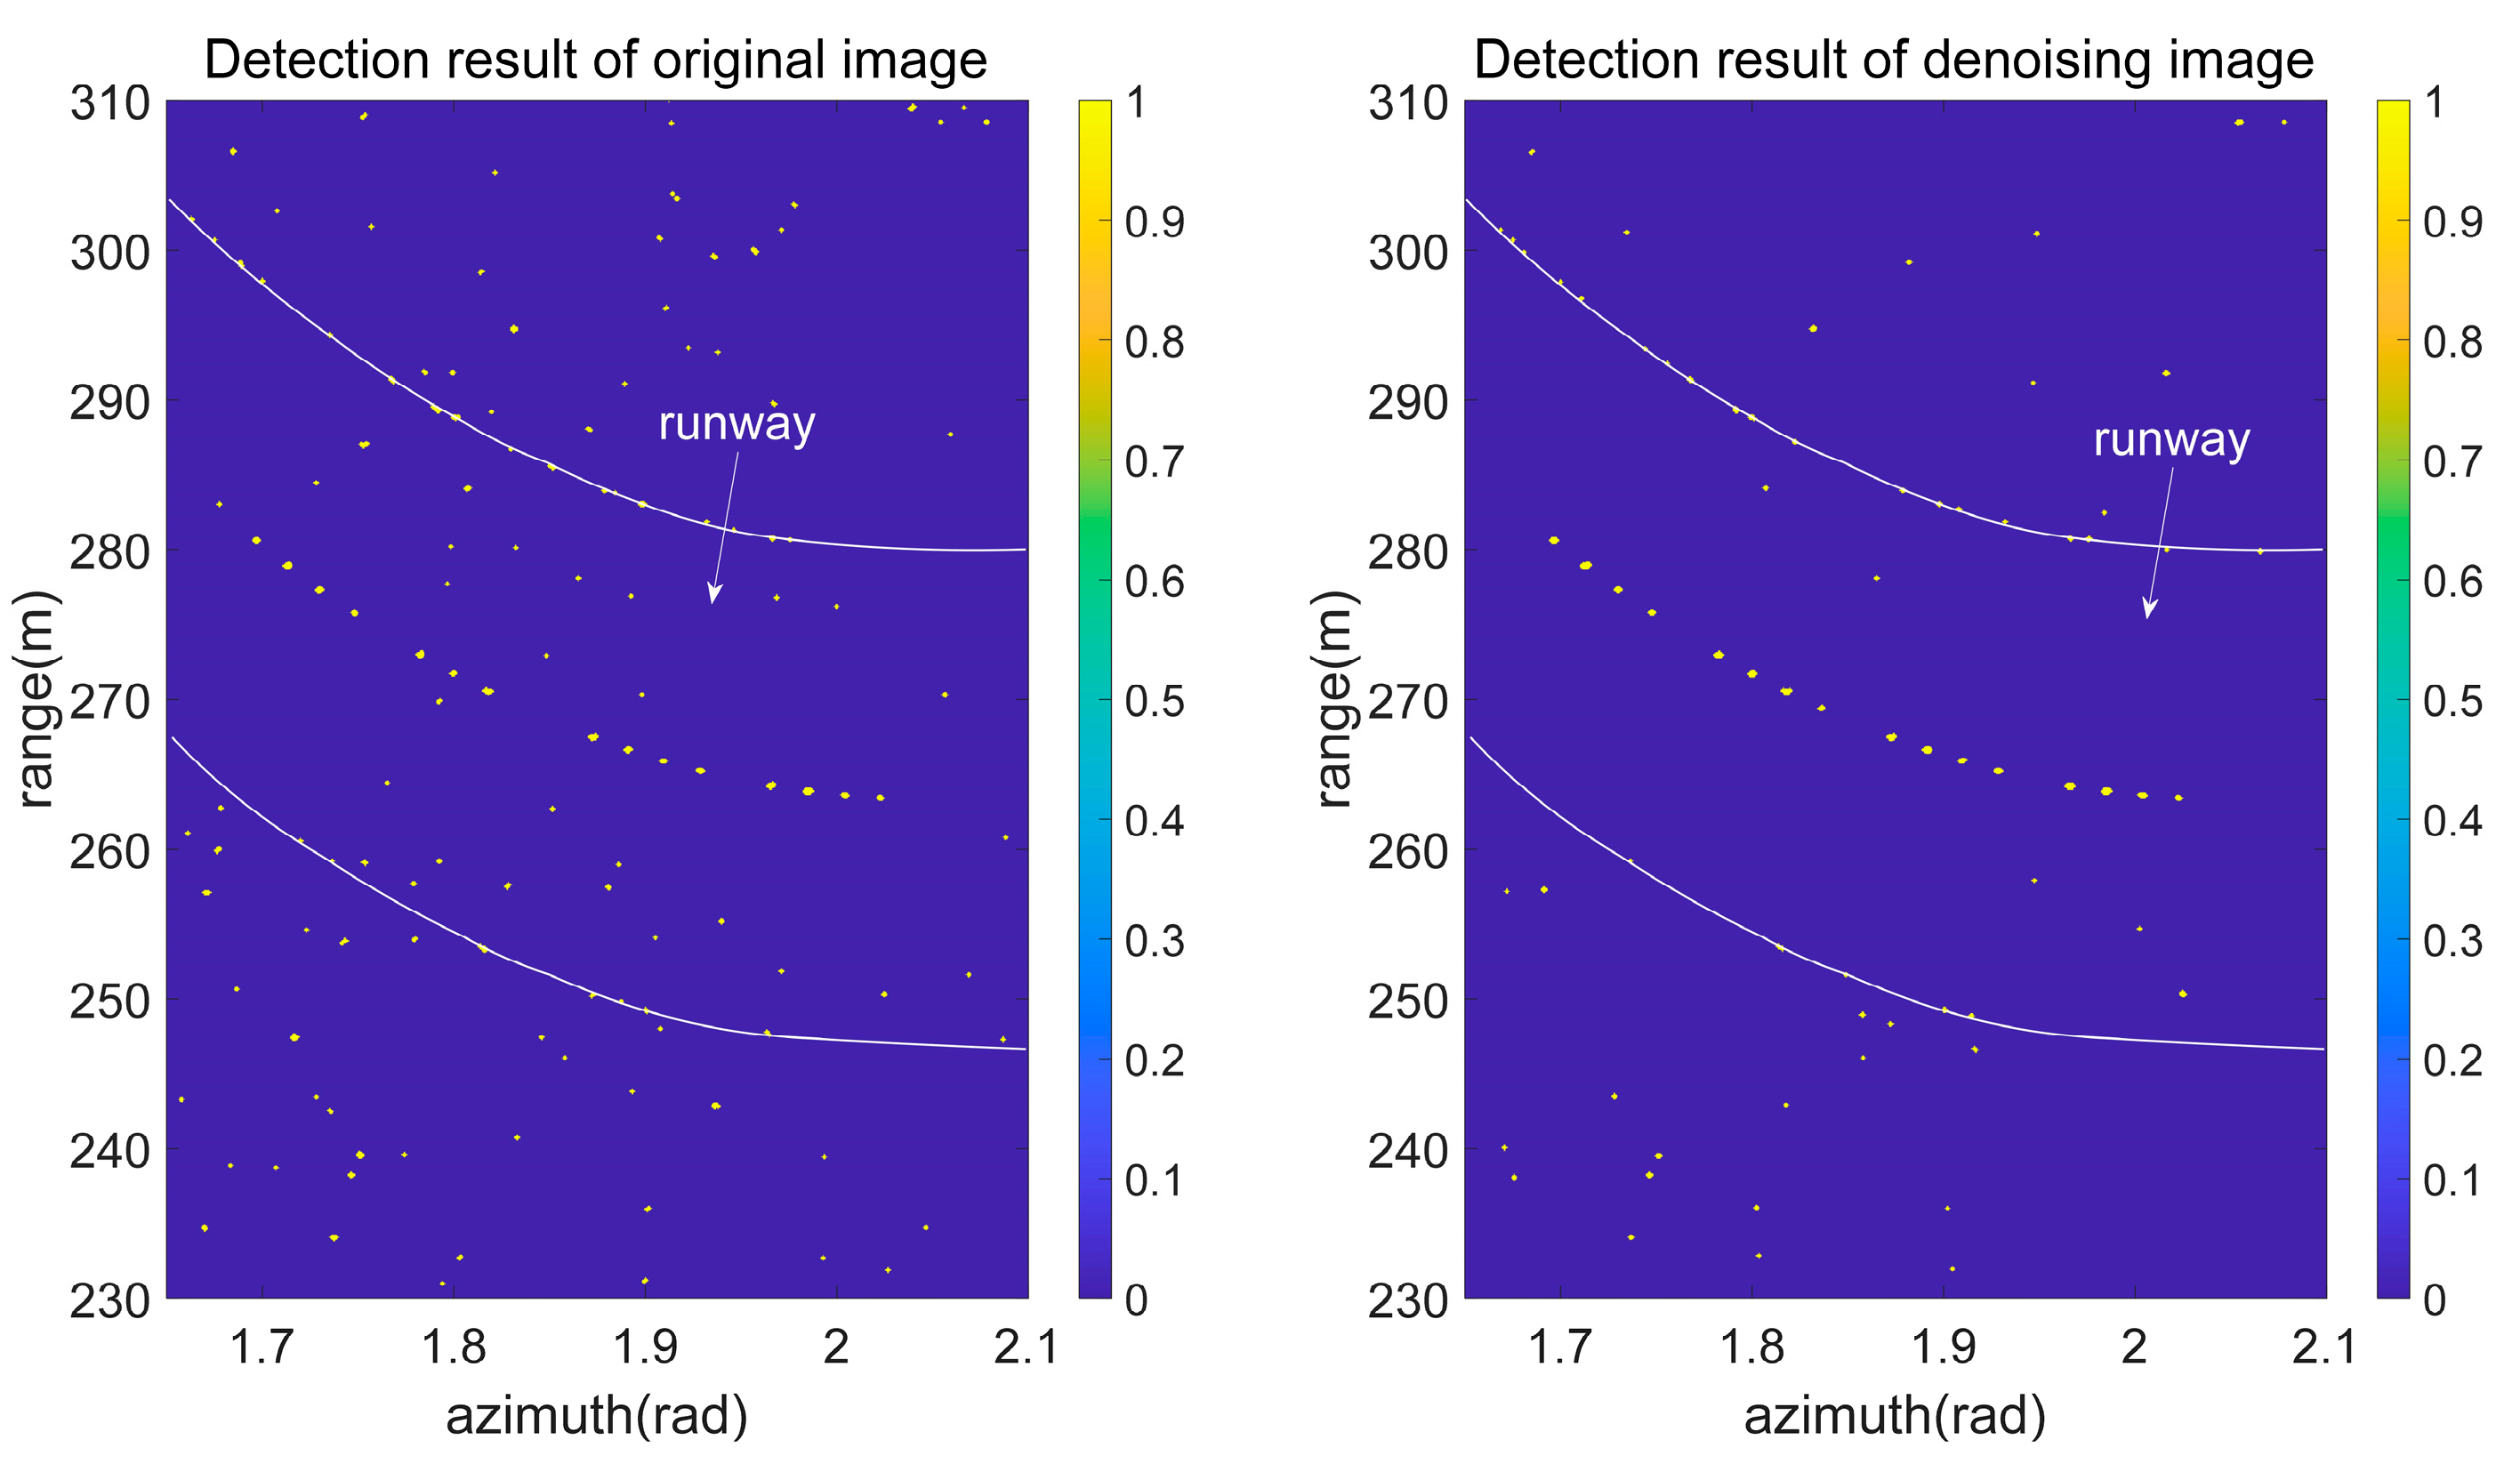
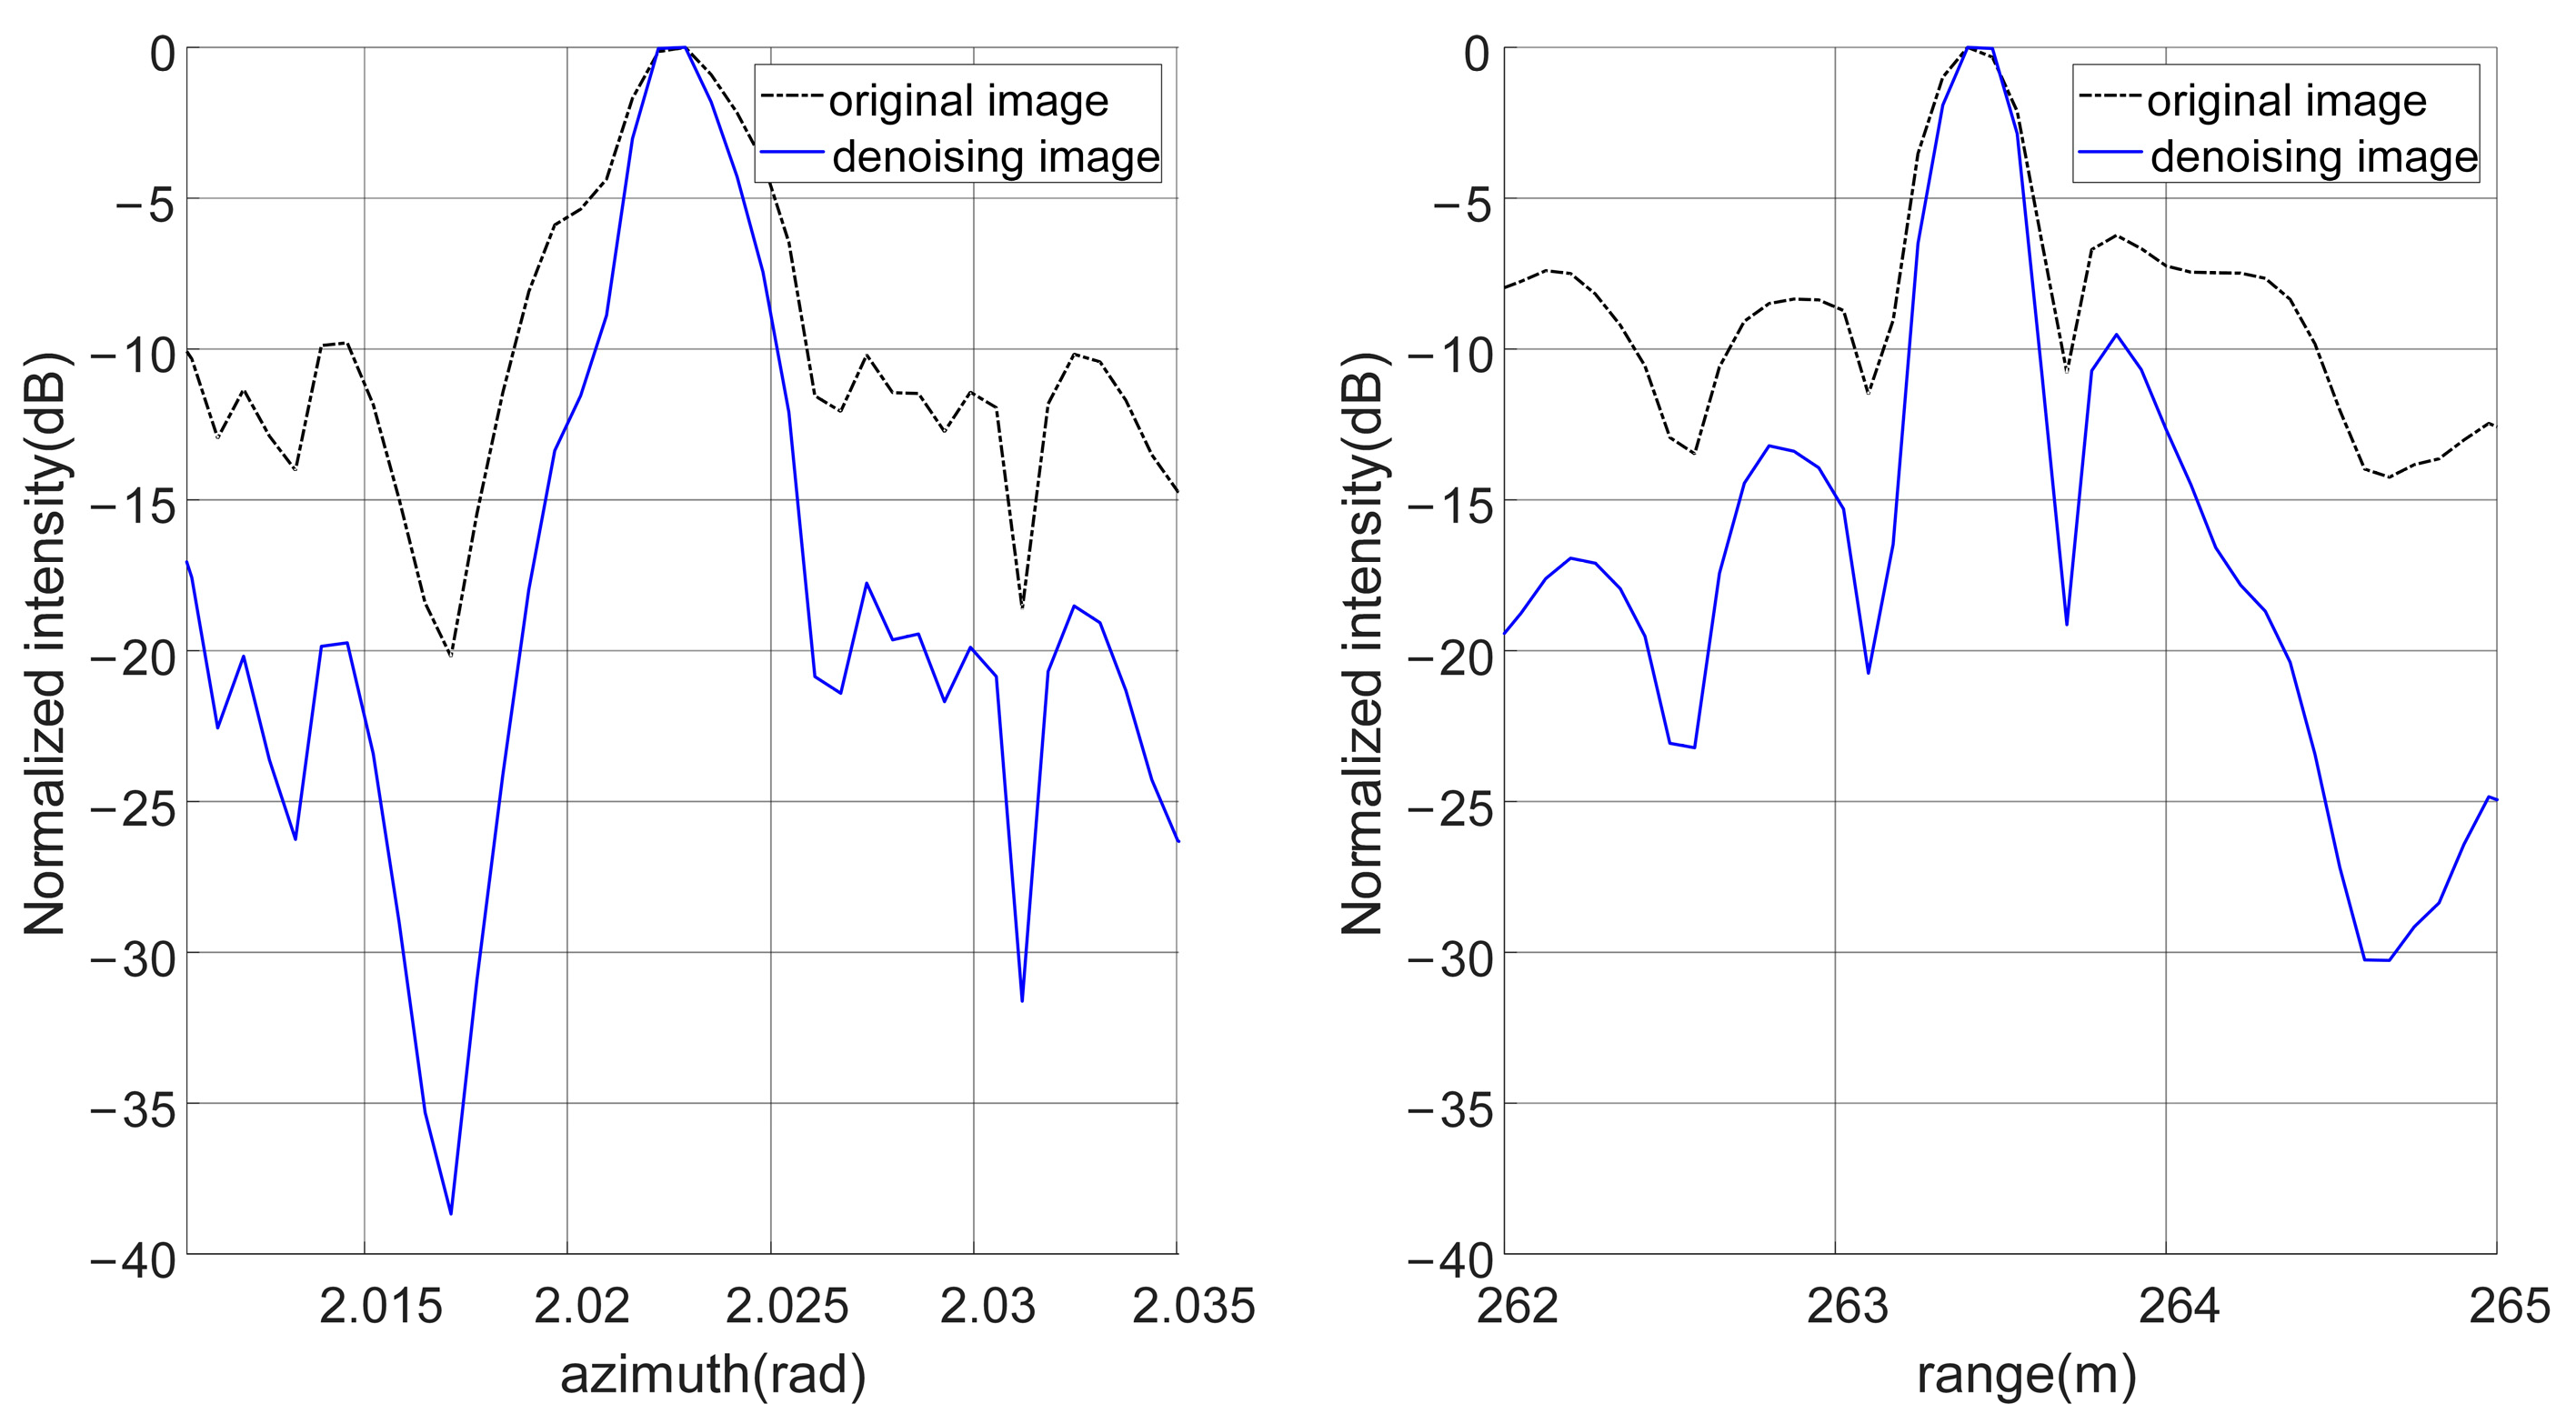
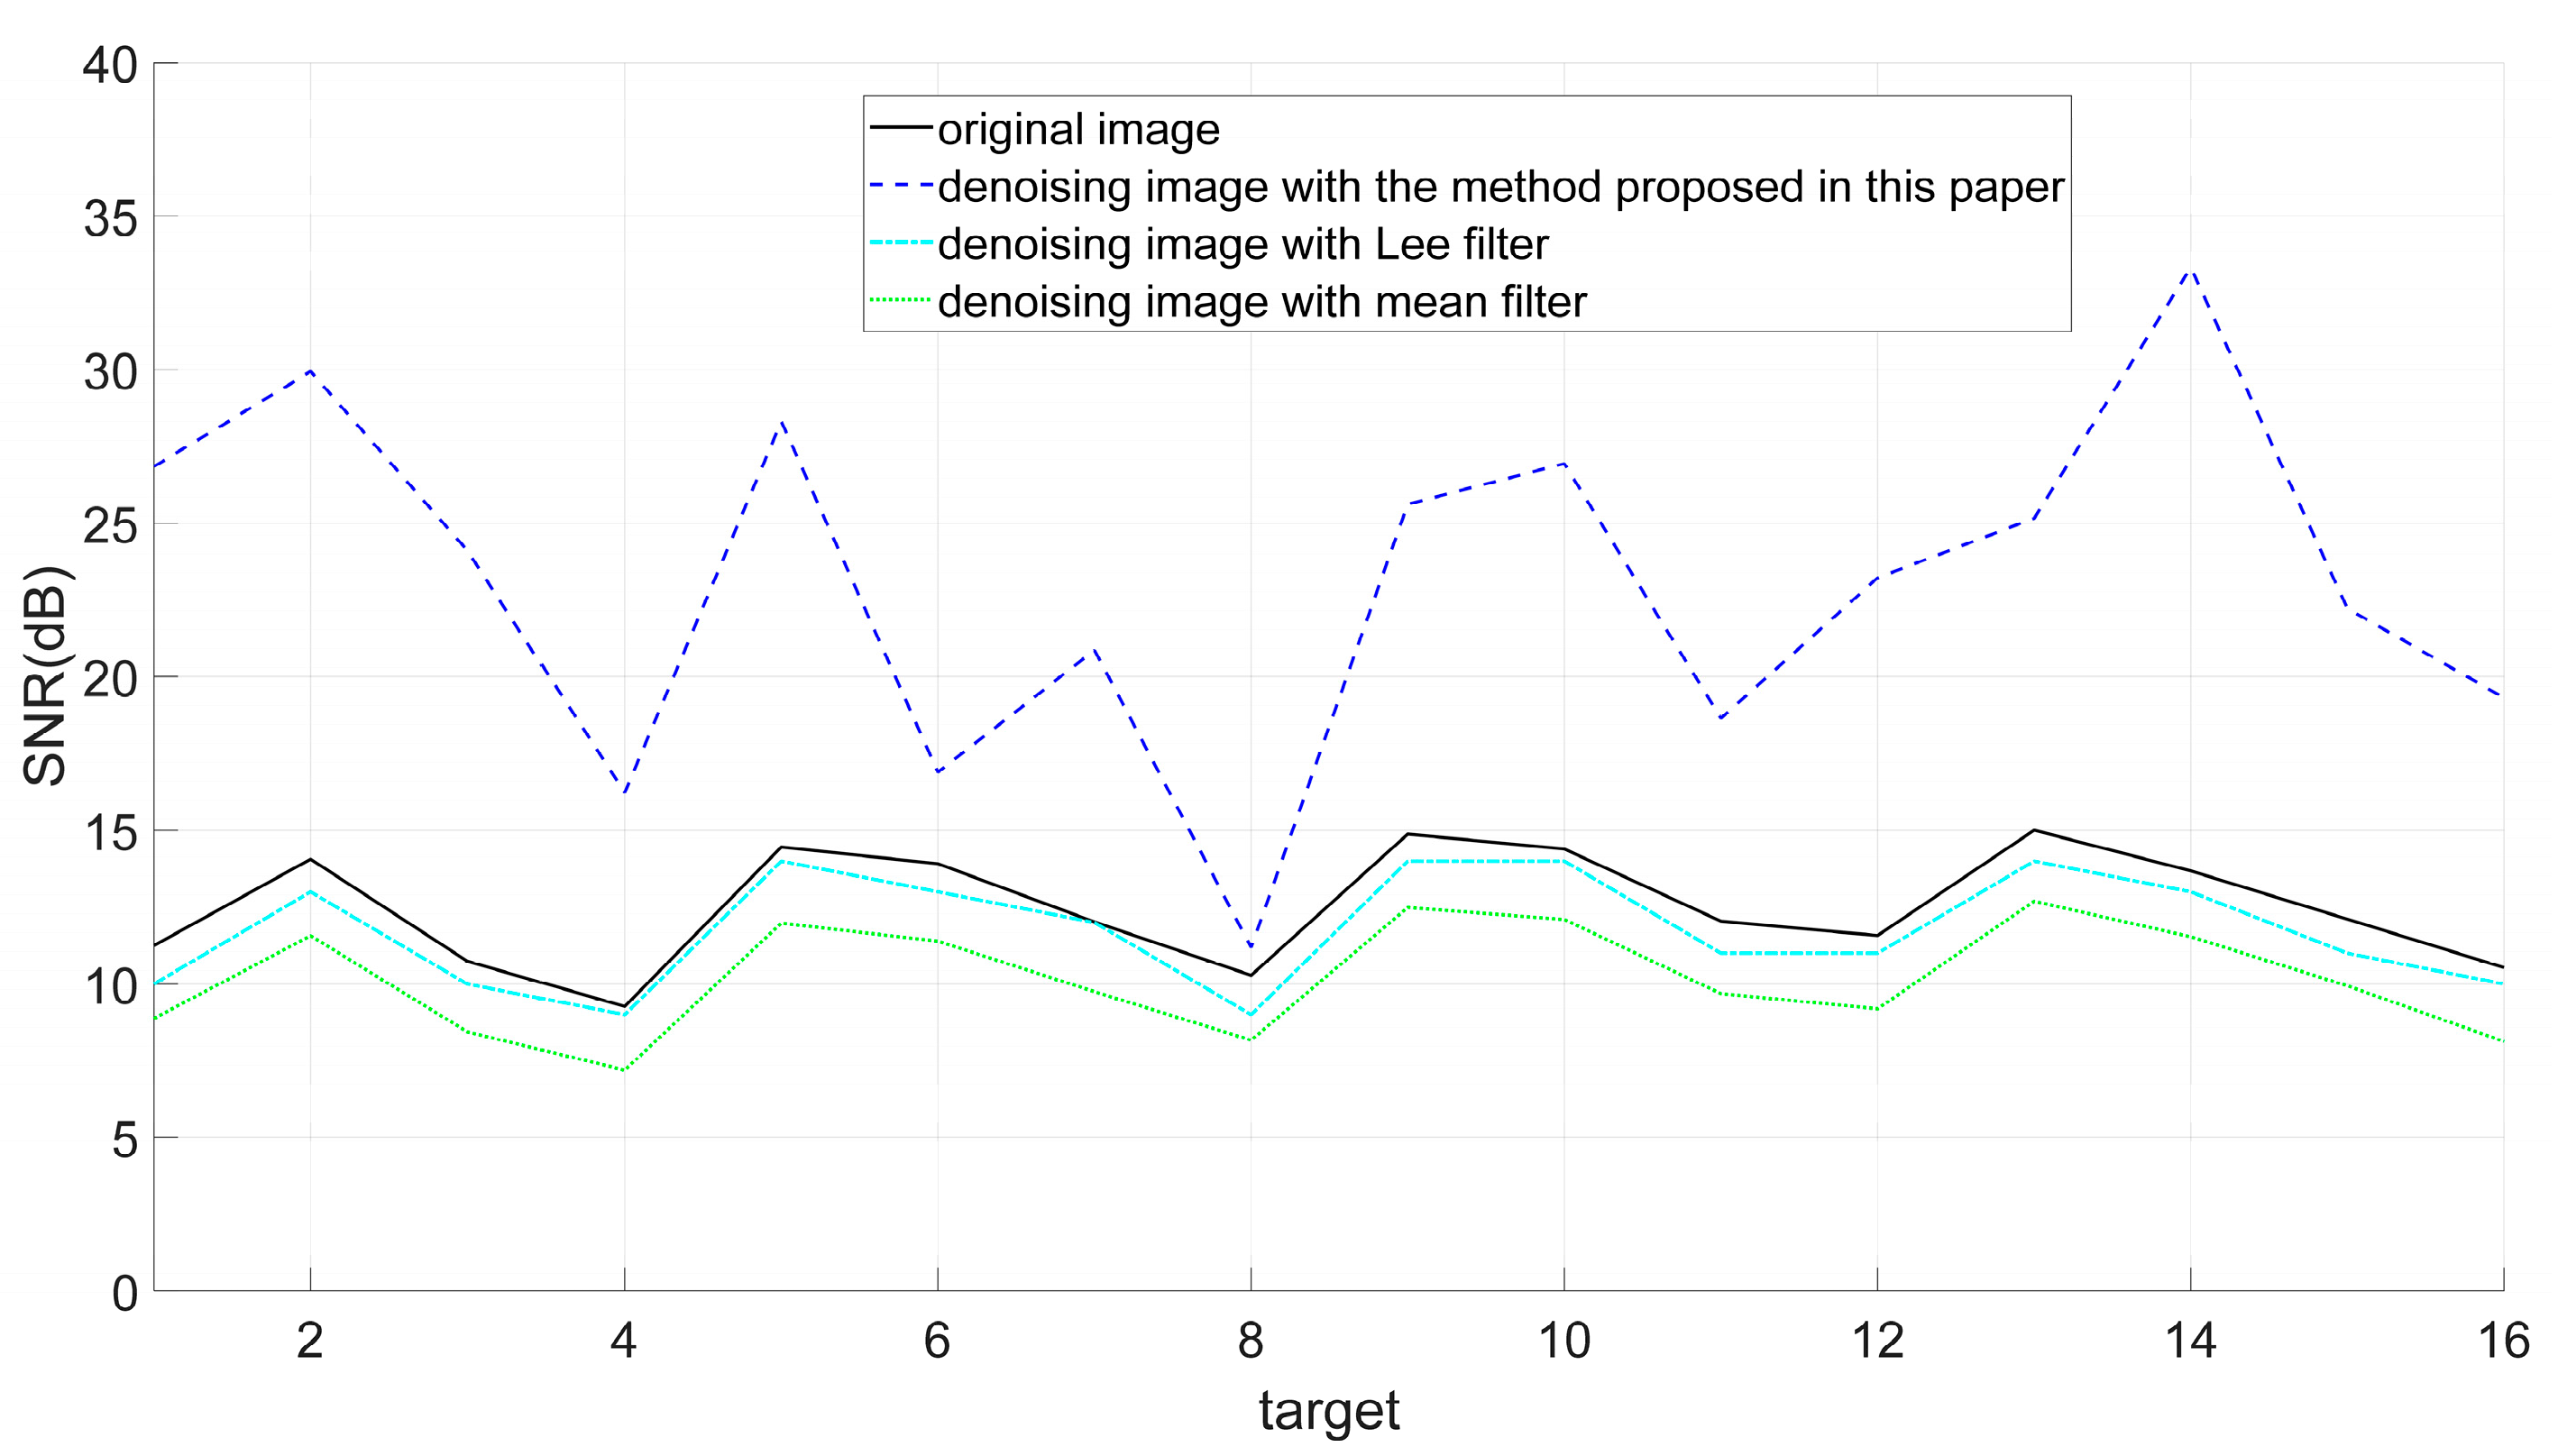
3.2. Result of Denoising

Figure 6 presents an image of a runway with FOD. For the convenience of subsequent analysis, the image here was subtracted from the maximum value. Figure 7 provides an image of the transformation parameter, in which the azimuth size and range size of the morphological structure element are both 10 pixels. During the calculation of the transformation parameter, to prevent the occurrence of infinite singular values and better ensure the enhancement of FOD, values less than 0.3 in the transformation parameter are set to 0.3. The overall runway area value is large, which means that the follow-up processing in this area has a minor enhancement.
In contrast, the fixed target area value, such as the runway edge, is small, and the follow-up processing has better enhancement, which is consistent with the conclusion of the model analysis. Figure 8 shows the image after denoising, in which the dynamic range of the image intensity is effectively expanded. Additionally, the runway area intensity is effectively suppressed and the target is visible.
To accurately analyze the change in the FOD SNR before and after denoising, 16 targets are used for analysis, as shown in Figure 9. Both strong and weak FOD are included. Figure 10 provides all the FOD SNR before and after denoising. The mean of the FOD SNR in the original image is 12.5 dB, and the mean value of the FOD SNR in the denoising image is 23.1 dB. At the same time, the SNR of each FOD target is improved after denoising. The SNR directly affects the detection performance. This paper uses the detection algorithm in the literature [13] to detect the image before and after denoising, and the results are provided in Figure 11. Under the condition that the constant false alarm rate (CFAR) and morphological filtering parameters are consistent, the runway area false alarms are lower after using this algorithm.
Figure 12 shows the change in azimuth and range profile for target 1 before and after denoising. The target edge is preserved well, the azimuth resolution and range resolution are improved, and the target does not diffuse. Figure 13 presents the FOD SNR in the denoising images with different methods, where the mean filter window is five pixels. The effects of the Lee filter and mean filter are not good. The reason for this is that the FOD appear as small targets in the image and are weakened during the filtering process. The method proposed in this paper is feasible and practical, and the image noise is effectively suppressed.

4. Discussion

4.1. Statistical Characteristics of Runway Image after Denoising

Figure 14 presents the intensity probability distribution of the runway image after denoising. Compared with Figure 5, the intensity value of the statistical region decreases, and the distribution interval increases, which is conducive to the separation of the FOD. The effectiveness of denoising is explained based on this.

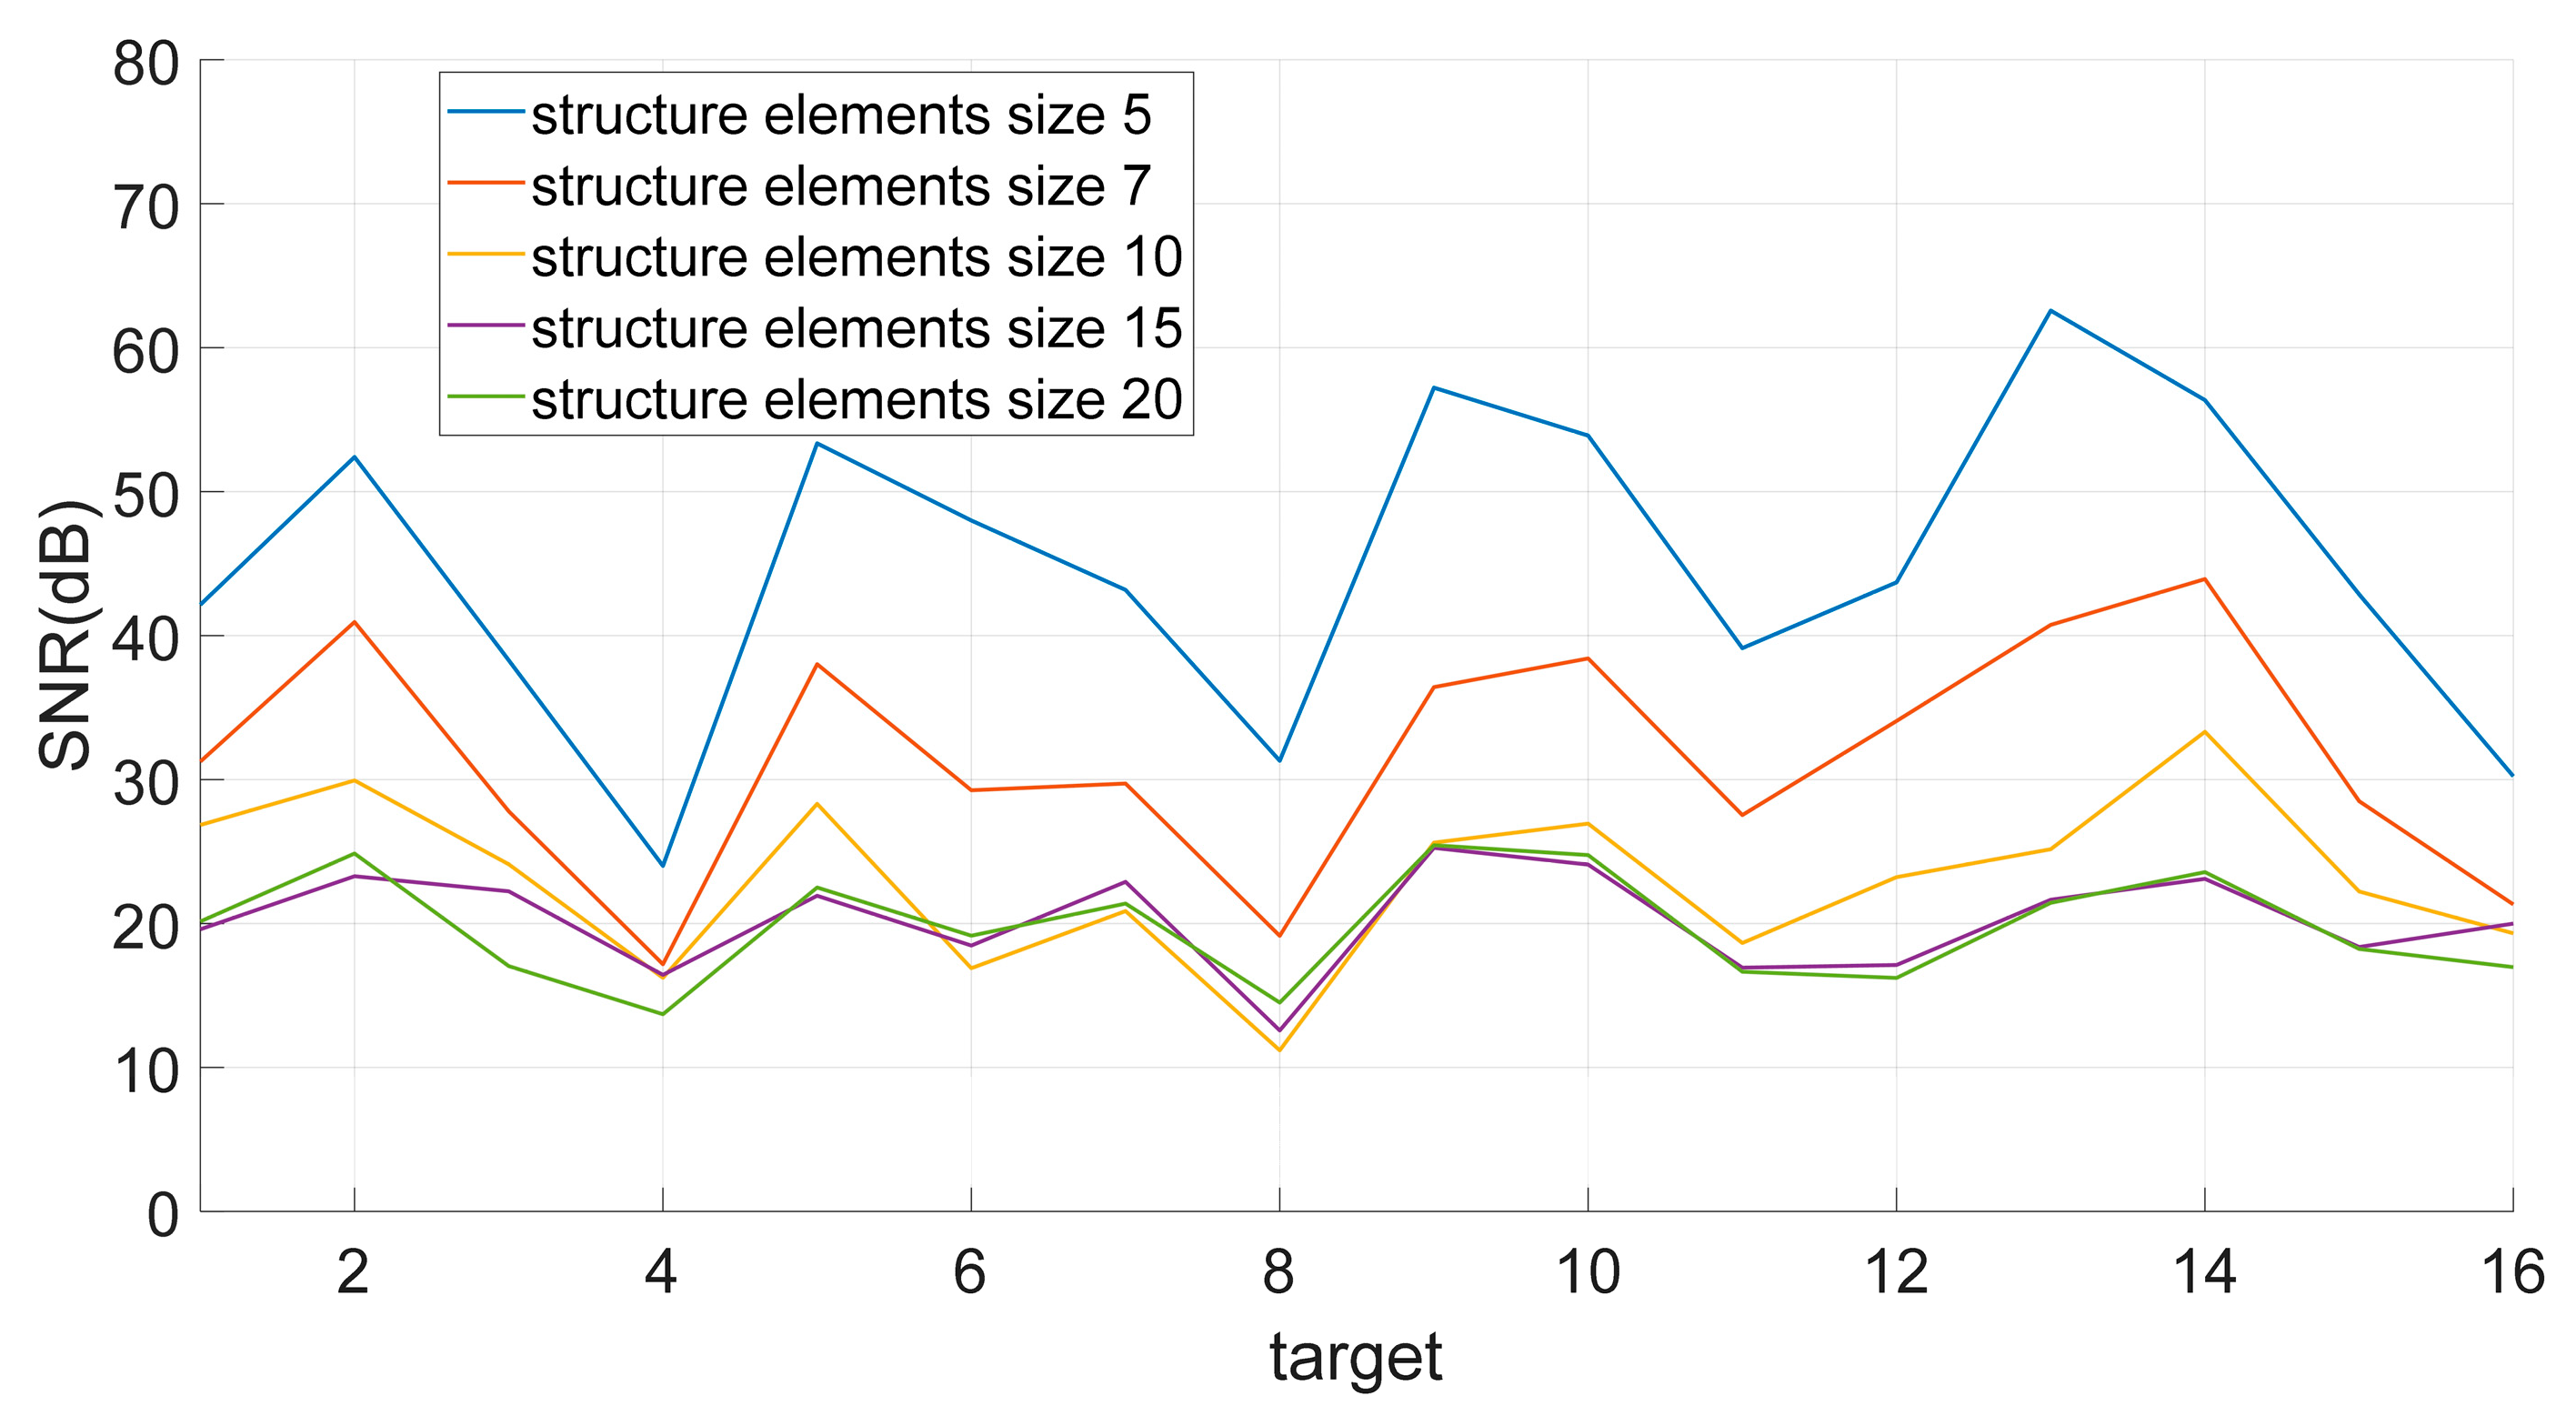
4.2. Effect of Structure Element Size on Denoising Performance

The FOD SNRs after denoising with different structure element sizes are provided in Figure 15. The size of the structure elements impacts the denoising effect. The size of the structure element increases from 5 to 20. The larger the structure element, the less noticeable the noise removal effect will be; when it reaches a specific value, the denoising effect will not change. According to the image’s resolution, the FOD occupies about 5 × 5 pixels, so, when the selection of the structure element is generally equivalent to the size of the FOD, the enhancement effect is best.

5. Conclusions

Based on the image model analysis, an image denoising method based on weak scattering is proposed in this paper. This method is as follows: firstly, image pre-processing is introduced, such as logarithmic and normalization; secondly, the transformation parameter is estimated based on morphological erosion; thirdly, edge-preserving filtering is used to optimize the transformation parameter; and, lastly, the image denoising is completed after standard deviation estimation. According to the theoretical and experimental analysis, the method can effectively suppress speckle noise and runway scattering. The discussion part analyzes the influence of this method on runway image intensity and provides the basis for selecting the size of the structure element. In the future, to improve the performance of this method, the spatial variability of the AS-FODR image will be considered. The greater the distance is, the larger the actual area represented by the pixel. Therefore, different structure element sizes or adaptive structure element sizes are required. At the same time, the modification of the edge-preserving filter may also further improve the performance of this algorithm, which is also an essential direction of future research.

Author Contributions

Conceptualization, Y.W., H.H. and Q.S.; methodology, Y.W., H.H., J.W., P.W. and Q.S.; software, Y.W., H.H., J.W., P.W. and Q.S.; validation, Y.W., H.H. and Q.S.; data curation, Y.W.; writing—original draft preparation, Y.W.; writing—review and editing, H.H. and Q.S. All authors have read and agreed to the published version of the manuscript.

Funding

This research was funded by the Natural Science Foundation of Hunan Province, China (No. 2021JJ40358). Natural Science Foundation of China (No. 62071499). Key Areas of R&D Projects in Guangdong Province (No. 2019B111101001).

Data Availability Statement

Not applicable.

Conflicts of Interest

The authors declare no conflict of interest.

References

  1. Marandi, S.M.; Rahmani, K.; Tajdari, M. Foreign object damage on the leading edge of gas turbine blades. Aerosp. Sci. Technol. 2014, 33, 65–75. [Google Scholar] [CrossRef]
  2. ICAO. Proposals for amendment to pans-aerodromes (DOC 9981). In Proceedings of the Third Meeting of the Aerodromes Operations and Planning-Working Group (AOP/WG/3), Bangkok, Thailand, 24–26 June 2019; Available online: https://www.icao.int/APAC/Meetings/Pages/2019-AOP-SG3-GRF-Seminar.aspx (accessed on 20 October 2021).
  3. Patterson, J. Foreign Object Debris (FOD) Detection Research. Int. Airpt. Rev. 2008, 11, 22–26. [Google Scholar]
  4. Lazar, P.; Herricks, E.E. Procedures for FOD Detection System Performance Assessments: Electro-Optical FOD Detection System. In Proceedings of the FAA Worldwide Airport Technology Transfer Conference, Atlantic City, NJ, USA, 20–22 April 2010. [Google Scholar]
  5. Herricks, E.E.; Woodworth, E.; Patterson, J., Jr. Performance Assessment of a Hybrid Radar and Electro-Optical Foreign Object Debris Detection System; DOT/FAA/TC-12/22; U.S. Department of Transportation Federal Aviation Administration: Washington, DC, USA, 2012; pp. 1–46. Available online: https://www.tc.faa.gov/its/worldpac/techrpt/tc12-22.pdf (accessed on 20 October 2021).
  6. Leonard, T.; Lamont-Smith, T.; Hodges, R.; Beasley, P. 94-GHz Tarsier radar measurements of wind waves and small targets. In Proceedings of the 8th European Radar Conference, EuRAD, Manchester, UK, 12–14 October 2011; IEEE: Piscataway, NJ, USA; pp. 73–76. Available online: https://ieeexplore.ieee.org/document/6100969 (accessed on 20 October 2021).
  7. Xsight Systems. FODetect Installation Manual. 2021. Available online: www.xsightsys.com (accessed on 20 October 2021).
  8. Tang, T.; Kuang, G. SAR Image Reconstruction of Vehicle Targets Based on Tensor Decomposition. Electronics 2022, 11, 2859. [Google Scholar] [CrossRef]
  9. Ma, B.; Yang, H.; Yang, J. Ship Detection in Spaceborne SAR Images under Radio Interference Environment Based on CFAR. Electronics 2022, 11, 4135. [Google Scholar] [CrossRef]
  10. Luo, Y.; Song, H.; Wang, R.; Deng, Y.; Zhao, F.; Xu, Z. Arc FMCW SAR and Applications in Ground Monitoring. IEEE Trans. Geosci. Remote Sens. 2014, 52, 5989–5998. [Google Scholar] [CrossRef]
  11. Du, N.C.; Wang, Y.M.; Shen, X.Q.; Xie, X. Correction method of atmospheric phase for arc-scanning synthetic aperture radar in landslide monitoring. Acta Geod. Cartogr. Sin. 2022, 51, 2139–2148. [Google Scholar] [CrossRef]
  12. Miccinesi, L.; Consumi, T.; Beni, A.; Pieraccini, M. W-band MIMO GB-SAR for Bridge Testing/Monitoring. Electronics 2021, 10, 2261. [Google Scholar] [CrossRef]
  13. Wang, Y.; Song, Q.; Wang, J.; Yu, H. Airport Runway Foreign Object Debris Detection System Based on Arc-Scanning SAR Technology. IEEE Trans. Geosci. Remote Sens. 2022, 60, 1–16. [Google Scholar] [CrossRef]
  14. Wang, Y.; Song, Q.; Wang, J.; Du, B.; Wang, P. A Correction Method to Systematic Phase Drift of a High Resolution Radar for Foreign Object Debris Detection. Remote Sens. 2022, 14, 1787. [Google Scholar] [CrossRef]
  15. Wang, W.; Wang, Z.; Yuan, Z.; Li, M. A fast and adaptive method for complex-valued SAR image denoising based on l k norm regularization. Sci. China Inf. Sci. 2009, 52, 138–148. [Google Scholar] [CrossRef]
  16. Lee, J.-S. Digital Image Enhancement and Noise Filtering by Use of Local Statistics. IEEE Trans. Pattern Anal. Mach. Intell. 1980, 2, 165–168. [Google Scholar] [CrossRef] [Green Version]
  17. Kuan, D.; Sawchuk, A.; Strand, T.; Chavel, P. Adaptive restoration of images with speckle. IEEE Trans. Acoust. Speech Signal Process. 1987, 35, 373–383. [Google Scholar] [CrossRef]
  18. Frost, V.S.; Stiles, J.A.; Shanmugan, K.S.; Holtzman, J.C. A Model for Radar Images and Its Application to Adaptive Digital Filtering of Multiplicative Noise. IEEE Trans. Pattern Anal. Mach. Intell. 1982, 2, 157–166. [Google Scholar] [CrossRef]
  19. Liu, S.; Hu, Q.; Li, P.; Zhao, J.; Zhu, Z. SAR image denoising based on patch ordering in nonsubsample shearlet domain. Turk. J. Electr. Eng. Comput. Sci. 2018, 26, 1860–1870. [Google Scholar] [CrossRef]
  20. Nandhini, G.; Saraswathy, C. Speckle suppression of SAR image based on curvelet and dual tree complex wavelet transform. In Proceedings of the 2013 International Conference on Information Communication and Embedded Systems (ICICES), Chennai, India, 21–22 February 2013; pp. 650–654. [Google Scholar] [CrossRef]
  21. Zhao, W.; Deledalle, C.-A.; Denis, L.; Maitre, H.; Nicolas, J.-M.; Tupin, F. Ratio-Based Multitemporal SAR Images Denoising: RABASAR. IEEE Trans. Geosci. Remote Sens. 2019, 57, 3552–3565. [Google Scholar] [CrossRef] [Green Version]
  22. Rudin, L.I.; Osher, S.; Fatemi, E. Nonlinear total variation based noise removal algorithms. Phys. D Nonlinear Phenom. 1992, 60, 259–268. [Google Scholar] [CrossRef]
  23. Wan, Y.; Liang, X.; Bu, X.; Liu, Y. FOD Detection Method Based on Iterative Adaptive Approach for Millimeter-Wave Radar. Sensors 2021, 21, 1241. [Google Scholar] [CrossRef]
  24. Yang, X.; Huo, K.; Zhang, X.; Jiang, W.; Chen, Y. A Clutter-Analysis-Based STAP for Moving FOD Detection on Runways. Sensors 2019, 19, 549. [Google Scholar] [CrossRef] [Green Version]
  25. Feil, P.; Menzel, W.; Nguyen, T.P.; Pichot, C.; Migliaccio, C. Foreign objects debris detection (FOD) on airport runways using a broadband 78 GHz sensor. In Proceedings of the 2008 European Radar Conference, Amsterdam, The Netherlands, 30–31 October 2008; pp. 451–454. [Google Scholar]
  26. Goodman, J.W. Some Fundamental Properties of Speckle. J. Opt. Soc. Am. 1976, 66, 1145–1150. [Google Scholar] [CrossRef]
  27. Wang, G.; Bo, F.; Chen, X.; Lu, W.; Hu, S.; Fang, J. A Collaborative Despeckling Method for SAR Images Based on Texture Classification. Remote Sens. 2022, 14, 1465. [Google Scholar] [CrossRef]
  28. Aghababaei, H.; Ferraioli, G.; Vitale, S.; Zamani, R.; Schirinzi, G.; Pascazio, V. Nonlocal Model-Free Denoising Algorithm for Single- and Multichannel SAR Data. IEEE Trans. Geosci. Remote Sens. 2022, 60, 1–15. [Google Scholar] [CrossRef]
  29. He, K.; Sun, J.; Tang, X. Single Image Haze Removal Using Dark Channel Prior. IEEE Trans. Pattern Anal. Mach. Intell. 2011, 33, 2341–2353. [Google Scholar] [CrossRef] [PubMed]
  30. He, K.; Sun, J.; Tang, X. Guided Image Filtering. IEEE Trans. Pattern Anal. Mach. Intell. 2013, 35, 1397–1409. [Google Scholar] [CrossRef] [PubMed]
Figure 1. The process flow of weak scattering denoising method.
Electronics 12 00984 g001
Figure 2. The AS-FODR system.
Electronics 12 00984 g002
Figure 3. AS-FODR detection diagram in satellite photograph.
Electronics 12 00984 g003
Figure 4. AS-FODR logarithmic image of runway. (A and B are two rectangular areas at different positions on the runway).
Electronics 12 00984 g004
Figure 5. Intensity probability distribution of runway image.
Electronics 12 00984 g005
Figure 6. Image of runway with FOD.
Electronics 12 00984 g006
Figure 7. Image of transformation parameter.
Electronics 12 00984 g007
Figure 8. Image after denoising.
Electronics 12 00984 g008
Figure 9. FOD target in AS-FODR image. (Number 1–16 represents targets in different positions).
Electronics 12 00984 g009
Figure 10. The change in FOD SNR before and after denoising.
Electronics 12 00984 g010
Figure 11. The detection results of images before and after denoising. (The white lines mark the edge of the runway).
Electronics 12 00984 g011
Figure 12. The change in azimuth and range profile for target 1 before and after denoising.
Electronics 12 00984 g012
Figure 13. The FOD SNR in denoising images with different methods.
Electronics 12 00984 g013
Figure 14. Intensity probability distribution of runway image after denoising.
Electronics 12 00984 g014
Figure 15. FOD SNR after denoising with different structure element sizes.
Electronics 12 00984 g015
Disclaimer/Publisher’s Note: The statements, opinions and data contained in all publications are solely those of the individual author(s) and contributor(s) and not of MDPI and/or the editor(s). MDPI and/or the editor(s) disclaim responsibility for any injury to people or property resulting from any ideas, methods, instructions or products referred to in the content.

