4.1. Orthogonal Experiment Design
Changing the parameters of the disturbance structure will directly affect the heat dissipation performance of the mini-channel liquid cooling plate, and the processes of reconstructing the finite element model and conducting numerical simulation will be repeated many times if the parameters are changed one by one. This way may be overly demanding in terms of computation resources and time. In order to improve computational efficiency, the orthogonal test method is used to design the parameter optimization process [
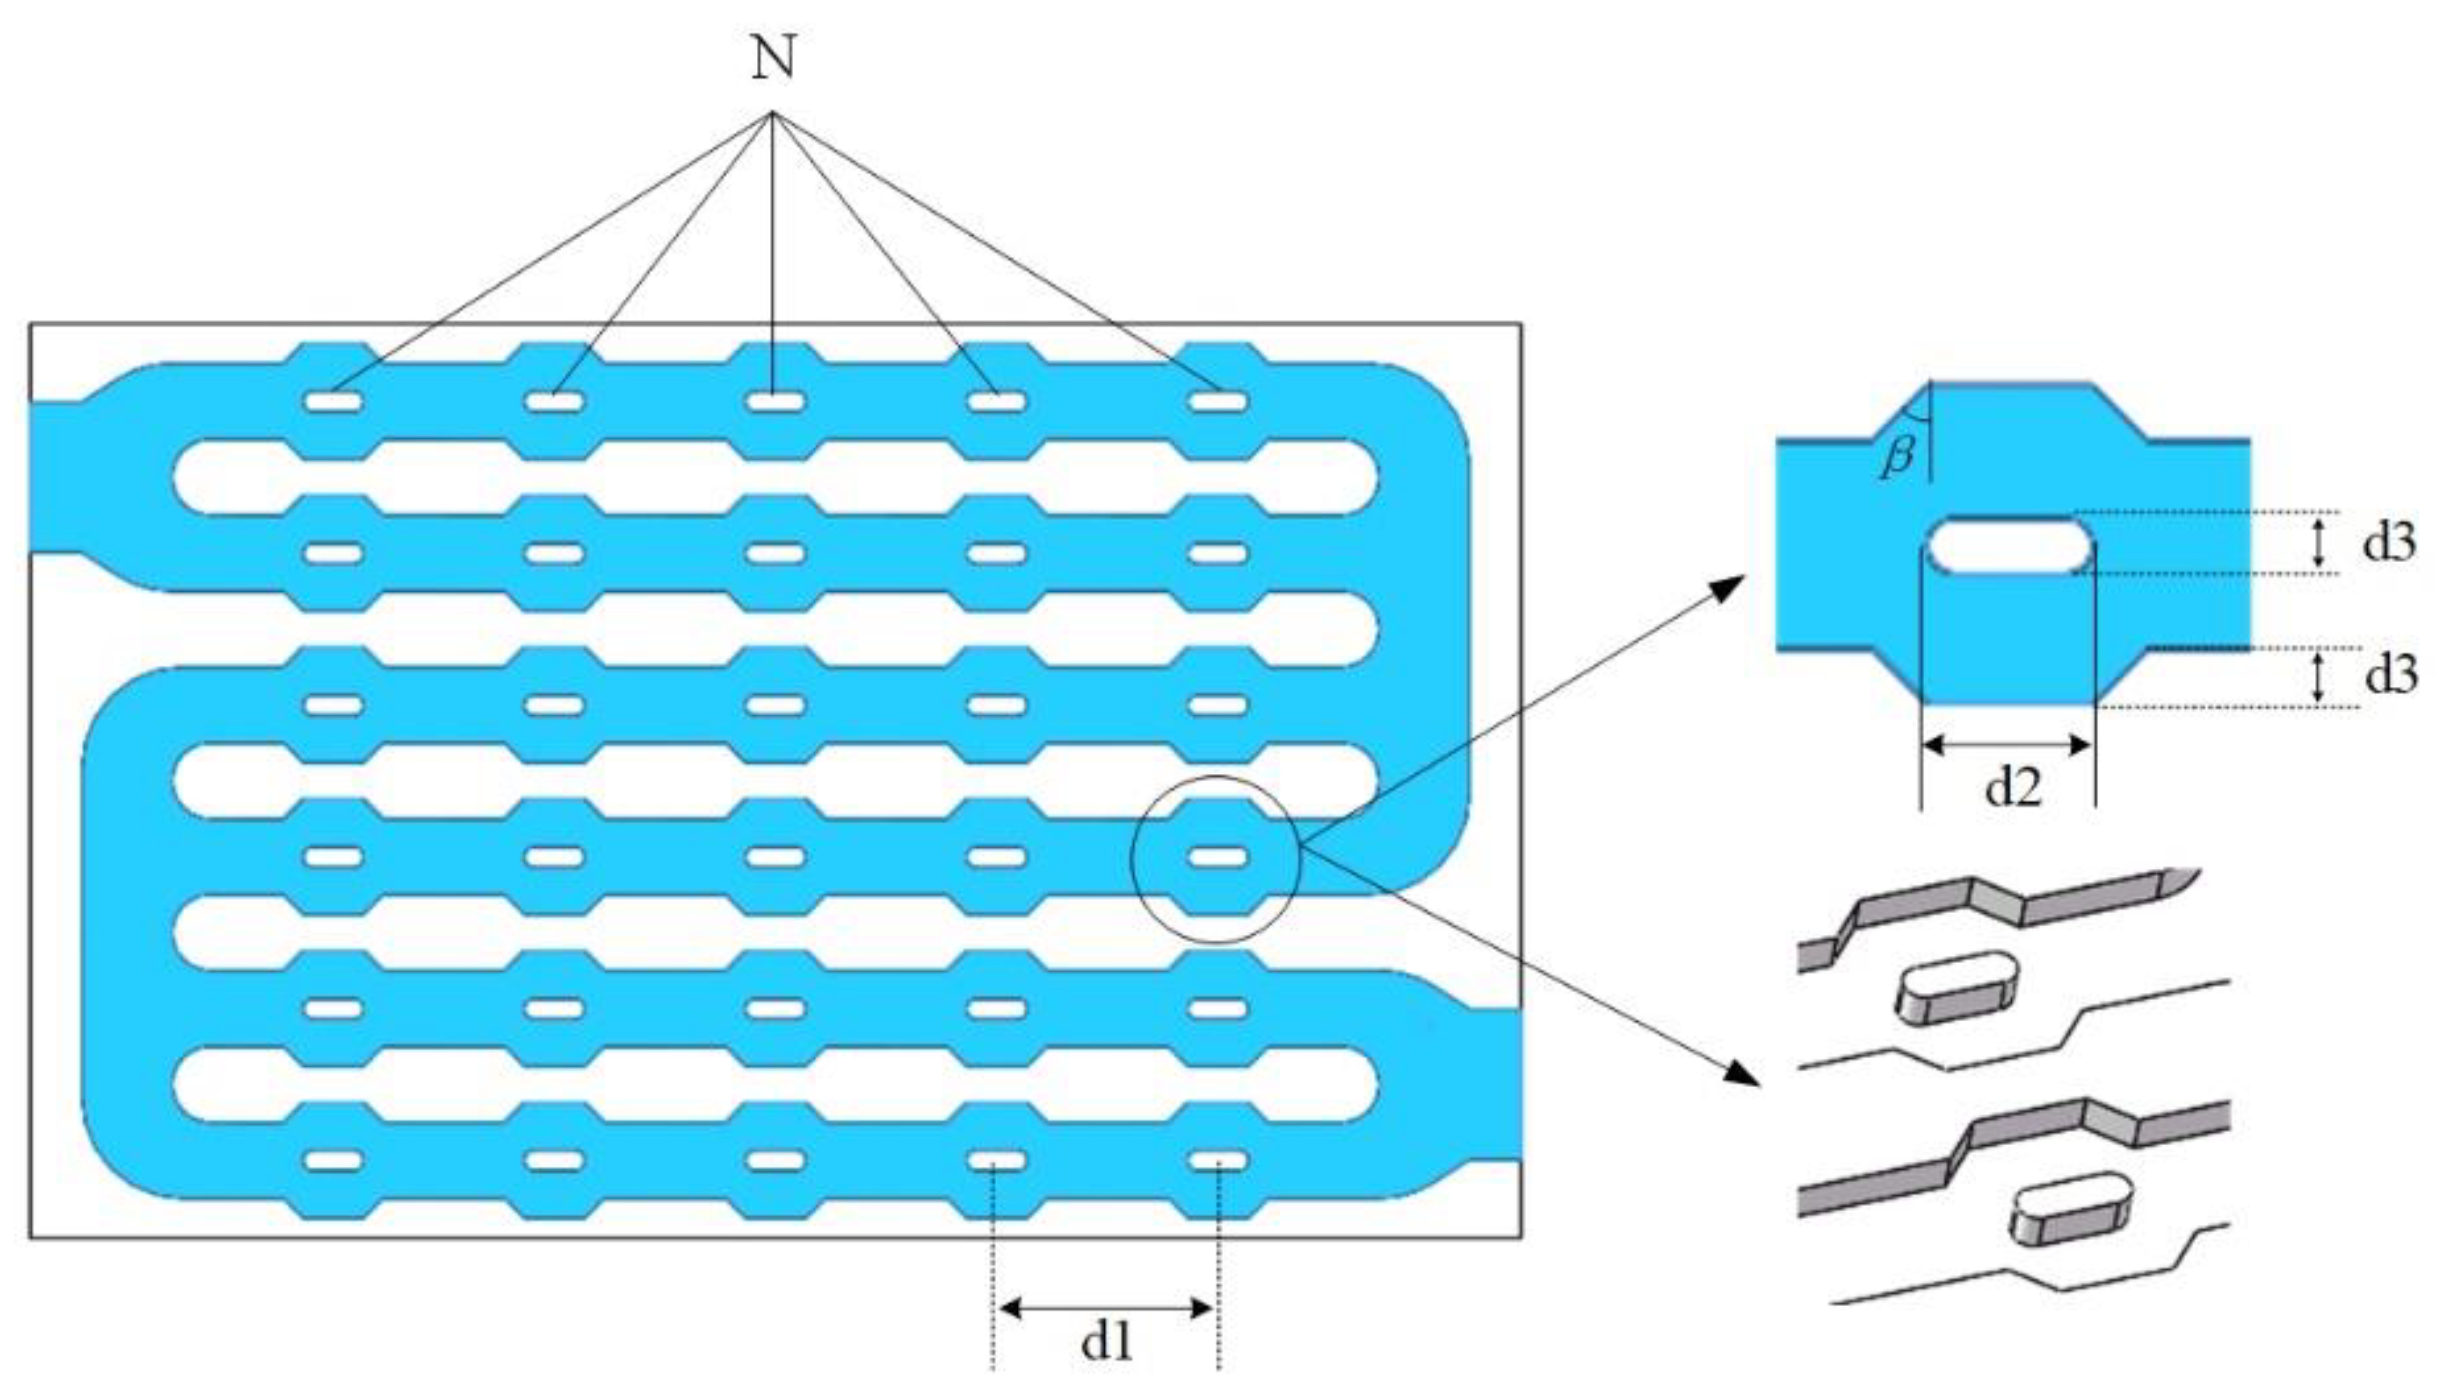
30]. Based on plan 5, the design parameters of the disturbance structure include space between adjacent disturbance structures d1, length d2, width d3, and tilt angle
β. The factors and levels for this orthogonal experiment are shown in
Table 3.
According to the test factors and levels in
Table 3, the L
16 (4
4) orthogonal test table was designed to carry out the orthogonal analysis. Adjacent disturbance structures d1, length d2, width d3, and tilt angle
β were selected as the factors. The maximum temperature
Tmax, maximum temperature difference
Tdiff, and friction factor
f were selected as the evaluation indexes of the heat dissipation performance. Numerical simulations were conducted for each scheme under the same conditions: 3 C discharging rate, 25 °C the coolant inlet temperature, and 400 L/h coolant flow rate. The detailed scheme of the orthogonal experiment and results are shown in
Table 4.
4.2. Range Analysis of Orthogonal Experiment Results
The range analysis method includes two steps of calculation and judgment. From the orthogonal test simulation results in
Table 4, the sum of the factors
Ki in each column can be calculated, and thus the average value
ki of
Ki can be calculated as well. Based on the average value
ki, the range value of each factor for the evaluation indexes can be obtained according to Equation (15).
Therefore, the sensitivity of each structural parameter of the disturbance structure to different evaluation indexes can be visualized by the range value
R derived from the orthogonal experiment. A larger
R value indicates a greater sensitivity, i.e., a greater influence of the factor on the evaluation index. The results of the range analysis are shown in
Table 5.
According to the results in
Table 5, the sensitivity of each structural parameter of the disturbance structure is in the order of d
1 >
β > d
3 > d
2 for the evaluation index maximum temperature, and the detailed values are d
1 = 20 mm, d
2 = 5 mm, d
3 = 3 mm, and
β = 60°; for the maximum temperature difference, the order is d
1 >
β > d
2 > d
3, and the detailed values are d
1 = 20 mm, d
2 = 3 mm, d
3 = 1.5 mm, and
β = 60°; for the friction factor, the order is
β > d
3 > d
1 > d
2, and the detailed values are d
1 = 14 mm, d
2 = 6 mm, d
3 = 1.5 mm, and
β = 60°.
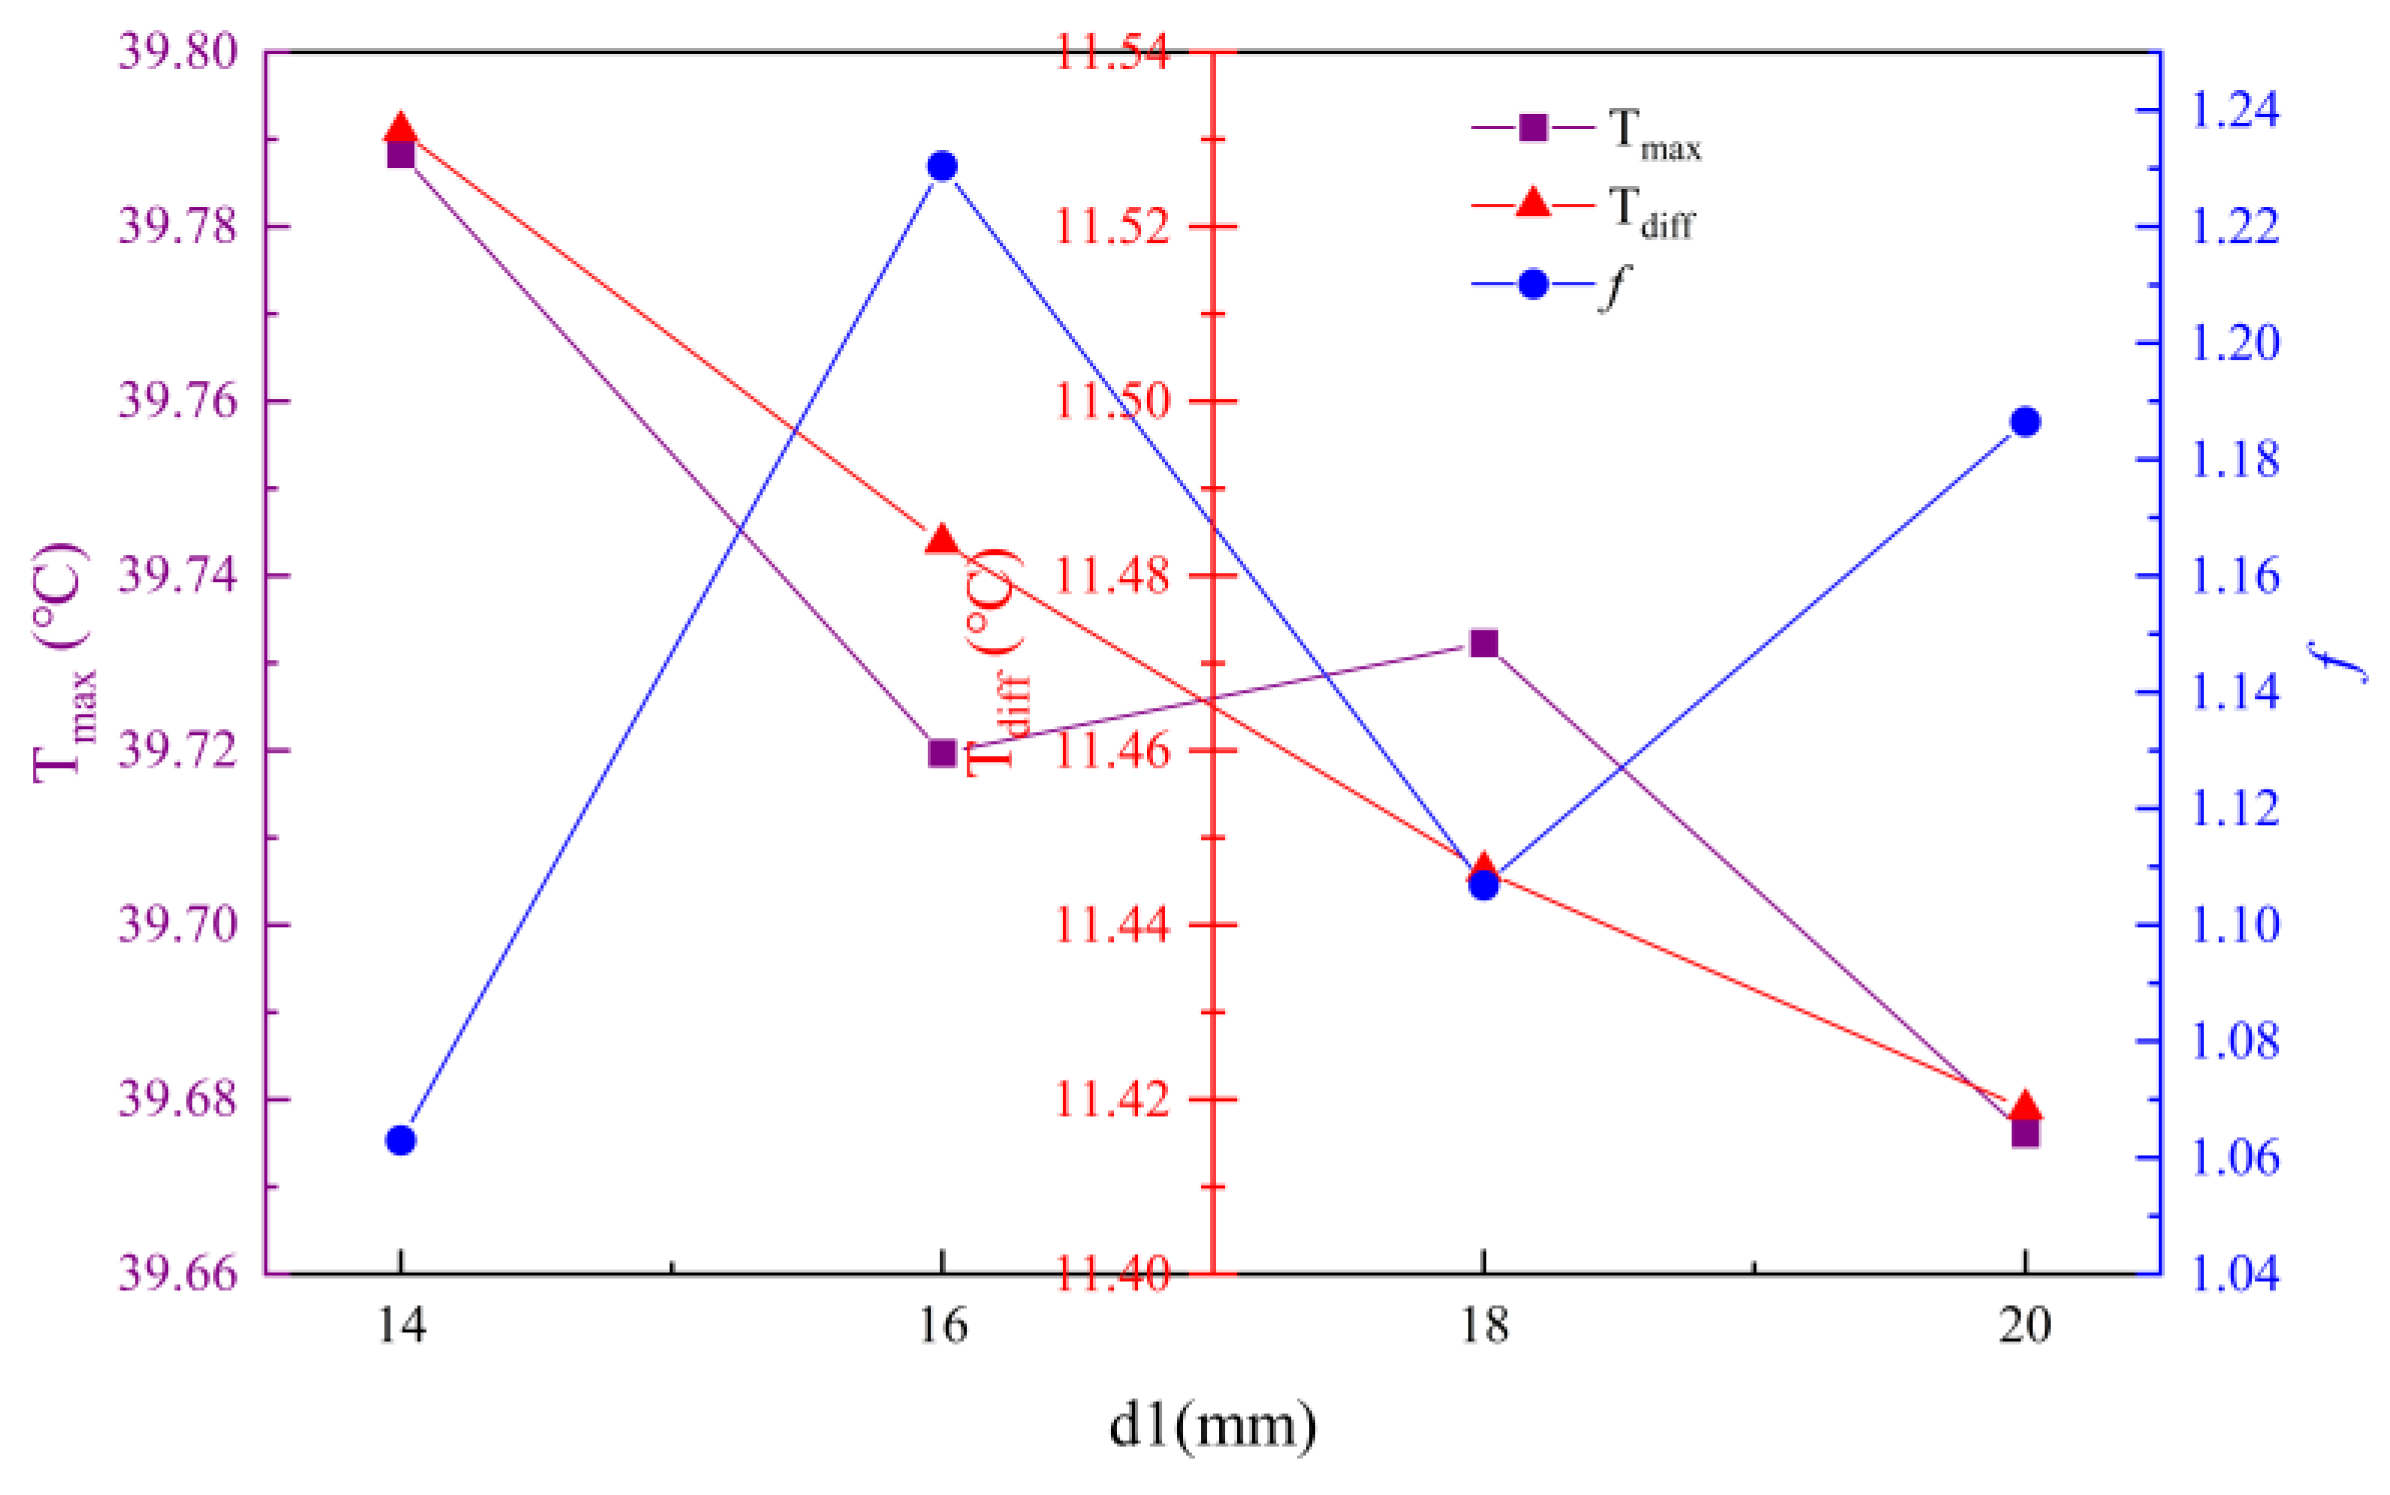
With d
1 as the horizontal coordinate and
k as the vertical coordinate, the trend of the influence of the disturbance structure spacing on each evaluation index can be obtained, as shown in
Figure 16. The maximum temperature difference of the battery module gradually decreases as the spacing of the disturbance structure increases, because the larger spacing indicates that the disturbance structure is more uniformly distributed inside the mini-channel, and the plate can evenly dissipate the heat to improve the temperature uniformity. In addition, the maximum temperature and the friction factor show an opposite trend, which indicates that the two indexes are negatively correlated. In this section, the maximum temperature and the maximum temperature difference achieve the best value when d
1 = 20 mm, and this value is selected as the final parameter, although the friction factor is not optimal. Here, the heat dissipation performance is considered first.
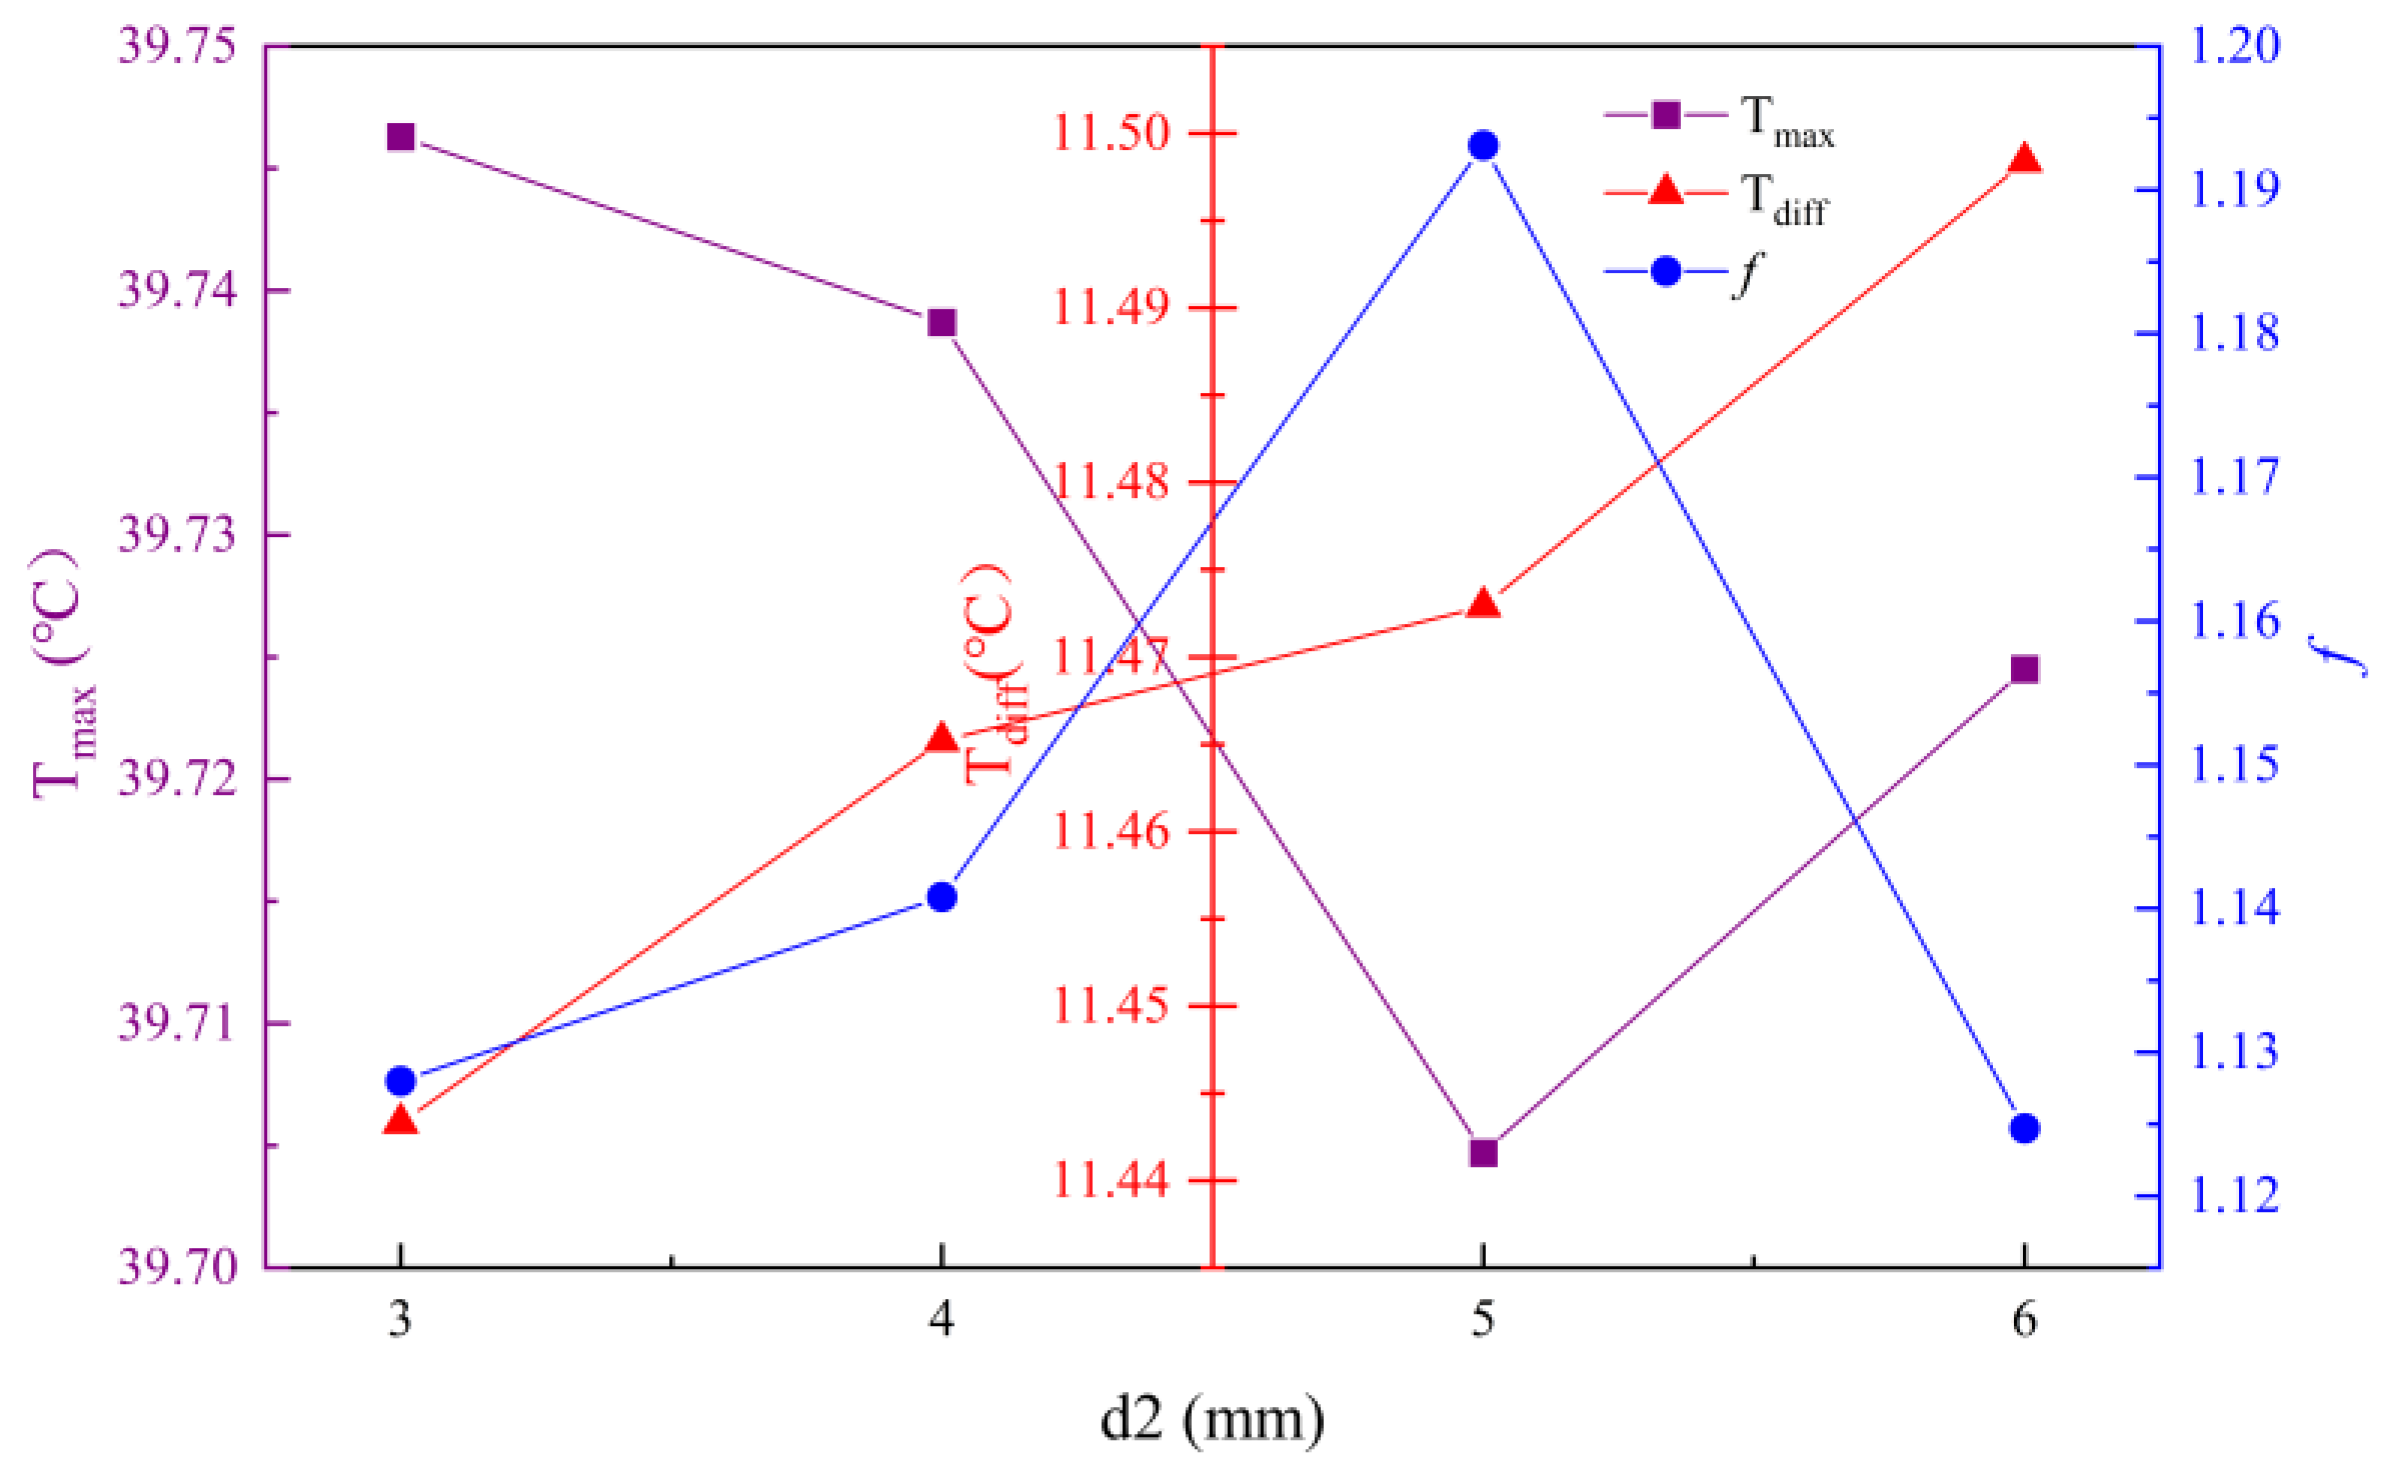
With d
2 as the horizontal coordinate and
k as the vertical coordinate, the trend of the influence of the disturbance structure length on each evaluation index can be obtained, as shown in
Figure 17. As d
2 increases, the maximum temperature difference gradually increases, which indicates that increasing the length is not conducive to temperature uniformity. Actually, increasing d
2 means the distance between adjacent disturbance structures decreases, which is not conducive to the uniform distribution of the fluid, and the heat dissipation is better in the area where the disturbance structure exists. In addition, the maximum temperature and the friction factor show an opposite trend. On the one hand, increasing the length will cause the area of convective heat transfer inside the mini-channel to increase, thus improving the heat dissipation performance; on the other hand, increasing the length will disturb the original flow traces of the coolant, the velocity and pressure fields inside the mini-channel will change, and the coolant will diverge when it is close to the disturbance structure, so the frictional resistance inside the flow channel will also increase. However, when the length reaches 5 mm, increasing the length will cause the maximum temperature to rise, which indicates that when the disturbance structure is too long, the spacing will become too short, and the coolant will only flow from both sides of the disturbance structure. There will be a dead zone between the adjacent disturbance structures, and the friction factor will become smaller, but at the same time, the heat dissipation performance will be affected, and when the length is 5 mm, the enhanced heat transfer performance of the mini-channel liquid cooling plate is the best.
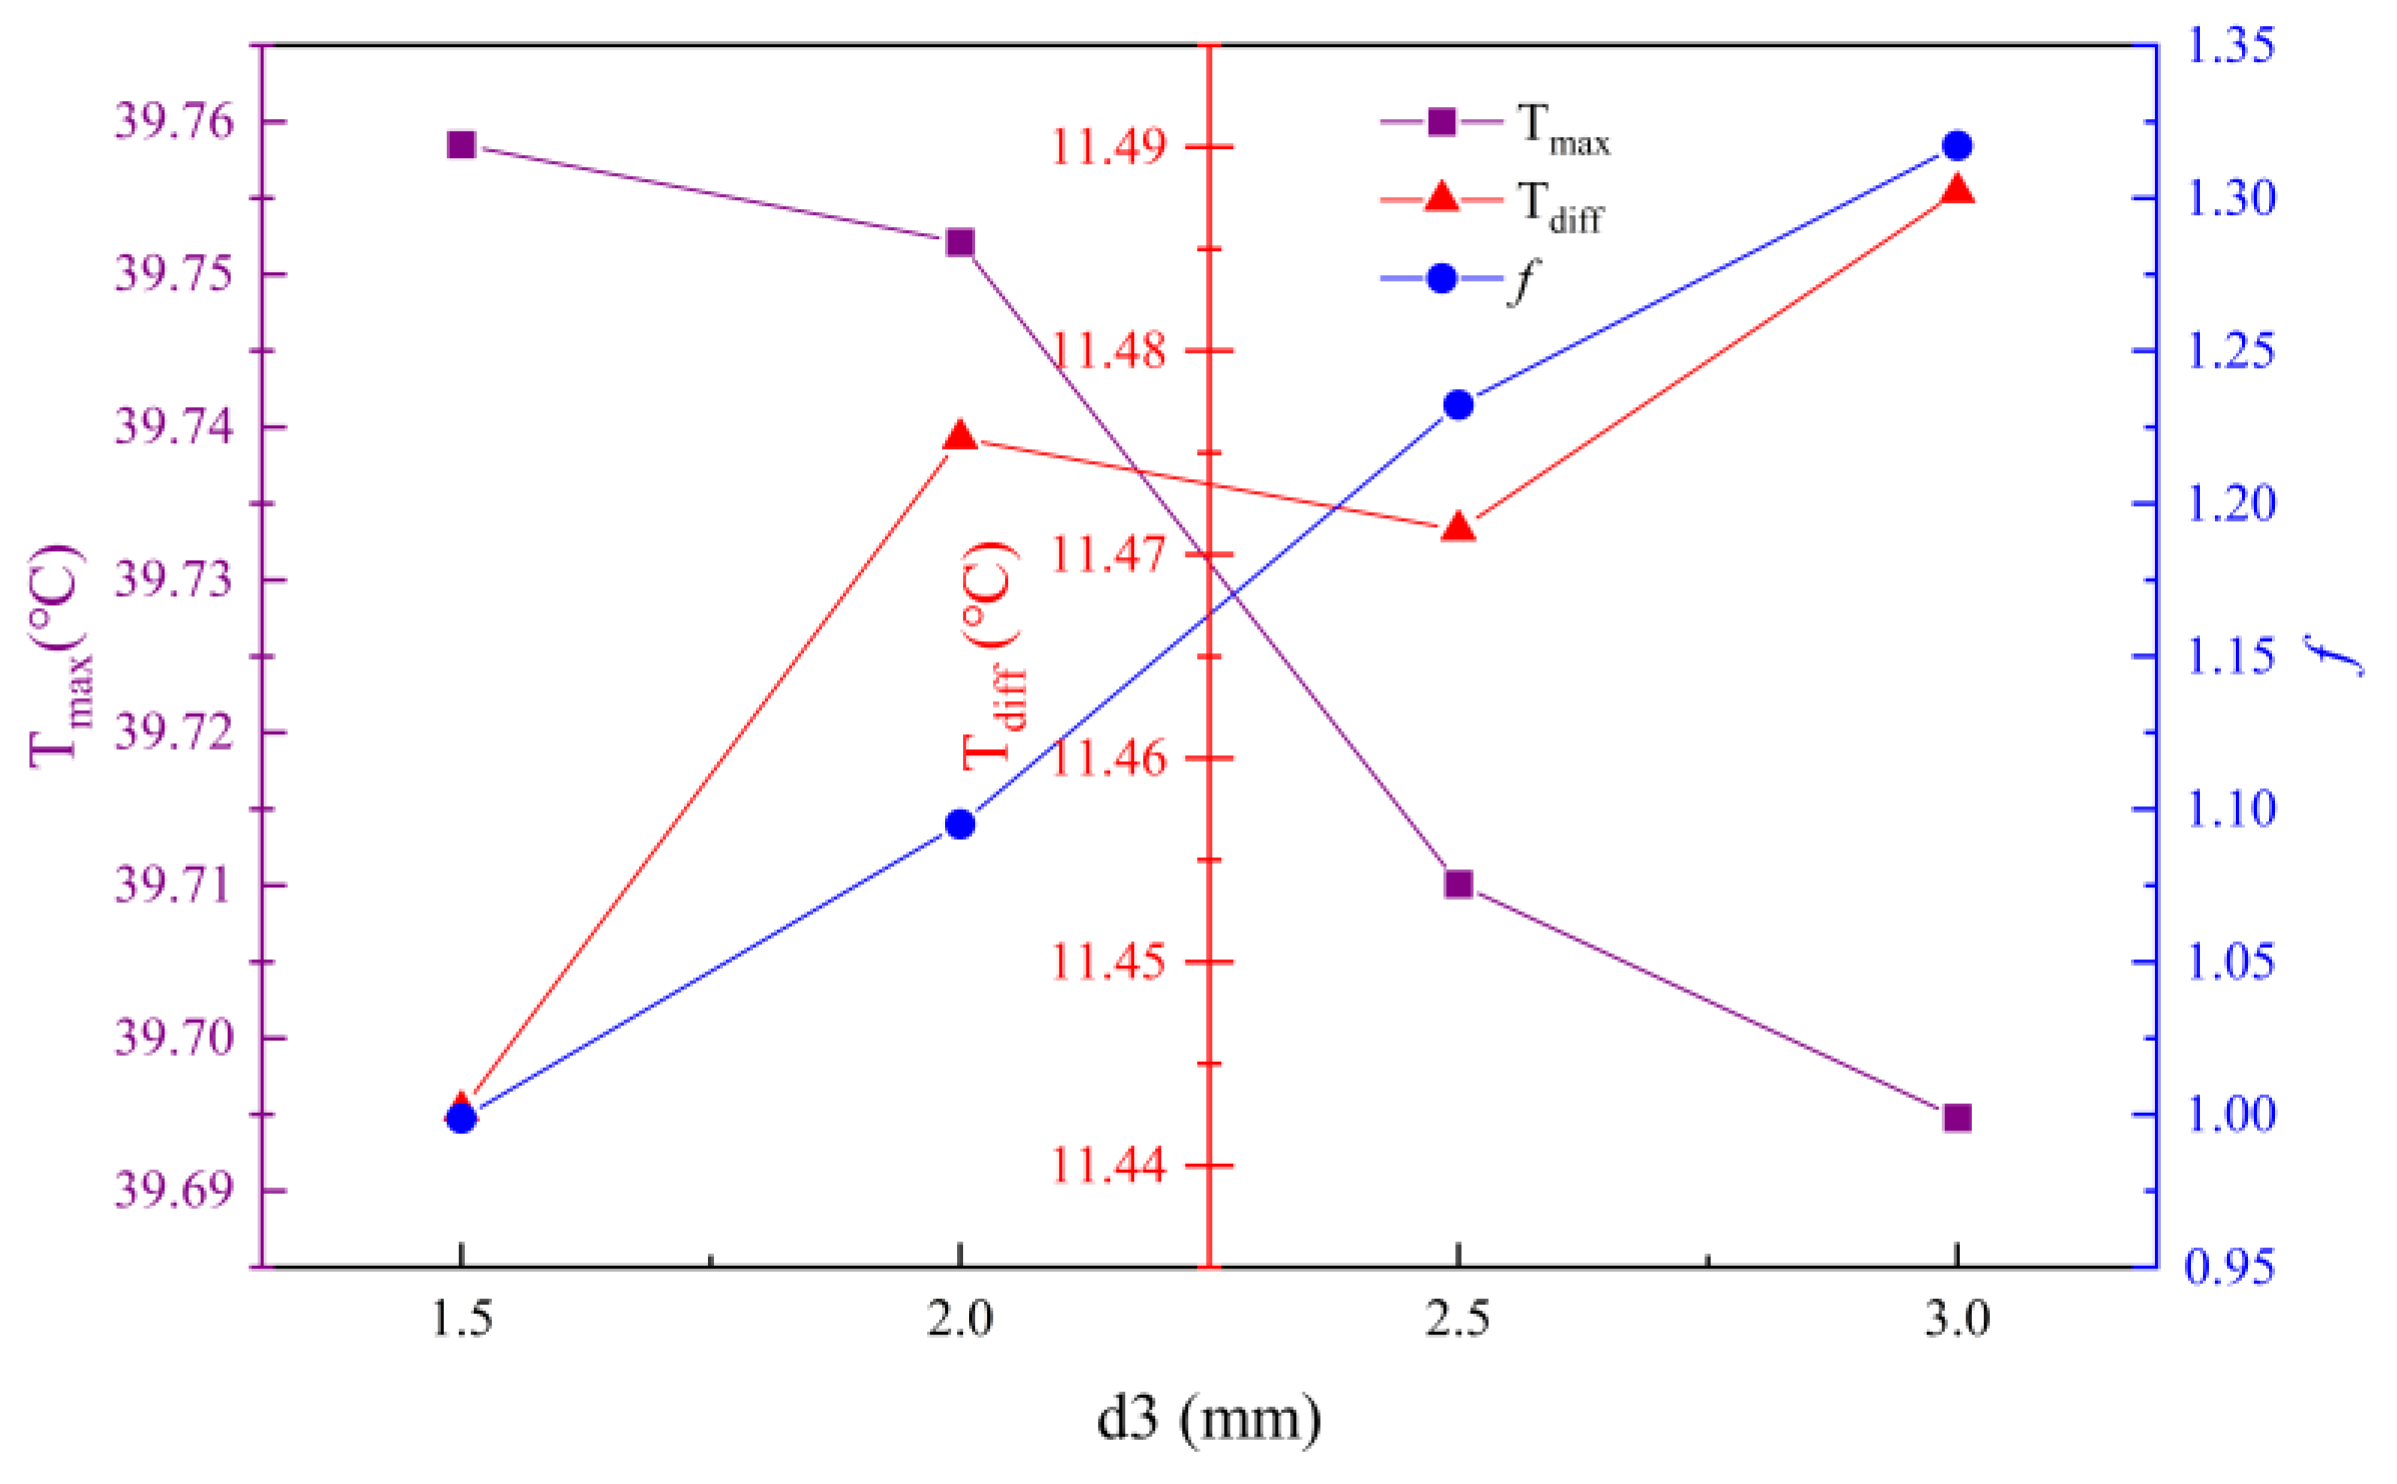
With d
3 as the horizontal coordinate and
k as the vertical coordinate, the trend of the influence of the disturbance structure width on each evaluation index can be obtained, as shown in
Figure 18. As d
3 increases, the maximum temperature decreases, but the friction factor gradually increases. On the one hand, increasing the width of the disturbance structure causes an increase in the convective heat transfer area inside the mini-channel; on the other hand, the disturbing effect on the fluid is enhanced, the stable flow field is abruptly changed, the boundary layer is generated in the middle region of the fluid, and the turbulence is enhanced. In addition, the overall trend of the maximum temperature difference is increasing, which indicates that increasing the width will cause the coolant to divert to both sides of the disturbance structure, and the coolant flow rate is lower in the area between adjacent disturbance structures, resulting in uneven distribution of coolant flow and preventing the battery surface from being uniformly dissipated, thus causing poor temperature uniformity.
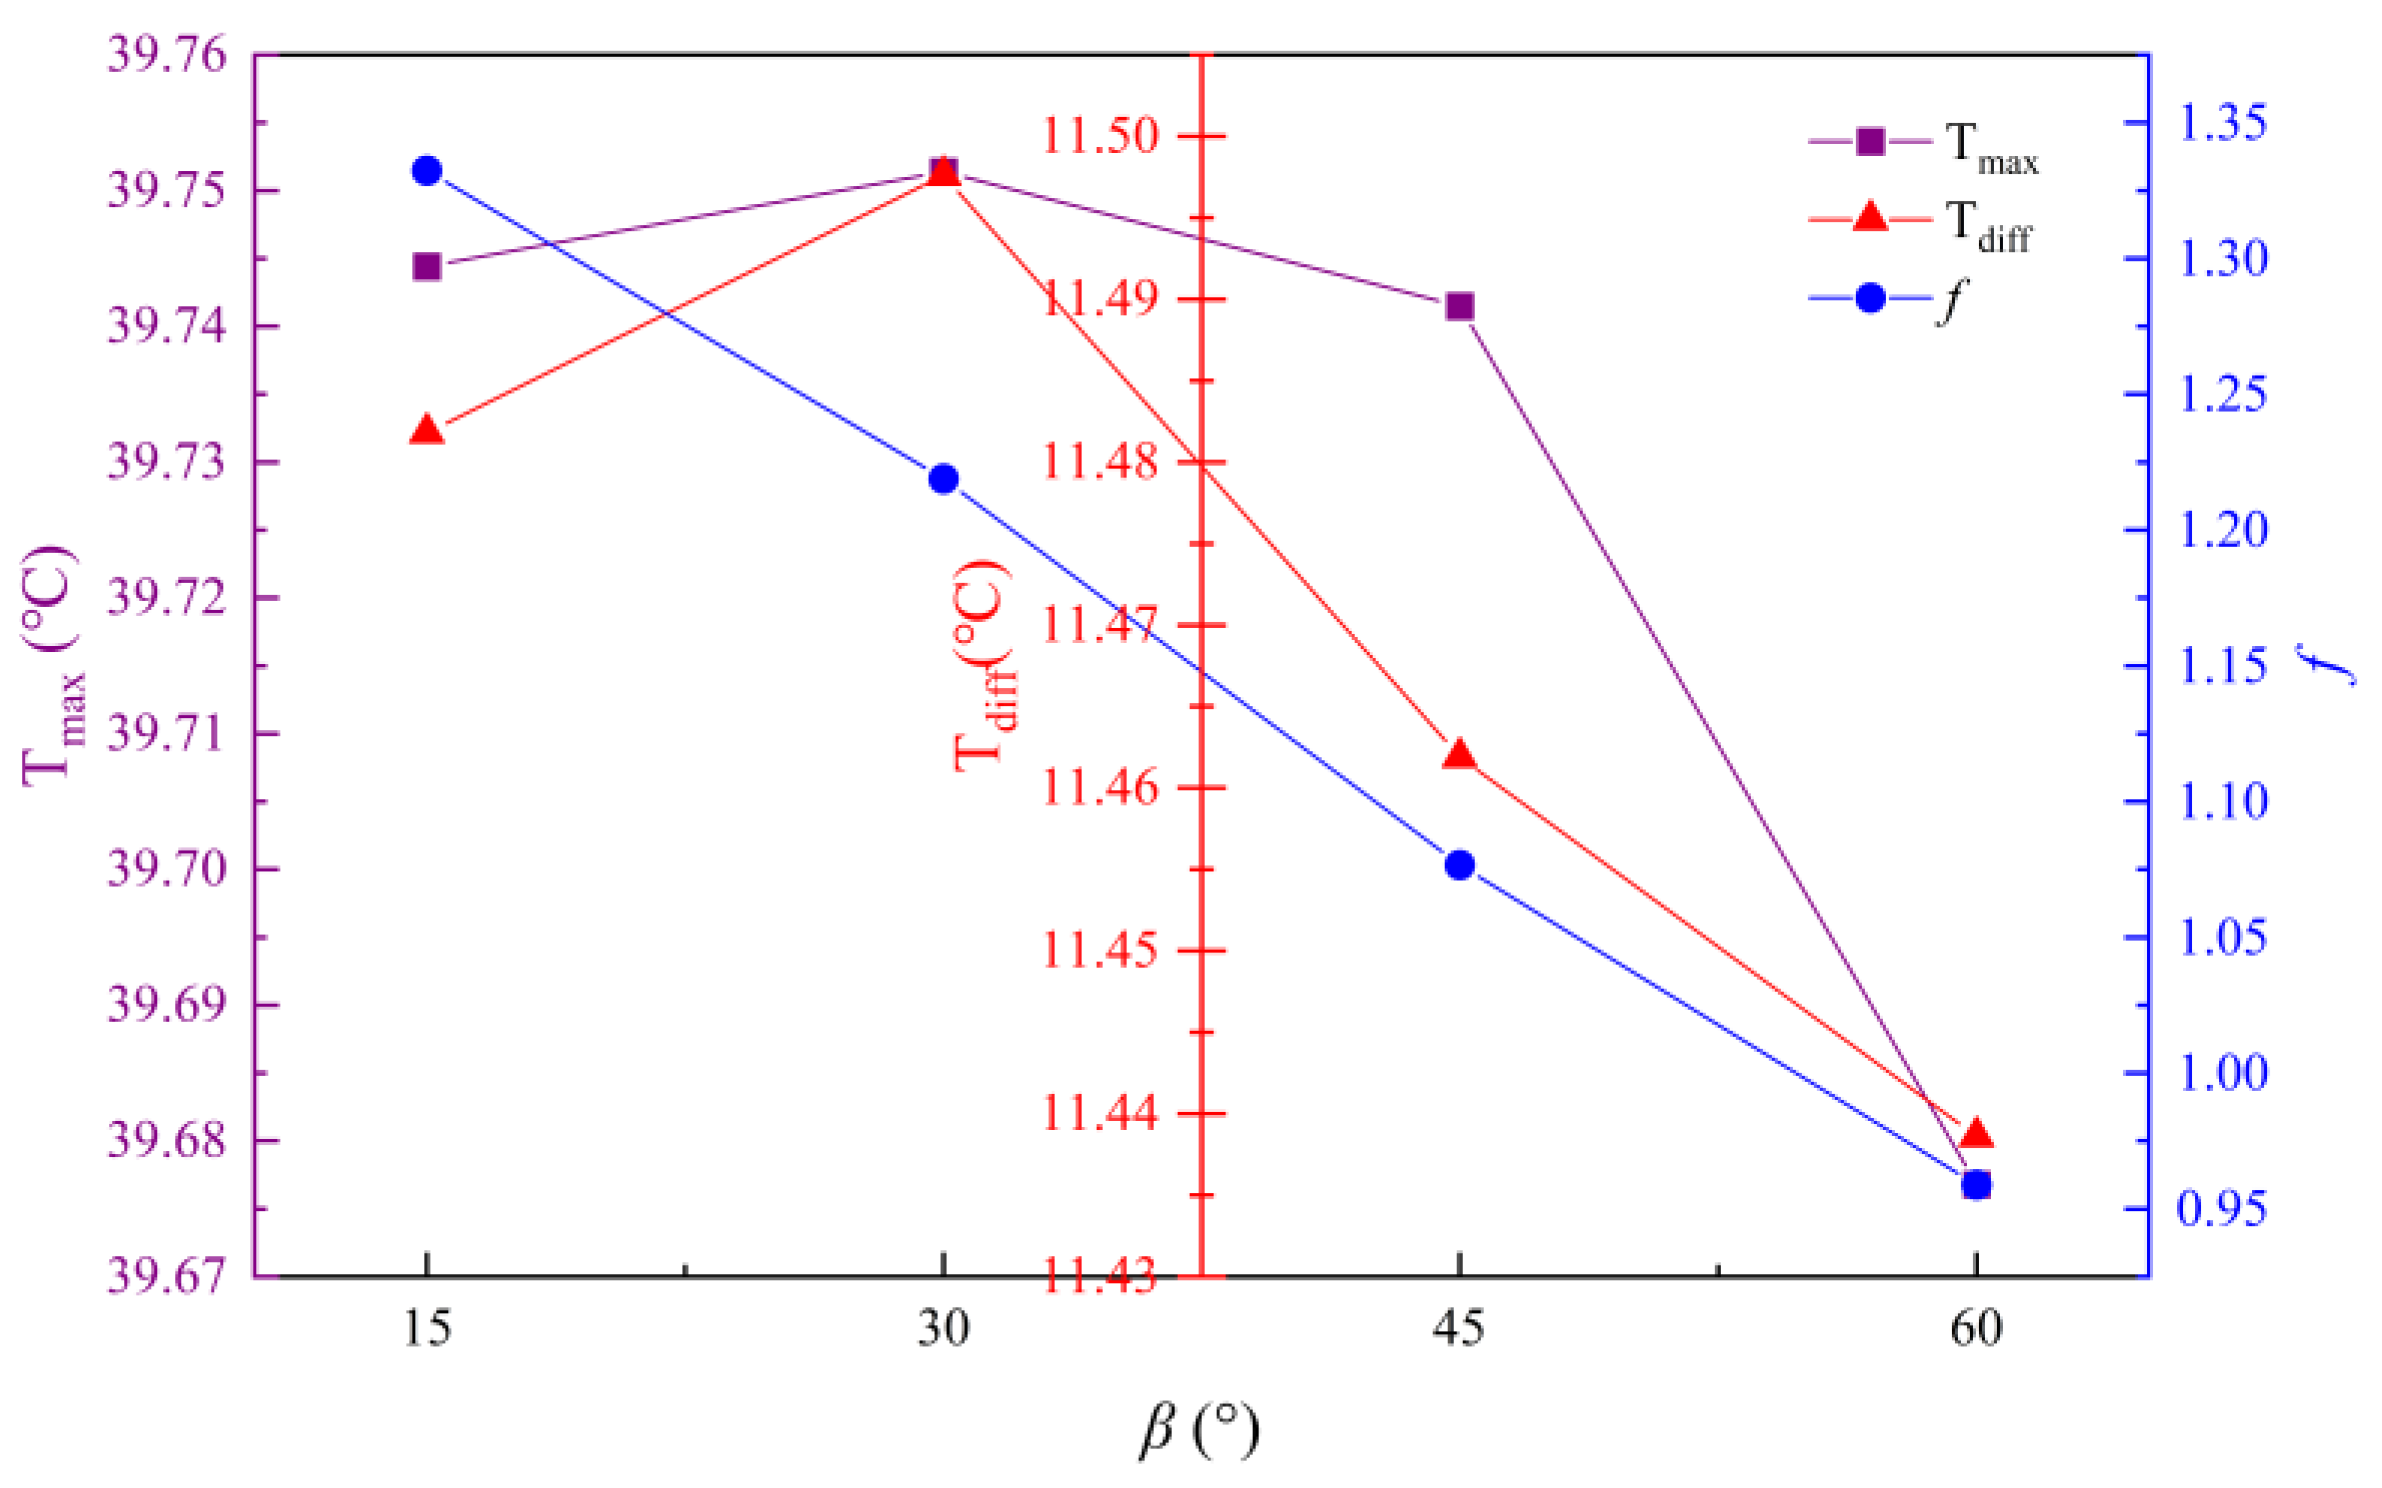
With
β as the horizontal coordinate and
k as the vertical coordinate, the trend of the influence of the disturbance structure width on each evaluation index can be obtained, as shown in
Figure 19. The friction factor gradually decreases as
β increases, which indicates that the coolant in the cavity is subject to less frictional resistance when flowing out of the cavity, which is more conducive to the natural flow of the fluid. However, the maximum temperature and the maximum temperature difference increase slightly and then decrease significantly when
β increases to 30°, which indicates that the heat dissipation is the worst at this value. At this value, the coolant flow velocity is low at the opening angle of the cavity, and there is even a dead zone, so the coolant cannot flow evenly to dissipate heat. In addition, as shown in
Table 5, the sensitivity of the friction factor to each evaluation index is the lowest among all factors, which indicates that it has the least influence on the enhanced heat transfer performance, and the thermal characteristics of the battery module and the performance of the flow channel are the best when the cavity opening angle is 60°.
Based on the determined parameters, a comparison between the BTMS in this paper and a BTMS with passive air cooling is performed. In the air-cooling system, the module is the same as that in this paper without cooling plates and thermal conductive sheets. All batteries are in contact with each other. The environmental conditions and discharging rate are the same. In addition, the computation domain is 20 mm larger than each side of the module, considering that the battery pack is compact in real-world applications. The results are shown in
Table 6. It can be seen that the maximum average temperature cannot be controlled with a compact module structure under passive air cooling, and it reaches 49.06 °C. The maximum average temperature difference reaches 6.41 °C, 5.48 °C higher than before.


