1. Introduction
In railway transportation, the shunting locomotive is essential. It is commonly utilized in both maintenance hubs and operational routes to move rolling stock cars, supplies, and equipment. In addition, when an accident happens, the shunting locomotive is responsible for retrieving damaged or powerless vehicles in order to ensure passenger safety [
1,
2]. In terms of shunting locomotive market demand, relative research indicates that there will be a need for at least 2000 units in the future in China from two perspectives. The DF5, DF7, and DF4D locomotives, which were produced between the 1980s and the beginning of the twenty-first century, are waiting to be replaced [
3]. Second, China’s aggressive implementation of the “road-to-rail” strategy necessitates the development of the shunting locomotive market to match the rapid growth in rail freight traffic. Therefore, it is urgent to develop energy integration technology to meet the development of electric locomotive market and energy conservation and emission reduction [
4]. With the development of energy storage system, hybrid propulsion system is widely to solve this problem [
5].
Due to the large-scale and long-distance demands of locomotive working characteristics, diesel-electric hybrid propulsion system (HPS) is being intensively developed across the globe in response to the need for energy savings and pollution reduction [
6,
7]. Diesel-electric HPS is usually made up of a diesel generator and a battery pack. This system is adaptable and can handle any shunting duty. It also has a high torque even at a low running speed, allowing the diesel engine to operate in the high efficiency zone all of the time, considerably boosting fuel economy, and decreasing mechanical vibration [
8,
9].
Due to the different power and energy characteristics of diesel generator and battery pack, reasonable energy distribution of different power sources under specific load profile is the most important method to ensure the stability and energy conservation of HPS [
10,
11]. The different output characteristics of different power sources lead to more complex energy management, which may have a negative impact on the system [
12]. Energy management strategy (EMS), which integrates the locomotive’s real-time operation state with the system’s status information and determines the operation orders for each power source under various operating situations, is proposed to ensure the whole system operates in an optimum or near-optimal mode [
13,
14].
Most researches have studied EMS for various vehicles. There are two types of EMS now available: rule-based (RB) strategy, optimization-based (OB) strategy [
15,
16]. The RB strategy is usually separated into logic and fuzzy control rules which are based on a large number of driving experiences. These strategies are easy to regulate and use in real time, but they are not flexible to changing load profiles and cannot attain the optimum power system efficiency in reality. The OB strategy combines fuel consumption, economic cost, and dynamics to accomplish power distribution by determining the minimal objective function value, which is separated into global and instantaneous optimization approaches. Nazari, et al. [
17] used dynamic programming (DP) algorithm to obtain the global optimal power allocation results. The algorithm is based on the goal of total cost of power consumption of the multi-energy storage system throughout its whole life cycle, and capacity parameters are adjusted based on the DP results. To obtain the configuration guidance program, Herrera, et al. [
18] used the traditional threshold method as EMS, which is based on genetic algorithm (GA), to optimize the energy storage system over the full life cycle of the initial acquisition cost, replacement cost, operating electricity costs, and other multi-objectives. Based on these researches, the global optimization strategy can get the best energy distribution result to reduce the fuel consumption of HPS. However, the global optimization strategy requires knowing the driving conditions of the route in order to obtain the global optimal solution, but it cannot achieve real-time control effect. For this reason, relevant scholars have proposed to achieve better optimization performance by combining optimization algorithm with deep learning [
19,
20].
In order to meet the real-time energy management of HPS and reduce fuel consumption at the same time, this paper proposes an improved EMS which combines fuzzy neural network (FNN) and DP strategy. FNN-DP strategy solves the defect that DP strategy cannot be used for real-time vehicle operation, and provides approximate optimization effect. In this strategy, FNN is used to optimize the fuzzy rules based on DP’s optimal energy distribution results. This method can realize the real-time energy management of the hybrid power system on the basis of approximately realizing the DP global optimization effect.
3. Research of Energy Management Strategy
EMS is the core of system operation [
24]. An efficient EMS can assure steady locomotive operation and reduce fuel consumption. Based on the model of HPS, this proposed a fuzzy neural network base on dynamic programming (FNN-DP) strategy. The proposed FNN-DP strategy combines FNN and DP strategy in order to meet minimum fuel consumption and real-time performance at the same time.
3.1. RB Strategies
The RB strategy does not need to predict operating circumstances and can provide real-time results. The real demand algorithm technique is separated into two cases: demand power less than 0 and demand power larger than 0. The specific flow block diagrams are shown in
Figure 5 and
Figure 6 below.
Among them, in the high efficiency zone, the output power of a diesel generator set is [Peff_min, Peff_max]; the demand power in specific working condition is PP; the maximum charging and discharging power of battery is [Pem_min, Pem_max]; the state of charge (SOC) range of battery group is [0.2,0.9]. The basic rule is to use the diesel engine as the primary energy source, to work in the most efficient range possible (lower fuel consumption and emissions), and to use the battery to meet the remaining demand power as much as possible, or to absorb excess power and recover brake power as much as possible. The goal of the RB strategy is to keep the engine running in the range of high efficiency output power, which means that fuel consumption is low in the range, and the battery group to make up or absorb the remaining power. If the remaining power exceeds the top limit of the battery pack’s maximum working capacity, the battery pack should first be checked for proper functioning by increasing the diesel generator’s output power.
The RB strategy is simpler and faster to calculate, can be invoked in real time, and can reduce the fuel consumption and emissions of HPS to some extent. However, the rules are based primarily on the engineering experience of research scholars, resulting in imperfect rules that do not guarantee that the system achieves optimal control [
25].
3.2. DP-Based Global Optimization Control Strategy
Richard Bellman devised and developed DP in the 1950s. Now, in a HPS for locomotives, DP strategy is a mathematical approach for designing an optimum energy management controller and managing the ideal operating state of two energy sources. The benefit of the DP strategy over other EMSs is that it can achieve the global optimum scheme, which may be utilized as a benchmark tool [
26]. The global optimality criteria seeks to maximize the whole predicted path rather than the power system’s operating condition at any one time. As a result, solving the energy consumption at a single point is pointless, and all energy consumption throughout the journey must be addressed. To put it another way, DP must strike a balance between present low energy usage and projected high energy demand in the future.
Figure 7 depicts the core premise of global energy management optimization for multi-energy drive systems using the DP algorithm.
The purpose of DP is to obtain the best possible fuel efficiency for the HPS under all circumstances. In the diagram, the time of the abscissa t0~tn, when the train runs from point A to point B, is discretized into n stages, and the ordinate is discretized into m state variables SOC, which represent the battery’s remaining power. The algorithm’s ultimate purpose is to determine the best SOC trajectory to fulfill the least fuel consumption constraints. This trajectory’s changing trend varies depending on the output of the diesel generator and the battery pack. SOC0,1 is the initial state of charge of the battery pack, Di,j is the total fuel consumption accumulated from the initial point to the state point j in the stage i, which is a one-step cost function, that is, the fuel consumption between the state point j2 in the i stage and the state point j2 in the previous stage.
Record the fuel consumption of each state point from the initial point SOC0,1 to stage 1, that is L, the corresponding cumulative fuel consumption;
Calculate the L of each state point from stage 1 to stage 2, and only keep track of the total minimum fuel consumption from the beginning to each stage 2 state point. As shown in point SOC2,1 in the figure, select the route with the lowest cumulative fuel consumption, that is, one of the three yellow lines, and store the relevant data of this route to the corresponding matrix to facilitate backtracking;
Step 2 should be repeated iteratively until the state is ended. The termination phase is the same as the beginning phase, with the goal of ensuring that all cumulative fuel consumption is from diesel engines without the use of electric energy. Iterative cumulation is used to determine the transfer cost of single step state variables, and a set of control variables with the lowest cumulative cost in the whole discrete space is produced. The DP optimum solution is this set of control sequences. State variable, decision variable, state transfer equation, constraint condition, single stage objective function, and total objective function must all be calculated throughout the procedure.
- (a)
State variable
The state variable in this study is the battery’s SOC, and the stage division step size is 0.0001. The state variable x and its step size are shown in Equation (8):
- (b)
Decision variables
The output power of the battery pack (
Pbatt) is chosen as the decision variable in this paper, and each stage’s decision forms a set of control variable sequence. The stage step TS is 1s, and
Ebatt is the battery power. The decision variable u and its step size are shown in Equation (9):
- (c)
State transfer equation
SOC changes in the whole operating situation at any moment due to diverse decision-making options. The state is passed from one stage to the next in the DP iterative process via making choices, as shown in Equation (10):
- (d)
Constraint condition
The constraints to be satisfied in the DP iteration process are shown in the following Equations (11) and in (12):
The aim function at the single step stage of DP is low fuel consumption, which includes not only the diesel directly used by the engine, but also the fuel indirectly absorbed by the battery. As shown in Equations (13) and (14). In Equation (15) is the fuel consumption curve of the diesel generator, which is a function of the output power of the diesel generator.
- (e)
Single stage objective function
The whole cycle condition is divided into n stages, and the value of the goal function for each of the N single-step stages is added together. The following Equation (16) expresses the overall objective function of the DP energy management technique in terms of state and control variables.
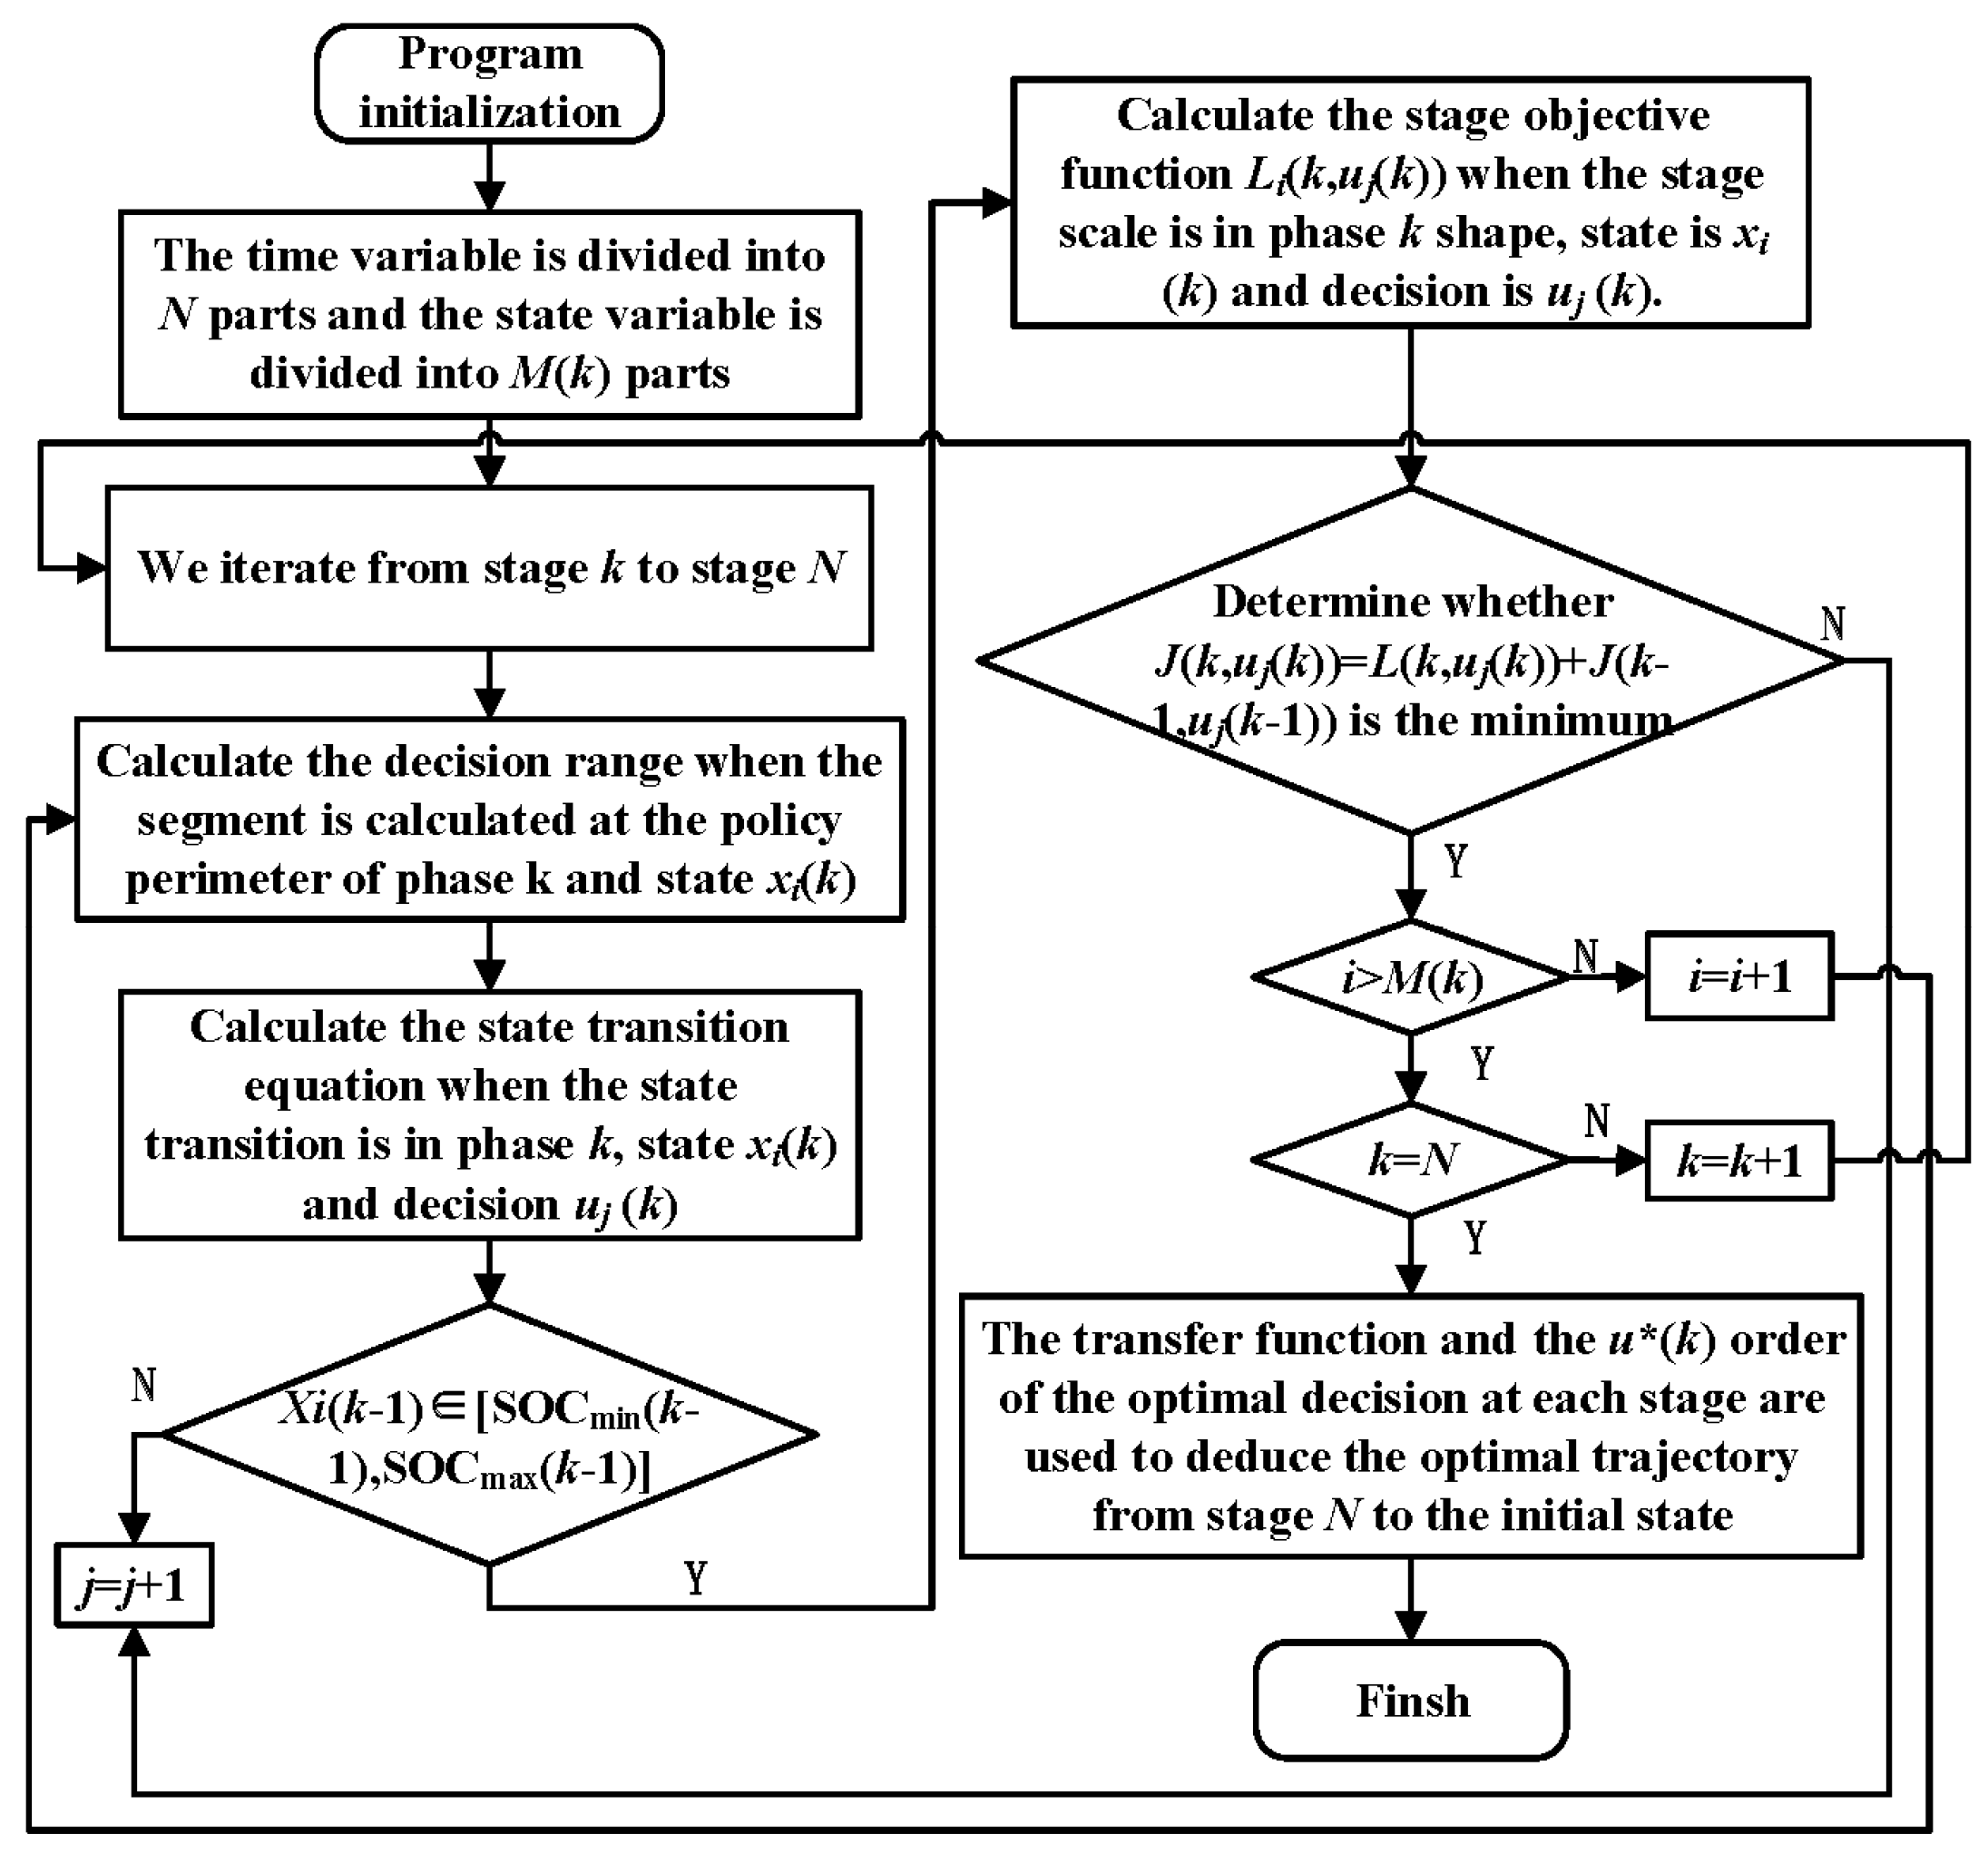
Among them, the meaning of the relevant symbols is shown in the
Table 1, and the calculation flow chart of DP strategy is shown in
Figure 8.
3.3. FNN-DP Strategy
Although the global optimal EMS (DP strategy) can maximize the performance of the HPS to achieve the global optimum [
22], thus improving the vehicle’s fuel economy, it can only be used to obtain information on future driving conditions in order to perform optimization calculations, while not avoiding the algorithm’s shortcomings of large computational volume and long computation time, and thus belongs to the offline algorithm, which is limited in real-time applications. In this paper, a fuzzy neural network (FNN) is proposed to optimize the fuzzy rules based on the DP strategy’s global optimized energy distribution results. At each moment of locomotive real-time operation, real-time energy management can be carried out through fuzzy control rules determined by FNN-DP strategy according to load power and battery
SOC.
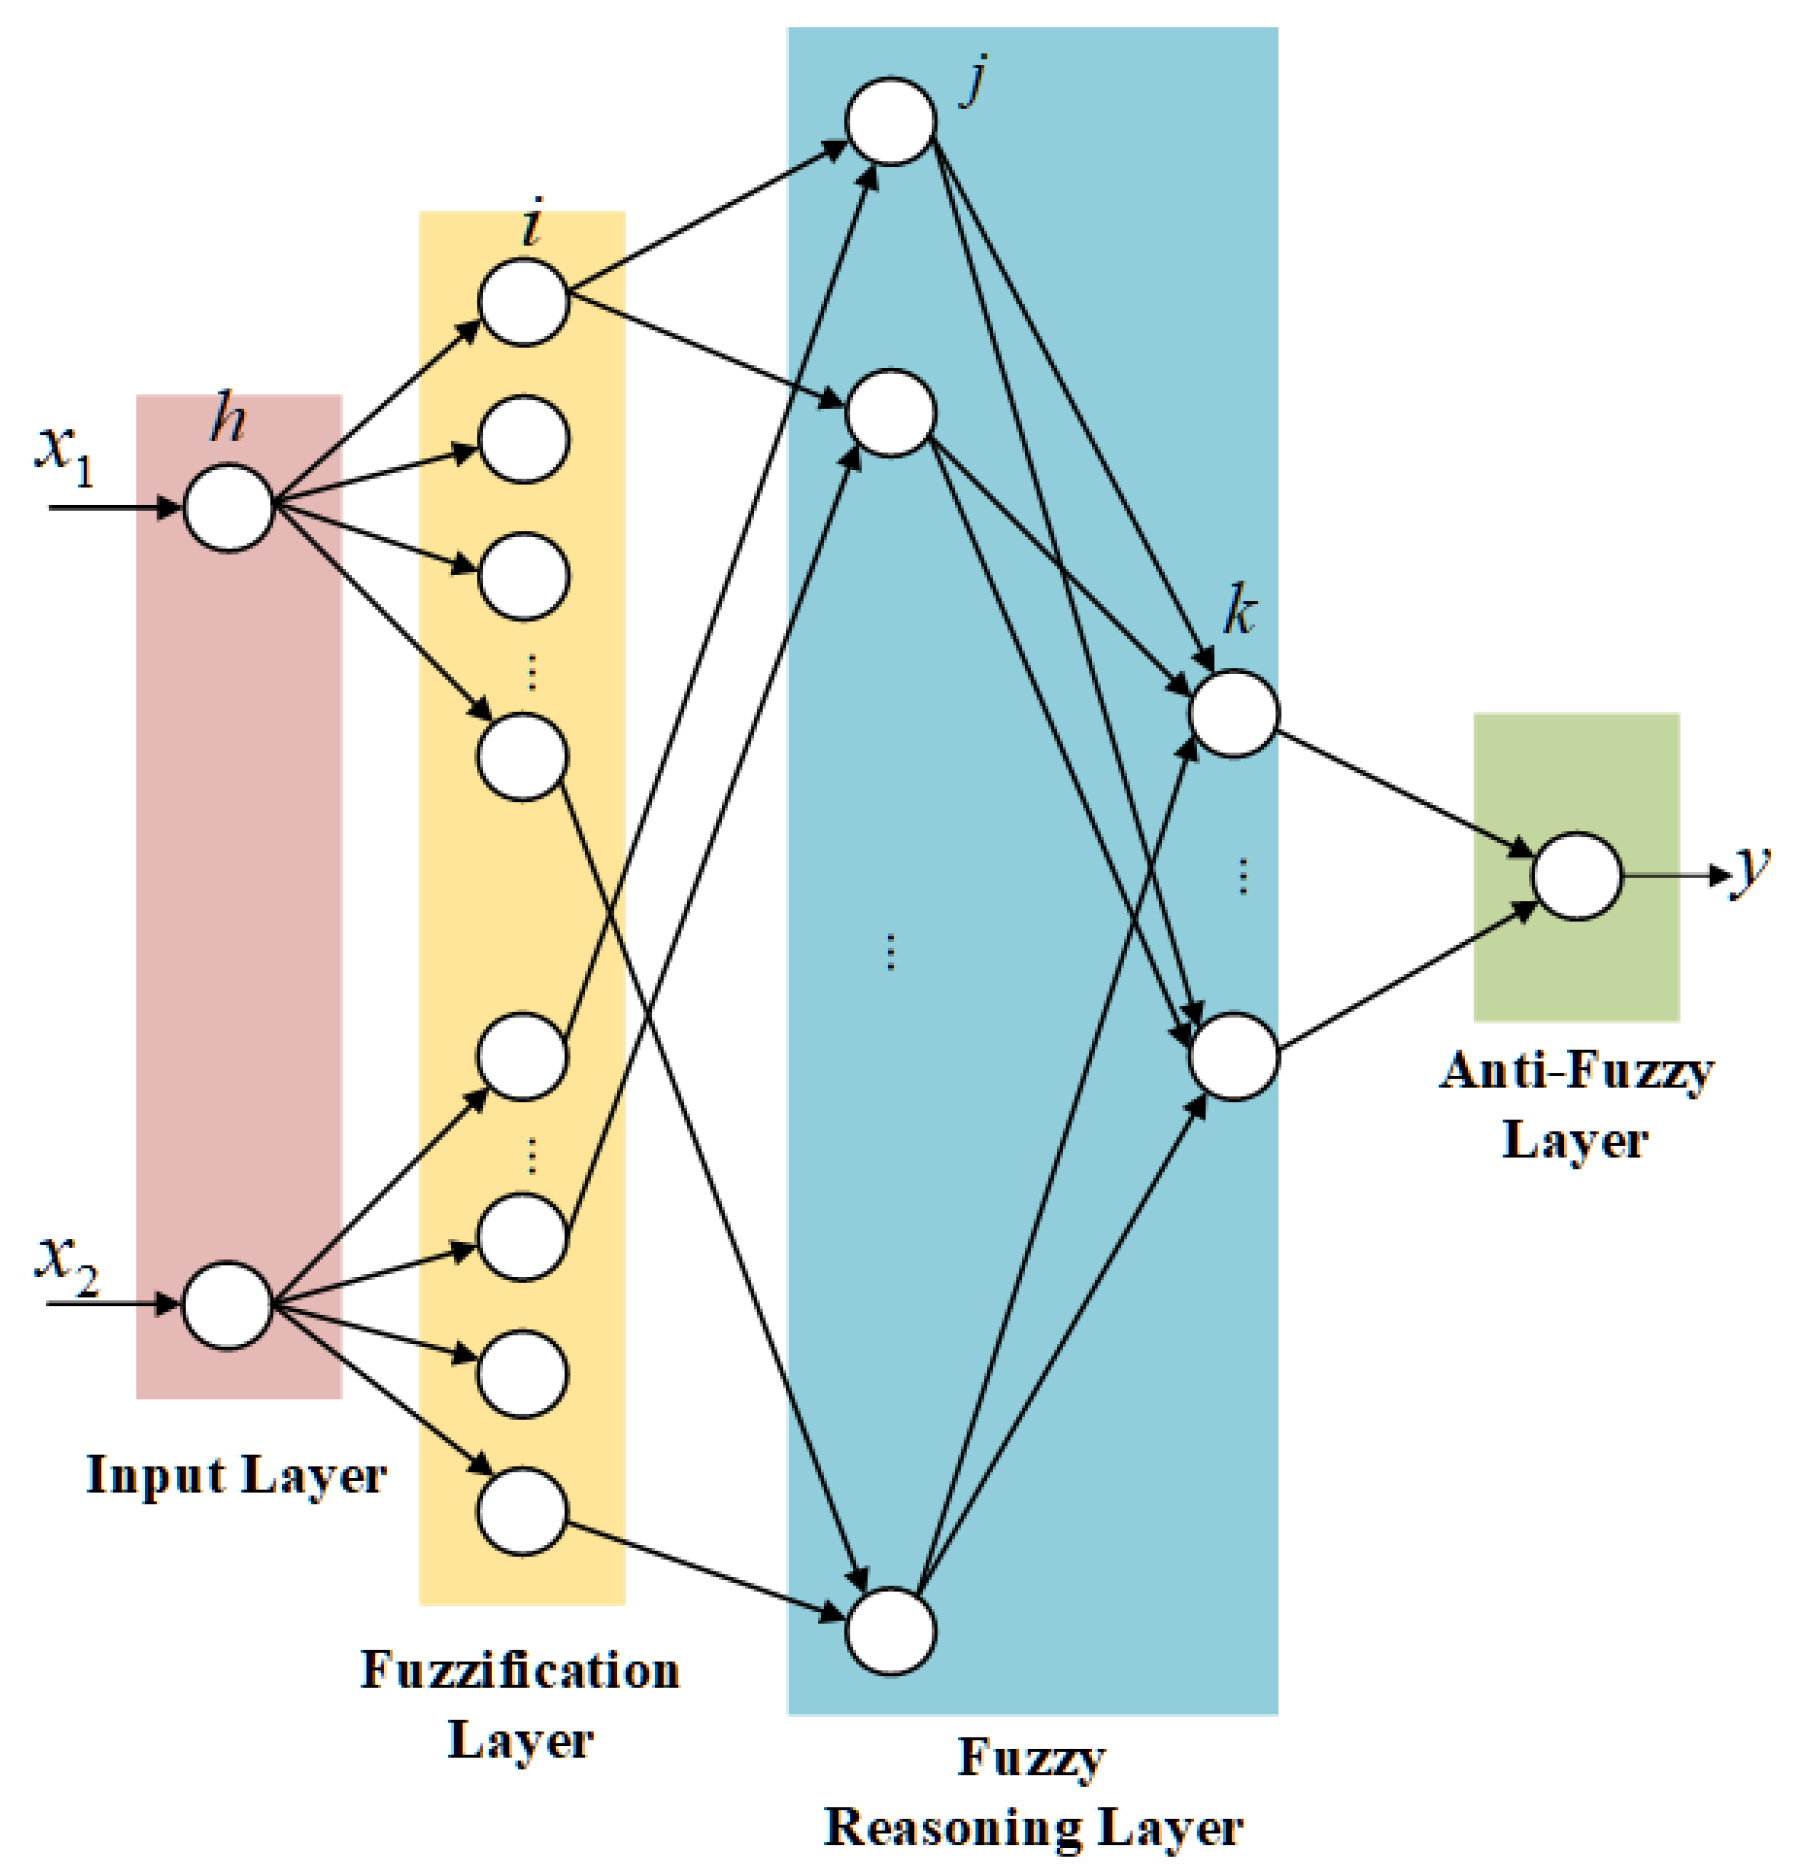
The typical structure of fuzzy neural network is shown in
Figure 9. There are four layers in the structure. According to the function, it is divided into input layer, fuzzification layer, fuzzy reasoning layer and anti-fuzzy layer. The membership function of fuzzification layer and the weight between layers can be adjusted. It can be seen that each layer and each node of the neural network can be combined with fuzzy rules, so that the adjustment of fuzzy rules can no longer rely on subjective experience, and can give clear physical meaning to various parameters in the network structure.
3.3.1. Fuzzy Rules Representation
Firstly, the input of fuzzy neural network controller is load demand power (
Pload) and battery’s
SOC, and the output is diesel generator set power (
PG). By calculating the difference between the load demand power and the power of the diesel generator set, the output power of the power battery pack is derived. Because the diesel generator does not output power when absorbing regenerative braking energy, the load demand power is less than zero. In the design of fuzzy control strategy, the load demand power is divided into five grades from 0 to 950 kW according to the size, and the fuzzy domain is converted to [0,1]. The range of 20% to 80% of
SOC can meet the needs of power battery pack operation, and its domain is defined as [0.2,0.8]. Similarly, the power of diesel generator set is converted to [0,1]. The above rules are transformed into fuzzy logic rules as
Table 2.
Selecting gauss function as membership function of fuzzy rules, as shown in Equation (17):
where
a is the central value of gaussian function;
b is the width value of gaussian function.
The fuzzy neural network is accurately determined according to the results of the selected membership function and rule matching calculation. Therefore, the center value and width value of the Gaussian function are very important for the fuzzy processing of the fuzzy neural network calculation process and the final output result. In the case that the output result cannot reach the expectation, it is necessary to use the learning function of the neural network to set.
3.3.2. Fuzzy Neural Network Controller Structure
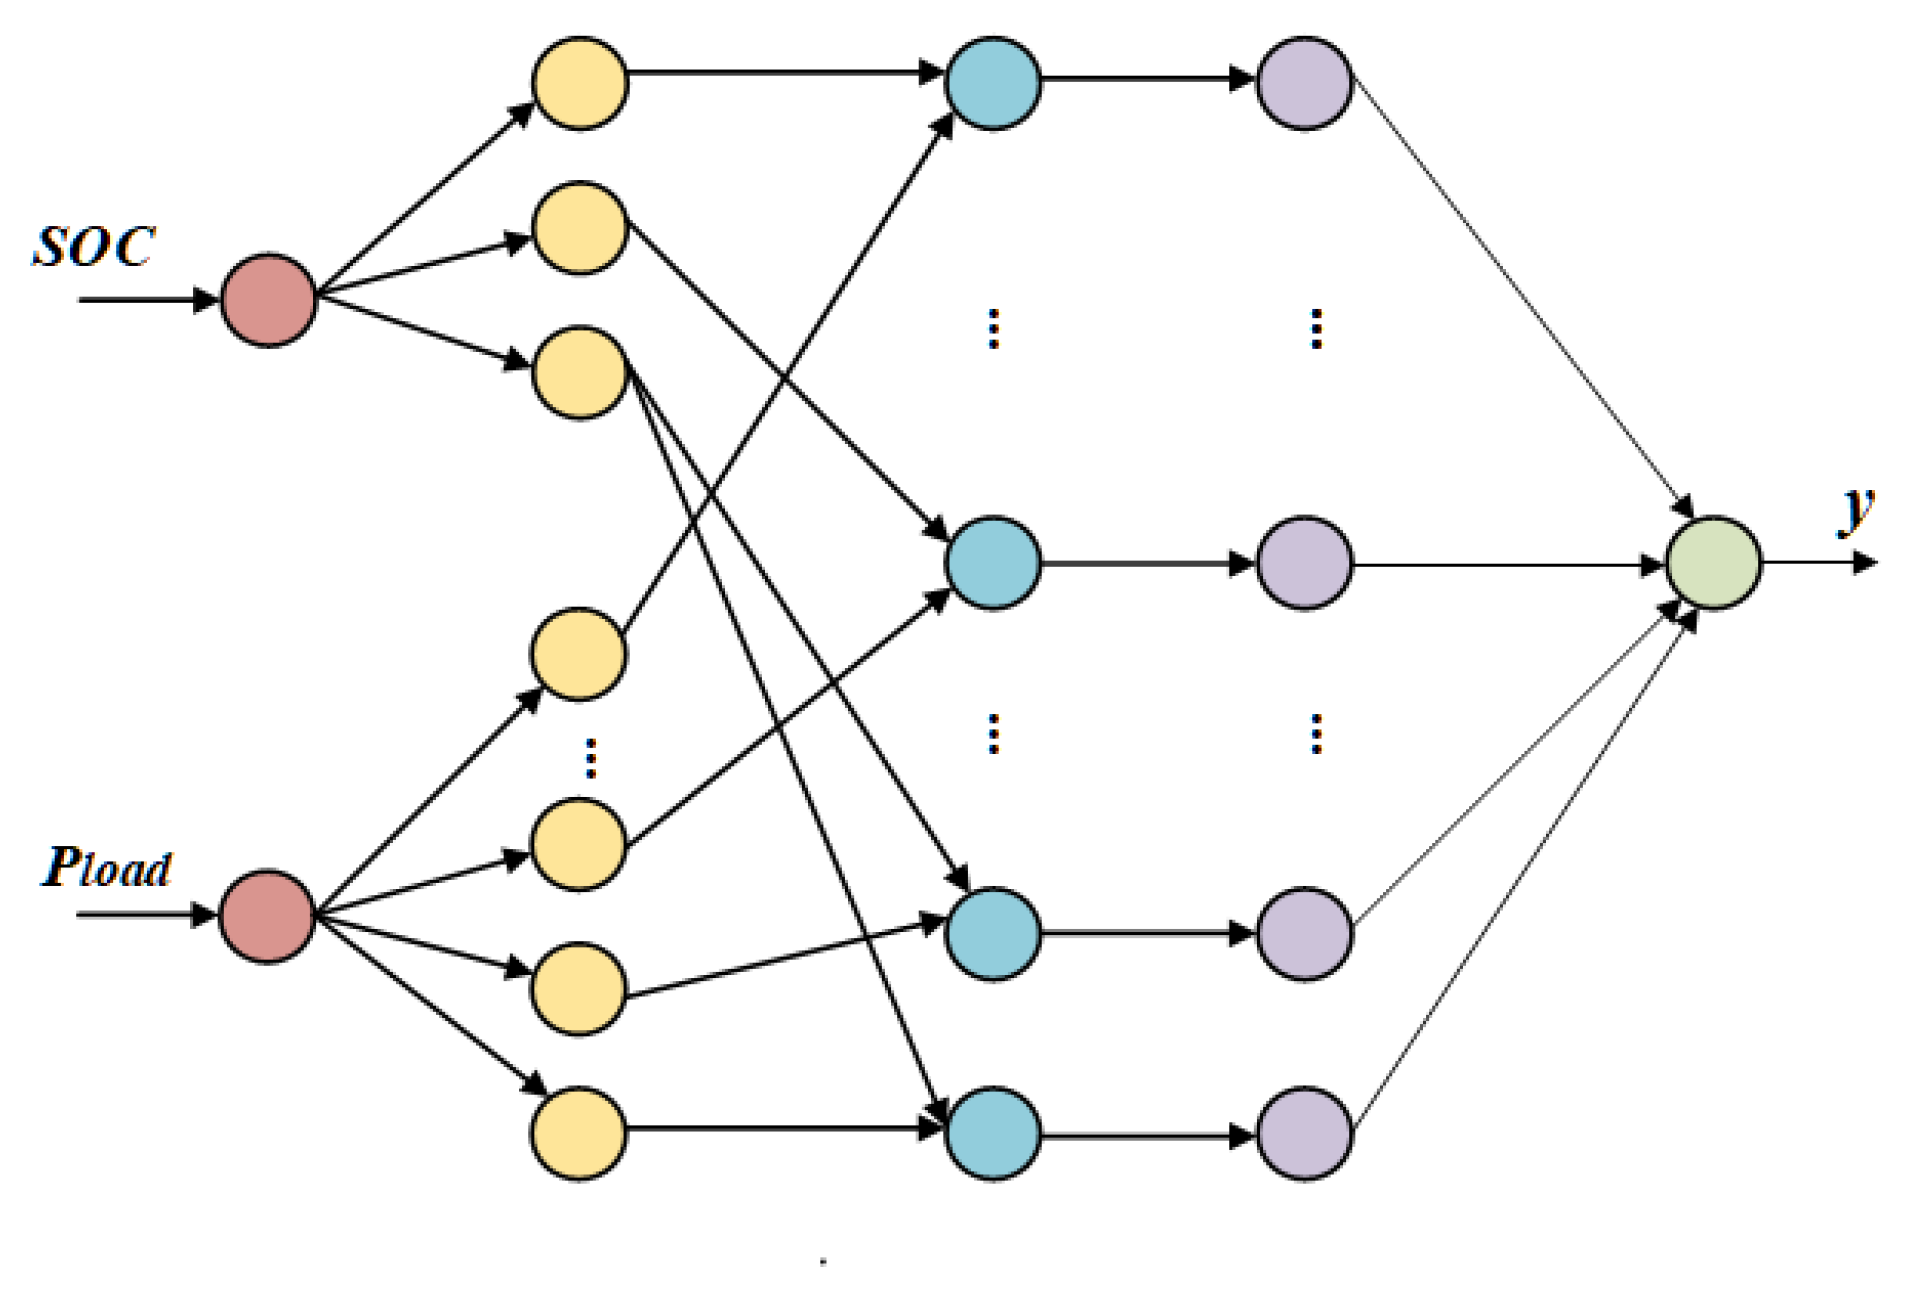
In the fuzzy neural network controller, the load demand power (
Pload) and the
SOC are input variables, and the output variable is the diesel generator output power. In this paper, a fuzzy neural network based on Takagi-Sugeno (TS) model is used. As shown in
Figure 10, T-S fuzzy inference has the advantages of simple calculation and good for mathematical analysis. It is easy to realize the adaptive function of the controller. The controller is composed of antecedent network and consequent network. The function of antecedent network is to match rules and calculate matching weight. The consequent network is a fuzzy rule processing of input variables.
- (a)
Antecedent network
The antecedent network has four layers [
27]. The first layer is the input layer, and the two input variables are the exact values, namely the load demand power (
Pload) and the battery
SOC. After entering the controller structure, it enters the next layer for fuzzification, and the system input has a total of 2 neurons, as shown in Equation (18).
Membership function layer of input variables is located in the second layer, under the effect of fuzzy processing, the input is converted into fuzzy quantity. The battery SOC and load demand power language variables are divided according to the content of the previous section. The fuzzy subset of the power battery pack is {S, M, B}, and the demand power is {VS, S, M, B, VB}. Each node is the language variable defined in the fuzzy rules, so there are 8 nodes.
where
i is the number of input variables;
j is the number of fuzzy partitions.
Fuzzy rules are represented by different nodes in the third layer. The purpose is to match the antecedents of fuzzy rules and calculate the respective applicability of all rules, which is expressed as the product of the output of the previous layer, as shown in Equation (20).
where
i1 = 1,2,3;
i2 = 1,2,3,4,5;
j = 1,2,…,15.
The fourth layer is mainly to realize the normalized calculation, the formula is:
- (b)
Consequent network
The first layer is the input layer, passing input to the next layer. There are 3 neurons in this layer. The first two are the input of the controller, and the other node is a constant value of 1, which aims to prevent the neural network from slow convergence or poor accuracy.
The main task of the second layer is to calculate the consequents of the rules. Each rule can be represented by nodes:
The third layer is the output layer. The role of this layer is to calculate the output of the system, the output only generator output power (PG), so the number of neurons in the third layer is only 1. In the operation of the controller, the weighted summation method is mainly used to output fuzzy consequents. The output of the antecedent network is the weighted coefficient, and the expression is:
3.3.3. Fuzzy Neural Network Learning Algorithm
In order to achieve the purpose that the error between the output result and the expected result is lower than the expectation, the weight coefficient of the fuzzy neural network needs to be optimized and adjusted, that is, the learning algorithm is used to feedback the neural network according to the error result [
28]. The controller uses three parameters for learning adjustment. The three parameters are the width value (
σij) and the center value (
cij) of the membership function (
i = 1,2;
j = 1,2,3), and the connection weight of the second layer of the predecessor network (
pij) (
i = 1,2;
j = 1,2, …,6). When adjusting the weight coefficient, error back propagation is mainly used. In this way, learning can be more efficient. The formula for calculating the error function is as follows:
where t is the target value of the output variable; y is the real value of the output variable.
- (a)
Learning algorithm of consequent network weights pij:
where
i = 1,2;
j = 1,2, …,15;
η is the learning rate,
η > 0.
- (b)
Learning algorithm of center value (cij) and width value (σij) of antecedent network
In the process of studying the antecedent network weight learning, the parameters
pij can be fixed, and the whole controller structure can be simplified as shown in
Figure 11. In the simplified structure, the connection weights of the last layer are usually used to represent different rules in the consequent network, namely
yij =
wij.
The work of fuzzy neural networks also has forward and backward propagation. The input information is first processed by forward propagation, from the input layer to the hidden layer and to the output layer. After that, through the error between the output calculation and the expected value, if the error is not within the expected range, the back propagation is carried out, and the error signal is transmitted from the output layer to the input layer. The learning algorithm is used to adjust the function structure or connection weight to achieve the purpose of reducing the error.
4. Improved Energy Management Strategy of Logic Threshold Rule Based on DP
Since the DP calculation is too vast and the calculation time is too lengthy, this paper takes a 15 km portion of the overall operating state to verify efforts of the proposed EMS, which encompasses the whole cycle of traction, idling, and braking [
24].
Figure 12 depicts the optimum energy distribution results obtained by the DP strategy. For comparison, the results based on a conventional RB strategy are shown in
Figure 13. The DP strategy needs known operating conditions ahead of time and cannot provide real-time control, but the theoretical optimum results may be used as a benchmark for improving rules of RB strategy. The difference of the diesel generator power comparison under the two strategies is shown in
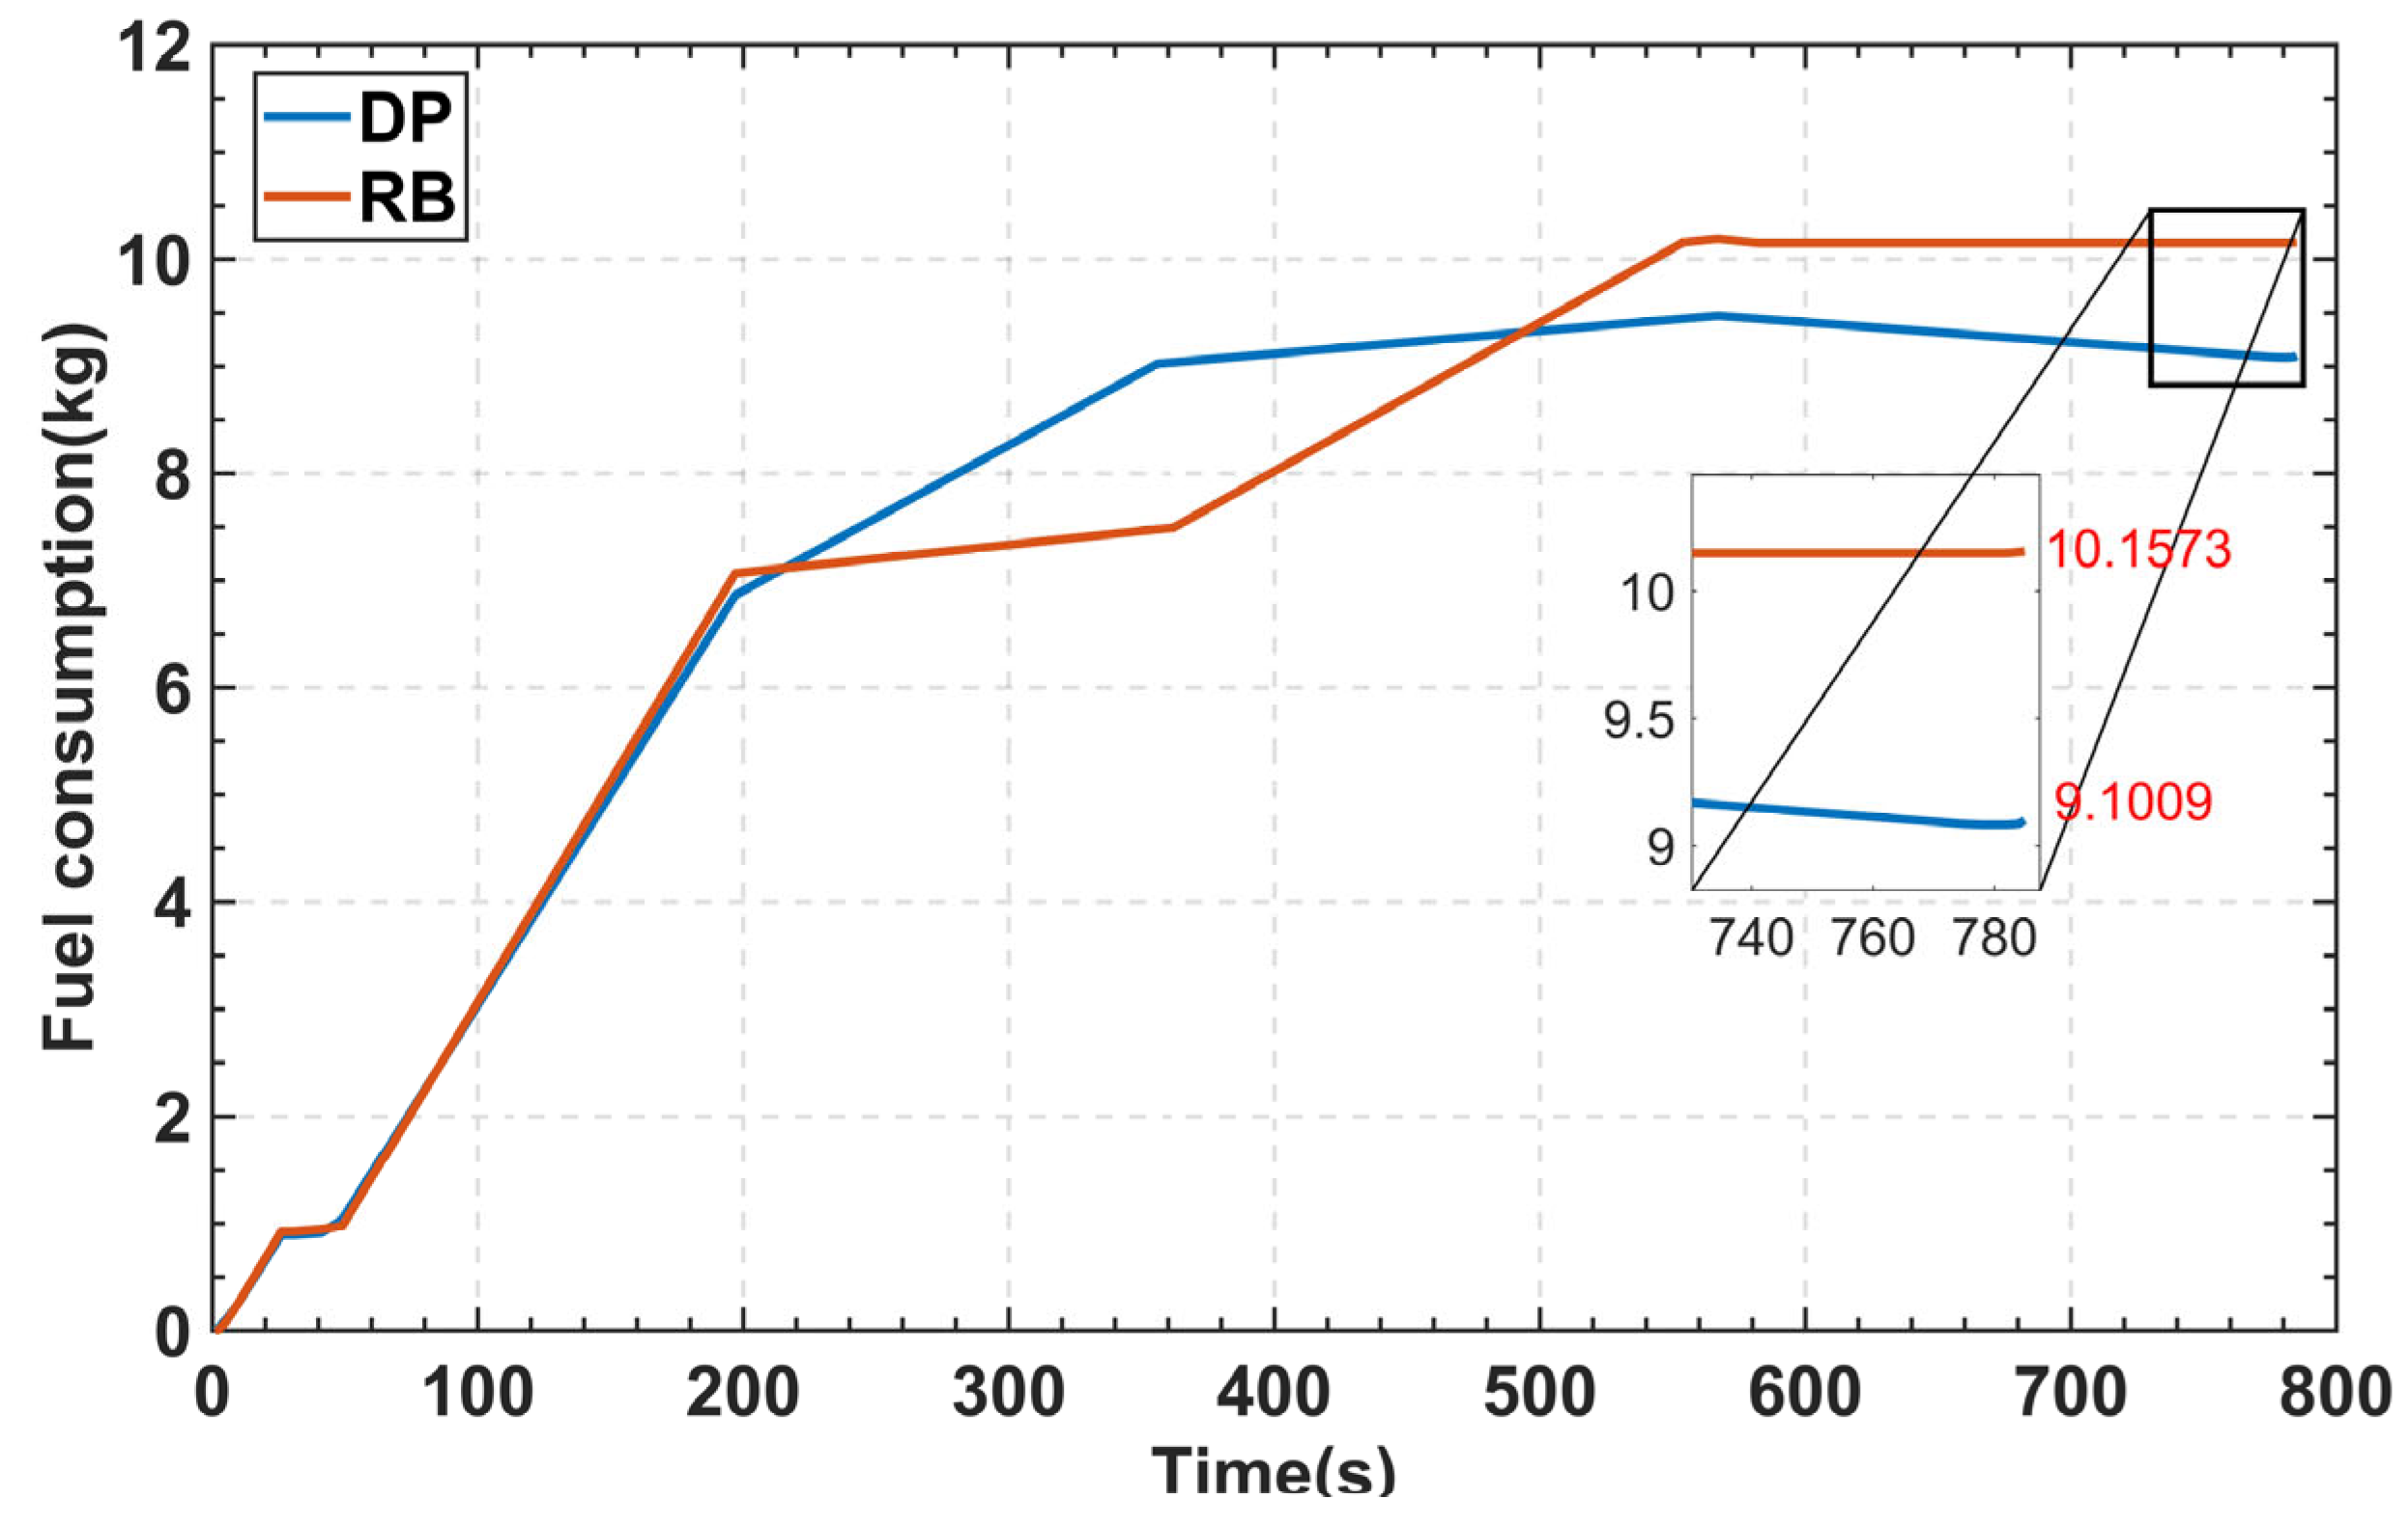
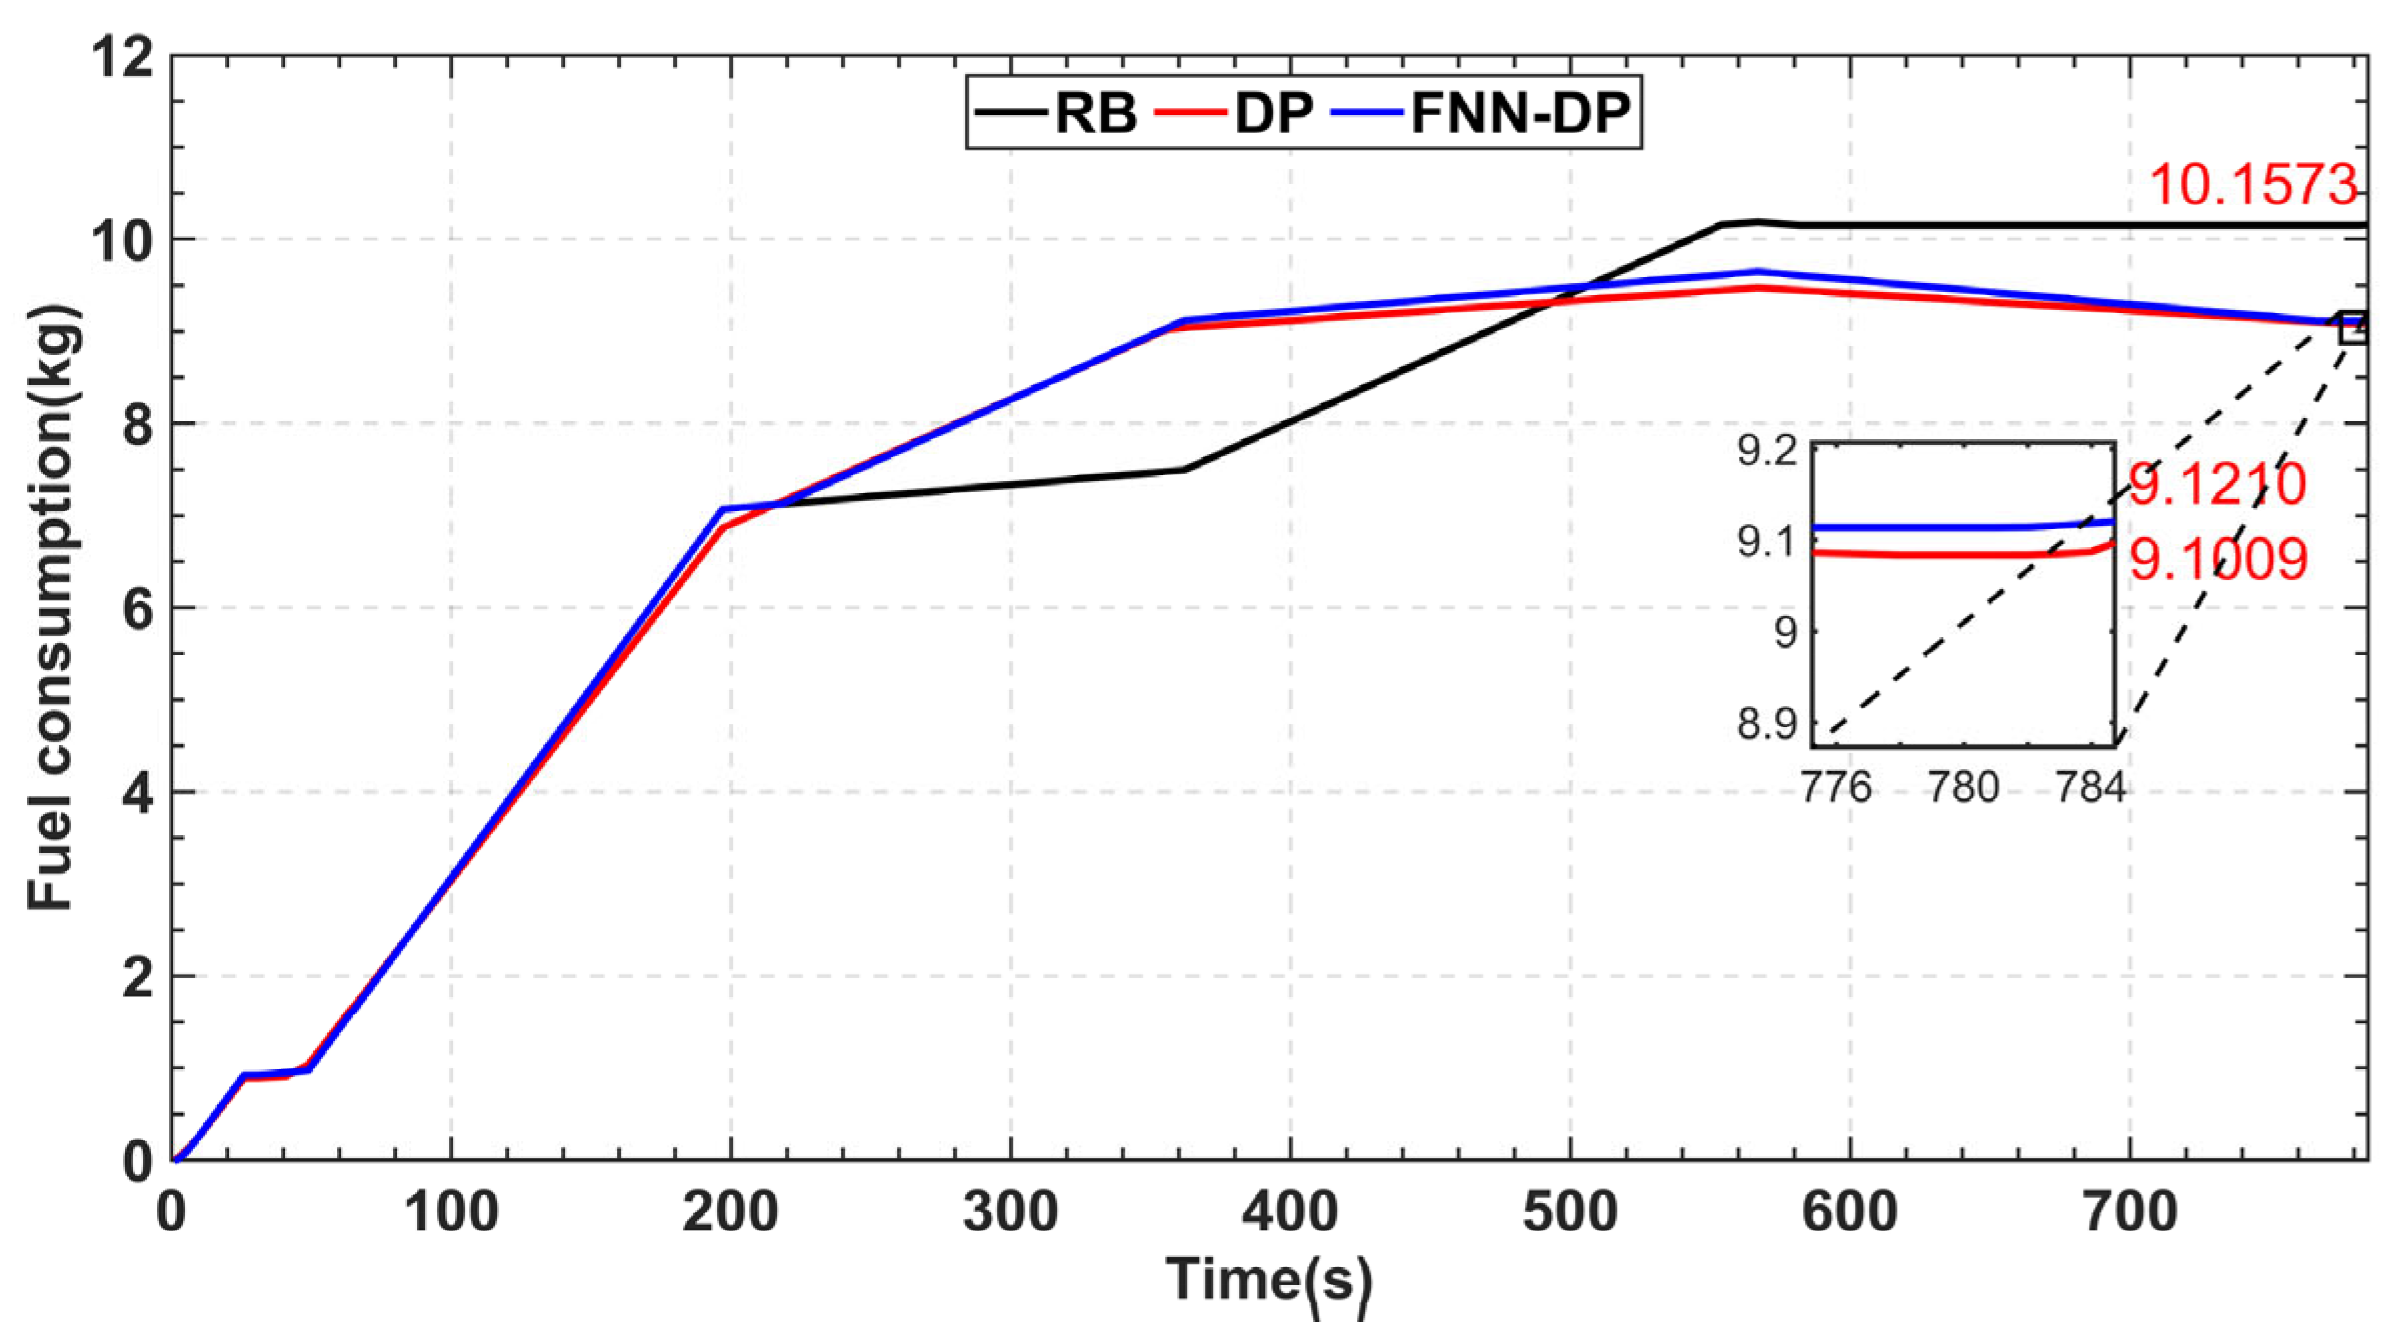
Figure 14. From this figure, the efficiency of diesel generator power under DP strategy is better than RB strategy. The fuel consumption comparison under two strategies is shown in
Figure 15. It can be seen that DP strategy can reduce 1.0564 kg fuel consumption compared with RB strategy.
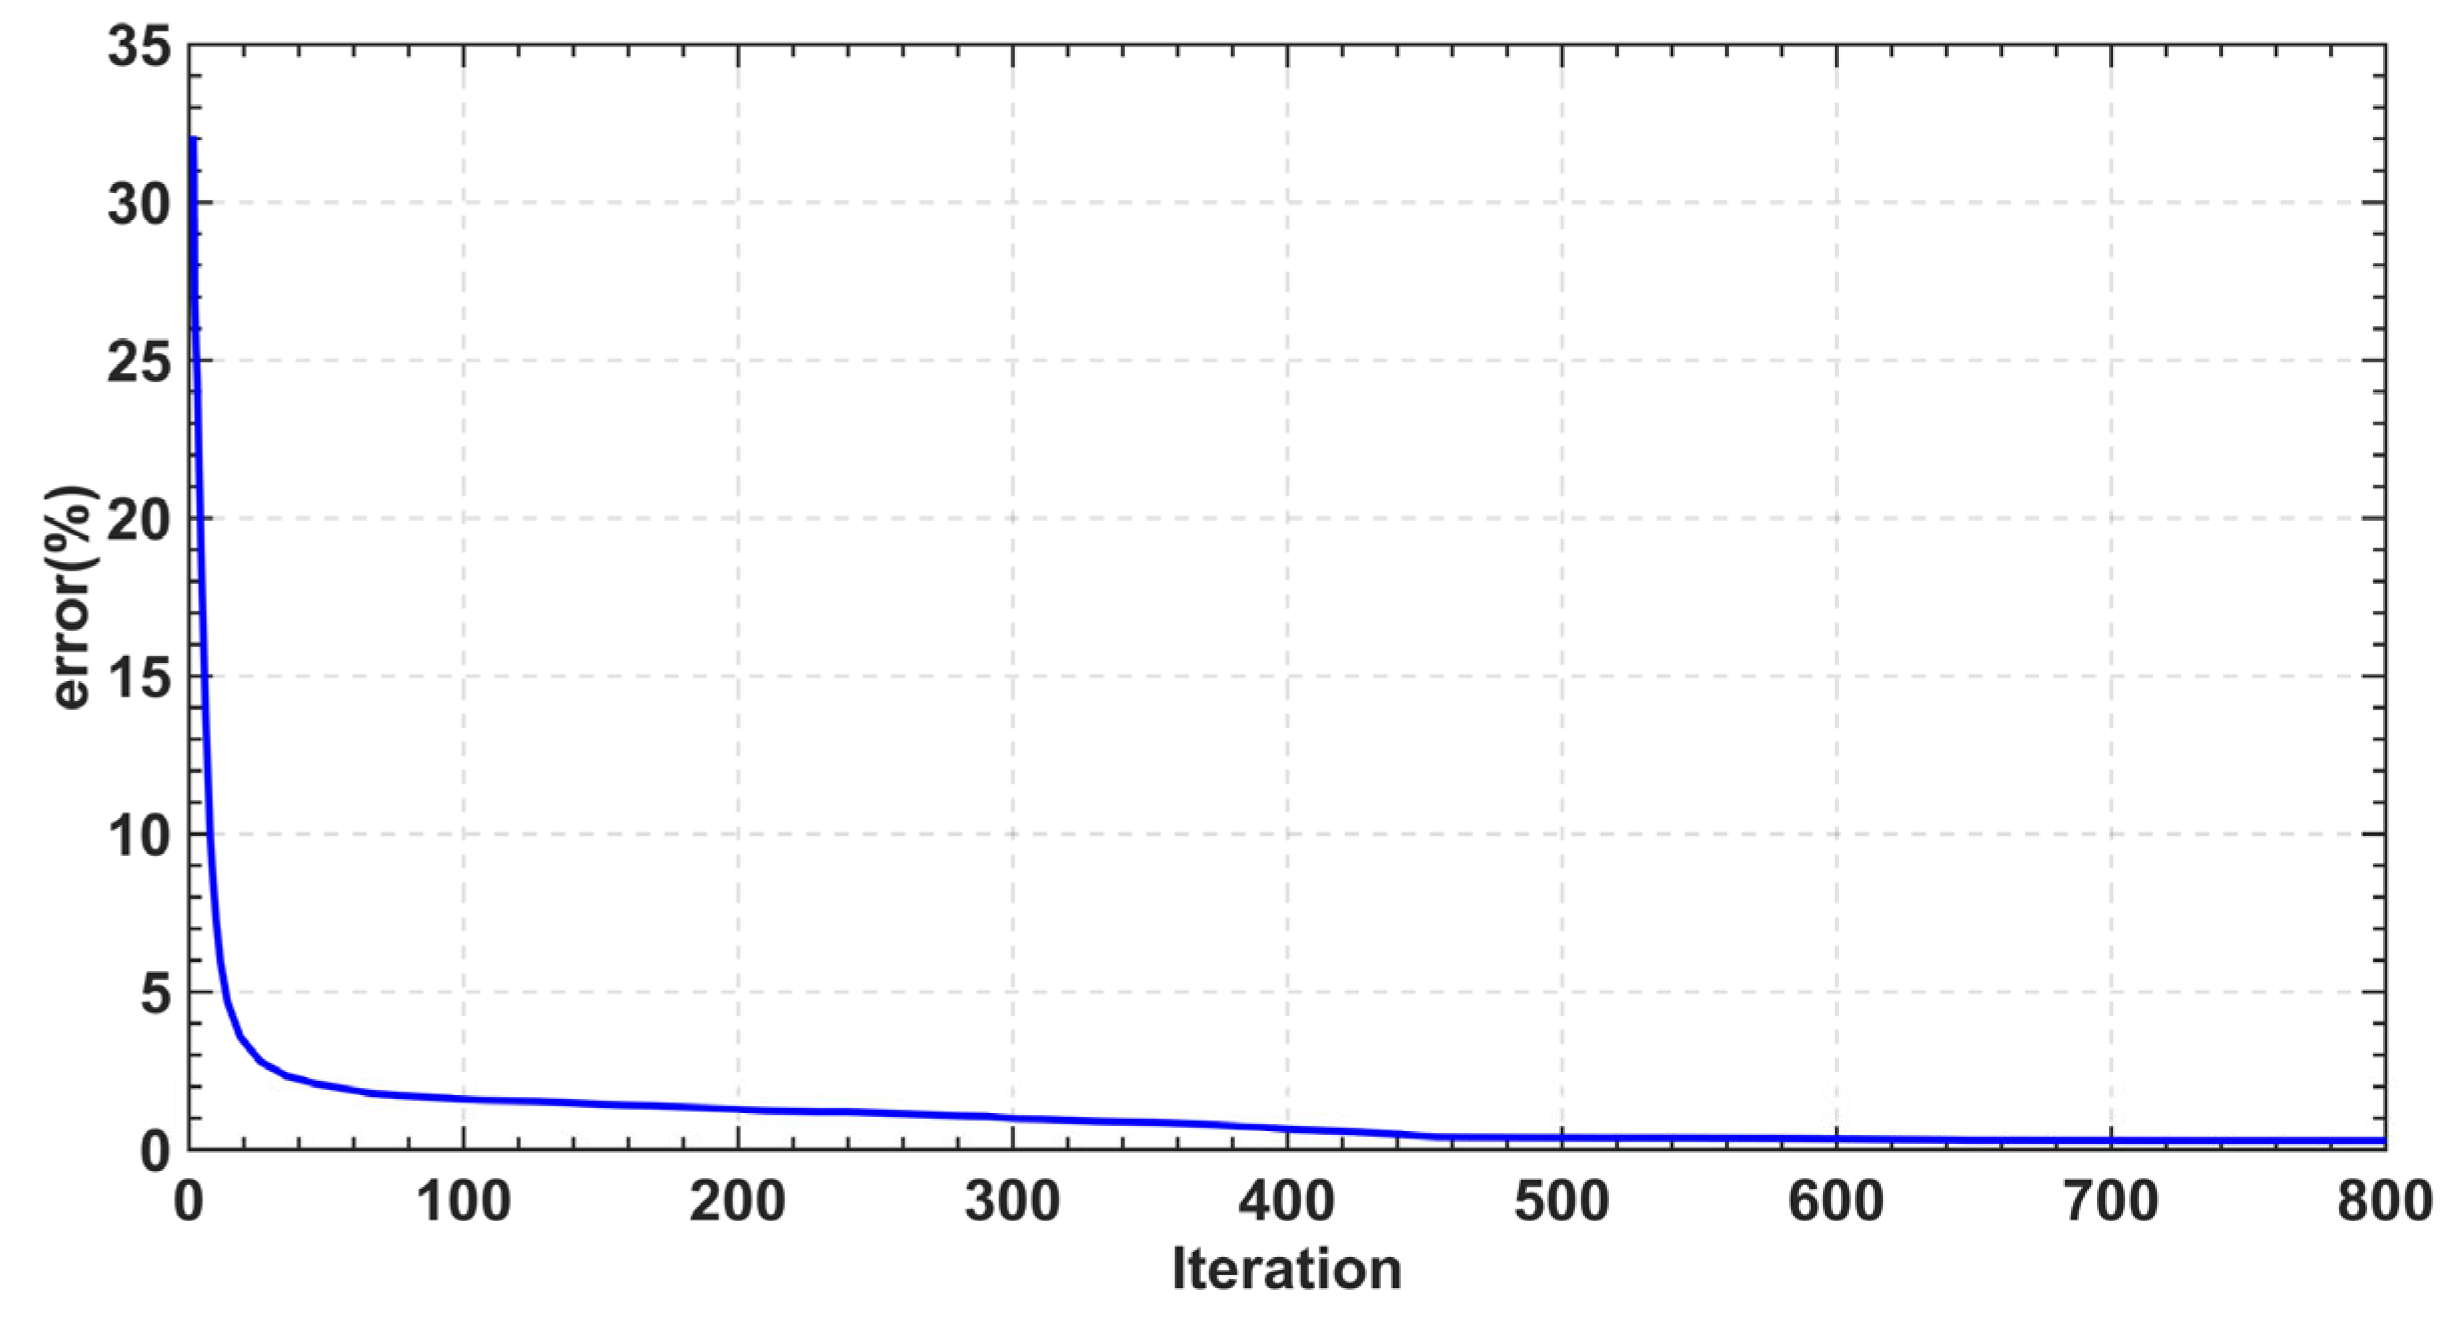
In this paper, the DP results are used as the training samples of the fuzzy neural network. The DP strategy is used to obtain the optimal allocation results of the locomotive running 784 s conditions to train the fuzzy neural network. The number of training iterations is set to 800, and 50 samples are selected as verification samples. From
Figure 16, it can be seen that when the number of training iterations reaches 200, the training error curve has converged, and the error does not exceed 5%. This shows that the fuzzy rules improved by FNN-DP strategy can approximately achieve the global optimal effect of DP strategy.
As shown in
Figure 17, the fuel consumption of FNN-DP is 9.1210 kg, which is about 10.2% less than the RB strategy and similar to DP strategy. It shows that FNN-DP strategy has the fuel saving ability similar to the DP strategy, and can be used in the vehicle real-time energy management instead of the DP strategy.
Figure 18 is the SOC comparison results under three strategies. It can be seen from the figure that the depth of discharge (DOD) of battery based on RB strategy is larger than that of DP strategy and FNN-DP strategy, which will have a negative impact on the service life of battery. The fuzzy control rules trained by FNN-DP strategy based on the energy management results optimized by DP strategy can effectively reduce the DOD of the battery, which is conducive to the healthy work of the battery. In addition, the change of battery SOC under FNN-DP strategy is similar to that of DP strategy, which can also prove that FNN-DP strategy has energy optimization effect similar to that of DP strategy.
5. Conclusions
The core of the energy management strategy for a shunting locomotive’s diesel-electric hybrid propulsion system is to ensure that the responds to the desired demand of the load profile, and the process of energy conversion and transmission is optimized for control on this basis, in order to achieve a reasonable distribution of the power output of each power source system and improve the fuel economy of the entire vehicle, while maximizing the performance of the locomotive.
The advantage of RB strategy is that it is simple to calculate and can be called in real time, but the disadvantage is that the rules are not perfect and cannot guarantee that the system achieves optimal control; the advantage of DP is that it can achieve maximum optimization results, but the disadvantage is that it is computationally intensive, time consuming, and cannot be used offline in real vehicles. Therefore, this paper proposes a FNN-DP strategy, which can optimize fuzzy rules based on the global optimization energy distribution results of DP strategy, in order to meet the real-time optimization and reduce fuel consumption at the same time.
In this paper, the RB strategy and DP strategy are compared and analyzed. Finally, the theoretical optimal solution of DP is used to provide reference and guidance for the FNN-DP strategy, and can achieve improvements in both real-time and fuel savings. The findings reveal that the FNN-DP strategy reduce 10.2% fuel consumption compared with RB strategy, demonstrating the fuzzy neural network’s usefulness. The fuel saving effect of FNN-DP strategy is similar to that of DP strategy, realizing the formulation of real-time rules that approximate global optimization. At the same time, according to the SOC comparison results under the three strategies, the FNN-DP strategy can effectively reduce the DOD of the battery, which is conducive to the healthy work of the battery.
Based on the research work in this paper, the proposed energy management strategy can be applied to 100% green energy electric locomotives in the future. By using new energy such as hydrogen fuel cells and batteries to form a hybrid power system, pollution-free electric locomotive drive is realized.

 ,
, 


