1. Introduction
The modern world is heavily reliant on electrical power, making it a critical component of our infrastructure [
1]. However, power systems are susceptible to various types of faults, including short circuits, voltage fluctuations, equipment failures, and environmental disturbances [
2]. These faults can lead to power outages and equipment damage, and even pose risks to public safety [
3]. The economic and social consequences of power faults are significant, emphasizing the need for robust fault detection and diagnosis methods.
Efficient fault detection techniques are essential to mitigate the impact of power faults. Rapid identification and localization of faults allow power grid operators to take corrective actions promptly, reducing downtime and minimizing economic losses [
4]. Furthermore, early fault detection can prevent cascading failures and ensure the stability of the entire power system. Therefore, the development of accurate and reliable fault detection methods is of utmost importance in the field of power system engineering.
Various methods have been proposed for power fault detection over the years [
5], encompassing a wide spectrum of approaches. These range from traditional techniques like rule-based systems, which rely on predefined heuristics and thresholds, to more advanced methodologies such as machine learning and data-driven methods [
6]. Expert systems, for instance, are designed to harness human knowledge by encoding expert rules, enabling them to detect faults with a certain degree of expertise [
7].
Support Vector Machines (SVMs), on the other hand, provide a potent tool for classification tasks, including fault detection, by identifying optimal hyperplanes for separating different classes [
8]. Recent years have witnessed the ascendancy of Convolutional Neural Networks (CNNs) and Graph Neural Networks (GNNs), particularly in the realms of image- and graph-based data, where their capabilities have shone in power fault detection [
9,
10].
Naive Bayes, rooted in the principles of Bayes’ theorem, employs probabilistic reasoning to make predictions based on statistical probabilities, making it a valuable addition to the arsenal of fault detection methods [
11]. On the other hand, the simplicity and effectiveness of k-Nearest Neighbor (KNN) lie in its ability to classify data points based on the majority class among their nearest neighbors, a feature that makes it an attractive option for many applications, including power fault detection [
12].
Despite their promise, each of these methods comes with its own set of limitations that can impede their effectiveness. Traditional rule-based systems, characterized by their reliance on predefined heuristics, can struggle to adapt to dynamic conditions and are often ill suited to the management of complex, interconnected power systems. Deep learning techniques like CNNs and GNNs frequently require large quantities of labeled data for training, posing significant challenges in the context of power system fault detection. Furthermore, the performance of KNN can be highly sensitive to the choice of distance metric and the number of neighbors selected, making it important to fine-tune these parameters for optimal results. Additionally, one common drawback shared by many of these methods is their lack of interpretability, making it challenging to gain insights into the underlying causes of detected faults.
While these methods have advanced the field of power fault detection, the need for fault detection techniques that are both interpretable and adaptable to the complex, evolving nature of modern power systems remains unmet. The inability to gain a deep understanding of why certain faults are detected and the challenges in adapting existing methods to new conditions underscore the necessity for innovative approaches.
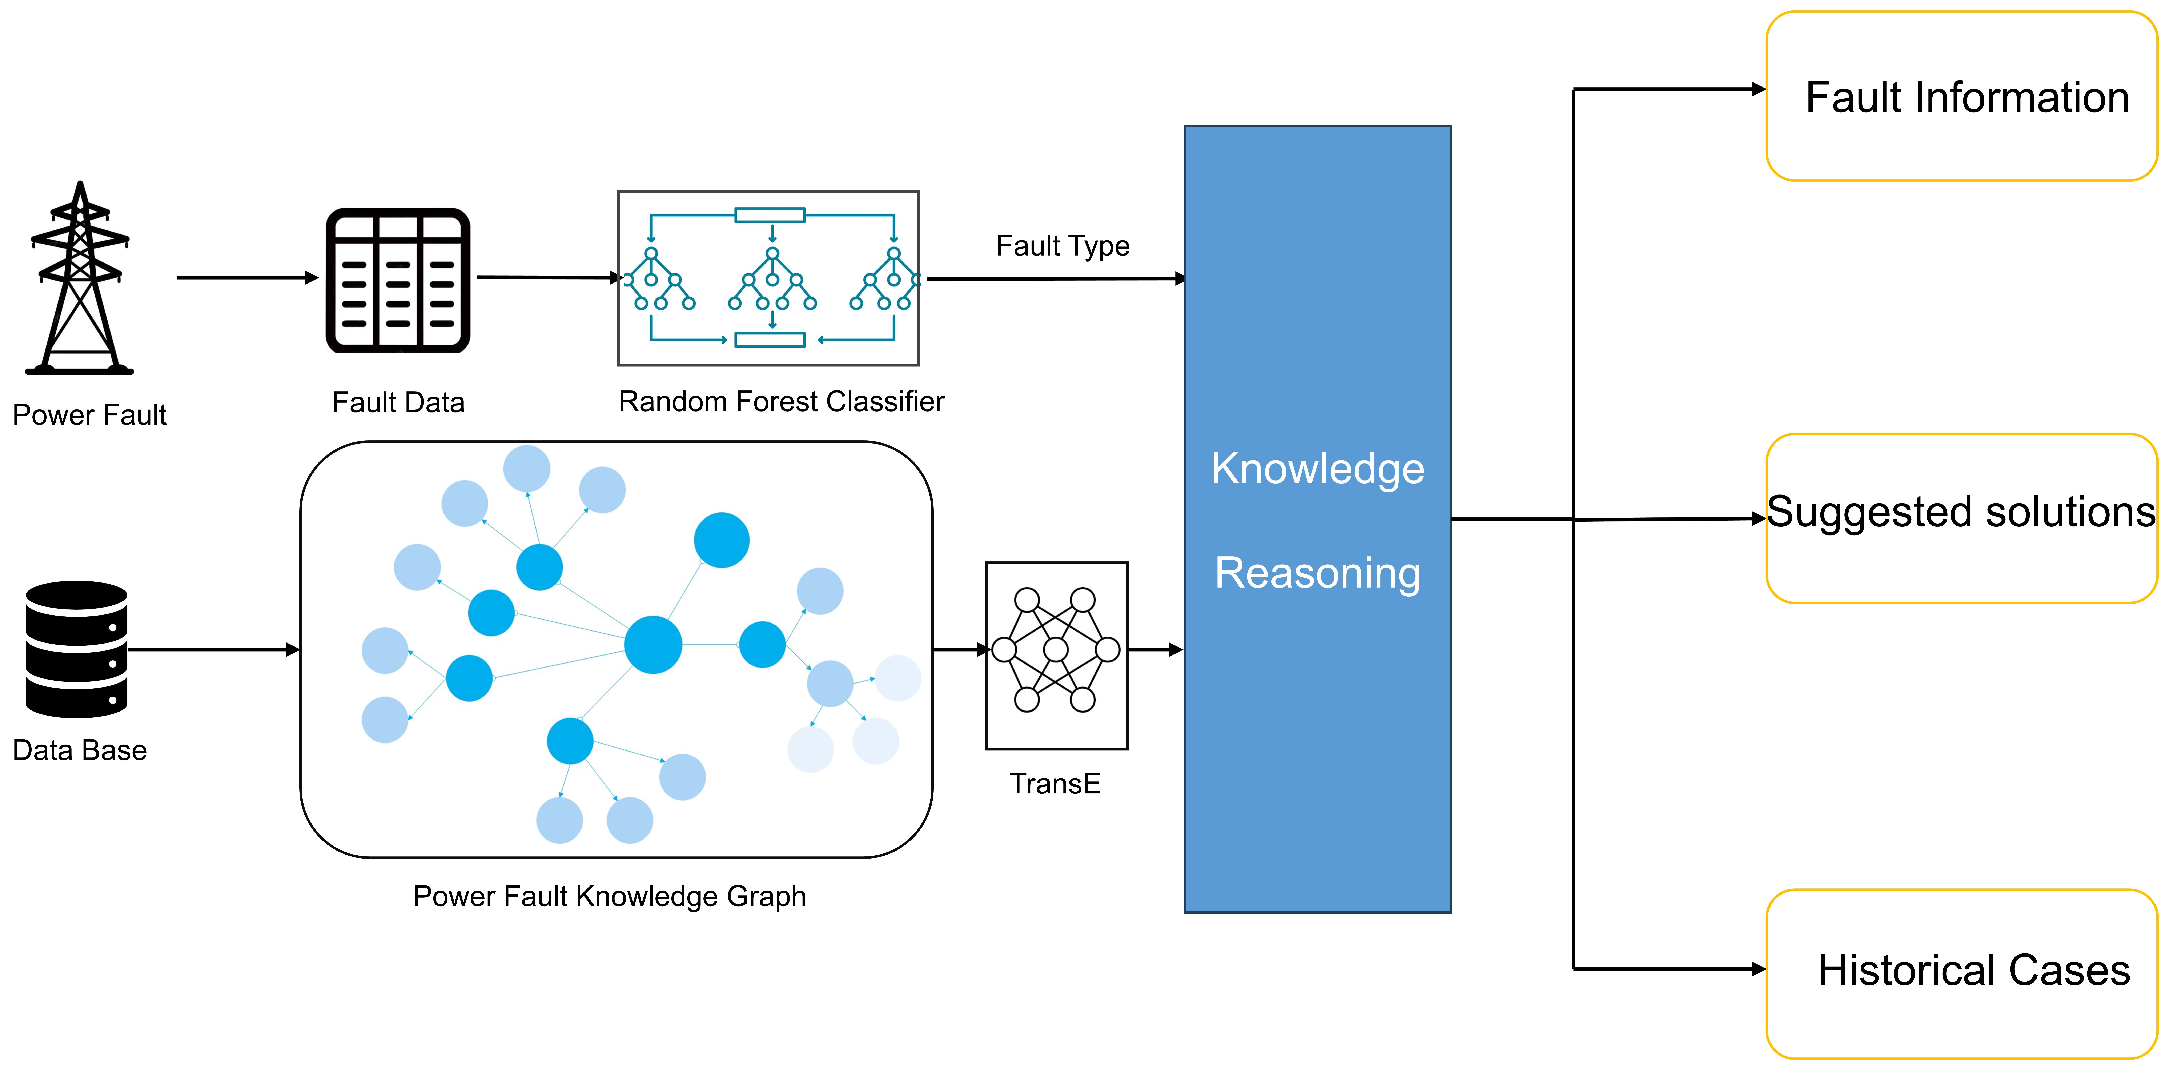
This paper introduces a novel approach to power fault detection that aims to overcome the limitations of existing methods. As shown in
Figure 1, our proposed method leverages the power of knowledge graphs, which allows us to represent and model the complex relationships and dependencies within power systems. By capturing the knowledge of experts and historical data, we create a structured representation of the power grid, making it easier to identify and analyze faults.
To enhance the accuracy and robustness of our approach, we integrate knowledge graphs with the power of random forests, a machine learning ensemble method. This combination allows us to harness the strengths of both approaches, leveraging the structured knowledge encoded in the graph while benefiting from the predictive power of random forests. The result is a powerful and adaptable fault detection model that can handle the intricacies of modern power systems.
In the subsequent sections of this paper, we will delve into the details of our proposed knowledge-graph-based fault detection method, its implementation, and its performance evaluation. We believe that this approach holds the potential to significantly improve the reliability and efficiency of power fault diagnosis, ultimately contributing to the stability and resilience of our electrical power systems.
3. Power Fault Graph
The knowledge graph of a power fault is a comprehensive representation of various aspects related to electricity disruptions [
18]. It encompasses the causes, consequences, and preventive measures associated with power outages. Through interconnected nodes and links, the graph organizes and visualizes the intricate network of factors, such as equipment malfunctions, natural disasters, and human errors, that can result in power failures. This knowledge graph provides a valuable resource for understanding and analyzing power disruptions, aiding in their prevention and facilitating prompt resolution when they occur [
19].
3.1. Graph Construction
Constructing a power fault knowledge graph involves four essential steps: data acquisition, knowledge extraction, integration, and quality improvement [
20,
21]. The process is shown in
Figure 3.
Data acquisition involves gathering information from diverse sources such as books, the internet, and expert experience to obtain domain-specific knowledge on power faults.
Knowledge extraction employs techniques like crawling, parsing, and fact extraction. Crawling systematically browses sources, parsing organizes and structures data, and fact extraction identifies specific factual information related to power faults.
Integration combines the extracted information to construct a coherent and interconnected knowledge graph. This process includes knowledge linking, establishing relationships between information, and knowledge fusion, merging diverse knowledge sources to ensure consistency and avoid redundancy.
Quality improvement enhances the constructed graph’s overall quality. It includes knowledge completion and correction. Knowledge completion fills gaps or missing information by leveraging additional sources or expert input, while knowledge correction rectifies inaccuracies or errors for reliable information.
3.2. Power Fault Knowledge Graph Framework
The electric power domain’s knowledge graph framework consists of four indispensable components: the equipment entity graph, the concept graph, the business logic graph, and the fault case graph [
22]. The equipment entity graph comprehensively captures detailed information about physical assets and devices within the power system, thus enabling a holistic view of the infrastructure.
Incorporating semantic knowledge, the concept graph augments the power fault knowledge graph by defining relationships and associations between equipment entities, significantly enhancing reasoning capabilities. Meanwhile, the business logic graph integrates operational rules and regulations, providing guidance for the power system’s operation, monitoring, and maintenance practices.
Furthermore, the fault case graph serves as a repository of historical and simulated data, housing fault records, potential causes, and diagnostic outcomes. This repository facilitates timely fault detection, diagnosis, and resolution.
Collectively, these components synergize to create a comprehensive and dynamic power fault knowledge graph. This knowledge graph is pivotal in optimizing system performance and bolstering the reliability of power systems.
4. Random Forest Algorithm
In recent years, machine learning techniques have gained significant attention in the field of power fault detection due to their ability to handle complex and non-linear patterns in power system data. The Random Forest (RF) classifier, a popular ensemble learning algorithm, has shown promise in this regard for its ability to handle high-dimensional power fault data [
23]. This section explores the application of RF classifiers for power fault detection. We delve into the principle of the algorithm, discuss parameter settings, and present experimental results, including comparative experiments with other algorithms, along with the evaluation of their performance.
4.1. Principle of the Algorithm
Random Forest is an ensemble learning algorithm that is widely used for classification tasks. It is based on the idea of decision trees and combines multiple trees to make robust predictions. The key principles of the Random Forest algorithm are as follows.
Decision trees: Random Forest is built upon decision trees, which are simple models that partition data into subsets based on feature values. Each tree learns from a random subset of the training data and features, making them less prone to overfitting [
24].
Bootstrap aggregating (bagging): Random Forest employs a technique known as bagging, where multiple decision trees are trained independently on different subsets of the training data with replacements. This diversity helps reduce variance and improve overall accuracy.
Random feature selection: Another crucial aspect of Random Forest is the random selection of a subset of features at each node of the tree. This randomness further reduces the correlation among the individual trees and leads to better generalization.
Voting or averaging: In the classification task, Random Forest combines the predictions of individual trees by either majority voting (for classification) or averaging (for regression), resulting in a final prediction.
4.2. Parameter Settings
To effectively apply Random Forest to power fault detection, appropriate parameter settings must be chosen. Some key parameters are listed below (
Table 1).
4.3. Experimental Design
To assess the effectiveness of Random Forest in power fault detection, we conducted experiments and compared its performance with other algorithms commonly used in this domain, including Support Vector Machines (SVMs), k-Nearest Neighbor (KNN) and the Bayesian classifier (BC). Due to the small sample size, a four-fold cross-validation technique was employed to maximize data utilization and mitigate overfitting. The performance of each algorithm was evaluated using various metrics such as the accuracy, precision, recall, F1-score, and confusion matrix (shown in
Figure 4,
Figure 5,
Figure 6 and
Figure 7).
All simulation experiments were conducted in the Python-PyCharm Community, Edition 2022, and the MATLAB 2022b environment on a computer featuring a 5.4 GHz Intel (R) Core (TM) i9-13900 CPU, 16.0 GB RAM, and 64-bit Windows 11.
4.4. Results
We obtained 66 sets of fault data after simulation using a power fault model. We used 30% of the data as a test set and the rest as a training set. The results are as follows (
Table 2).
Our experimental results indicate that Random Forest classifiers exhibit superior performance in power fault detection compared to the alternative algorithms. In conclusion, the application of Random Forest classifiers in power fault detection has shown promising results, owing to its robustness, generalization capabilities, and ease of parameter tuning.
4.5. Statistical Analysis
In order to test whether the RF algorithm is statistically significantly different from the other algorithms, we employed the Friedman test to assess the statistical significance. Subsequently, Nemenyi’s follow-up test was conducted to determine significant differences between algorithm pairs.
Table 3 presents the results of Friedman’s test for the accuracy, recall, precision, and F1-score metrics.
The
p-values in
Table 3 indicate significant differences (
p < 0.05) among the algorithms in terms of classification performance on the four data subsets. Based on this observed significance, the Nemenyi follow-up test examines specific algorithm pairs.
Figure 8,
Figure 9,
Figure 10 and
Figure 11 display Nemenyi test results, revealing that RF significantly outperforms other algorithms in accuracy, recall, and the F1-score. Notably, RF exhibits superior performance compared to SVMs and the other two algorithms across various metrics.
In conclusion, the statistical analyses confirm the superiority of the proposed RF algorithm over alternative methods, demonstrating an enhanced classification performance.
6. Power Fault Diagnosis and Decision-Making Model
These diverse model’s results were integrated into a robust and all-encompassing framework for fault classification, detection, and decision support within the intricate domain of electric power systems. The primary dataset comprises power fault data, meticulously collected and preprocessed, which are then subjected to an advanced machine learning approach, namely the Random Forest classifier. This classification step serves as a crucial initial gatekeeper, as it effectively discerns the specific category or nature of the fault occurrence, allowing for precise diagnosis.
Subsequently, the identified fault type becomes the linchpin of a more elaborate knowledge reasoning model. This model acts as an intellectual cornerstone, facilitating operators and engineers to access many domain-specific insights and recommendations. These insights include historical patterns, potential root causes, recommended mitigation strategies, and even expert guidance on handling similar incidents. This dynamic fusion of data-driven classification and knowledge-driven reasoning empowers decision makers to make well-informed choices and respond swiftly to electrical power faults.
This comprehensive end-to-end solution optimizes the entire workflow, streamlining the process from raw fault data to effective solutions. In doing so, it significantly elevates the operational efficiency, reduces downtime, and ultimately contributes to the reliability and sustainability of the electric power infrastructure.
7. Discussion and Limitations
7.1. Discussion
We propose a combined model. It enables automatic output of the corresponding fault type and various information related to the fault based on the observed time-series voltage data. One of the primary contributions of our research is the substantial improvement in fault diagnosis accuracy. Our integrated model, which employs a Random Forest classifier as a fault detection algorithm, has demonstrated a substantial enhancement in the precision of fault identification. Through extensive testing and validation, we have consistently achieved accuracy rates exceeding 90%, outperforming modern machine-learning-based approaches.
Another important result is the successful incorporation of domain knowledge into our fault diagnosis process. Our model’s knowledge base includes a comprehensive repository of historical data, industry standards, and expert-generated rules. This ensures that our system not only detects faults but also provides a more contextually relevant understanding of the issues at hand. We believe this integration of domain knowledge sets our approach apart from other purely data-driven methods and significantly contributes to the interpretability and reliability of our results.
Our method also excels in terms of interpretability, which is essential for power grid operators who need to understand the reasoning behind fault diagnoses. The system provides detailed explanations for its decisions, showing how it arrived at a particular diagnosis. This transparency allows operators to trust and act upon the provided insights, reducing the risk of human–machine miscommunication.
Furthermore, our solution’s scalability is a key feature. We have designed the system architecture to be modular and flexible, allowing it to seamlessly incorporate improvements in fault detection and knowledge-reasoning algorithms. As these algorithms evolve and improve, our model’s accuracy and effectiveness will continue to increase. This scalability ensures that our system can adapt to the evolving demands of the power industry, which is characterized by an ever-expanding power grid and the constant need for efficient fault diagnosis and handling. It also makes our solution future-proof, positioning it to play a pivotal role in the ongoing transformation of the power sector.
7.2. Limitations
Limited by experimental conditions, the fault data in this paper are mainly from the simulation of power system faults in the IEEE 14-bus system, and thus the data quality is not high enough. However, due to the good robustness and generalization ability of the Random Forest classifier, the performance would be maintained if trained with better quality data. In addition, we have only explored the voltage data observed under the six basic fault types, and although this essentially covers most fault situations, other fault types, such as complex faults caused by combinations of several basic fault types, still exist. There are limitations under some certain situations.
8. Conclusions
In conclusion, our study has introduced a novel combined model that leverages the synergy between knowledge graphs and machine learning algorithms, achieving a higher level of integration and automation compared to prior research efforts. This combined model integrates two specialized sub-models for fault detection and knowledge reasoning, both of which have demonstrated a strong performance.
The key contributions of our research lie in providing end-to-end solutions for the classification, diagnosis, and handling of most basic fault types. As a modular model, it excels in terms of modularity, specialization, and flexibility, allowing for easy adaptability to various fault scenarios.
While our model showcases advantages in interpretability and scalability, there is room for improvement. Future research directions include enhancing the quality and scale of our dataset, improving the knowledge reasoning model to accommodate complex relationships, refining the fault detection algorithm for greater accuracy, and extending the model’s capabilities to diagnose and handle more complex fault types. Addressing these areas in future work will further bolster the model’s performance and expand its applicability to a broader range of fault scenarios, contributing to the ongoing advancement of fault detection and handling in power systems.


