1. Introduction
Modern societies have grown increasingly reliant on a wide array of electrical and electronic devices. Devices designed for transmitting, storing, and processing information play a pivotal role in this context. These devices have become integral components of the intricate systems that underpin the proper functioning of economies. The wide array of telecommunications services available today is a direct outcome of significant technical and technological advancements in both science and industry.
Proliferation and potency of broadcasting and radio communication systems are rapidly escalating worldwide. This phenomenon naturally accompanies the advancement of civilization. The operation of telecommunications and ICT systems fundamentally involves the deliberate emission of electromagnetic energy bearing valuable information, such as radio transmitters, television transmitters, and ICT transmitters. From the perspective of electromagnetic ecology, these trends are in direct conflict with ecological conservation measures. Nowadays, with this degree of resource loading of the electromagnetic environment, the problem of electromagnetic smog is emerging in larger urban areas [
1]. The intensity of electromagnetic energy saturation in our surroundings, stemming from both deliberate and unintentional sources, has given rise to the realization of a theory formulated over 50 years ago, which explores the possibility of harvesting electrical energy from the surrounding space to power sensor [
2,
3,
4] controllers of environmental parameters or electronic biomedical components. An interesting solution for using energy from the electromagnetic environment has been presented in [
5]. The electromagnetic signal of the environment, which is usually considered as electromagnetic noise, can be a good trigger source to realize tactile sensing, which can be used in many application areas.
In line with the concept of energy harvesting, it is possible to extract, store, and reuse energy to power a specific category of electronic systems, particularly those with minimal energy consumption. The energy available in the surrounding space exhibits spectral characteristics. Within the allocated frequency bands utilized by ICT and communication systems, energy is concentrated, with a density at −25 dBm/m
2 that already permits its utilization for harvesting. This energy will suffice for the operation of electronic components and systems. Energy for harvesting can be acquired from widely available mobile radio communication systems, in particular mobile and wireless telephone systems, data communication wireless systems, terrestrial television systems, and also radio broadcasting systems [
6,
7].
Mobile phone systems are systems that represent a potential energy harvesting resource. Energy from this system can be continuously harvested and is available everywhere with an intensity varying based on the distance from the base station. As per system’s specifics, the area is divided into cells, with a base station at the centre with an allocated subset of channel frequencies and transmitted signal strengths. Regarding potential energy harvesting possibilities, an important parameter characterizing each base station and mobile terminal is the maximum power of its transmitters for the different classes of equipment and allocated frequency bands. Power and frequency values are defined in the radio system specifications. The ranges of occurrence of electromagnetic fields with limiting values in the vicinity of mobile phone base station antennas depend on the power supplied to their antennas and the radiation characteristics of these antennas. The characterizing parameter here is the equivalent isotropic radiated power (EIRP). Near typical mobile base stations, electromagnetic fields with defined limits extend no more than a few tens of meters from the antennas themselves, considering their installation height. The distance of several tens of meters applies specifically to the axis of the antennas’ main radiation beams. The axis of the main radiation beam of an antenna is a straight line drawn through the electrical centre of the antenna in the direction of the main radiation beam of that antenna. The direction of the antenna’s main radiation beam coincides with the direction containing the direction of maximum radiation [
8,
9,
10].
When exploring the potential for energy harvesting in terrestrial TV systems, we must now focus on digital TV systems, which have replaced analog TV systems. Antenna systems consisting of half-wave dipoles or so-called panel antennas (especially for the UHF band) are used for signal transmission. To attain the maximum possible range and minimize losses caused by scattering elements, antenna signals are mounted on masts up to 50 m above the ground. Furthermore, natural terrain elevations are used when installing transmitters to increase coverage. Transmitters are located in both urban and rural areas. The ranges of electromagnetic fields with acceptable values in the vicinity of radiocommunication equipment depend on equipment’s operational frequency, the radiation characteristics of the transmitting antennas, the elevation at which these antennas are suspended and, in particular, the radiated power [
11].
Another potential source of energy harvesting could be wireless data networks based on the IEEE 802.11 standard [
12], commonly abbreviated as WiFi. This standard encompasses several variants (with the most popular being 802.11a, b, g, n, ac). The 802.11ac version of this standard currently supports data transfer rates of up to 1 Gbps. This standard operates on publicly available frequencies 2.4 GHz (for 802.11b and 802.11g) or 5.2 GHz (for 802.11a) bands. As a result, specific restrictions exist on the allowable power levels for transmitted signals in these frequency bands. Without a radio license, radio equipment can be employed as long as the effective isotropically radiated power does not exceed an EIRP of 100 mW (20 dBm) for the 2.4 GHz band, 200 mW for the 5.150–5.250 GHz band, and 1 W (30 dBm) for the 5.47–5.725 GHz band. Wireless local area networks (WLANs) are typically designed for indoor operation, and wave propagation in such environments is unique due to the numerous obstacles along the propagation path, such as walls, windows, doors, etc. [
13].
In this paper, the possible parameters of an energy acquisition system designed for a semi-passive RFID tag have been thoroughly investigated [
14]. The aim of the research results is to ensure the proper operation of such a tag both in the configuration/operation mode within the RWD programmer-reader field of the RFID system and the fulfilment of the system’s data acquisition and storage tasks under specific field conditions available in other commonly used telecommunication systems [
15,
16,
17,
18].
The authors proposed a new concept of measurement method using the symmetry of the transmitting antenna characteristics of this system to increase efficiency and enable automation of work in the SAC chamber.
2. Methodology and Test Setup
To establish detailed configuration guidelines and define the operational scope of the system accurately, it is essential to determine and verify the parameters of the energy recovery system. This includes assessing its ability to interact effectively with other system components, notably energy conditioning and storage, while ensuring optimal performance and efficiency within these processes, in addition to determining these properties under laboratory conditions, based on a parallel study of energy recovery capabilities. The study was conducted through simulation and experimental verification of the actual levels formally available at randomly selected locations under real conditions and considered as a reference level. This approach ensures the realism of the results obtained and the practical relevance of the formulated conclusions [
19,
20,
21].
Powercast Corporation’s P1110 chip was selected as the harvester circuit for the semi-passive identifier’s energy harvesting and storage system. The chip is considered universal, designed to operate at frequencies from 902 to 928 MHz, as indicated by the manufacturer data. Nevertheless, test results indicate that the chip’s operational frequency range can extend significantly beyond this, contingent on the type and parameters of the external antenna.
The P1110 chip was selected, even though the similar P2110 offers significantly better parameters, including the useful input signal level. According to the manufacturer, the P1110 operates at −5 dBm, while the P2110 functions correctly at an input signal as low as −11.5 dBm. However, the P2110 type circuit is equipped as standard with an on-board inverter that cannot be switched off. Operating typically at input voltages of 1.25 to 1 V (max. 1.8 V for high input signal levels) at the storage capacitor terminals, the inverter prevents this voltage to increase. Within the adopted energy harvesting and conditioning system concept, this voltage level is insufficient for proper system operation. Furthermore, implementing a two-stage conversion using both an internal and external converter becomes problematic due to decreasing efficiency.
The P1110 circuit, lacking built-in power conditioning, provides greater flexibility for adapting the parameters of the identifier circuits that work with it. This avoids the need to align with the requirements of an integrated inverter circuit. It should be noted, however, that the P1110 chip has a built-in output voltage control circuit (
Figure 1), which is also an over-voltage protector with the ability to set the limiter trip threshold voltage from 1.235 V to 4.2 V by connecting a resistor to the VSET pin. Additionally, the 4.2 V and 3.3 V voltages can be automatically configured by shorting the relevant selector pin to GND. The maximum output voltage of 4.3 V satisfies the safety requirements for any circuit employed in the designed system. Comprehensive information on Powercast Corp. harvesters can be found in the manufacturer’s references [
22,
23].
The tests were conducted in the TDK anechoic chamber in the Electromagnetic Compatibility Laboratory of the Department of Electronic and Telecommunications Systems of the Rzeszów University of Technology (Poland). In addition to the evident rationale for selecting this test stand location, it should be emphasized that model energy harvesting systems in the currently available design operate at a frequency of 915 MHz, with the analyzed band extending up to approximately 100 MHz. Given domestic regulations, generating fields within this frequency range and at intensities of up to 10 V/m outside of an anechoic chamber would be both unacceptable and a legal violation under laboratory conditions. As part of the research, a collection of apparatus was utilized, including devices for generating electromagnetic fields for electromagnetic immunity tests, probes for measuring field intensities, and equipment for remotely measuring relevant research parameters. The view of the complete test stand in the anechoic chamber is presented in
Figure 2. On the floor of the anechoic chamber, a set of absorbers is installed to absorb radiation reflected within the chamber. This enhances field uniformity around the tested systems by eliminating (suppressing) the effects of unfavourable multipath propagation of the signal from the antenna.
The main equipment used in the research was the EMS_1GHz system. Most of the equipment of this system is located in a measurement rack, permanently placed in the amplifier room next to the anechoic chamber. The system includes an SMB 100A generator, a BBA 100 power amplifier, an NRP2 power meter with NRP-Z11 measuring probes from Rohde&Schwarz (Munich, Germany), and an HL046E antenna located in the chamber (
Figure 3).
The HI6005 from ETS-Lindgren was used to measure the strength of the generated electromagnetic fields (electric field). Although the isotropic probe measurement method used in field measurements (Rohde&Schwarz TS-EMF System for the measurement of electromagnetic field radiation levels, available at the EMC Laboratory of RUT) is one of the more accurate methods for determining the level of an electric field in the analyzed space, it is associated with extended measurement durations. Hence, it was decided to use the above-mentioned probe, with a slightly lower sensitivity, but with the capability of simultaneous, significantly faster measurement of all components of the electromagnetic field. This probe is capable of measuring the electric field strength in the frequency band from 100 kHz to 6 GHz with dynamics from 0.5 V/m to 800 V/m (
Figure 4).
This probe offers the advantage of rapid measurements (acquisition rate: one measurement of all components per second) and the capability of analyzing all three components of the electromagnetic field simultaneously. Using optical interface for data exchange and the system for obtaining energy to power its components from the laser light flux enables the substantial reduction in the interface’s impact on the measurement results.
Taking advantage of the fact of field homogeneity in the measurement area of the SAC chamber, it was assumed that with the knowledge of the antenna characteristics and confirmation of its symmetry, the measurement system could be significantly simplified and work could be accelerated. As can be seen in
Figure 2b, both the measurement probe and the device under test (harvester) were placed symmetrically in the main axis of the antenna radiation. The distance from the axis was chosen experimentally so that the result of measuring the field strength generated by the system with the probe is not affected by the presence or absence of the device under test. The symmetry of the antenna characteristics then ensures that the signal level measured by the probe and the signal level affecting the harvester are equal their mutual influence is minimized.
The selected harvester was tested in an evaluation board provided by the harvester chip manufacturer, Powercast Corporation (Pittsburgh, PA, USA). Test layouts are available for both versions of the energy harvesters [
24,
25]. Antennas are also included, facilitating the evaluation of the varying characteristics of this crucial component in the energy harvesting circuit. The two mentioned versions of the antennas are available as standard, although it is feasible to attach other devices of this type, designed and manufactured to meet the required specifications, using the SMA connector. The parameters of the standard antennas are summarized in
Table 1.
The evaluation board allows versatile configuration of the tested harvester facilitating convenient testing in all operational modes provided by the supplier. The view of the evaluation board is presented in
Figure 5. Ultimately, the harvester system will be implemented into the structure of the energy acquisition and storage system. However, at the stage of research, the adopted solution is more flexible and allows for swift modification of the measurement system. Externally, the necessary components such as capacitors, load resistors, voltage, and current measurement points, etc. were connected to the system under test using a suitable prototype board. The complete, ready-to-use measurement system is showcased in
Figure 6.
Voltage and current measurements at the test points were made using four-channel NI 9215 remote analog measurement data acquisition modules from National Instruments with a sampling frequency of 500 ks/s and a resolution of 16 bits.
The module was placed in a chamber in a well-shielded box. Control and data readout were accomplished through an optical USB connection, minimizing any potential adverse impact of the measurement system on the results. Data were efficiently recorded using the SignalExpress application from NI, allowing for easy processing and presentation of the measurement results.
3. Results and Discussion
Simultaneously, an experimental study was conducted to analyze the electromagnetic field levels generated by common wireless communication systems, with the goal of determining the expected electric field strength in the environment. The analysis was carried out at selected locations in the city of Rzeszów (a city of 200,000 inhabitants in southeastern Poland). The objective of this research was to ascertain the anticipated levels of electromagnetic field strength in public spaces for the purpose of energy harvesting.
Considering the unique characteristics of signal generation in individual systems and their dynamic change over time, all measurements at each of the selected points were conducted for a duration of 6 min, following the standards’ recommendations for measuring electromagnetic field emissions from ICT systems. The RFEX software package (ver. 3.2.0) from Rohde&Schwarz employed during the measurements allows for simultaneous measurement of electric field strength, power density, and range indicator (
Figure 7).
At two locations (including the Campus of Rzeszów University of Technology), significant exceedances of the range indicator were obtained at randomly selected measurement points. These exceedances are correlated with high levels of electric field strength in individual bands, but the values do not exceed 7 V/m. In the majority of the analyzed measurement points, particularly in the case of the GSM1800 and UMTS2100 systems, the electric field strength exceeded 1 V/m. For points without direct line-of-sight to antenna masts, the average electric field strength was measured at 0.5 V/m with a standard deviation of 0.2 V.
Based on these measurements, several assumptions were formulated to guide further development of the energy recovery systems, including their conditioning and energy harvesting in the storage system. All tests were carried out with reference to the field strengths expected in the future application areas, but occasionally modified to gather additional data on the Powercast Corp. harvester system itself. This explains the different ranges of electric field strengths (or energy densities, which represent the electromagnetic environment parameters under steady-state conditions in the so-called far field, adopted in the individual measurements).
This enables a more accurate depiction of field fluctuations and, simultaneously, facilitates the assessment of the “energy richness” of the medium at the selected location. In addition, these data were extended with the value of the range indicator
W, which makes it possible to relate the obtained measurement results with the permissible levels defined by the relevant regulations for individual frequency bands. The range indicator
W determines the degree of energy loading of the selected frequency band as per the following formula:
where
W is the indicator value of the range of occurrence of electromagnetic fields with values higher than the permissible values,
En,
Sn—the measured or determined resultant values, respectively, of the electric field strength and of the power density in the individual frequency bands,
Egn, Sgn—the permissible levels of the electric field strength and of the power density in the individual frequency bands, respectively.
If the indicator value W is equal 1, it defines the limit of the radiated zone of an electromagnetic field with a permissible value at a specific point. If W < 1, there is no radiation in the area exceeding the permissible levels. As evident from the test results, satisfactory field strengths from the point of view of potential harvesting are closely related to approaching or exceeding the limit value of the permissible electric field strength (power density).
Throughout the measurements, the output signal level of the generator of the EMS_1GHz set was adjusted so that the measuring probe in the room recorded the required level of electric field strength (power density). At the same time, the output power level supplying the HL046E antenna system was monitored to assess the current VSWR standing wave ratio and the overall system’s safety. Considering the antenna’s characteristics, the signal frequency’s impact on VSWR, and the limitations of the real-world chamber, this verification helped maintain field homogeneity in the measurement chamber. It was achieved by minimizing the scattering components of the field in the other axes except for the Z axis (vertical polarization) by minimizing the field strength level. The resulting field strengths were both adequate for the needs of the system under testing and ensured the establishment of specific and reproducible measurement conditions. Beforehand, the measurement room was equipped with appropriate absorbers for attenuation, and adjustments were made to the positioning of certain panels to minimize undesired signal interference.
In the initial stage of the research, the output voltage of the P1110 harvester system was measured as a function of the electric field strength at the antenna location of the receiving system, with the energy recovery system’s output remaining unloaded. The influence of the construction and associated characteristics of the antenna itself and possible deviations from the intended antenna polarization were also considered.
Analyzing the results of these tests presented in
Figure 8 and
Figure 9, a number of conclusions can be drawn. Considering the unique nature of the operation of the harvester system in the target application system, which may not always permit the use of a directional antenna precisely aligned with respect to the potential source of the recovered energy and thus to maintain the established polarization of antenna operation, it becomes evident that a crucial aspect in the design of the identifier system with the system for the energy harvesting from common telecommunication systems will be the proper selection of the antenna of the receiver system [
26,
27]. Here the conflicting requirements have to be reconciled: ensuring that the energy gain of the antenna is as high as possible while maintaining its omnidirectional characteristics. Alternatively, configuring each system of this type to operate under specific field conditions is another option. The results highlight the significance of maintaining optimal parameters for the “energy recovery channel” to obtain the desired output voltage, much like in a typical telecommunications channel.
The distinction lies in the required power levels for the proper operation of each system. In the context of energy harvesting, the received signal’s power level needs to be higher to justify its desirability and cost-effectiveness. For example, the maximum value of the harvester’s output voltage (4.2 V–the threshold for the tripping of the output voltage limiter, set for safety reasons of the fed systems) is achieved at approximately 5 V/m for the omnidirectional antenna A1 and already at 2.5 V/m for the directional antenna A2, respectively. For lower field strengths, e.g., 1 V/m, the difference in output voltages is approximately 1 V, whereby for a system with an omnidirectional antenna, a voltage of 523 mV is obtained, which is insufficient to supply the most commercially available inverters and prevents energy recovery. The situation deteriorates further when the antenna polarization is disturbed as illustrated by a 45° deviation, as evident in
Figure 8. Conversely, it can be seen that the modern electromagnetic environment is characterized by strong “energy saturation”. In numerous instances, especially in metropolitan areas and across regions with radio stations, relay stations, base stations, etc., the levels of electric field strength (power density) are sufficient, making energy harvesting a feasible and potentially profitable endeavor. Promising developments in modern telecommunications systems raise hopes that potential energy sources for recovery will become increasingly abundant and realistically accessible across expanding areas.
The effect of the signal (carrier) frequency of the potential radio channel was also investigated. In evaluated test system, originally designed for 915 MHz operation, this parameter was varied between 835 and 955 MHz. This is due to the experiments conducted, since the manufacturer’s specifications indicated frequencies of 902 and 928 MHz, respectively. The results were intriguing. Firstly, the harvester circuit operates correctly over a significantly broader frequency range and, notably, allows much higher output voltages compared to those at 915 MHz. Secondly, the frequencies at which the maximum output voltage is generated depend on the antenna in use. Therefore, it can be assumed that even though the harvester receiver chip was originally designed for 915 MHz frequency, the results obtained from feeding the chip via a signal path with a known typical wave impedance of 50 Ω align with the catalog data. However, attaching an actual antenna to the receiver input leads to observable detuning of the receiver path and modification of the harvester system parameters.
It is clear that for the A1 antenna, the maximum output voltage occurs at a frequency of about 855 MHz (
Figure 10). Returning to the previous example, this allows the limiter tripping threshold to be reached already at a field strength of 2.5 V/m, whereas for the nominal frequency at least twice that intensity was required. A comparable phenomenon is observed with the A2 antenna (
Figure 11), although the variations are less pronounced. In both cases, aligning with the precise operating frequency relevant to the energy source to be harvested and defining a frequency band aligned with the spectral power density of the source increases the likelihood of achieving a satisfactory level of energy harvesting in a given scenario. It should be noted that, in the discussed cases of antennas A1 and A2, both systems when suitably configured for the signal frequency provide useful output voltages (above about 1 V) already at intensities of 0.8 V/m (previously: A1–about 2 V/m and A2 about 1 V/m) and the system with the A2 antenna operates correctly even at field strengths of 0.5 V/m. In conclusion, it is evident that the design of the energy harvesting system must be closely aligned with the harvester receiver antenna employed, and the entire system should be tested in the target application, considering these aspects.
After examining the parameters of the P1110 harvester system on the input side and on based on the obtained results, a series of tests were carried out on the output side. While this a symbolic division, since the input parameters (operating frequency, frequency band, electromagnetic field strength) are closely related to the output parameters (voltage, current, power), but formally it is possible to separate in this way the elements related to the energy harvesting itself from the parameters related to the conditioning and storage of the recovered energy. So far, the no-load receiver system has been analyzed, focusing on the value of the output voltage and aiming to maximize it. The measurements carried out at this stage will allow the value of the output voltage to be related to the current flowing in the harvester’s output circuit and to find a load level for the energy harvesting system such that the efficiency of the process is as high as possible. Only such a set of data will allow the determination of the real-world energy capabilities and transpose this toward feasible comprehensive scenarios for the operation of the system power supply.
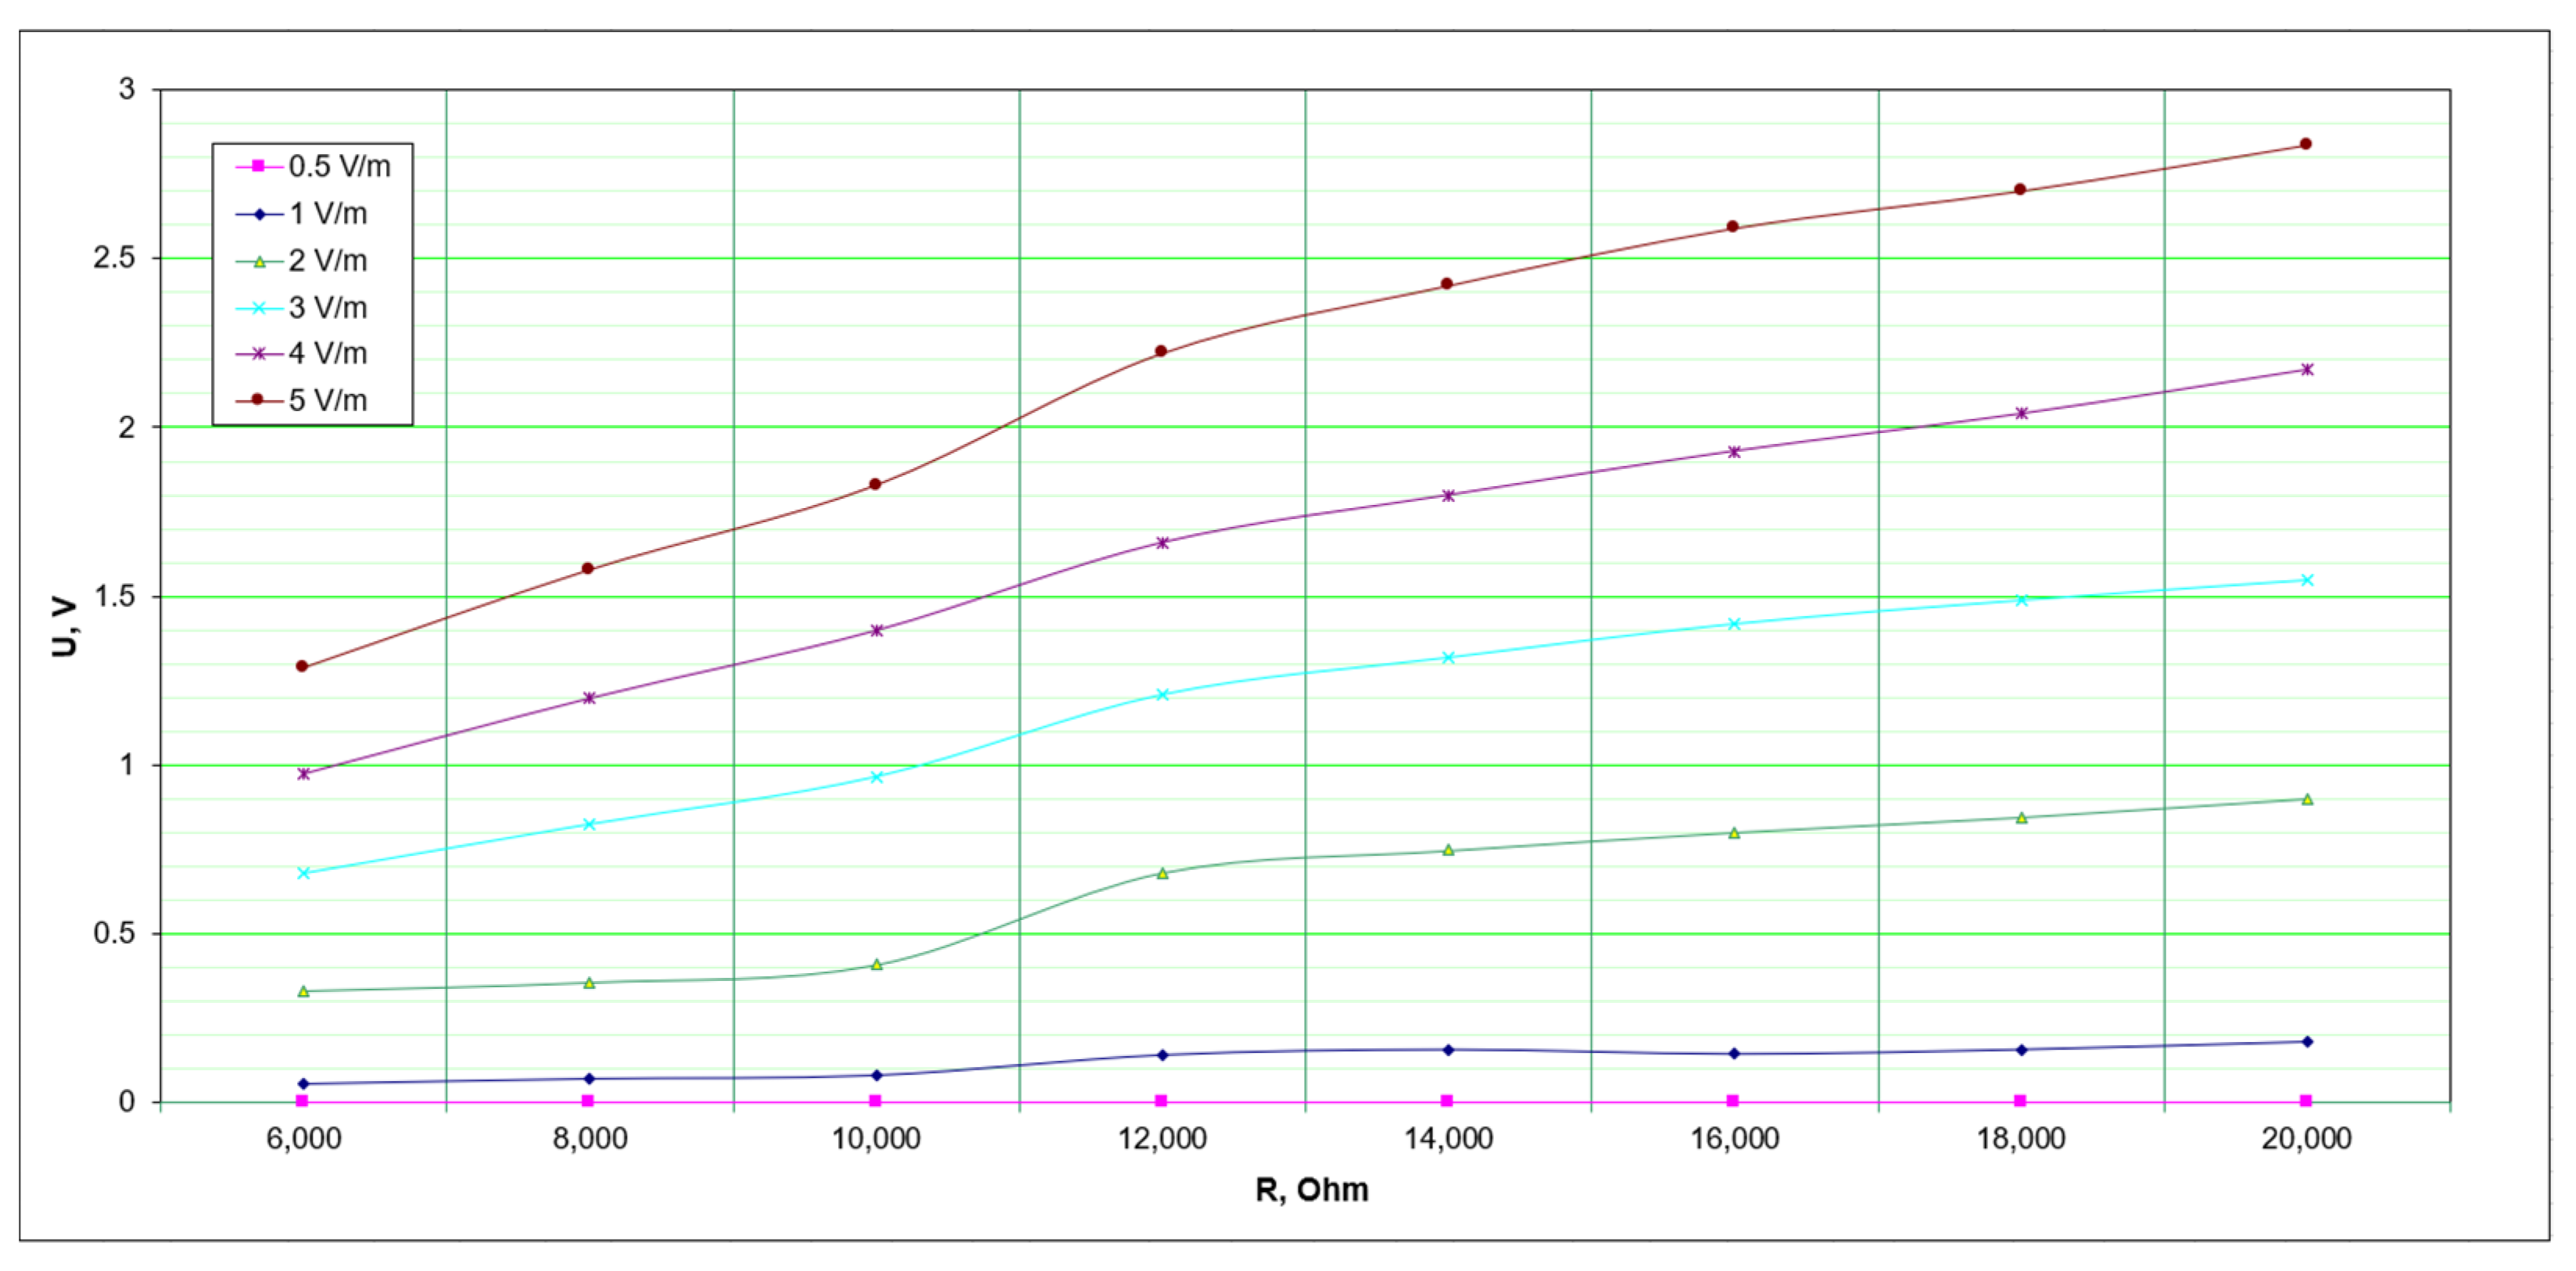
During the tests, the harvester system was loaded with an adjustable resistance in the range from 6 to 20 kΩ, which indirectly results from the manufacturer’s data and also from the fact that in this load range clear power maxima were obtained from the system for the individual tested cases. Obtaining the power maximum is a criterion for the energy matching of the receiver to the energy source, which is related to the highest possible efficiency of this process under the given conditions. The output voltage of the system was measured for different electric field strengths at a nominal frequency of 915 MHz and for the available set of A1 and A2 antennas. The output current of the system and the power transferred to the load were also calculated from the results. The measurement results (
Figure 12,
Figure 13 and
Figure 14 for A1 and
Figure 15,
Figure 16 and
Figure 17 for A2) reveal a number of interesting conclusions to be drawn. As can be seen in the respective graphs, when increasing the load resistance (decreasing the load of the harvester system), the output voltage increases. This is understandable, while a significant decrease in the values of these voltages is noticeable. The output voltage limiting system operated for the A2 antenna only and even then with a load resistance greater than 12 kΩ in a field of as much as 5 V/m. Usable voltages greater than 1 V are obtained at field strengths of 4 V/m for A1 and 2 V/m for A2, respectively.
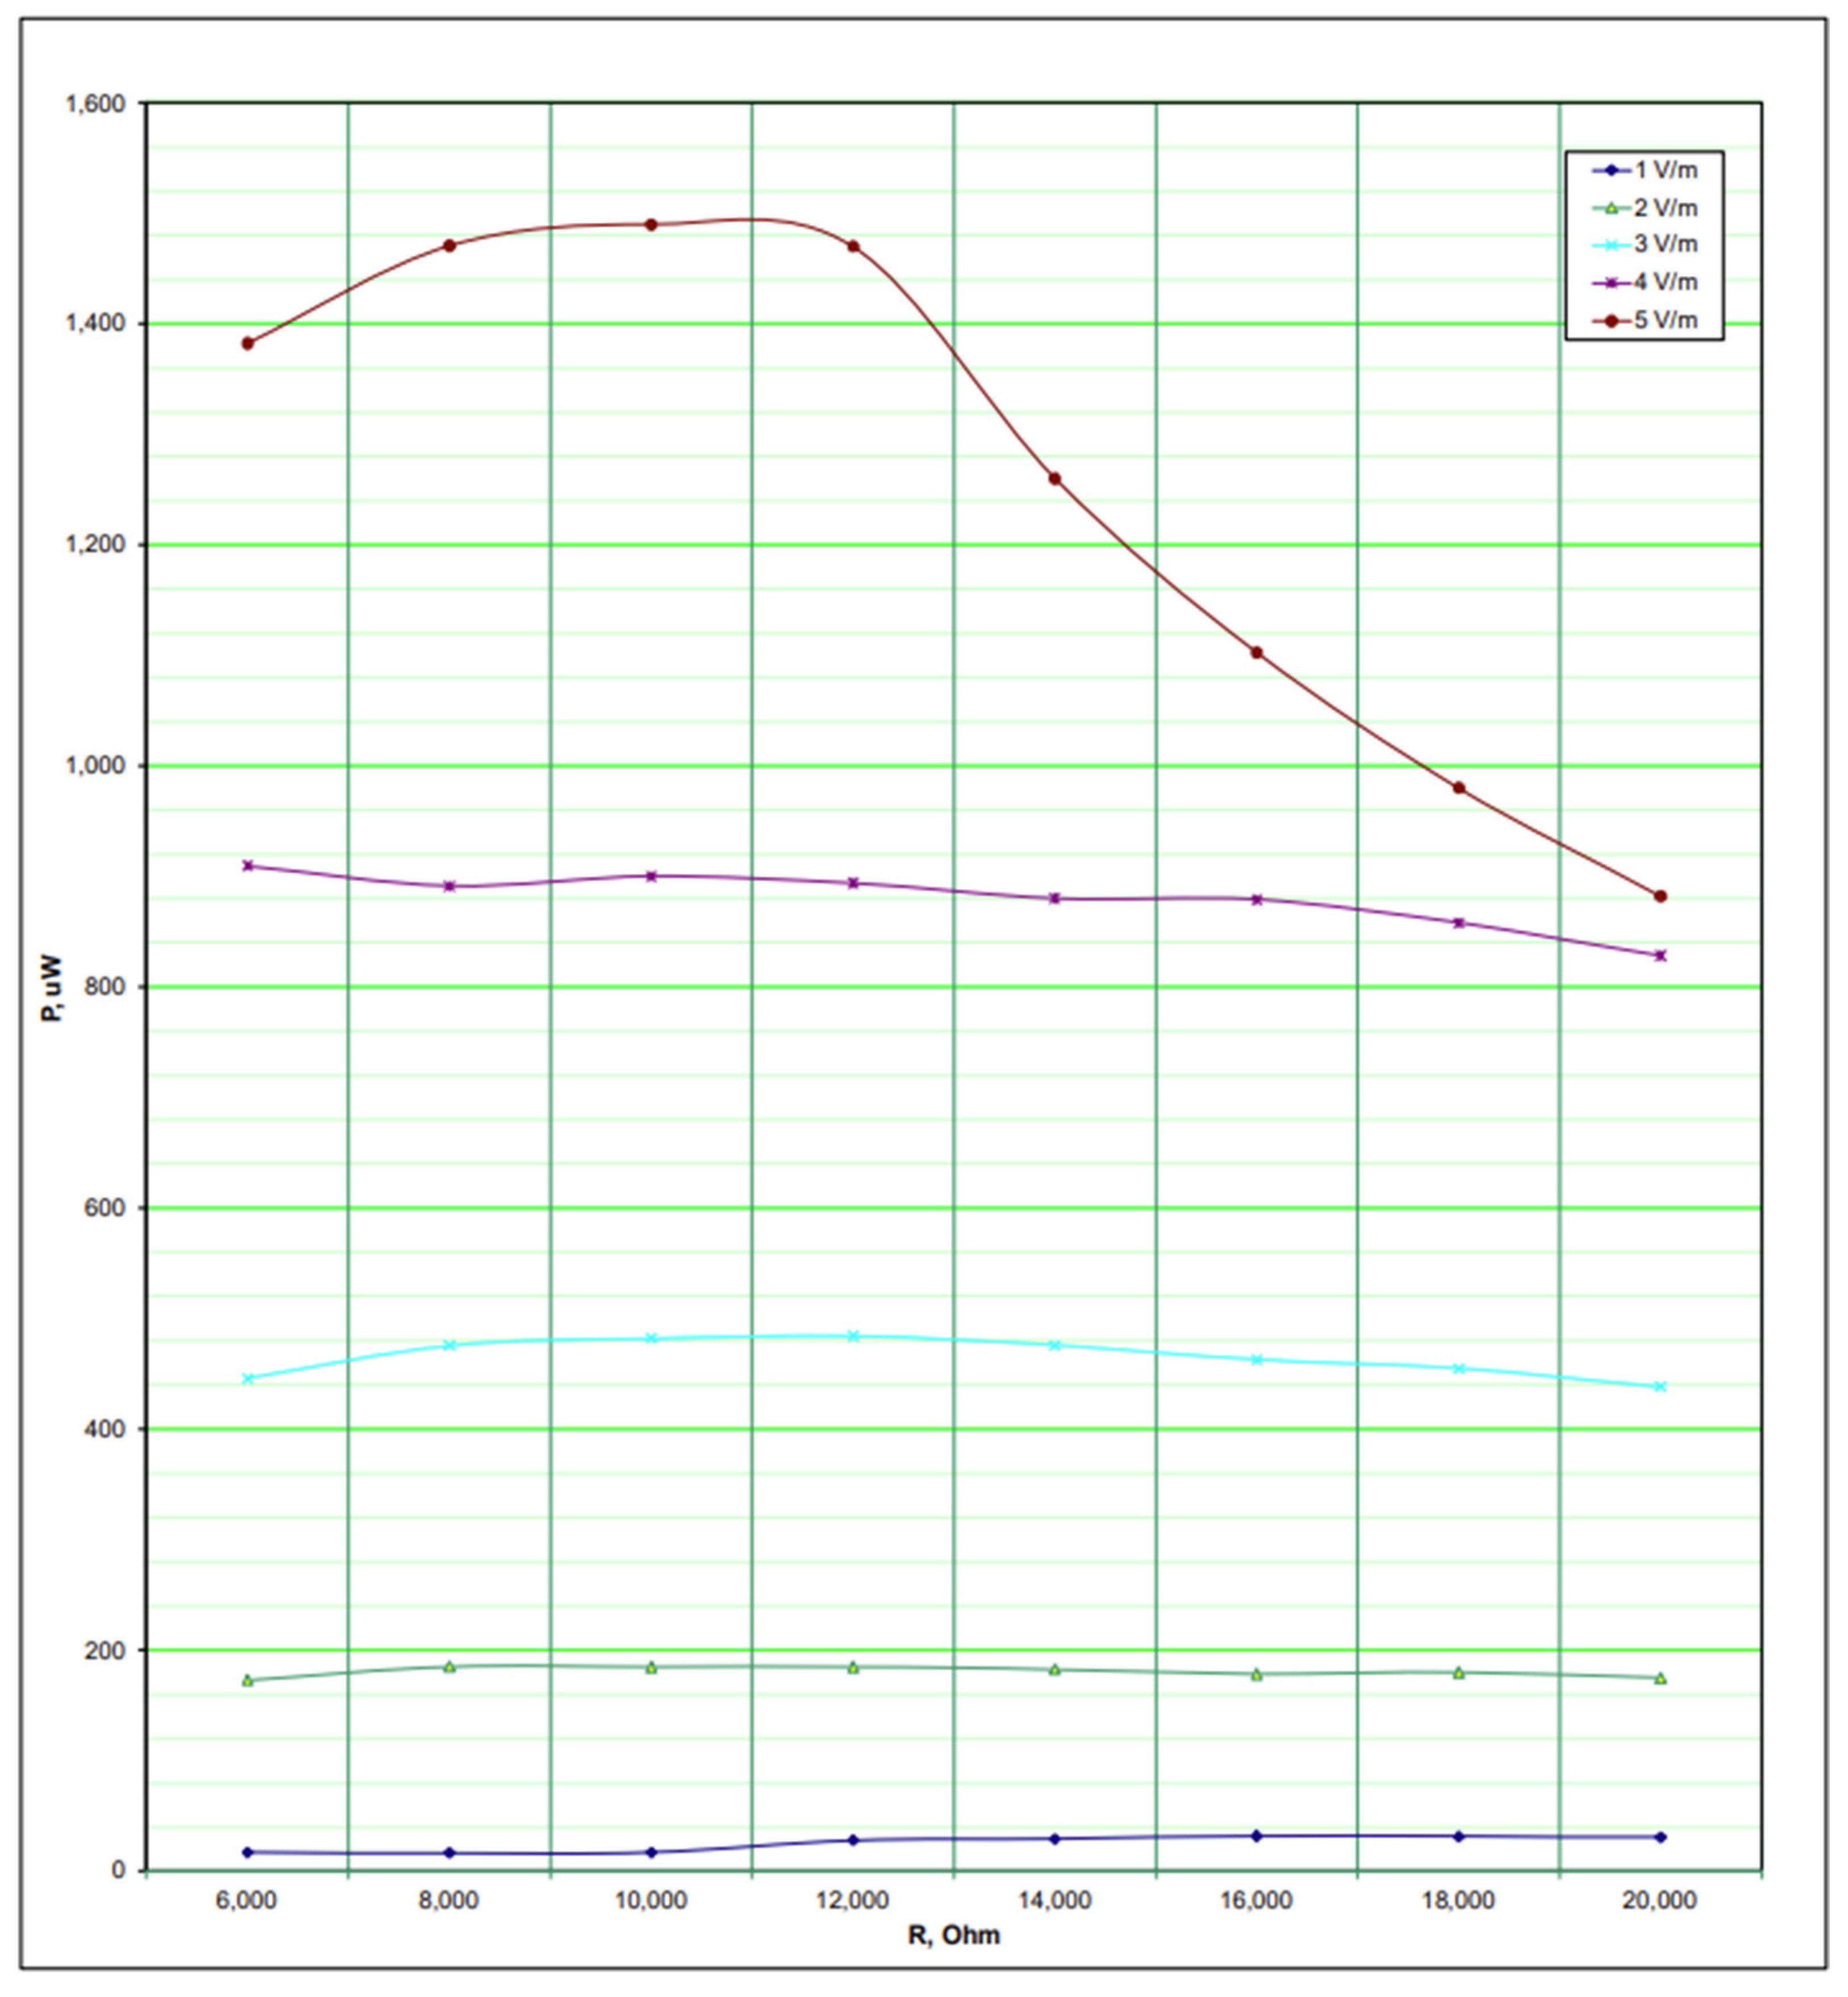
There is a noticeable decrease in voltage yield, although this is not yet a significant criterion. When analyzing the current consumption of the system, a declining trend is observed with increasing load resistance. However, in the 10–12 kΩ range, there is a reduction in and even a reversal of the current trends for both antennas, A1 and A2. For lower electric field strengths, the range shifts slightly toward higher resistances, especially for A1. Nevertheless, practical and meaningful conclusions can only be drawn by analyzing the power waveforms extracted from the harvester system and comparing these results with the voltage variation waveforms.
The degree of energy matching between the energy receiver system and its source in the form of a harvester system depends strongly on both the resistance of the load and the electric field strength supplying the receiver and the degree to which it is used (A1, A2). For antenna A1, the best impedance-matched system will deliver a voltage higher than 1 V at an electric field strength of min. 2.3 V/m and a load resistance of min. 12 kΩ, being able to generate a current as high as approx. 75 µA. The circuit maintains a high energy transfer efficiency up to about 18–20 kΩ, with the level of matching decreasing as the field strength increases. However, given the high field strengths, i.e., the high “energy abundance” of the environment, this is not a significant issue. For A2 it is similar, although the maximum fit dumps for a load of 8–12 kΩ, but there is a tendency to need to reduce the load as the energy abundance of the environment decreases. When seeking the minimum acceptable parameters for the energy recovery process in this case, it is observed that the system will provide a voltage of 1 V for a load of approximately 10 kΩ at a field strength of 1.5 V/m (harvester output current is approximately 95 µA). For such a field strength, further reduction in the load will not increase the output voltage, but the output current will decrease.
However, the analyses mentioned above, which provide detailed information about energy recovery system, do not consider the behaviour of the receiver system under dynamic conditions. Given the concept of the energy recovery and energy storage parameter conditioning system, this mode of operation will be the primary mode one of operation of the harvester system. This is because of the dynamic changes of the input parameters of the energy conditioning system inverter (depending mainly on the inverter’s input voltage and its load current) and the energy storage system (concentrated or distributed), typically in the form of capacitive elements of the capacitor or super-capacitor type. Therefore, in this phase, the dynamic parameters of the energy recovery system were also investigated by determining the dynamic charging characteristics of various types and capacitances of capacitors. This made it possible to determine the actual energy harvesting and energy storage capabilities (amount of energy and energy storage time) and also to optimize the structure of the energy conditioning and retention system. Discharged capacitors with different capacitances were connected sequentially to the output of the harvester system and the charging process was carried out at varying field strengths.
The charging characteristics of a 1 μF ceramic capacitor using a harvester system with attached an A1 antenna is presented in
Figure 18. The measurement times of the individual dependencies took considerably longer, but for the sake of suitability for comparative analysis, the time was limited to 1 s in the diagram. The charging process for fields of 0.5 V/m and 1 V/m is very slow resulting in achievable voltage values of 0.212 V and 0.56 V, respectively. These voltage values are unsuitable for the direct supply of electronic circuits. An electric field of 2 V/m allows for reaching a voltage value of 1.8 V on a capacitor in the long term. When the field strength exceeds about 4.5 V/m, the voltage on the capacitor increases above 4.2 V, triggering the activation of the voltage limiting system. This leads to a rapid discharge of the capacitor to 2.7 V, resulting in a significant loss of energy that could have been stored. Such a situation is not advisable in terms of the functionality of the identifier to be built and will require practical implementation of appropriate energy flow management systems (e.g., threshold systems and voltage converters).
The use of a capacitor with a capacitance of 10 μF increases the charging time to reach a certain voltage compared to the previous case. There is also a slight decrease in the maximum voltage achievable in the long term (particularly noticeable for low field strength). This decrease is due to the higher leakage current of the capacitor with higher capacitance. Measurements for a 10 μF capacitor are shown in
Figure 19.
Additional measurements were conducted with capacitors of varying capacitance: 100 μF, 1 mF, and 12 mF, and the tests were repeated for the harvester configuration in conjunction with the A2 antenna. A detailed analysis of these measurements confirms the general conclusions presented earlier. However, it is important to note that with a significant increase in energy storage capacity, the process of energy acquisition and data recording requires significantly more time.
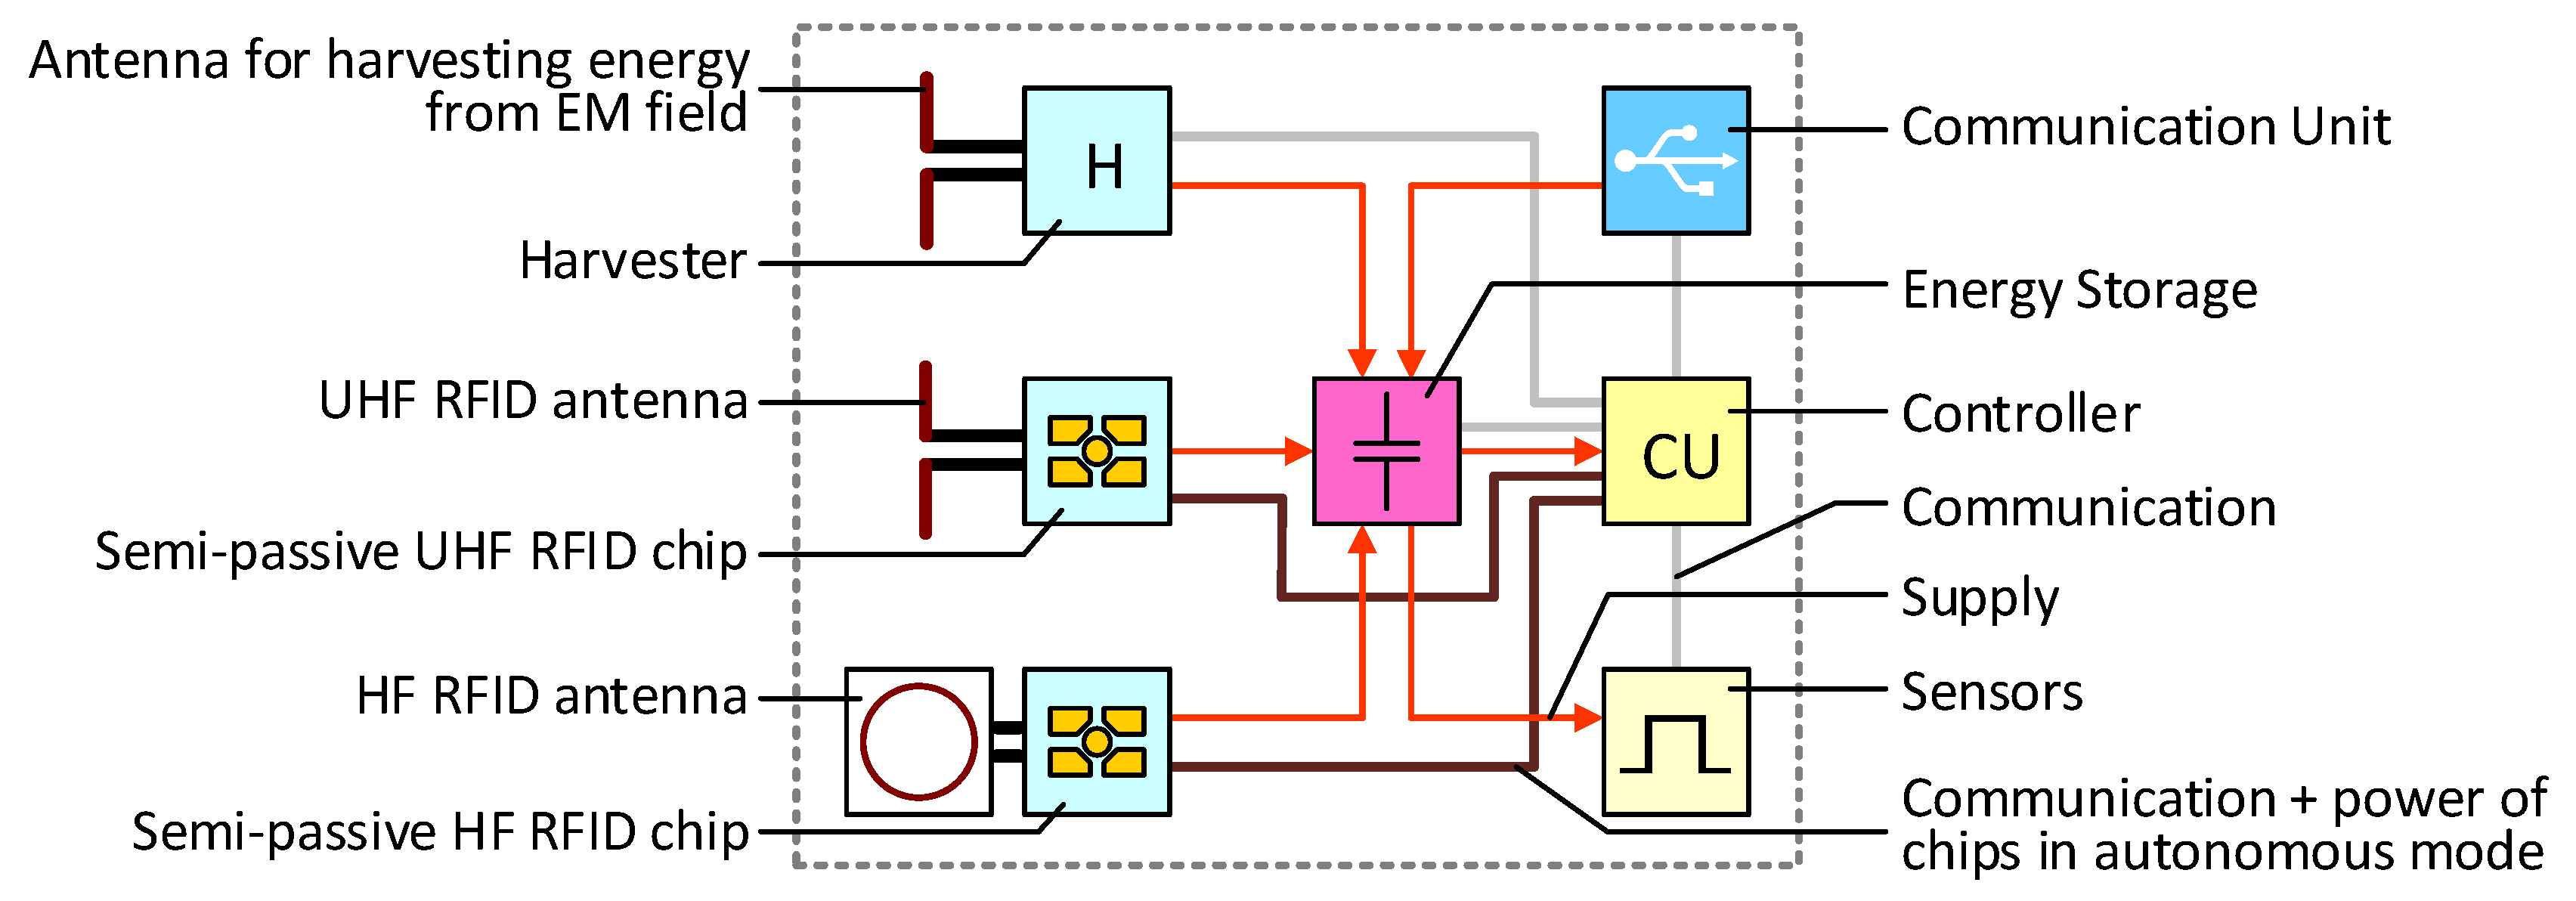
Tests carried out under laboratory conditions can form the basis for designing semi-passive RFID systems using extracted energy from the electromagnetic environment, for example for the operation of sensors of physical quantities (temperature, humidity). The concept of such a system is presented in
Figure 20.
Such a system (under favourable conditions in the electromagnetic environment) is capable of harvesting energy to enable the sensor system to operate periodically to acquire set parameters.


 ,
, 


