Article

Battery-Assisted Battery Charger with Maximum Power Point Tracking for Thermoelectric Generator: Concept and Experimental Proof

Graduate School of Integrated Science and Technology, Shizuoka University, Hamamatsu 432-8561, Japan
*
Author to whom correspondence should be addressed.
Electronics 2023, 12(19), 4102; https://doi.org/10.3390/electronics12194102
Submission received: 7 September 2023 / Revised: 23 September 2023 / Accepted: 29 September 2023 / Published: 30 September 2023
(This article belongs to the Special Issue Energy Harvesting and Storage Technologies)

Abstract

:
This paper proposes a concept of battery-assisted battery charger with maximum power point tracking for DC energy transducer such as thermoelectric generator and photo voltaic generator, and shows experimental results to prove the concept. The DC energy transducer is connected in series with a battery to increase the voltage. The plus terminal for the DC energy transducer is connected with the input terminal of a DC-DC buck converter, whereas the battery is connected with the output terminal of the converter. Thus, the current is boosted from the input to the output. When the net current to the battery is positive, the system works as a battery charger. To extract the as much power from the DC energy transducer as possible for high charging efficiency, maximum power point tracking is introduced. The converter was designed in 180 nm 3V CMOS with a silicon area of 1.05 mm2. The concept was experimentally proven by varying the reference voltages to control the input voltage. An all-solid-state battery was charged up from 2.2 V to 2.3 V in two hours by the converter with a flexible thermoelectric generator which had an open-circuit voltage of 0.6 V.

1. Introduction

Internet of Things (IoT) sensing modules communicate with one another or cloud servers to collect the information around them, and to keep society safe with little or no human intervention [1,2]. However, there is a need to replace the battery used in the sensor modules. The cost of replacing old batteries with new ones has increased significantly as many sensor modules are distributed globally. To decrease the overall cost of sensor networks, technology is needed to eliminate battery replacement. Energy harvesting is a key technology for eliminating battery replacement. One solution is the use of an energy transducer (ET) to convert the surrounding energy, such as thermal flow and light, into electric power for sensor modules without any battery [3,4].
Maximum power point tracking (MPPT) is a key design technique for the converter to extract as much power as possible from a thermoelectric generator (TEG) [5,6,7,8] and a photo voltaic generator (PVG) [9,10]. Fully integrated charge-pump circuits as converter have three main design parameters of clock frequency f, number of stages N and stage capacitor C. MPPT utilizes one or more design parameters to maximize the input or output power of the charge pumps: N and f (two-dimensional MPPT) [5,6], C, N, f (three-dimensional MPPT) [7], and one-dimensional MPPT [8]. There are two categories for MPPT, direct and indirect methods [9]. The direct method varies the output voltage and the current of PV to determine the maximum power point. The indirect method estimates MPP based on the measured results of the PV generator’s voltage and current, the irradiance, or using empiric data, via mathematical expressions of numerical approximations. Because there is no battery, there is no need to replace batteries. However, when the modules require operation more often than the cycle time of the surrounding energy, a battery is required as a backup [11,12,13,14,15,16]. In [11], a charger and battery management IC with 330 nA quiescent current was presented. The IC can cold start from 330 mV and 5 μW of input power. The charger achieves an efficiency greater than 80% at single cell solar voltages of 0.5 V. In [12], a converter was proposed to charge battery and to drive the load simultaneously. For an input power of 500 nW, the proposed chip achieved an efficiency of 82%, including the control circuit overhead, while charging the energy storage device at 3 V from 0.5 V input. In buck mode, it achieved a peak efficiency of 87% and maintained an efficiency greater than 80% for an output power of 50 nW–1 μW, with an input voltage of 3 V and an output voltage of 1 V. In [13], a battery charger for electrostatic vibration energy transducer was presented. In [14,15], current-controlled chargers were presented for Li-ion batteries. To preferably regulate the charging current and decrease circuit complexity for parallel charging, a battery charger with variable charging current and automatic voltage-compensation controls was presented in [14]. The main architecture adopted was a two-loop current-mode control in the constant current and the constant voltage stages in [15]. Trickle-current mode provided complete battery charging process to protect the battery. In [16], a hybrid TEG—battery power supply system was proposed to achieve replacement-free batteries in sensor modules. A TEG was connected in series with the battery to increase the input voltage of a single DC-DC buck converter to drive a sensor IC, and to return the majority of the battery power to the battery in every cycle. Discontinuous mode (DCM) was applied to improve the power conversion efficiency at light loads [17]. The high side was enabled when the voltage at the load was below a target voltage. The activated period was controlled with a predetermined pulse width. The low side was enabled as soon as the high side was turned off. The low side was deactivated when the drain-to-source voltage returned zero. Even though the battery charging operation was validated with experiments, it had no MPPT capability.
In this paper, a battery charger is proposed based on the hybrid TEG—battery power supply system. The contributions to industrial electronics and energy harvesting technologies are as follows:
(1)
The proposal of the battery-assisted battery charger. It allows standard CMOS to design the battery charger even with the TEG whose open-circuit voltage is as low as 0.6 V, because the input voltage of the battery charge is the sum of the battery voltage and the TEG output voltage.
(2)
The proposal and experimental proof of the MPPT for the battery-assisted battery charger. The theoretical maximum input power extracted from TEG is shown and has been experimentally proven to charge the battery with maximum power.
This paper is organized as follows. In Section 2, a battery-assisted battery charger with MPPT is proposed. The MPPT circuit is shown with a flow chart for the converter operation. Block diagram of the converter chip is discussed in detail. In Section 3, measured results are presented. The input voltage of the converter is skewed with reference voltages varied to determine the MPP for TEG. In Section 4, future works are discussed. Section 5 summarizes the paper.

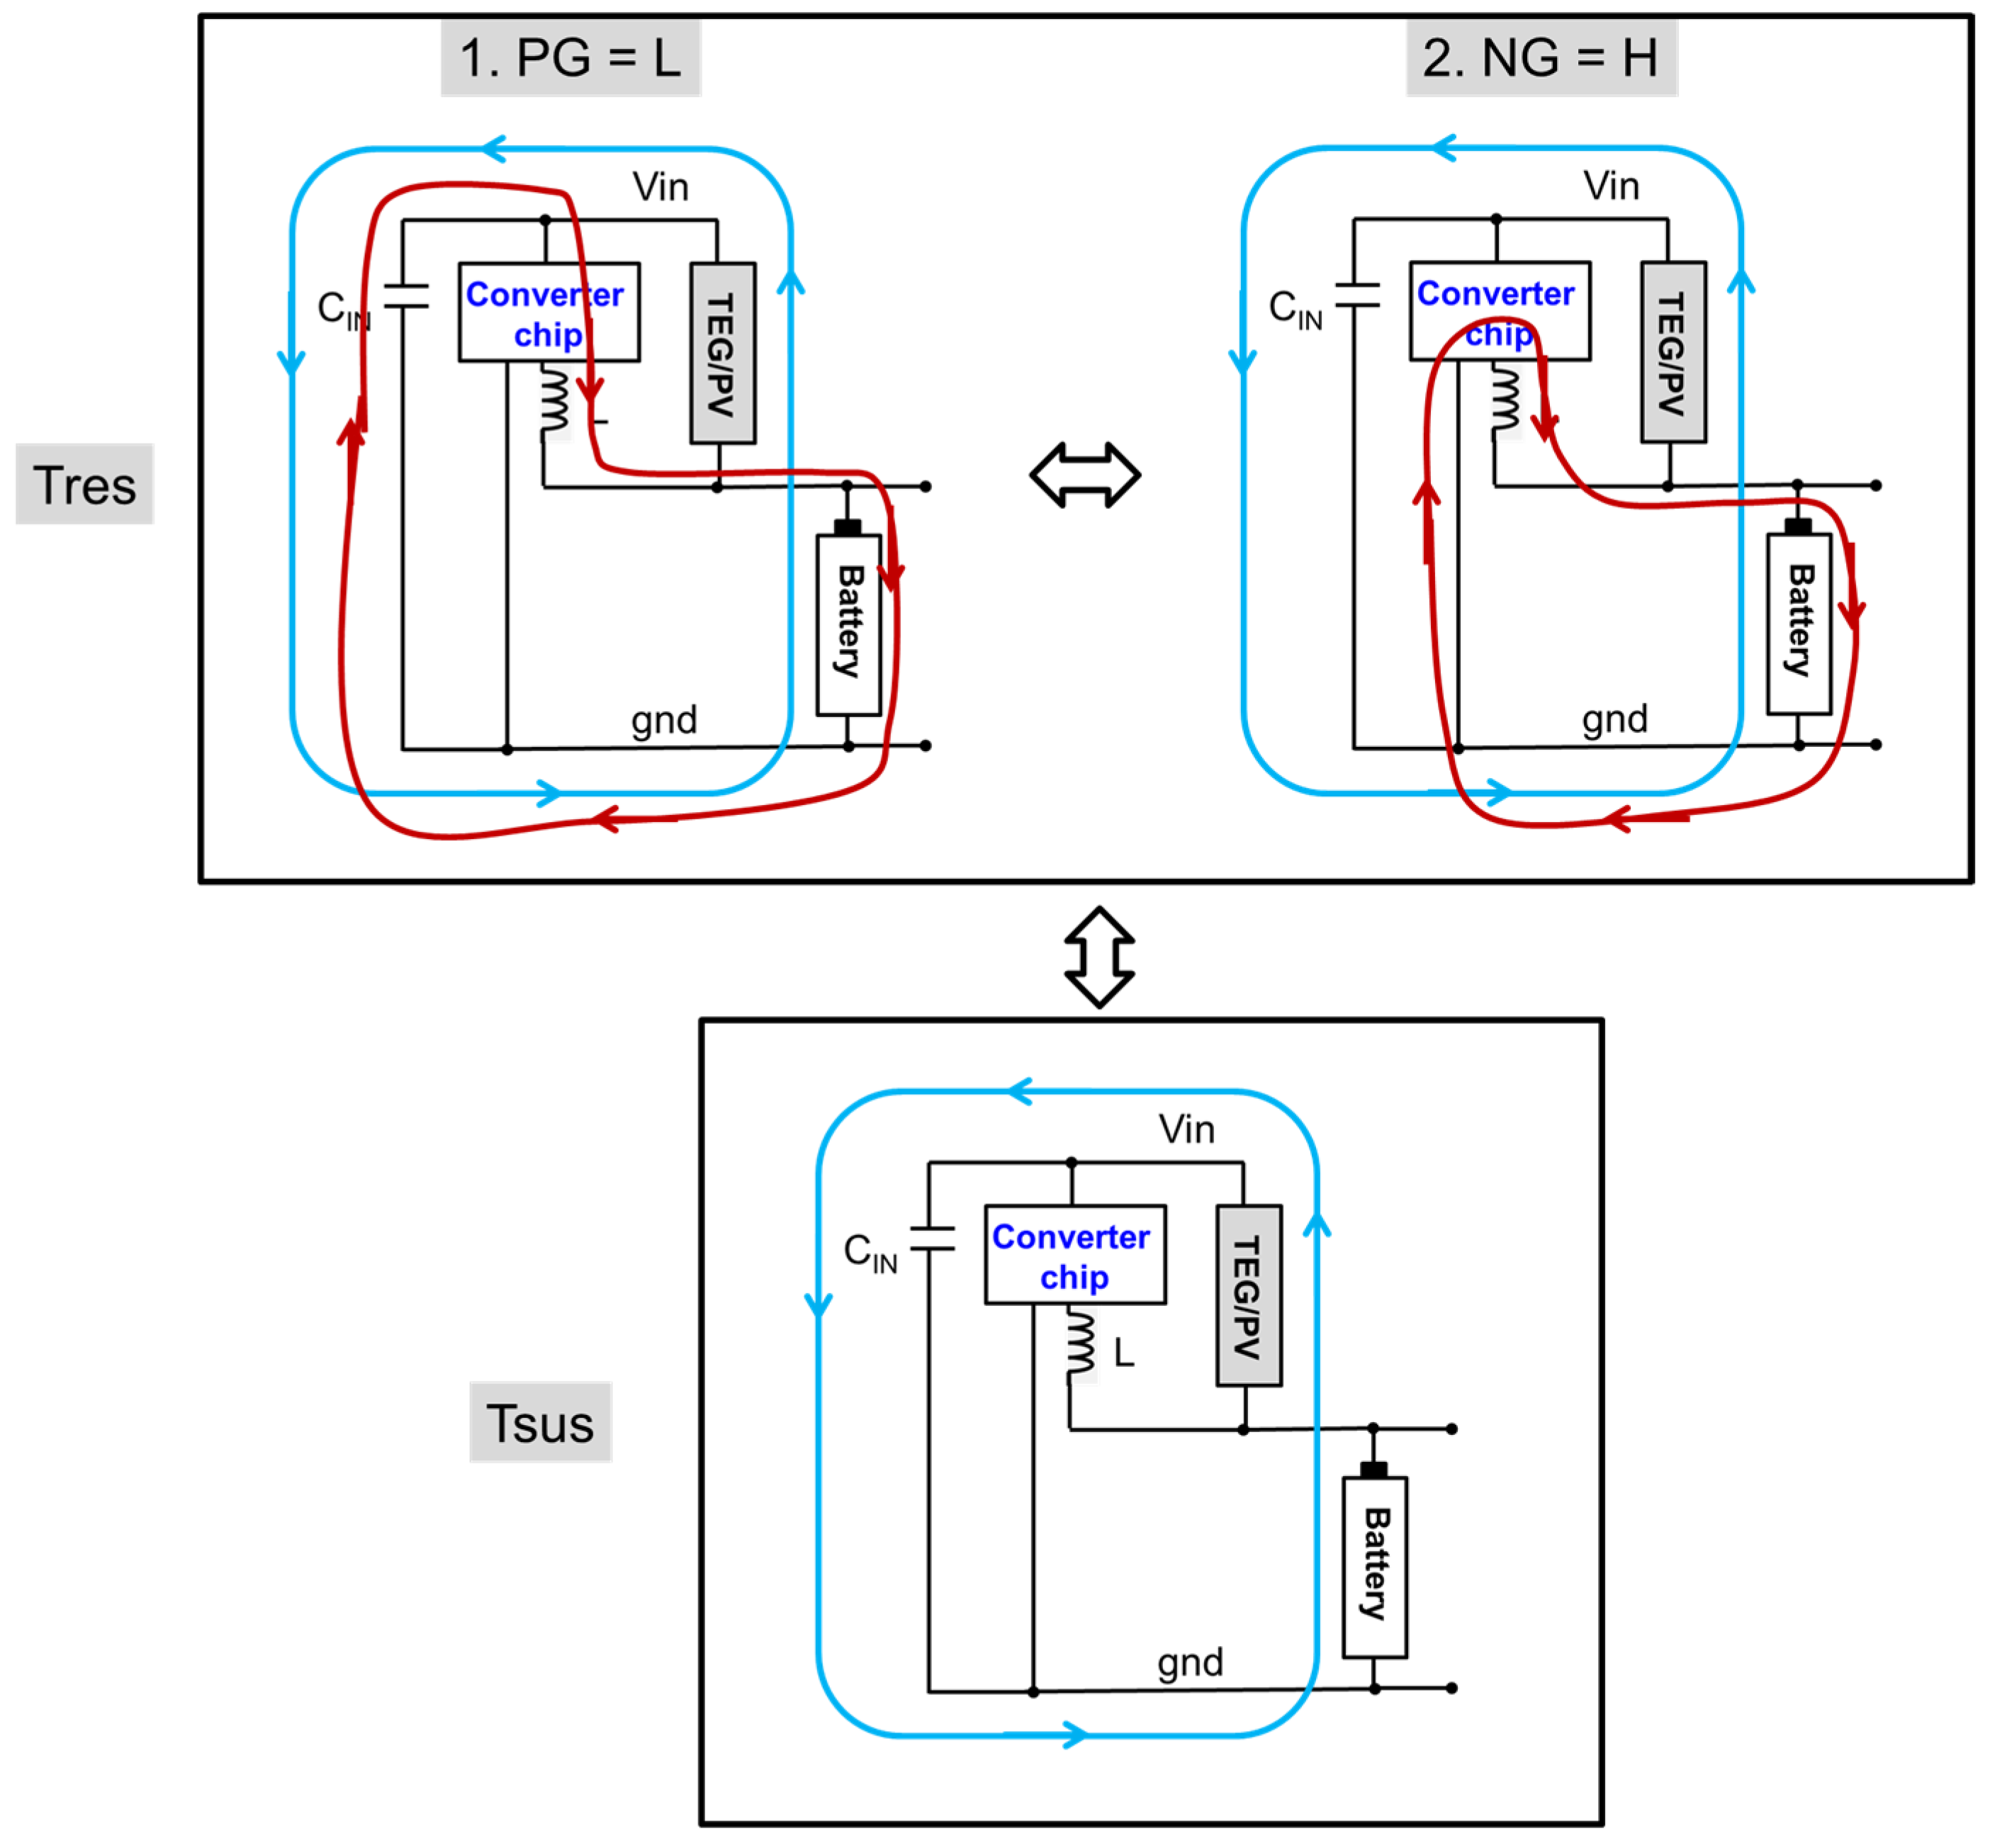
2. Battery-Assisted Battery Charger with Maximum Power Point Tracking

Figure 1a shows a battery, which will be connected to a sensor IC to supply power. Figure 1b illustrates a converter system to supply power to a sensor IC, and to charge the battery in every operation period when TEG generates sufficiently high power [16]. Figure 1c proposes a battery system with a battery-assisted battery charger. The battery is connected to a sensor IC as usual, but the battery can have longer lifetime than normal batteries with a DC energy transducer and a converter. To operate the battery charger, it requires PASSIST from the battery. As long as energy transducer generates sufficiently large power, the output power from the converter, PGAIN, can be larger than PASSIST. When the net power to the battery is positive, the battery is charged up.
To extract as much power from the DC energy transducer as possible for high charging efficiency, maximum power point tracking (MPPT) is required. When the DC energy transducer is a thermoelectric generator (TEG), it is modeled with a DC voltage source VEH and an output resistance REH. Buck converter needs to operate the output voltage of TEG VEHO around VEH/2 to maximize the output power of TEG PEH [18,19,20]. When the DC energy transducer is a photo voltaic generator (PVG), it is modeled with a DC current source IEH, a diode to determine the maximum output voltage VPV, and an output resistance REH [9,10]. The maximum power point is found to be somewhere in VOP > VEH/2 depending on the model parameters [9].
Figure 2a shows a target operation for the input voltage Vin of the battery-assisted battery charger.
There are two operation modes: Trefresh to refresh the reference voltage to control Vin, and TMPPT to operate the converter around the maximum power point. Trefresh has two period: Twait to wait Vin to be saturated at Vin_open, and Tdec to sample and hold Veh. TMPPT has two operation periods: Tsus and Tres to suspend or resume the converter operation, respectively. TMPPT should be shorter than that of drift in temperature difference in case of TEG and luminous intensity in case of PVG in order to keep the power system at MPP, whereas much longer Trefresh is needed to have sufficient power conversion efficiency. If TMPPT is as short as Trefresh, the average power conversion efficiency can be as low as 50% at most.
Figure 3 shows the flow chart of the converter control. The algorism starts when ET starts outputting power (S1). When ET outputs power, Vin increases. Power-on reset circuit (POR) outputs a signal PONRST (S2) to enable a counter to control Twait, Tdec, Trefresh and TMPP (S3). Until Twait, Vin is supposed to be saturated at the open-circuit voltage. Based on the type of ET, TEG or PV, the reference voltages Vin+ and Vin− are determined via the A/D and D/A converters within Tdec (S4, S5). After the target voltage for Vin is refreshed, the converter is enabled to operate in MPPT in TMPPT (S6, S7). After TMPPT, the converter is disabled (S8) for the next refresh period (S3–S8).
Figure 4a,b, respectively show the configuration of the proposed battery charger and the block diagram of the converter chip. The aim of this paper is to propose the design of a battery-assisted battery charger with MPPT, and provide its experimental proof. The experimental circuit should have the capability of variables Vin+ and Vin− to validate the optimum Vin for maximizing the battery charging power. Thus, the circuit was designed to control Vin+ and Vin− externally. The design concept for the reference voltage generator will be discussed in Section 4. In Figure 4b, Vin is the power supply pin for the control circuit, whereas Vin_pmos is the pin for the power switch to flow the current into the inductor. They are connected with TEG at the top level. Those two pins can be merged into a single pin, but were kept separate in this test chip in order to measure the current separately. Vd is connected with an inductor. “CONV_MPPT” is the power switch to connect Vin_pmos and Vd in the first period, and Vd and ground in the second period. Thus, Vd toggles from Vin to ground and vice versa. “CURRENT MIRROR_CKT” is a voltage-controlled current-generator. For this test, it receives input voltages at CRT_all and CRT_dly to generate reference currents for several differential amplifiers and delay circuits, respectively. One can tune the input voltages so that the comparators function well with minimal currents, or the conduction time for the high side of the power switches is adjusted to have a target peak inductor current. Once optimum input voltages are determined, those two pins can be removed in the following design. “PONRST” is a power-on reset circuit to detect whether Vin becomes high enough. The output signal of “PONRST” wakes a bandgap reference “BGR” to generate a reference voltage. “BGRO” is a monitoring circuit for the reference voltage. With high EN_BGRO, the reference voltage is output from a pin BGRO. “OSC” controls the pulse width for the refresh and MPPT periods. Once Vin is high enough, “OSC” starts working. “MPPT_CKT” inputs Vin/2 and two reference voltages Vin+/2 and Vin−/2, and outputs an enabling signal to “PGNG_CKT”. Once Vin reaches Vin+, the power switches resume the switching operation until Vin reaches Vin−; switching operation gradually pulls down Vin. Once Vin reaches Vin, the power switches suspend the switching operation until Vin reaches Vin+. Vin gradually increases with TEG. This suspend/resume operation is repeated during TMPPT. “MONITOR_ALL” outputs the buffered signals of the gate signals for the power switches, NG and PG, with a low OEB. In Figure 4b, each of the critical building blocks is labelled by a specific figure number such as Figure 5a,b, Figure 6, Figure 7a,b or Figure 8a.
Figure 5a illustrates the voltage-controlled current-generator “CURRENT MIRROR_CKT”. It receives an input voltage at CRT_IN to draw a reference current via R1, and outputs voltages Vgn and Vgp to control the current sources in other comparators, oscillator, and bandgap. Figure 5b shows the power-on reset circuit “PONRST”. The comparator compares V = Vin|Vtp| and V+ = R3/(R3 + R2)Vin. When Vin becomes higher than a point where V = V+, PONRST becomes low. With this low PONRST, the bandgap reference (BGR) starts working.
Figure 6 illustrates the “OSC” which was introduced in Figure 4. Figure 6a shows a binary counter composed of a ring oscillator (RINGOSC) and several D-Flip-Flops (D_FFs). Figure 6b illustrates a pulse generator to define Trefresh and TMPPT. Figure 6c shows waveforms of the outputs of D_FFs and a control signal enb, which is generated via LATCH, shown in Figure 6b, as Q. The colored dashed lines indicate that those signals are synchronized. The latch gets reset with a power-on reset signal to “enable”. Qset and Qreset of Figure 6b are connected with signals C4 and OSCb, respectively. One can vary Trefresh and TMPPT by connecting different outputs of D_FFs with Qset and Qreset.
Figure 7a shows the RES/SUS signal generator. RES increases, i.e., the latch is set, when the converter enters into MPPT or when Vin hits Vin−. SUS increases, i.e., the latch is reset, when Vin hits Vin+. Thus, Vin is controlled within Vin+ and Vin−. Figure 7b shows the PG/NG pulse generator. PG and NG are the gate signals of pull-up and pull-down drivers, as shown in Figure 8a. The waveform is shown in Figure 8b. During RES period, the converter operates in a boundary conduction mode, which requires a simple control circuit. PG decrease with an increase in RES. PG returns to a high rate after a predetermined pulse width is determined by a delay cell DELAY_ALL. When the PG is high, NG increases. There is a timing that both pull-up and pull-down drivers turn off in order to ensure that there is no direct current from power supply VDD, which is connected with Vin at the top-level cell, to the ground. NG decreases when Vd reaches 0 V, i.e., zero-volt switching. With a reduction in NG, PG reduces. The above sequence is repeated until SUS signal increases. When SUS increases, NG is forced to reduce regardless of the present state. After the following PG toggle, PF is stuck to increase. Hence, both the drivers turn off until the next RES signal. Thus, the battery is charged up with the inductor current.
Figure 9 shows the current loops in the battery charger. The loop in light blue is continuous during TMPPT. When Vin+Vin− is much smaller than Vin+, i.e., Vin is regarded to be constant; the current value is also constant. The current direction is from the battery to the converter. The loops in red during Tres is direct from the converter to the battery.
Table 1 compares the differences of the proposed battery-assisted battery charger from the previous work [16].

3. Experiments

In this section, we report on how the circuit parameters have been determined, and present the measured results in the case of an equivalent circuit model for TEG, a flexible TEG [21], with a mimic heat pipe. The assumed flexible TEG has similar electrical parameters with the ones used in [8,22].

3.1. Determination of the Circuit Parameters

The assumed TEG has an open-circuit voltage of 0.6–1.2 V and an output resistance of 0.6–1.2 kΩ. As a result, TEG can output power of several hundred micro-watt. A potentially maximum peak input current to the converter is assumed to be 3 mA at most, and 180 nm 3 V CMOS was available. Assuming that maximum Vds of the power MOSFETs is as low as 20 mV, the total channel width of PMOS and NMOS was selected to be 2000 μm and 1000 μm, respectively. The channel length of PMOS and NMOS was set at a minimum of 0.3 μm and 0.36 μm, respectively. Based on a previous design [16], the minimum converter cycle time was assumed to be 10 μs. Thus, the inductance was determined with a rough estimate of VEH × Tp/Ipeak~1 V × 10 μs/3 mA~3 mH. The 3 V CMOS allows the maximum input voltage of 3.6 V to avoid any overstress issue. Thus, it is assumed that the nine maximum battery voltage is 2.3 V, and the maximum VEH is 1.2 V in this demonstration. The size of a supply capacitor for Vin (Cin) may affect converter operation because a too small Cin only allows a few suspend/resume cycles, which may affect the power conversion efficiency. Thus, Cin of 0.67 μF and 3.4 μF were tested. The components’ values are summarized in Table 2.
Figure 10 shows a die photo of the converter chip fabricated in 180 nm 3V standard CMOS. It does not need low-Vt transistors because Vin is the sum of VBAT and VEHO. Poly resistors used for BGR and voltage divider occupies 70% of an entire area of 1.05 mm2 for low-power operation.

3.2. Equivalent Circuit Model for TEG

Figure 11a,b shows the measured waveform for Vin in yellow, Vd in light blue, PG in red, and IL in green under the condition of Cin = 0.67 μF, VBAT = 1.6 V, VEH = 1.2 V, Vin+/2 = 1.13 V, Vin−/2 = 1.08 V. Trefresh and TMPPT are shown in the arrows. Vin was controlled at 2.27–2.15 V. Tres starts with PG low. The inductor current linearly increased in a delay of 25 μs and had a peak current of 4.0 mA. Thus, Vin is pulled down. With PG (and NG) high, the inductor current linearly decreased until Vd hit the ground. Because Vin was separate from the power switches and the output resistance of the equivalent TEG model was relatively high, it remained the same. Three cycles pulled Vin down to Vin− in case of a small Cin of 0.67 μF. The MPPT controller disabled converter operation until Vin was pulled up to Vin+.
Let us see if three cycles of the converter operation were matched with the expected one. Assuming that the variation in Vin is much smaller than Vin, i.e., the inductor current increases linearly, the following equations are formulated, where IPK is the peak inductor current and TH (TL) is the active duration of the high side PMOS (the low side NMOS).
L I P T H = V E H O
L I P T L = V B A T
Using (1), the average high side current IP over one converter operation cycle TC can be obtained:
I P = I P K   T H   2 T C = T H 2   V E H O   2 L T C
The output current of TEG IEH is calculated using
I E H = V E H O   R E H
A voltage drop in Vin per converter operation cycle, ΔVin, can be estimated using (5).
C i Δ V i n   T C = I P I E H
When VEHO is 0.6 V and TH is 22μs, ΔVin is calculated to be 36 mV with (1)–(5). In this experimental setup, Vin+Vin− was set to be 0.12 V. As a result, a required number of converter operation cycle is expected to be three, which is matched with the measured result.
Average effective output power of the ET, Peh, defined by Ieh × VEHO, and average effective input power to the battery Pbat were measured with different sets of Vin+ and Vin−, as shown in Figure 12a. Battery charger efficiency can be defined by Pbat/Peh_peak, where Peh_peak indicates the peak value of Peh, as shown in Figure 12b. Approximate curves are all the second order functions of Veho/Veh. All curves have their peak values at Veho/Veh of 0.5–0.55 as expected. The maximum difference between SPICE results and the measured ones in the battery charger efficiency was 10% because measured power was 5% for Peh when SPICE result was higher, whereas measured power was 5% for Pbat when SPICE result was lower. The root cause of those discrepancies needs to be identified, which will be a focus of future works.
The system operated at a low Veh of 0.6 V, as shown in Figure 13 and Figure 14. Figure 13a and Figure 14a are waveforms of SPICE, and Figure 13b and Figure 14b are measured waveforms. Under the condition of Cin = 3.4 μF, VBAT = 1.6 V, VEH = 0.6 V, Vin+/2 = 1.0 V, and Vin−/2 = 0.95 V. The measured waveforms were in good agreement with the SPICE results.
Figure 15a, b respectively show power and efficiency when Veh = 0.6 V. Although the efficiency was as low as 50–60%, the battery was charged with a power of 40–50 μW.

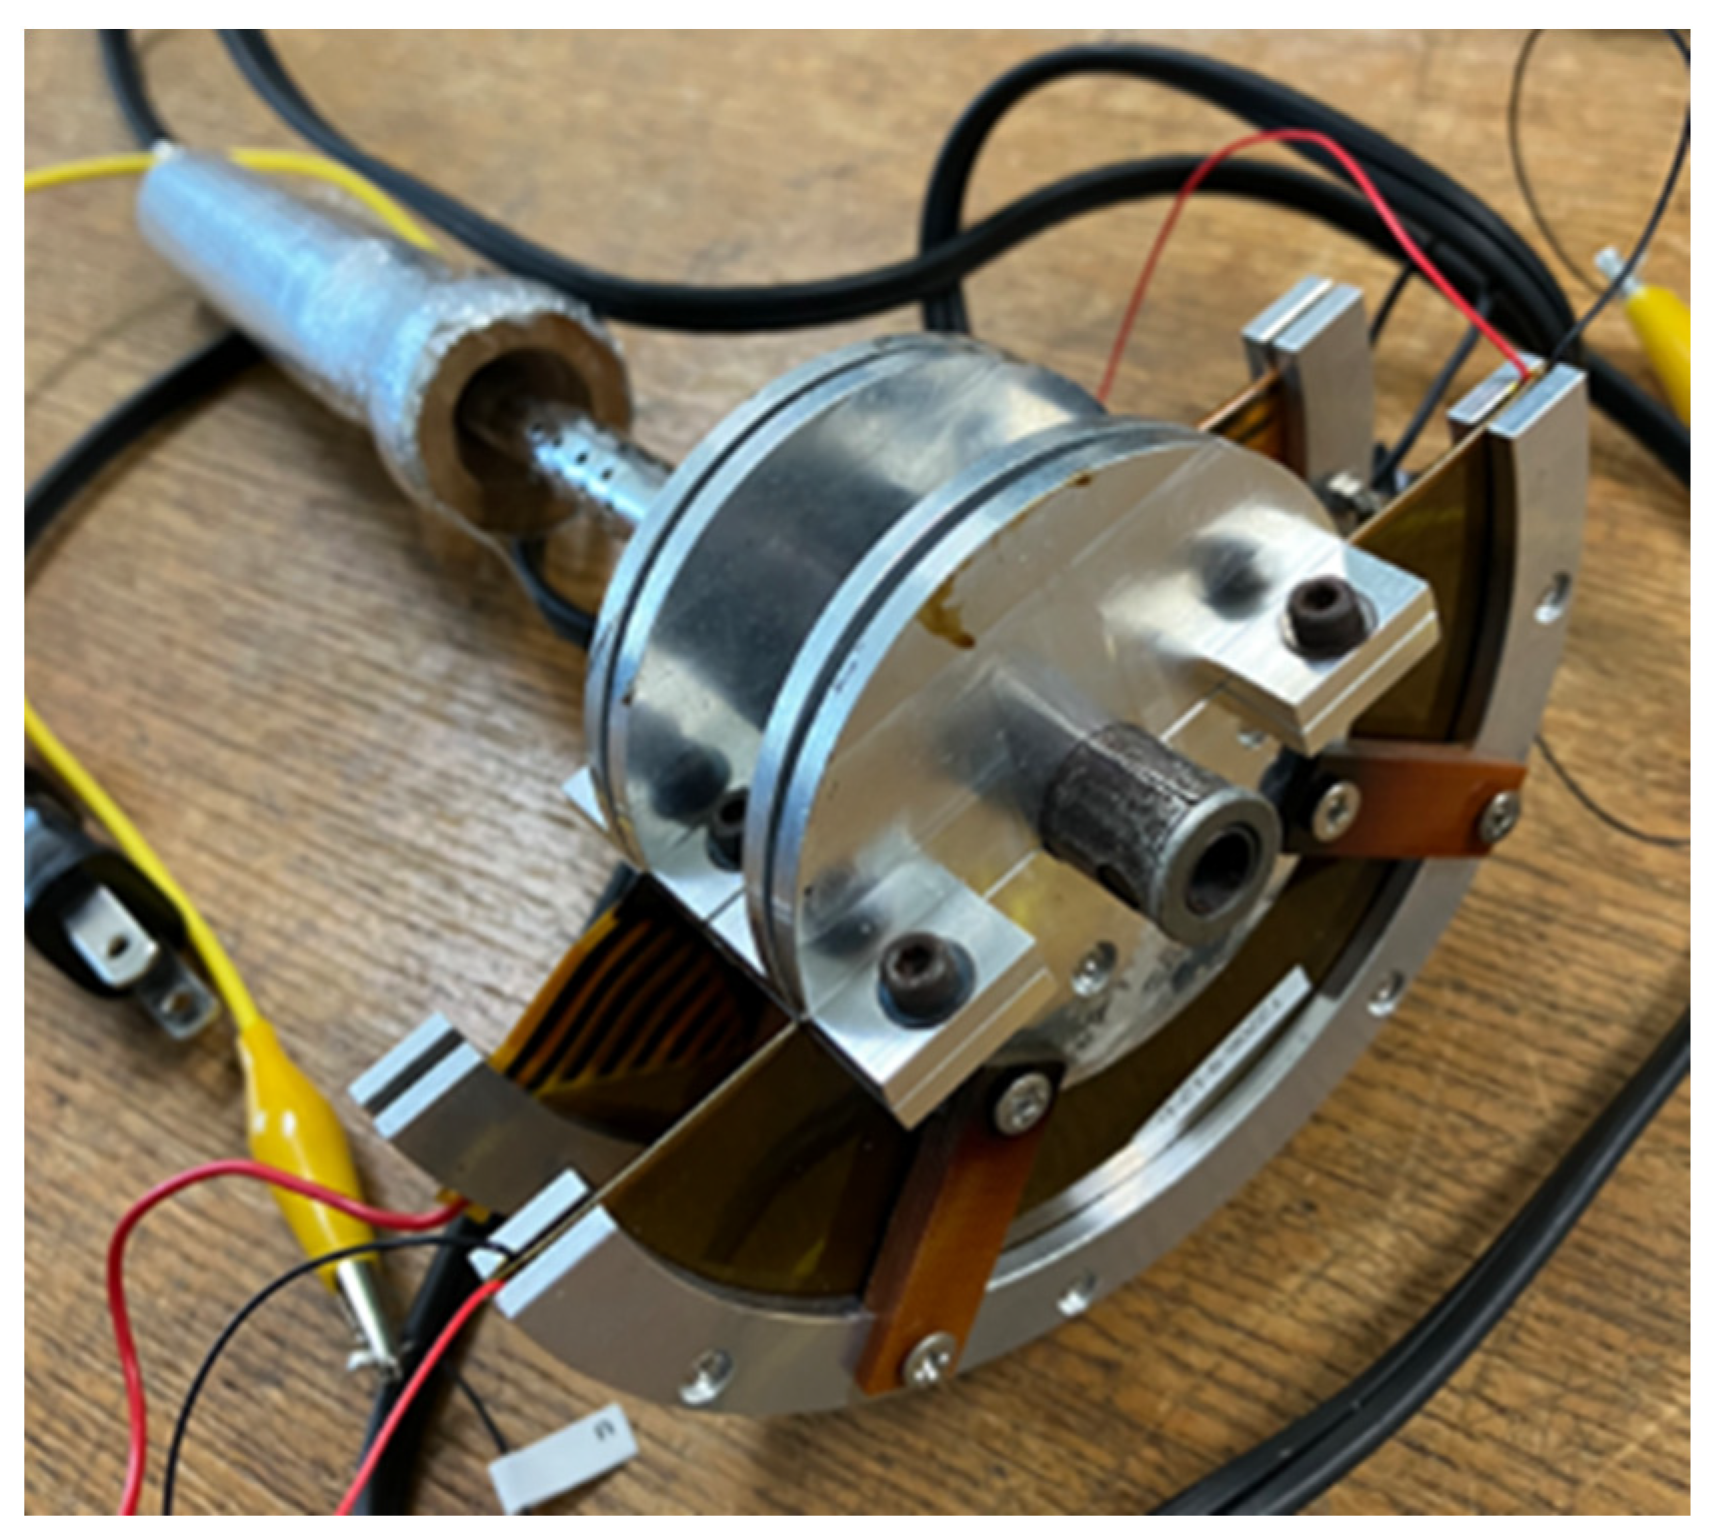
3.3. Flexible TEG with a Mimic Heat Pipe

Figure 16 shows two pieces of flexible TEG arch [21] which can be attached to a mimic heat pipe. The inner diameter is heated, whereas the outer one is at room temperature. A unit TEG generates an open-circuit voltage of 0.6 V, and has an output resistance of 0.6 kΩ when the inner diameter is heated at 100 °C. Such high temperature is available in chemical factories [23]. One application is the detection of a symptom that the temperature is increasing beyond the threshold. The sensor can issue an alarm before a terrible accident occurs. An all-solid-state battery of 2.3 V suitable for energy harvesting applications [24] was used to confirm that the circuit system can charge a battery even with TEG whose maximum attainable output power is 150 μW.
Figure 17 shows that the converter system with a real TEG and a rechargeable battery charged up the battery with a maximum charging efficiency of 38%. Higher battery voltage tends to reduce power efficiency [16].
The battery-assisted battery charger was left working at a Veho of 0.3 V in 5 h. The battery voltage was monitored periodically. Figure 18 shows the battery charging characteristics. The circles indicate measured points. The battery voltage increased from an initial voltage of 2.21 V to 2.28 V after one hour. The battery voltage was saturated at 2.3 V. Thus, the battery-assisted battery charger was confirmed to charge the battery with TEG.

4. Future Work

Even though the concept of the battery-assisted battery charger was validated with the experimental results, the following sub-blocks need to be added in the future. The first one is a reference voltage generator, as shown in Figure 19. In this research, Vin+ and Vin− were provided externally to validate MPPT operation. In production-level converters, they need to be generated internally based on the open-circuit voltage Vin_open monitored in the refresh period, as shown in Figure 19a. Figure 19b shows the timing chart. Using step 4, which is presented in Figure 3, the capacitors C1 and C2 are equalized at Vin_open (=VBAT + VEHO) and VBAT, respectively, with high Φ1. At step 4, Φ1 and Φ2 are set to be low and high, respectively. When the capacitor sizes of C1 and C2 are equal, the capacitor voltage becomes VBAT + VEHO/2, which is the current MPPT voltage VMPPT. A/D converter outputs an updated digital value associated with VMPPT by T3. D/A converter latches the digital value D<4:0> at T3 and outputs Vin+ and Vin− at the appropriate values of VMPPT + ΔV/2 and VMPPT − ΔV/2, respectively, where ΔV is a predetermined ripple voltage in Vin, e.g., 50 mV.
The second additional sub-block is monitoring circuits for Vin_open and VBAT to suspend the converter operation when one of them is too low to reliably operate the converter. Over-charging protection circuit is also needed to prevent the battery from over-charging.

5. Conclusions

The battery-assisted battery charger was proposed for energy harvesting for a thermoelectric generator. The operation cycle was composed of refresh and MPPT periods. In the refresh period, the open-circuit voltage at Vin, i.e., VBAT + VEH, was measured to determine the VMPPT of VBAT + VEH/2 using the switched-capacitor analog calculator. In the MPPT period, the converter was controlled to keep the Vin around VMPPT between Vin+ and Vin−. The MPPT period was composed of suspend and resume periods. In the suspend period, switching operation of the converter was disabled, and so Vin gradually increased toward Vin+. Once Vin hits Vin+, switching operation was resumed, and so Vin gradually decreased toward Vin−. In the resume period, the converter operated in a boundary conduction mode. The input power to the converter is the sum of the power of the battery and power of the TEG. As a result, the converter can charge the battery with the TEG.
The converter circuit was fabricated in 180 nm 3 V standard CMOS with 1.05 mm2. The input reference voltages were varied to validate the maximum power tracking point, which was confirmed to be located at 50–60% of the open-circuit voltage of TEG. The battery-assisted battery charger with a flexible TEG and an all-solid-state battery charged the battery from 2.21 V to 2.28 V in one hour, which confirmed the functionality of the proposed battery charger. Boundary conduction mode (BCM) was applied to the converter design. In future work, such a battery could be designed in a continuous conduction mode and compared with BCM.

Author Contributions

Conceptualization, T.T.; methodology, S.T. and T.T.; software, S.T.; validation, S.T. and T.T.; formal analysis, S.T. and T.T.; investigation, S.T. and T.T.; writing—original draft preparation, S.T..; writing—review and editing, T.T.; funding acquisition, T.T. All authors have read and agreed to the published version of the manuscript.

Funding

This research was funded by Zeon Corp.

Institutional Review Board Statement

Not applicable.

Informed Consent Statement

Not applicable.

Data Availability Statement

Not applicable.

Conflicts of Interest

The authors declare no conflict of interest.

References

  1. Zanella, A.; Bui, N.; Castellani, A.; Vangelista, L.; Zorzi, M. Internet of Things for smart cities. IEEE Internet Things J. 2014, 1, 22–32. [Google Scholar] [CrossRef]
  2. Al-Fuqaha, A.; Guizani, M.; Mohammadi, M.; Aledhari, M.; Ayyash, M. Internet of things: A survey on enabling technologies, protocols, and applications. IEEE Commun. Surv. Tutor. 2015, 17, 2347–2376. [Google Scholar] [CrossRef]
  3. Mitcheson, P.D.; Yeatman, E.M.; Rao, G.K.; Holmes, A.S.; Green, T.C. Energy harvesting from human and machine motion for wireless electronic devices. Proc. IEEE 2008, 96, 1457–1486. [Google Scholar] [CrossRef]
  4. Sudevalayam, S.; Kulkarni, P. Energy harvesting sensor nodes: Survey and implications. IEEE Commun. Surveys Tuts. 2011, 13, 443–461. [Google Scholar] [CrossRef]
  5. Xiaosen, L.; Sanchez-Sinencio, E. A 0.45-to-3V reconfigurable charge-pump energy harvester with two-dimensional MPPT for Internet of Things. In Proceedings of the 2015 IEEE International Solid-State Circuits Conference-(ISSCC) Digest of Technical Papers, San Francisco, CA, USA, 22–26 February 2015; pp. 1–3. [Google Scholar]
  6. Carreon-Bautista, S.; Huang, L.; Sanchez-Sinencio, E. An autonomous energy harvesting power management unit with digital regulation for IoT applications. IEEE J. Solid-State Circuits 2016, 51, 1457–1474. [Google Scholar] [CrossRef]
  7. Yoon, S.; Carreon-Bautista, S.; Sánchez-Sinencio, E. An Area Efficient Thermal Energy Harvester with Reconfigurable Capacitor Charge Pump for IoT Applications. IEEE Trans. Circuits Syst. II Express Briefs 2018, 65, 1974–1978. [Google Scholar] [CrossRef]
  8. Nono, K.; Tanzawa, T. One-Dimensional Maximum Power Point Tracking Design of Switched-Capacitor Charge Pumps for Thermoelectric Energy Harvesting. Electronics 2023, 12, 1203. [Google Scholar] [CrossRef]
  9. Salas, V.; Olías, E.; Barrado, A.; Lazaro, A. Review of the maximum power point tracking algorithms for stand-alone photovoltaic systems. Sol. Energy Mater. Sol. Cells 2006, 90, 1555–1578. [Google Scholar] [CrossRef]
  10. Liu, X.; Sánchez-Sinencio, E. An 86% Efficiency 12 μW Self-Sustaining PV Energy Harvesting System with Hysteresis Regulation and Time-Domain MPPT for IOT Smart Nodes. IEEE J. Solid-State Circuits 2015, 50, 1424–1437. [Google Scholar] [CrossRef]
  11. Kadirvel, K.; Ramadass, Y.; Lyles, U.; Carpenter, J.; Ivanov, V.; McNeil, V.; Chandrakasan, A.; Lum-Shue-Chan, B. A 330nA Energy-Harvesting Charger with Battery Management for Solar and Thermoelectric Energy Harvesting. In Proceedings of the IEEE International Conference on Solid-State Circuits (ISSCC), San Francisco, CA, USA, 19–23 February 2012; pp. 106–107. [Google Scholar]
  12. El-Damak, D.; Chandrakasan, A.P. A 10 nW–1 μW Power Management IC With Integrated Battery Management and Self-Startup for Energy Harvesting Applications. IEEE J. Solid State Circuits 2016, 51, 943–954. [Google Scholar]
  13. de Queiroz, A.C.M.; Domingues, M. The Doubler of Electricity Used as Battery Charger. IEEE Trans. Circuits Syst. II Express Briefs 2011, 58, 797–801. [Google Scholar] [CrossRef]
  14. Liu, P.-J.; Chen, T.-F.; Yang, H.-S. A Li-Ion Battery Charger with Variable Charging Current and Automatic Voltage-Compensation Controls for Parallel Charging. IEEE J. Emerg. Sel. Top. Power Electron. 2022, 10, 997–1006. [Google Scholar] [CrossRef]
  15. Guo, Z.-M.; Huang, S.-M.; Tsai, T.-H. A Current-Mode Control Li-Ion Battery Charger with Trickle-Current Mode and Built-In Aging Detection. In Proceedings of the 2019 IEEE International Symposium on Circuits and Systems (ISCAS), Sapporo, Japan, 26–29 May 2019; pp. 1–4. [Google Scholar] [CrossRef]
  16. Tanabe, S.; Sakamoto, Y.; Uchida, H.; Tanzawa, T. A Hybrid Thermoelectric Generator–Battery Power Supply System Toward Replacement-Free Battery. In Proceedings of the 2023 11th International Conference on Power Electronics and ECCE Asia (ICPE 2023-ECCE Asia), Jeju Island, Republic of Korea, 22–25 May 2023; pp. 1817–1822. [Google Scholar] [CrossRef]
  17. Arbetter, B.; Erickson, R.; Maksimovic, D. DC-DC converter design for battery-operated systems. In Proceedings of the PESC ‘95-Power Electronics Specialist Conference, Atlanta, GA, USA, 18–22 June 1995; Volume 1, pp. 103–109. [Google Scholar] [CrossRef]
  18. Huesgen, T.; Woias, P.; Kockmann, N. Design and fabrication of MEMS thermoelectric generators with high temperature efficiency. Sens. Actuators A Phys. 2008, 145, 423–429. [Google Scholar] [CrossRef]
  19. Micropelt. Date Sheet of TGP-651. Available online: http://www.micropelt.com/ (accessed on 1 September 2023).
  20. Du, Y.; Xu, J.; Paul, B.; Eklund, P. Flexible thermoelectric materials and devices. Appl. Mater. Today 2018, 12, 366–388. [Google Scholar] [CrossRef]
  21. Suemori, K.; Hoshino, S.; Kamata, T. Flexible and lightweight thermoelectric generators composed of carbon nanotube—Polystyrene composites printed on film substrate. Appl. Phys. Lett. 2013, 103, 153902. [Google Scholar] [CrossRef]
  22. Koketsu, K.; Tanzawa, T. Design of a charge pump circuit and system with input impedance modulation for a flexible-type thermoelectric generator with high-output impedance. Electronics 2021, 10, 1212. [Google Scholar] [CrossRef]
  23. Khan, M.Q.; Malarmannan, S.; Manikandaraja, G. Power generation from waste heat of vehicle exhaust using thermo electric generator: A review. IOP Conf. Ser. Mater. Sci. Eng. 2018, 402, 012174. [Google Scholar] [CrossRef]
  24. Maxell. All-Solid-State Battery (PSB401515L). Available online: https://biz.maxell.com/en/rechargeable_batteries/allsolidstate.html (accessed on 1 September 2023).
Figure 1. (a) Stand-alone battery, (b) hybrid TEG—battery power supply system [16], (c) battery-assisted battery charger with MPPT.
Electronics 12 04102 g001
Figure 2. Target operation for the input voltage Vin of the battery-assisted battery charger; (a) entire period and (b) one cycle of suspend (Tsus) and resume (Tres) times.
Electronics 12 04102 g002
Figure 3. Flow chart of the converter control.
Electronics 12 04102 g003
Figure 4. Configuration of the battery charger (a) and top block of the battery-assisted battery-charger converter chip (b).
Electronics 12 04102 g004
Figure 5. (a) Voltage-controlled current-generator CURRENT_MIRROR_CKT and (b) power-on reset PONRST.
Electronics 12 04102 g005
Figure 6. Block diagram of “OSC” with a binary counter (a) and a pulse generator (b), and waveform of “OSC” (c).
Electronics 12 04102 g006
Figure 7. (a) Block diagram of “MPPT_CKT” and (b) PG/NG pulse generator “PGNG_CKT”.
Electronics 12 04102 g007
Figure 8. (a) Power switches with an inductor and battery, (b) voltage and current waveform.
Electronics 12 04102 g008
Figure 9. Current loops in the battery charger.
Electronics 12 04102 g009
Figure 10. Die photo of the converter chip.
Electronics 12 04102 g010
Figure 11. Measured waveform with 5ms/div. (a) and 0.1ms/div. (b) under the condition of Cin = 0.67 μF, VBAT = 1.6 V, VEH = 1.2 V, Vin+/2 = 1.13 V, Vin−/2 = 1.08 V.
Electronics 12 04102 g011
Figure 12. (a) Peh, Pbat vs. Veho/Veh and (b) Pbat /Peh_peak, vs. Veho/Veh under the condition of Cin = 0.67 μF, VBAT = 1.6 V, VEH = 1.2 V, Vin+/2 = 1.13 V, and Vin−/2 = 1.08 V.
Electronics 12 04102 g012
Figure 13. (a) SPICE and (b) measured waveforms under the condition of Cin = 3.4 μF, VBAT = 1.6 V, VEH = 0.6 V, Vin+/2 = 1.0 V, and Vin−/2 = 0.95 V.
Electronics 12 04102 g013
Figure 14. Zoom version of Figure 13: (a) SPICE and (b) measured waveforms.
Electronics 12 04102 g014
Figure 15. (a) Peh, Pbat vs. Veho/Veh and (b) Pbat /Peh_peak, vs. Veho/Veh under the condition of Cin = 3.4 μF, VBAT = 1.6 V, VEH = 0.6 V, Vin+/2 = 1.0 V, and Vin−/2 = 0.95 V.
Electronics 12 04102 g015
Figure 16. Two pieces of flexible TEG arch attached to a mimic heat pipe.
Electronics 12 04102 g016
Figure 17. (a) Peh, Pbat vs. Veho/Veh and (b) Pbat/Peh_peak, vs. Veho/Veh for flexible TEG and all-solid-state battery.
Electronics 12 04102 g017
Figure 18. Battery voltage during battery charging.
Electronics 12 04102 g018
Figure 19. (a) Reference voltage generator and (b) timing chart.
Electronics 12 04102 g019
Table 1. Comparison of this work with the previous one.
Previous Work [16]This Work
Operation modeDiscontinuous conduction modeBoundary conduction mode (during RES period)
Outputs of the converterLoad and batteryBattery-only
Parameter to be controlledVLOAD to be controlled to the target voltage Vin− < Vin < Vin+
Charged battery power
Depending on PLOAD
Converter output power split into the load and the battery
To be maximized
Table 2. Components’ values of measured system.
Parameter SymbolValue
Input power supply capacitor Cin [μF]0.67, 3.4
Inductor L [mH]3.0
Battery VBAT [V]1.6, 2.3
Equivalent circuit of TEGOpen circuit voltage VET [V]0.6, 1.2
Equivalent output resistance RET [kΩ]1.2
Disclaimer/Publisher’s Note: The statements, opinions and data contained in all publications are solely those of the individual author(s) and contributor(s) and not of MDPI and/or the editor(s). MDPI and/or the editor(s) disclaim responsibility for any injury to people or property resulting from any ideas, methods, instructions or products referred to in the content.

