Article

The Economic Impact and Carbon Footprint Dependence of Energy Management Strategies in Hydrogen-Based Microgrids

by
Jesús Rey
1,*,
Francisca Segura
1,*,
José Manuel Andújar
1 and
Andrea Monforti Ferrario
2
1
Research Centre on Technology, Energy and Sustainability (CITES), Campus La Rábida, University of Huelva, Avenida de las Artes, 21007 Huelva, Spain
2
ENEA Department of Energy Technologies and Renewable Sources, Laboratory of Energy Storage, Batteries and Hydrogen Production & Use Technologies (TERIN-PSU-ABI), Via Anguillarese, 00123 Rome, Italy
*
Authors to whom correspondence should be addressed.
Electronics 2023, 12(17), 3703; https://doi.org/10.3390/electronics12173703
Submission received: 31 July 2023 / Revised: 18 August 2023 / Accepted: 29 August 2023 / Published: 1 September 2023
(This article belongs to the Special Issue Energy Harvesting and Storage Technologies)

Abstract

:
This paper presents an economic impact analysis and carbon footprint study of a hydrogen-based microgrid. The economic impact is evaluated with respect to investment costs, operation and maintenance (O&M) costs, as well as savings, taking into account two different energy management strategies (EMSs): a hydrogen-based priority strategy and a battery-based priority strategy. The research was carried out in a real microgrid located at the University of Huelva, in southwestern Spain. The results (which can be extrapolated to microgrids with a similar architecture) show that, although both strategies have the same initial investment costs (EUR 52,339.78), at the end of the microgrid lifespan, the hydrogen-based strategy requires higher replacement costs (EUR 74,177.4 vs. 17,537.88) and operation and maintenance costs (EUR 35,254.03 vs. 34,877.08), however, it provides better annual savings (EUR 36,753.05 vs. 36,282.58) and a lower carbon footprint (98.15% vs. 95.73% CO2 savings) than the battery-based strategy. Furthermore, in a scenario where CO2 emission prices are increasing, the hydrogen-based strategy will bring even higher annual cost savings in the coming years.

1. Introduction

As a result of population and economic growth, global energy demand (due, among other reasons, to a higher percentage of the population having access to electricity) is increasing [1,2]. To meet this energy demand, fossil fuels are used to a large extent, which has a negative impact on air pollution and climate change. To reduce the use of fossil fuels, different renewable energy sources (RESs) [3,4] have been proposed as alternatives, but one of the major problems associated with them is that, due to their randomness, they are not available all the time. Thus, a possible solution is to store renewable energy when there is a surplus for use when there is a shortage [3,5,6].
Accordingly, in RES-based microgrids, energy storage systems (ESSs) [7] are essential to guarantee the load demand at all times. Batteries are usually the most common solution [8,9], even hybridised with a diesel generator [10] or water pumping technologies [11]. But, although the most common small- and medium-scale ESSs are batteries, hydrogen storage has some advantages over batteries and, in fact, is becoming increasingly important [12]. For example, the lower heating value (LHV) of hydrogen is very high, namely 120 MJ/kg [13], so it can be stored for use in long-term operation [14]. In this sense, hybrid storage based on hydrogen (long term) and battery (short and medium term) systems in microgrids seems to be the solution to satisfy the load demand and overcome the drawback of the intermittent nature of RESs.
Given that the scientific literature has demonstrated that renewable-based microgrids hybridising hydrogen and battery storage as an ESS are technically feasible [15], the time has come to perform a cost assessment and a carbon footprint analysis to study how to make this type of plant more economically and environmentally viable. For this purpose, the literature offers different options: from a sensitivity analysis of the investment costs and the selling price of hydrogen in the gas network [16] to a simulation study analysing the influence of system capacity and price on the operating cost [17]. In ref. [18], a mixed-integer linear programming model to study the CO2 savings and fuel prices (compared to a diesel benchmark) of a microgrid operating as a fuelling station is presented, and ref. [19] focuses on the study of the cost-effectiveness and environmental impact of a hypothetical microgrid located on an island compared to the country’s national grid. The work presented in ref. [20] has the particularity of solving the ESS by hybridising a hydrogen and heat storage system, avoiding the use of batteries. To solve the proposed optimisation model, the study uses weighted model predictive control (weighted MPC). In ref. [21], a resilience-oriented optimisation for microgrids with an ESS composed of hydrogen and batteries is studied. In this case, the problem is formulated using stochastic MPC (SMPC) techniques to control the possible transitions between grid-connected and islanded modes, which allows for increasing the economic revenues and maximising the lifetime of the systems taking into account the systems’ operating costs [21]. Also using MPC theory, ref. [22] presents a greedy energy management strategy (EMS) for a hybrid hydrogen- and battery-based microgrid to reduce load losses, energy costs, and investment costs. Finally, in ref. [23], the authors develop a deep deterministic policy gradient algorithm to reduce the operating costs of a microgrid with hydrogen storage by simulation, compared to traditional algorithms.
In this paper, the authors propose an econometric evaluation and carbon footprint analysis of a hybrid microgrid based on hydrogen and batteries using renewable energy sources for power generation, taking into account the costs of investment, operation, and maintenance (O&M) costs, as well as those related to the replacement of its elements. The study was carried out by differentiating between two different forms of microgrid control (EMSs): a hydrogen-based priority strategy and a battery-based priority strategy, which allowed an economic comparison between the two. The carbon footprint was obtained from the Spanish electricity mix (origin of electricity in the main grid) taking into account the amount of energy purchased by the microgrid from the main grid.
Compared to the analysed references, the main novelty of this paper is that it studies all the costs involved: investment, O&M, and replacement costs (in conjunction with the time in which they occur), as well as the annual savings of the whole microgrid and of each of its systems, considering the actual operating time according to each EMS. In that sense, no similar approach has been found in the scientific literature. Previous works, such as ref. [22], resort to performing an annual profit analysis, while others, such as refs. [16,18,21], carry out economic studies based on the theoretical lifespan or degradation of each element supplied by the manufacturer, but without considering the actual operating time of each element. Although most of the previous works consider replacement costs based on the lifespan and degradation rate defined by equipment manufacturers, in practice this consideration would lead to approximate but not accurate results since the replacement of an element depends on the accumulated degradation suffered, and this depends on the EMSs that control the microgrid performance. Therefore, for a true economic analysis, it is necessary to take into account the actual replacement cost based on the actual operating hours of each element of the microgrid, which depends on the EMS used. Finally, with the exception of ref. [18], carbon footprint analysis is not addressed in the analysed references.
Based on the literature review, there are works where investment costs, O&M costs, as well as annual benefits of the microgrid are studied, but no papers were found that included replacement costs taking into account the EMS used. Moreover, no previous work has studied the carbon footprint of a microgrid, considering the EMS. In this sense, the research gap addressed in this paper is that an econometric evaluation of a hydrogen-based microgrid is presented. It takes into account the end-of-lifespan replacements of the elements that make up the microgrid according to two different EMSs: hydrogen-based priority or battery-based priority. An analysis of the carbon footprint associated with the operation of the microgrid according to the priority strategy used is also carried out. The results obtained on the real microgrid used for this study can be extended to other microgrids with similar architectures.
Table 1 shows a comparison between the authors’ proposal and the analysed references, highlighting the main novelties of the present study.
The next section describes the materials used and methods followed to develop the cost analysis carried out in Section 3. The carbon footprint study is detailed in Section 4, and Section 5 and Section 6 include the discussion and conclusions, respectively.

2. Materials and Methods

The microgrid, Figure 1a, used to implement the econometric study produces fully renewable electricity, in order to guarantee zero-CO2 emissions electricity production and energy storage. It is located at the “La Rábida Campus” of the University of Huelva (southwestern Spain), and it includes RES production (solar and wind) of tens of kWs, as well as an ESS hybridised by a hydrogen subsystem (consisting of an electrolyser, a hydrogen tank, and a fuel cell) of several kWs and a battery bank of tens of kWh.
A high-voltage DC bus (400 VDC) is used to connect the different elements of the microgrid, which acts as the backbone of the microgrid. The DC bus exchanges power between sources (most of them are DC) and loads, avoiding problems related to reactive power, and thus improving the performance of the microgrid [24]). Additionally, single-phase and three-phase AC buses allow RES-based production to power AC loads. Regarding renewable sources, the photovoltaic (PV) system is made up of three technologies (monocrystalline, polycrystalline, and thin film) and is connected to the DC and three-phase AC buses by means of DC/DC and DC/AC converters, respectively. A similar connection has been established for the horizontal axis wind turbine (WT), with the difference that it is connected via a DC/AC converter to the single-phase bus (and not to the three-phase bus). The proton exchange membrane (PEM) fuel cell is connected to the DC bus through a DC/DC converter that ensures power is regulated to the bus voltage. The battery bank is directly connected to the DC bus to ensure bus stability [25]. On the load side, a programmable 15 kW DC load allows any DC bus consumption profile to be simulated in a practical way. As a complement, a programmable 18 kW AC load can do the same from the three-phase bus. Finally, as for the hydrogen subsystem, an electrolyser powered by the DC bus through a DC/DC converter or by the AC bus through a 3-phase rectifier (which will transform AC into DC to later power the electrolyser), produces hydrogen that is stored in a high-pressure tank to be later consumed by the PEM-FC [15]. The EMS is implemented using an MPC designed ad hoc for this application [26]. All the power electronics and instrumentation, as well as the EMS (including its local control loops for each element of the microgrid) shown in Figure 1a, were developed by the authors [27].

2.1. Microgrid Components

The components of the microgrid shown in Figure 1a are described in detail below, including the renewable sources, the hydrogen subsystem, and the battery bank.

2.1.1. PV Solar Panels

One of the RESs for power generation in the microgrid is a 15 kWp (peak kilowatts) PV field (installed on the rooftop), which can be divided into three sub-fields of 5 kWp, each implemented in a different technology: monocrystalline, polycrystalline, and Si-based amorphous thin film.

2.1.2. Wind Turbine

The other RES for power generation in the microgrid is a 3 kWp horizontal axis wind turbine that is also installed on the rooftop, next to the PV field.

2.1.3. Electrolyser

To take advantage of the energy excess (which occurs when RES production is higher than load demand), the microgrid uses it to produce hydrogen by electrolysis thanks to a 10 kWe (electric kilowatts) alkaline electrolyser working at a pressure of 30 bar, the production of which is stored in a tank.

2.1.4. PEM Fuel Cell

To meet the demand at times when the RES generation is lower than the demanded energy (energy deficit), a PEM-FC is used, which can work together with the battery bank or independently, depending, obviously, on the strategy implemented in the EMS. Its rated power is 3.4 kWe.

2.1.5. Compressed Hydrogen Storage Tank

To store the hydrogen produced by the alkaline electrolyser, the microgrid includes a hydrogen storage tank with a nominal pressure of 30 bar and a capacity of 1.044 m3. For the EMS implementation in the microgrid controller, to obtain the hydrogen mass capacity of the tank, the authors use the ideal gas law (which can be used because hydrogen behaves as an ideal gas at pressures below 100 atm [28]). From here, the number of moles of hydrogen contained in the tank can be obtained by Equation (1) [28,29].
p t V t = n t R T t n t = p t V t R T t    
where
  • p t is the tank pressure ( 30 · 10 5 Pa);
  • n t is the number of moles contained in the tank (mol);
  • V t is the tank volume ( 1.044 m3);
  • R is the ideal gas constant (8.31 J/(mol·K));
  • T t is the temperature of the gas contained in the tank (300 K).
The number of moles of hydrogen contained in the tank can be expressed by Equation (2) [28].
n t = m t M  
where
  • m t is the mass of the gas contained in the tank (kg);
  • M is the hydrogen molar mass (0.002 kg/mol).
  • After substituting values, the mass contained in the tank can be obtained by Equation (3).
    m t = M p t V t R T t = 0.002 kg mol · 30 · 10 5 Pa · 1.044   m 3 8.31 J mol · K · 300   K = 2.51   kg

2.1.6. Lead–Acid Battery

During periods of excess RES production, surplus energy can be stored in a battery bank consisting of 34 lead–acid batteries, each with a capacity of 100 Ah and 12 V, amounting to a total energy storage capacity of 40.8 kWh. In addition, when the energy production from the PV panels and WT is not enough, the battery bank can supply the load demand, either independently or in conjunction with the hydrogen subsystem, obviously depending on the EMS implemented.
Table 2 summarises the technical parameters of the microgrid elements.

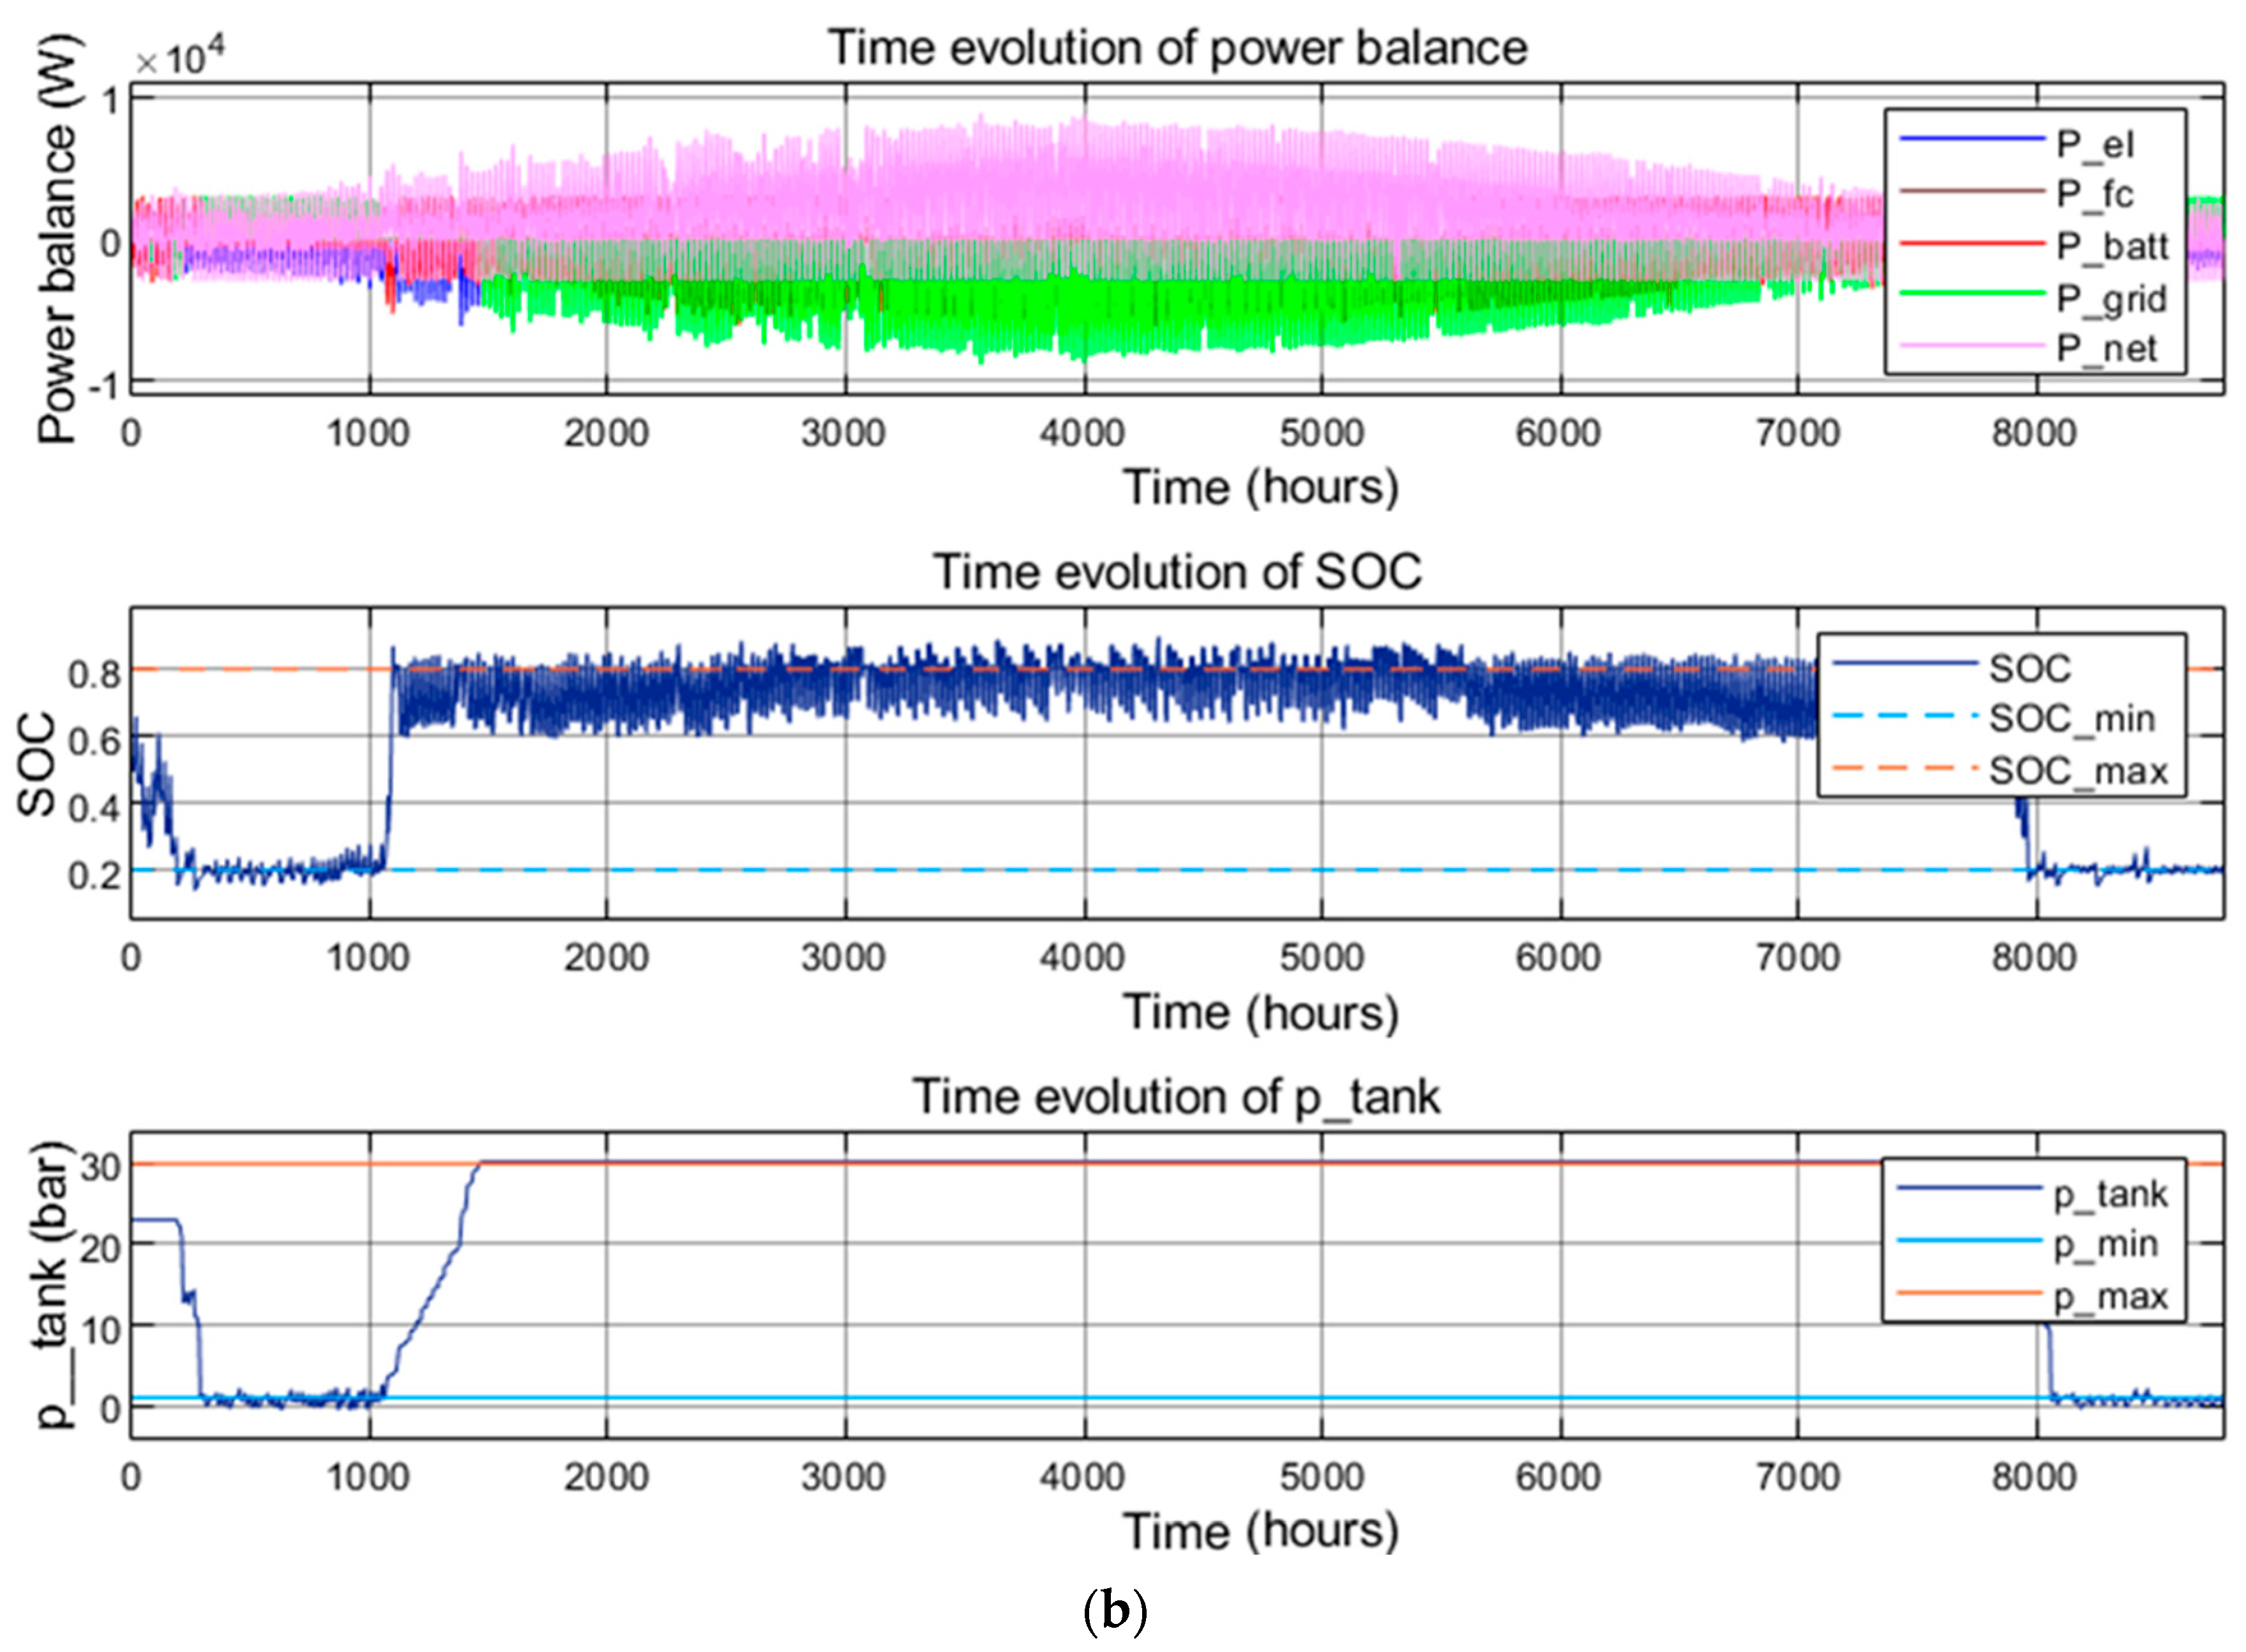
2.2. Energy Management Strategy (EMS): Priority Based on Hydrogen or on Batteries

Based on Figure 1b and taking into account that the RESs are always supplying power to the microgrid (whenever available, of course), the decisions to be taken by the EMS will be based on Equation (4).
P n e t = P R E S P l o a d
where
  • P n e t : net available power (W); P n e t < 0 means energy deficit, while P n e t > 0 means energy excess;
  • P R E S : power injected to the DC bus from PV and/or WT production (W); P R E S 0 is always true;
  • P l o a d : power extracted from the DC bus due to load demand (W); P l o a d 0 is always true.
The sign criterion adopted for power balance (please see Figure 1b and Equation (4)) means that if P > 0 , power is injected into the DC bus, while if P < 0 , power is extracted from the DC bus.
The implemented EMS considers that when there is surplus energy, P n e t > 0 , it may be suitable to sell energy to the main grid if the battery bank has a high state of charge (SOC) and excess energy cannot be stored in the form of hydrogen because the tank is full. On the contrary, at times of energy deficit (when P n e t < 0 ), it is necessary to buy electricity from the main grid if the load demand cannot be guaranteed with the energy stored in the ESS. To decide how to store excess energy and how to supply the load demand at times of energy deficit, two different EMS strategies are presented below, both based on Equation (5) which is derived from Equation (4) and reflects the diagram in Figure 1b.
P t = P n e t + P g r i d + P H 2 + P b a t t = 0
where
  • P t : total microgrid power (W) understood as the power balance on the DC bus; of course, it must always be guaranteed that P t = 0 ;
  • P g r i d : power injected into or extracted from the main grid (W); if the power is extracted from the DC bus to be injected into the main grid, P g r i d = P g r i d   o u t < 0 ; on the other hand, if the power is injected from the main grid to the DC bus, P g r i d = P g r i d   i n > 0 ;
  • P H 2 : power injected into or extracted from the hydrogen subsystem (W); if the power is extracted from the DC bus to supply the electrolyser, P H 2 = P e l < 0 , while if the power is injected into the bus via the fuel cell, P H 2 = P F C > 0 ;
  • P b a t t : power injected into or extracted from the battery bank (W); if power is extracted from the DC bus to recharge the battery bank, P b a t t = P b a t t   c h a r g e < 0 , while if power is injected into the DC bus from the battery bank, P b a t t = P b a t t   d i s c h a r g e > 0 .

2.2.1. Hydrogen-Based Priority Strategy

This strategy pursues a prioritisation of the use of the hydrogen subsystem over the battery bank. To this end, at times of excess renewable power ( P n e t > 0 ) (Figure 2a), the excess energy will be used to produce hydrogen by the electrolyser as long as the tank pressure, p t a n k , is higher than the minimum (1 bar [15]) and lower than the maximum (30 bar [15]), that is, provided that p m i n < p t a n k < p m a x , and as long as P n e t P e l (if this condition is not satisfied, while S O C m i n < S O C < S O C m a x , the electrolyser and the main grid will be used to produce hydrogen and to inject the excess power, respectively; and while P n e t P e l + | P b a t t .   c h .   | , both the battery and the electrolyser will be used, to store energy and to produce hydrogen, respectively; on the other hand, if S O C m i n < S O C < S O C m a x and P n e t > P e l + | P b a t t .   c h .   | , apart from the electrolyser and the battery, the main grid will also be used to inject the excess power). If one of these conditions is not fulfilled, excess energy is stored in the battery bank as long as its SOC is between its minimum ( S O C m i n = 20% [15]) and maximum ( S O C m a x = 80% [15]), i.e., as long as S O C m i n < S O C < S O C m a x and as long as P n e t P b a t t . c h . (if the latter condition is not fulfilled, both the battery and the main grid will be used to store energy and to inject the excess power into the main grid, respectively). If none of the above conditions are met, the excess energy will be injected into the main grid. Conversely, at times of renewable power deficit ( P n e t < 0 ), the fuel cell will be responsible for supplying energy and satisfying the load demand while p m i n < p t a n k < p m a x and while P n e t P F C (if the latter condition is not fulfilled, while S O C m i n < S O C < S O C m a x , both the fuel cell and the battery will be used to supply power if P n e t P F C + | P b a t t .   d i s c .   | , if not, in addition to these two elements, the main grid will also be used to supply power). Otherwise, and if the S O C of the battery is S O C m i n < S O C < S O C m a x and P n e t P b a t t . d i s c . , it will be the battery bank which guarantees the load demand (while if P n e t > P b a t t . d i s c . , it will be both the battery and the main grid which will supply power). If none of the above conditions are met, it will be the main grid which will supply the load demand.
The hydrogen-based priority strategy allows for better performance, due to the greater amount of energy (kWh) stored in the form of hydrogen compared to batteries. However, this strategy implies that hydrogen-based equipment runs longer, suffers more degradation, and, consequently, the equipment must be replaced more frequently.

2.2.2. Battery-Based Priority Strategy

This strategy pursues, whenever necessary, a prioritisation of the use of the battery bank over the hydrogen subsystem. To this end, at times of renewable power excess ( P n e t > 0 ) (Figure 2b), excess energy will be stored in the battery bank as long as its S O C is S O C m i n < S O C < S O C m a x and as long as P n e t P b a t t . c h . (if this condition is not satisfied, while p m i n < p t a n k < p m a x , both the battery and the main grid will be used to store energy and to inject the excess power, respectively; and while P n e t P e l + | P b a t t .   c h .   | , the excess power will be used to store energy and to produce hydrogen in the battery and in the electrolyser, respectively; if P n e t > P e l + | P b a t t .   c h .   | , apart from the electrolyser and the battery, the main grid will also be used to inject the excess power). If the battery bank is charged, S O C = S O C m a x , the excess power is used to produce hydrogen by the electrolyser as long as the tank pressure is between its minimum and maximum values, p m i n < p t a n k < p m a x and as long as P n e t P e l (if the latter condition is not fulfilled, both the electrolyser and the main grid will be used to produce hydrogen and to inject the excess power, respectively). When the hydrogen tank is fully charged, p t a n k p m a x , the excess energy is injected into the main grid. Conversely, at times of renewable power deficit ( P n e t < 0 ), the battery bank is mainly responsible for guaranteeing the load demand as long as its S O C is within its operating range ( S O C m i n < S O C < S O C m a x ) and as long as P n e t P b a t t . d i s c . (if the latter condition is not fulfilled, while p m i n < p < p m a x , both the fuel cell and the battery will be used to supply power if P n e t P F C + | P b a t t .   d i s c .   | ; if not, apart from these two elements, the main grid will also be used to supply power). Otherwise, and if the hydrogen subsystem is in its operating range ( p m i n < p t a n k < p m a x ), it will be the fuel cell which guarantees the load demand as long as P n e t P F C (if not, both the fuel cell and the main grid will provide power). However, if the hydrogen subsystem is also not in its operating range, the main grid will be ultimately responsible for supplying the load demand. Figure 2 illustrates both EMSs implemented.

3. Cost Analysis

Depending on the selected EMS, the battery bank and the hydrogen subsystem are expected to have different operating times and, consequently, will result in different operating and maintenance costs in the microgrid. Therefore, replacement costs will also depend on the EMS. In this section, the costs associated with the initial investment of the microgrid, its operation, and the replacement of its components will be evaluated over a 20-year time horizon [12]. The cost analysis is performed on a real microgrid in operation, as shown in Figure 1a.

3.1. Initial Investment Costs

The microgrid, consisting of the elements described in Section 2, has an associated initial cost, due to the initial capital expenditures (CAPEX) of each component, Table 3.
Furthermore, the two associated costs of RESs (PV and WT) date from the year 2019 (the three different PV technologies have been considered to have the same associated costs), so they were updated to 2022 to calculate the total initial investment costs. For this purpose, it was taken into account that, according to IRENA [30] there is an annual cost reduction, applied to the discounted capital costs for each year, of 5% for wind power and 8.5% for residential PV power.

3.2. Replacement Costs

Of course, during the lifespan of the microgrid, its elements deteriorate. But depending on the priority strategy, one element degrades more or less than the other. Except in exceptional circumstances, the RESs (PV and WT) and the hydrogen tank do not need to be replaced (their lifespan is greater than or equal to that of the microgrid [12]), and the focus should be on the electrolyser, the fuel cell, and the battery bank. The first two will degrade more with the EMS based on the hydrogen priority strategy, while the battery bank will degrade more with the EMS based on the battery priority strategy. The simulation identifies when it is time to replace a component based on the strategy applied.
Figure 3 shows the results of the microgrid simulation with each of the EMS strategies [15]. From these results, it is possible to derive Table 4, which shows the number of hours/year that the battery bank, the electrolyser, and the fuel cell are operating under each EMS.
Based on Table 4, and knowing the cumulative degradation of each element, it is possible to identify the number of replacements required during the microgrid lifespan.
Then, with respect to the battery, the number of operating cycles of the battery during a whole year, N y . c y c l e s , can be obtained from Equation (6).
N y . c y c l e s = E y . c h a + d i s c h · S O C m a x S O C m i n E b a t t e r y
where
  • N y . c y c l e s : number of operating cycles of the battery during one year (cycles/year);
  • E y . c h a + d i s c h : sum of the energy used during a whole year to charge and discharge the battery (946.3 + 874.6 = 1820.9 kWh for the hydrogen-based priority EMS and 4127 + 3250 = 7377 kWh for the battery-based priority EMS);
  • S O C m a x : maximum battery SOC (80%);
  • S O C m i n : minimum battery SOC (20%);
  • E b a t t e r y : maximum battery energy storage capacity (40.8 kWh).
Once this is done, it is possible to know when the battery needs to be replaced.
On the other hand, to calculate the lifespan of the elements, ref. [31] set the maximum degradation of the electrolyser D e l s . m a x at 10,000 h, and for lead–acid batteries a lifespan of 1500 cycles can be expected [32].
Finally, with respect to the fuel cell, the maximum fuel cell degradation is estimated to be D f c . m a x = 100 mV/cell, [31]. To calculate when the fuel cell needs to be replaced, the air–air start degradation per cell ( 30   μ V / s t a r t ) and the runtime degradation per cell ( 12   μ V / h ) are considered [33]. Taking into account the results of the simulations in Figure 3, it is possible to count the number of fuel cell starts (361 starts for the hydrogen-based priority EMS and 60 starts for the battery-based priority EMS). Furthermore, the annual working hours of the fuel cell can be obtained as a function of each EMS [15]; thus, the annual degradation of the stack fuel cell can be calculated by Equation (7) [33].
D f c = N s t a r t s · 30 μ V s t a r t · c e l l · 80   c e l l s / s t a c k + N h · 12 μ V h · c e l l · 80   c e l l s / s t a c k
where
  • D f c : stack fuel cell degradation ( μ V / s t a c k ) ;
  • N s t a r t s : number of fuel cell starts (361 for hydrogen-based priority EMS and 60 for battery-based priority EMS);
  • N h : number of fuel cell working hours (from Table 4: 2794.7 h for hydrogen-based priority EMS and 133.6 h for battery-based priority EMS).
As mentioned, for the PEM-FC, the maximum cell degradation is 100 mV/cell, so taking into account that the stack has 80 cells, the maximum stack degradation will be 8000 mV/stack; therefore, knowing the annual stack degradation, it is easy to obtain the time when it will be necessary to replace the fuel cell depending on the priority of each EMS. Table 5 shows the calculated data for the time at which it is necessary to replace each element depending on the EMS used, together with the number of replacements of each element over the time horizon of the microgrid (20 years).
Once the frequency of element replacements required based on the EMS used has been obtained, it is time to calculate the costs associated with the replacement. For this purpose, the evolution of the costs of the different elements can be extracted from [34]. That study establishes, in the case of the electrolyser, a 9% cost reduction over the 2020–2030 decade. On the other hand, ref. [35] establishes a reduction in the cost of fuel cells of about 17% for the same decade, while battery prices will be reduced by 39%. The replacement costs of the microgrid over its lifespan, based on the operating EMS, are presented in Table 6.
Figure 4 shows the evolution of the cost of the microgrid components that are replaced during its lifespan (electrolyser for both EMSs, PEM FC for the hydrogen-based priority EMS and the lead–acid battery bank for the battery-based priority EMS), [34,35]. Thanks to technological research and development, as well as marketing, the cost of components decreases over time.

3.3. Operation and Maintenance (O&M) Costs

Apart from replacement costs, microgrid components have associated costs due to operation and maintenance (O&M). Table 7 presents the initial O&M costs for the different components of the microgrid (these costs will be reduced after replacements, due to the reduction in the CAPEX):
Although the initial annual O&M costs in the microgrid are the same for both EMSs, different replacements over its lifespan will imply different O&M costs. Table 8 shows the annual O&M costs over the microgrid lifespan. Figure 5 shows the evolution of O&M costs as a function of EMS over the lifespan of the microgrid. Note that up to year 12, the O&M of the microgrid governed by the hydrogen-based priority EMS is cheaper. However, due to the decrease in replacement CAPEX and the consequent reduction in O&M costs, at the end of the microgrid lifespan, both EMSs generate similar costs (see Table 8).

3.4. Cost Savings and Energy Trading

The electricity production by the microgrid implies cost savings because it means that it is not necessary to buy electricity from the main grid. On the other hand, in times of energy surplus in the microgrid, the energy excess not stored is sold to the main grid. On the contrary, in times of energy deficit, in order to guarantee the load demand, it is necessary to buy electricity from the main grid. Table 9 shows the annual cost savings and energy trading of the microgrid with the main grid depending on the EMS used. However, the trend is reversed when hydrogen element substitutions, the electrolyser and the fuel cell, begin to occur.
To obtain energy savings, the energy generated by the RESs (PV and WT) has been considered, as well as the supply from the battery bank and the fuel cell, since these last two elements are the ones that provide energy to the microgrid in times of RES deficit. The negative sign in Table 9 implies the purchase of energy from the main grid, which occurs when the microgrid is not able to meet the demand of the loads by its own means.

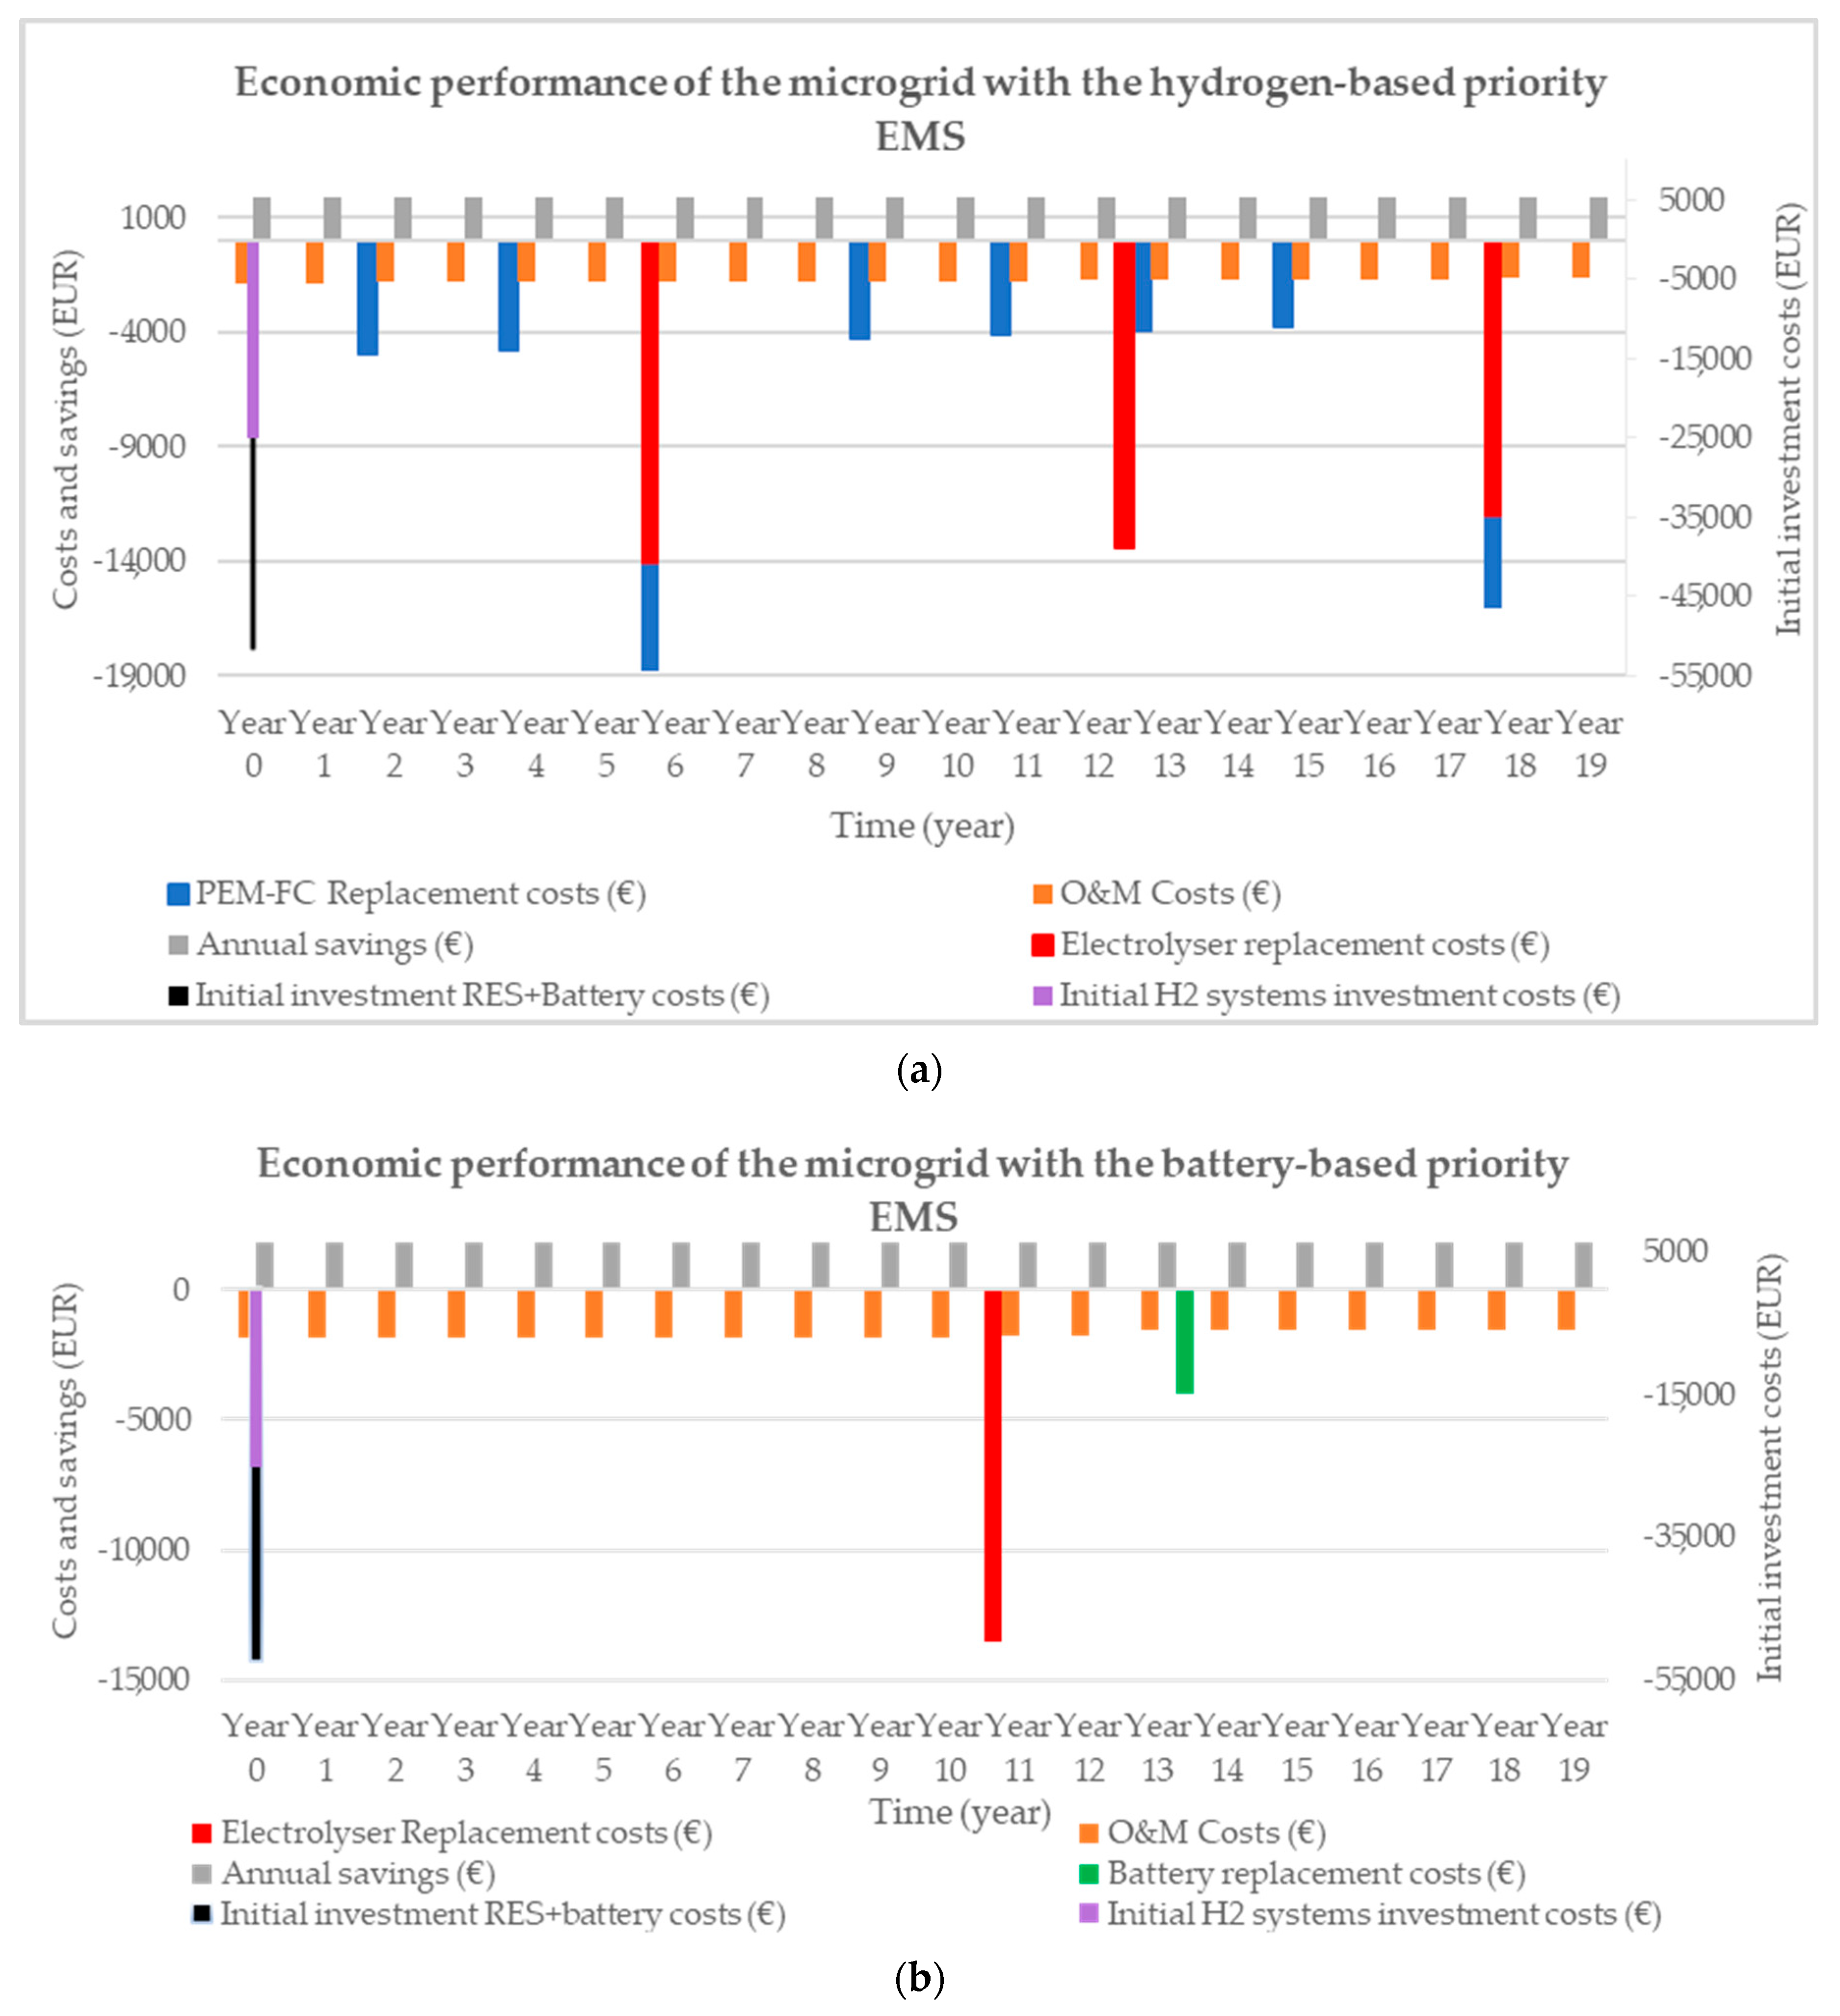
3.5. Economic Analysis of the Microgrid

As seen above, although the initial investments and initial O&M costs in the microgrid are the same for both EMSs, the replacement costs are different for each strategy (each EMS priority involves a different number of replacements), as well as the O&M costs and the annual cost savings over the microgrid lifespan. This section analyses these different aspects to study the economic behaviour of the microgrid as a function of the EMS that governs it. Figure 6 shows the analysis carried out, in which negative values mean costs.
In the economic analysis carried out, a slight advantage of the hydrogen-based priority EMS over the battery-based priority EMS in terms of O&M annual costs and annual savings is observed. Thus, according to Figure 6 and Table 8, the annual O&M costs vary between EUR 1849.67 and 1650.14 for the hydrogen-based priority EMS, and between EUR 1849.67 and 1568.56 for the battery-based priority EMS. The annual savings (Table 9) are EUR 1837.65 for the hydrogen-based priority EMS vs. EUR 1814.13 for the battery-based priority EMS. However, in terms of investment costs, the battery-based priority EMS has a clear advantage over the hydrogen-based priority strategy. Table 10 summarises the annual and total costs and savings depending on the EMS applied.

3.6. Expected Economic Scenario

As seen above, for both EMSs, the annual O&M costs are practically equal to annual cost savings (in fact, annual O&M costs are slightly higher in the early years). Due to high investment and replacement costs (mainly for hydrogen equipment that is replaced during the lifespan of the microgrid), hydrogen-based technology remains an economic challenge. However, to use an analogy, technologies such as wind energy have experienced considerable cost reductions over time. Thus, the cost of onshore wind projects has decreased by 72% between 1983 and 2019, from 4583.19 EUR/kW to 1303.54 EUR/kW [30]. If this drop in costs is assumed for hydrogen technology (electrolyser, hydrogen tank, and fuel cells), there is a huge change in the initial investment and initial O&M costs, making this technology an economically attractive solution (Table 11).
In this sense, a target scenario was established in which a cost reduction equivalent to 72% of the current cost of hydrogen technologies was applied to the initial investments in the fuel cell, electrolyser, and hydrogen storage tank. As a result, annual O&M costs have been reduced by 72%, while the costs associated with RESs and batteries are considered to remain unchanged.
Considering this expected scenario (in which the initial investment costs associated with the hydrogen equipment and the annual O&M costs are changed, but taking the same annual cost reduction already considered above ([34,35]) over the lifespan of the microgrid), it can be seen that, for both EMSs, the cost savings are considerably higher than the annual O&M costs (Figure 7).

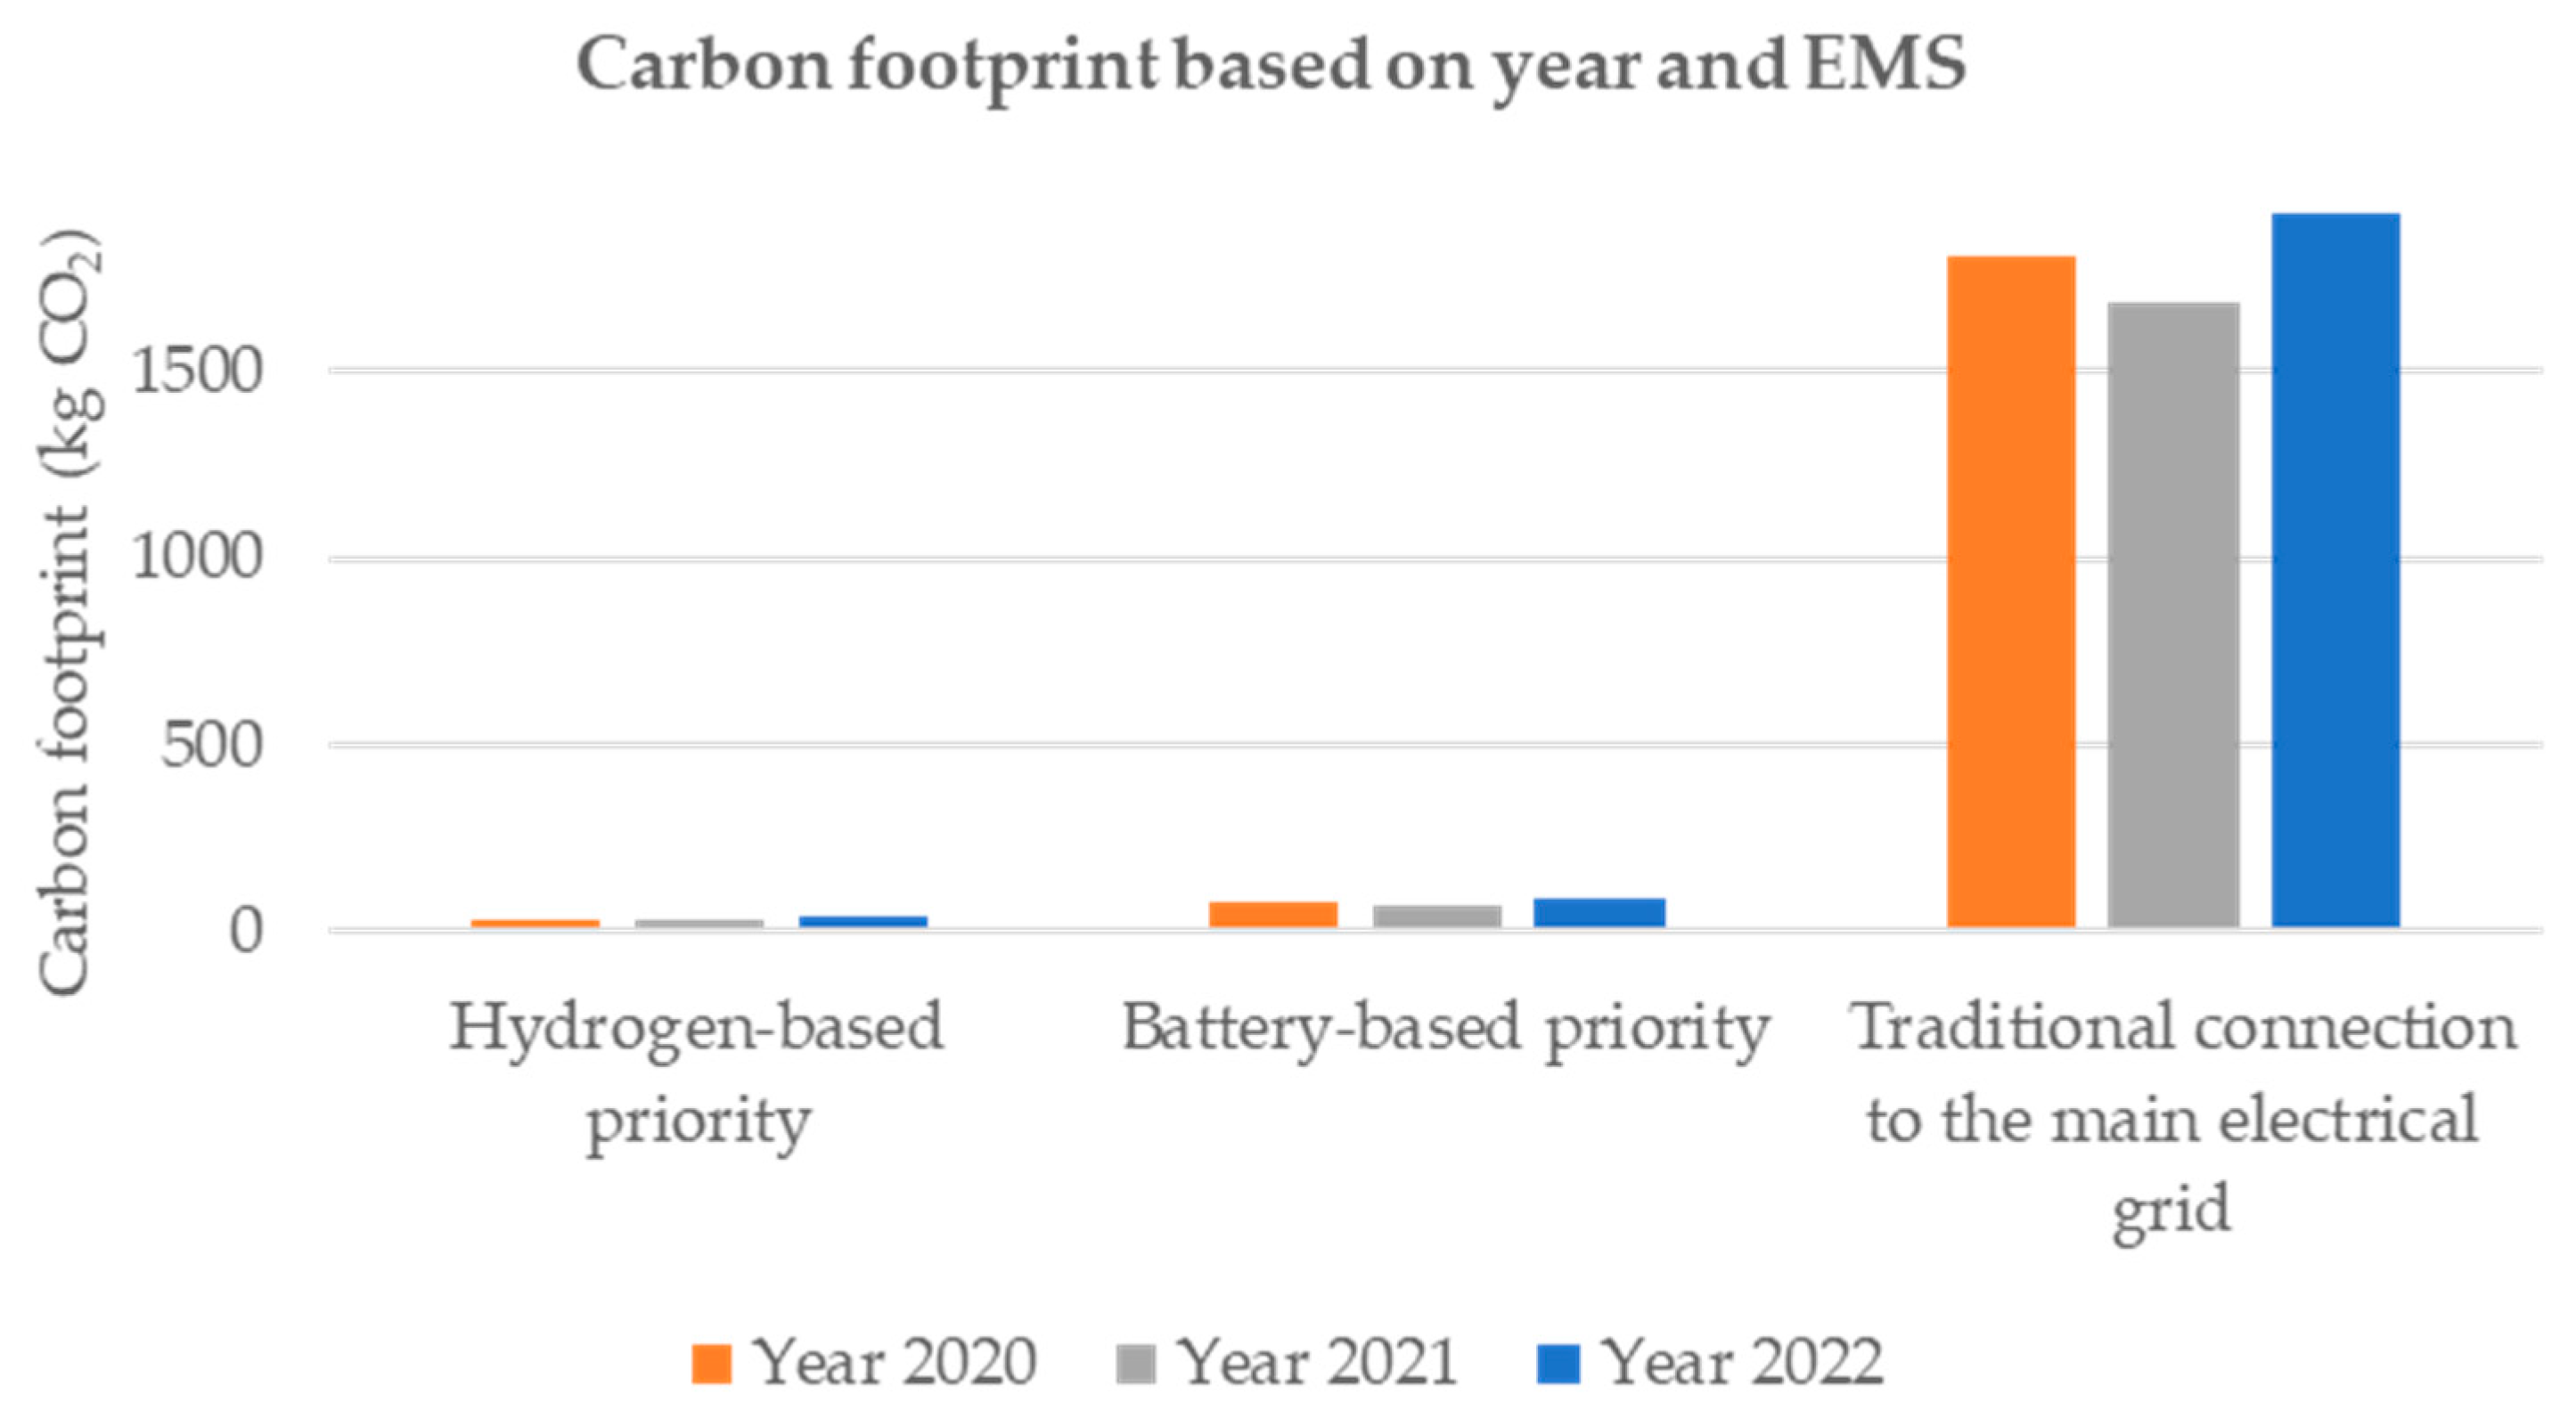
4. Carbon Footprint Analysis

The renewable hydrogen-based microgrid described in this study pursues energy production with zero CO2 emissions. In this sense, this microgrid will only have CO2 emissions at times of energy deficit, since these are the times when electricity is bought from the main grid, and this, as usual, is considered to have associated CO2 emissions. In [36], it is noted that the Spanish carbon footprint associated with electricity and heat generation in 2020 was 150 g CO2/kWh, while it was 140 g CO2/kWh and 160 g CO2/kWh for the years 2021 and 2022, respectively. These data are provided to discuss the Spanish electricity market exclusively (one of the world’s most decarbonised), although the authors are aware that the discussion would be much more favourable if extrapolated to other parts of the world. Table 12 and Figure 8 show, for the years 2020, 2021, and 2022, the reduction in the carbon footprint of the proposed microgrid with respect to an identical one (referring to loads obviously without renewable generation or storage systems) with exactly the same annual load demand (12,050 kWh) but supplied entirely by the Spanish electricity grid.
As can be seen from Table 12 and Figure 8, whichever EMS is used, the carbon footprint of the proposed microgrid decreases over the three years.
Furthermore, by 2020, CO2 emission costs were 35.40–70.80 EUR/tCO2 [37] (that is, 0.0354–0.0708 EUR/kgCO2). Because of that, emitting CO2 has not only an environmental impact but also an economic impact. Table 13 reflects the economic impact associated with CO2 emissions for both the EMSs and the traditional connection to the main electrical grid (where the same CO2 emission costs have been considered for the years 2020, 2021, and 2022).

5. Discussion

Based on the developed cost analysis, it can be observed that although the initial investment costs in the microgrid are the same, EUR 52,339.78 (Table 3), the selected EMS leads to different results depending on the priority. The first noticeable difference is the working hours of each element. From Figure 3, it is possible to build Table 4, which shows that the battery bank operates only for 1799.1 h/year when the priority is hydrogen, while this same element increases its working time up to 5912 h when the priority is the battery. Regarding the electrolyser and fuel cell, they operate for 1618.4 h and 2794.7 h, respectively, under the hydrogen-based priority EMS, while under the battery-based priority EMS, the electrolyser reduces its activity by 50% (846.1 h), and the fuel cell operates at only 4% (133.6 h) with respect to hydrogen-based priority.
This difference in operating hours has a direct influence on the calculation of the number of replacements of each element required over the lifespan of the microgrid (Table 5). The electrolyser will be replaced three times and the fuel cell eight times when the microgrid works under the hydrogen priority, while under the battery priority, the fuel cell will not be replaced over the whole lifespan, the electrolyser will be replaced only one time, and the battery bank will need to be substituted by the middle of the lifespan.
Additionally, as shown in Table 6, replacement costs will become cheaper over time [34,35] thanks to advances in research, development, and commercialisation; thus, their amounts will reach EUR 74,177.4 for the hydrogen-based priority strategy and EUR 17,537.88 for the battery-based priority strategy. As CAPEX decreases over time, the O&M costs associated with the microgrid elements will also decrease (Figure 4). Thus, according to the initial O&M costs (Table 7) and the updated O&M costs over the lifespan (Table 8), it is possible to obtain Figure 5. This figure shows that the decrease in O&M costs over the microgrid lifespan will be more noticeable in the case of the battery-based priority strategy.
On the other hand, as can be seen in Table 9, the hydrogen-based priority strategy offers slightly higher annual savings: EUR 1837.65/year compared to EUR 1814.13/year for the battery-based priority strategy.
Once the initial investment, O&M, and replacement costs are obtained, it is possible to illustrate in Figure 6 and Table 10 the economic behaviour of the microgrid, over its whole lifespan and for each EMS priority. Table 10 shows that whatever EMS is used, the total cost savings (EUR 36,753.05 for the H2-based priority EMS and EUR 36,282.58 for the battery-based priority EMS) do not offset the initial investment (EUR 52,339.78) and the cost savings hardly manage to cover the O&M costs (EUR 35,254.03 for the H2-based priority EMS and EUR 34,877.08 for the battery-based priority EMS) at current prices.
However, a significant reduction in investment and O&M costs in the near future is expected (Table 11 and Figure 7). Then, the cost savings are considerably higher than the annual O&M costs. This type of microgrid could be economically viable.
In order to sum up both the investment costs and O&M costs of the different elements in the microgrid in terms of the energy used/produced/stored (as applicable) by each and every one of these elements during the lifetime of the microgrid, based on the EMS implemented, Table 14 and Table 15 provide cost/energy taxes, in order to demonstrate which EMS has the highest unitary costs (per unit of energy) associated with it.
Finally, Table 12 shows that, in terms of carbon footprint, the hydrogen-based priority strategy implies a 98.15% reduction in CO2 emissions and 95.73% in the case of the battery-based priority EMS, compared to if the demand of the microgrid were to be supplied entirely from the Spanish electricity grid. Of course, taking into account current regulations in Spain, this environmental impact implies an economic impact, which will be greater the higher the CO2 emissions (Table 13). The amount of 1687 kg of CO2 that a traditional connection to the main grid would emit will be reduced up to 72.044 kg (a reduction of 95.73%) in the battery-based priority EMS case, and up to 31.262 kg (a reduction of 98.15%) in the case of the hydrogen-based priority EMS.

6. Conclusions

An econometric assessment and an analysis of the carbon footprint of hydrogen-based microgrids have been carried out in this paper.
To assess the feasibility of a hydrogen-based microgrid, it is essential to study both the investment, operation, and maintenance costs as well as its carbon footprint. From an initial starting point where the microgrid begins to operate, its subsequent control over time, i.e., the management of its elements and the exchange of power and energy, strongly conditions the future costs of the microgrid from the initial investment, which can make it economically unfeasible. The task of controlling the microgrid is the responsibility of its EMS, so in this paper, the influence of the EMS on the cost of using the microgrid was studied. Specifically, two EMSs were studied: the hydrogen-based priority strategy and the battery-based priority strategy. Based on the results obtained, the following conclusions can be drawn:
  • The hydrogen-based priority strategy has the disadvantage of requiring a much higher investment (specifically EUR 74,177.4 vs. 17,537.88) and higher O&M costs (specifically EUR 35,254.03 vs. 34,877.08), and the advantage of higher annual cost savings (specifically, EUR 1837.65 vs. 1814.13).
  • Hydrogen technologies are expected to become increasingly economically competitive, as a result of massive market demand and deployment, technological advances, process automation, increased component availability, economies of scale in the hydrogen industry, and increasing adoption of hydrogen technologies [34,35]. Just as, for example, wind power technology has experienced a dramatic cost reduction of more than 70% from the 1980s to the present day, hydrogen technologies are expected to follow a similar trend, meaning that the cost-effectiveness of a hydrogen-based microgrid could soon be a reality.
  • A positive evolution of the lifespan of FCs, electrolysers, etc. is also expected, which implies that the main disadvantage of the hydrogen-based priority strategy, i.e., the number of equipment replacements required (with their associated costs), will be reduced in the near future, making this strategy much more cost-effective in the short term.
  • The hydrogen-based priority EMS is more environmentally friendly than the battery-based priority EMS. Specifically, the hydrogen-based priority strategy leads to a carbon footprint, in absolute terms, of between 31.262 kg CO2 by 2021 and 35.728 kg CO2 by 2022, compared to the carbon footprint for the battery-based priority strategy of between 72.044 kg CO2 (2021) and 82.336 kg CO2 (2022).
  • The continuing rise in CO2 emission costs means that the hydrogen-based priority EMS will not only be a more environmentally friendly option but will also result in an increase in annual cost savings compared to the battery-based priority EMS.
  • The hydrogen-based priority EMS has greater independence from the main grid than the battery-based priority EMS (223.3 vs. 514.6 kWh taken from the main grid, respectively), which makes this strategy suitable for remote communities that do not have access to the main grid. Although this strategy could not completely eliminate the use of traditional diesel generators [38] in isolated grids as an element to guarantee electricity supply, it could drastically reduce their use.
  • The higher equipment replacement and O&M costs for the hydrogen-based priority EMS over the lifespan of the microgrid are partially offset by the higher cost savings and associated lower carbon footprint, all in a scenario where hydrogen equipment costs are expected to decrease in the coming years [34,35]. Likewise, the costs of CO2 emissions will increase, which will make the hydrogen-based priority strategy increasingly competitive.
  • A microgrid identical to the one studied (Figure 1) with only renewable generators (photovoltaic and wind), without energy storage, would obviously be much cheaper than the two modalities analysed in this article, even more so when compared to the hydrogen-based microgrid. The initial investment, and operation and maintenance costs, would be much lower (associated only with the purchase, operation, and maintenance of the renewable energy production equipment (see Table 3 and Table 7), respectively) and, in addition, there would be no associated replacement costs (except by accident, the renewable generation elements are not replaced during the lifespan of the microgrid). On the other hand, the carbon footprint would be considerably higher, as the main grid would have to compensate for the natural intermittency of renewable energy at any time (please, see Table 9).
  • This article has demonstrated the advantages of hydrogen technologies in implementing reliable and clean microgrids, which are deeply respectful of the environment. However, economically speaking, they are not yet competitive. Therefore, the policy implications drawn from this work are the need for governments and companies to invest in research and development of hydrogen technologies so that costs can be drastically reduced. This looks set to be an accelerated path with no way back, as green hydrogen is now considered essential to address the increasingly necessary energy transition.

Author Contributions

Conceptualization, J.R. and F.S.; methodology, J.R. and F.S.; software, A.M.F.; validation, J.R. and A.M.F.; formal analysis, J.R. and F.S.; investigation, J.R. and A.M.F.; resources, J.M.A.; data curation, J.R.; writing—original draft preparation, J.R., F.S. and J.M.A.; writing—review and editing, J.R. and F.S.; visualization, J.R.; supervision, F.S. and J.M.A.; project administration, J.M.A.; funding acquisition, J.M.A. All authors have read and agreed to the published version of the manuscript.

Funding

This research was funded by the Spanish Government, grant (1) Ref: PID2020-116616RB-C31 and grant (2) Ref: RED2022-134588-T REDGENERA.

Data Availability Statement

Data available on request.

Conflicts of Interest

The authors declare no conflict of interest.

Abbreviations

ACAlternate current
CAPEXCapital expenditures
DCDirect current
EMSEnergy management strategy
ESSEnergy storage system
FCFuel cell
HSSHeat storage system
IRENAInternational Renewable Energy Agency
LHVLower heating value
MPCModel predictive control
O&MOperation and maintenance
PEM-FCProton exchange membrane fuel cell
PVPhotovoltaic
RESRenewable energy sources
SMPCStochastic model predictive control
SOCState of charge
WTWind turbine
Notation and Symbols
D e l s .   m a x Maximum electrolyser degradation (10,000 h)
D f c Fuel cell degradation ( μ V )
D f c . m a x . Maximum fuel cell degradation (100 mV/cell)
E b a t t e r y Maximum battery energy storage capacity (40.8 kWh)
E y . c h a + d i s c h Energy used during a whole year to charge and discharge the battery (kWh)
m t Mass of the gas contained in the tank (kg)
M Molar mass (kg/mol)
M H 2 Hydrogen molar mass (kg/mol)
N h Number of fuel cell working hours (h)
N s t a r t s Number of fuel cell starts (starts)
n t Number of moles contained in the tank (mol)
N y . c y c l e s Number of operating cycles of the battery during one year (cycles/year)
P b a t t Power injected or extracted from the battery system (W)
P b a t t   c h a r g e Power extracted from the DC bus to be injected into the battery (W)
P b a t t   d i s c h a r g e Power injected into the DC bus via battery (W)
P e l Power extracted from the DC bus to be injected into the electrolyser (W)
P F C Power injected into the bus via fuel cell (W)
P g r i d Power injected or extracted from the main grid (W)
P g r i d   i n Power injected from the main grid to the DC bus (W)
P g r i d   o u t Power extracted from the DC bus to be injected into the main grid (W)
P H 2 Power injected or extracted from the hydrogen systems (W)
P l o a d Load power (W)
P n e t Net power (W)
P R E S RES power (W)
p t Hydrogen tank pressure (Pa)
p t . m a x Maximum hydrogen tank pressure (30 bar)
p t . m i n Minimum hydrogen tank pressure (1 bar)
R Ideal gas constant (8.31 J/(K·mol))
S O C Battery state of charge (Ah, %)
S O C m a x Maximum state of charge (Ah, 80%)
S O C m i n Minimum state of charge (Ah, 20%)
T t Temperature of the gas contained in the tank (K)
V t Hydrogen tank volume (m3)

References

  1. World Bank. The World Bank Annual Report 2018; World Bank: Washington, DC, USA, 2018. [Google Scholar] [CrossRef]
  2. Liu, Y.; Dong, K.; Jiang, Q. Assessing energy vulnerability and its impact on carbon emissions: A global case. Energy Econ. 2023, 119, 106557. [Google Scholar] [CrossRef]
  3. Tabari, M.; Shaffer, B. Paying for performance: The role of policy in energy storage deployment. Energy Econ. 2020, 92, 104949. [Google Scholar] [CrossRef]
  4. Alizadeh, A.; Kamwa, I.; Moeini, A.; Mohseni-Bonab, S.M. Energy management in microgrids using transactive energy control concept under high penetration of Renewables; A survey and case study. Renew. Sustain. Energy Rev. 2023, 176, 113161. [Google Scholar] [CrossRef]
  5. Shatnawi, M.; AlJaberi, N.S.A.M.; Al Qaydi, N.A.S.M. Solar-hydrogen microgrid project. In Proceedings of the SEG/AAPG/EAGE/SPE Research and Development Petroleum Conference and Exhibition 2018, Abu Dhabi, United Arab Emirates, 9–10 May 2018. [Google Scholar] [CrossRef]
  6. Kafetzis, A.; Ziogou, C.; Panopoulos, K.D.; Papadopoulou, S.; Seferlis, P.; Voutetakis, S. Energy management strategies based on hybrid automata for islanded microgrids with renewable sources, batteries and hydrogen. Renew. Sustain. Energy Rev. 2020, 134, 110118. [Google Scholar] [CrossRef]
  7. Lei, Y.T.; Ma, C.Q.; Mirza, N.; Ren, Y.S.; Narayan, S.W.; Chen, X.Q. A renewable energy microgrids trading management platform based on permissioned blockchain. Energy Econ. 2022, 115, 106375. [Google Scholar] [CrossRef]
  8. IRENA. Electricity Storage and Renewables: Costs and Markets to 2030; International Renewable Energy Agency: Abu Dhabi, United Arab Emirates, 2017. [Google Scholar]
  9. Pérez-Uresti, S.I.; Martín, M.; Jiménez-Gutiérrez, A. A Methodology for the Design of Flexible Renewable-Based Utility Plants. ACS Sustain. Chem. Eng. 2020, 8, 4580–4597. [Google Scholar] [CrossRef]
  10. Bilich, A.; Langham, K.; Geyer, R.; Goyal, L.; Hansen, J.; Krishnan, A.; Bergesen, J.; Sinha, P. Life cycle assessment of solar photovoltaic microgrid systems in off-grid communities. Environ. Sci. Technol. 2017, 51, 1043–1052. [Google Scholar] [CrossRef]
  11. Fuentes-Cortés, L.F.; Ortega-Quintanilla, M.; Flores-Tlacuahuac, A. Water-Energy Off-Grid Systems Design Using a Dominant Stakeholder Approach. ACS Sustain. Chem. Eng. 2019, 7, 8554–8578. [Google Scholar] [CrossRef]
  12. Monforti Ferrario, A.; Bartolini, A.; Segura Manzano, F.; Vivas, F.J.; Comodi, G.; McPhail, S.J.; Andujar, J.M. A model-based parametric and optimal sizing of a battery/hydrogen storage of a real hybrid microgrid supplying a residential load: Towards island operation. Adv. Appl. Energy 2021, 3, 100048. [Google Scholar] [CrossRef]
  13. Mahant, B.; Linga, P.; Kumar, R. Hydrogen Economy and Role of Hythane as a Bridging Solution: A Perspective Review. Energy Fuels 2021, 35, 15424. [Google Scholar] [CrossRef]
  14. Balat, M. Potential importance of hydrogen as a future solution to environmental and transportation problems. Int. J. Hydrog. Energy 2008, 33, 4013–4029. [Google Scholar] [CrossRef]
  15. Ferrario, A.M.; Vivas, F.J.; Manzano, F.S.; Andújar, J.M.; Bocci, E.; Martirano, L. Hydrogen vs. Battery in the long-term operation. A comparative between energy management strategies for hybrid renewable microgrids. Electronics 2020, 9, 698. [Google Scholar] [CrossRef]
  16. Roy, A.; Olivier, J.C.; Auger, F.; Auvity, B.; Schaeffer, E.; Bourguet, S.; Schiebel, J.; Perret, J. A combined optimization of the sizing and the energy management of an industrial multi-energy microgrid: Application to a harbour area. Energy Convers. Manag. X 2021, 12, 100107. [Google Scholar] [CrossRef]
  17. Li, B.; Li, J. Sizing versus Price: How they influence the energy exchange among large numbers of hydrogen-centric multi-energy supply grid-connected microgrids. Energy Rep. 2020, 6, 1557–1567. [Google Scholar] [CrossRef]
  18. Mansoor, M.; Stadler, M.; Auer, H.; Zellinger, M. Advanced optimal planning for microgrid technologies including hydrogen and mobility at a real microgrid testbed. Int. J. Hydrog. Energy 2021, 46, 19285–19302. [Google Scholar] [CrossRef]
  19. Ming Kwok, J.J.; Yu, N.; Karimi, I.A.; Lee, D.Y. Microgrid scheduling for reliable, cost-effective, and environmentally friendly energy management. Ind. Eng. Chem. Res. 2013, 52, 142–151. [Google Scholar] [CrossRef]
  20. Shi, M.; Wang, H.; Lyu, C.; Xie, P.; Xu, Z.; Jia, Y. A hybrid model of energy scheduling for integrated multi-energy microgrid with hydrogen and heat storage system. Energy Rep. 2021, 7, 357–368. [Google Scholar] [CrossRef]
  21. Tobajas, J.; Garcia-Torres, F.; Roncero-Sánchez, P.; Vázquez, J.; Bellatreche, L.; Nieto, E. Resilience-oriented schedule of microgrids with hybrid energy storage system using model predictive control. Appl. Energy 2022, 306, 118092. [Google Scholar] [CrossRef]
  22. Xie, Y.; Ueda, Y.; Sugiyama, M. Greedy energy management strategy and sizing method for a stand-alone microgrid with hydrogen storage. J. Energy Storage 2021, 44, 103406. [Google Scholar] [CrossRef]
  23. Zhu, Z.; Weng, Z.; Zheng, H. Optimal Operation of a Microgrid with Hydrogen Storage Based on Deep Reinforcement Learning. Electronics 2022, 11, 196. [Google Scholar] [CrossRef]
  24. Vivas, F.J.; De las Heras, A.; Segura, F.; Andújar, J.M. A review of energy management strategies for renewable hybrid energy systems with hydrogen backup. Renew. Sustain. Energy Rev. 2018, 82, 126–155. [Google Scholar] [CrossRef]
  25. Vivas, F.J.; Segura, F.; Andújar, J.M. Fuzzy logic-based energy management system for grid-connected residential DC microgrids with multi-stack fuel cell systems: A multi-objective approach. Sustain. Energy Grids Netw. 2022, 32, 100909. [Google Scholar] [CrossRef]
  26. Vivas Fernández, F.J.; Manzano, F.S.; Márquez, J.M.A.; Calderón Godoy, A.J. Extended Model Predictive Controller to Develop Energy Management Systems in Renewable Source-Based Smart Microgrids with Hydrogen as Backup. Theoretical Foundation and Case Study. Sustainability 2020, 12, 8969. [Google Scholar] [CrossRef]
  27. Andújar, J.M.; Vivas, F.J.; Segura, F.; Calderón, A.J. Integration of air-cooled multi-stack polymer electrolyte fuel cell systems into renewable microgrids. Int. J. Electr. Power Energy Syst. 2022, 142, 108305. [Google Scholar] [CrossRef]
  28. Lanz, A.; Heffel, J.; Messer, C. Hydrogen Fuel Cell Engines and Related Technologies—Module 1: Hydrogen Properties. 2001. Available online: https://rosap.ntl.bts.gov/view/dot/14966 (accessed on 7 May 2022).
  29. Woody, A.I. How is the Ideal Gas Law Explanatory? Sci. Educ. 2013, 22, 1563–1580. [Google Scholar] [CrossRef]
  30. IRENA. Renewable Power Generation Costs in 2019; International Renewable Energy Agency: Abu Dhabi, United Arab Emirates, 2020. [Google Scholar]
  31. Vivas, F.J.; Segura, F.; Andújar, J.M.; Caparrós, J.J. A suitable state-space model for renewable source-based microgrids with hydrogen as backup for the design of energy management systems. Energy Convers. Manag. 2020, 219, 113053. [Google Scholar] [CrossRef]
  32. Andújar, J.M.; Segura, F.; Rey, J.; Vivas, F.J. Batteries and Hydrogen Storage: Technical Analysis and Commercial Revision to Select the Best Option. Energies 2022, 15, 6196. [Google Scholar] [CrossRef]
  33. Ballard Power Systems. Putting Fuel Cells to Work: FCgen®-1020ACS Fuel Cell Stack FCvelocity®-1020ACS Fuel Cell Stack; Product Manual and Integration Guide; Ballard Power Systems Inc.: Burnaby, BC, Canada, 2016; pp. 5127049–5127063. [Google Scholar]
  34. International Renewable Energy Agency. Green Hydrogen Cost Reduction Scaling up Electrolysers to Meet the 1.5 °C Climate Goal; International Renewable Energy Agency: Abu Dhabi, United Arab Emirates, 2020. [Google Scholar]
  35. Hydrogen Council. Path to Hydrogen Competitiveness: A Cost Perspective; Hydrogen Council: Brussels, Belgium, 2020. [Google Scholar]
  36. REData. Emisiones y Factor de Emisión de CO2 eq. de la Generación. Red Eléctrica. Available online: https://www.ree.es/es/datos/generacion/no-renovables-detalle-emisiones-CO2 (accessed on 9 November 2022).
  37. World Bank. State and Trends of Carbon Pricing 2021; World Bank: Washington, DC, USA, 2021. [Google Scholar] [CrossRef]
  38. Mustayen, A.G.M.B.; Rasul, M.G.; Wang, X.; Negnevitsky, M.; Hamilton, J.M. Remote areas and islands power generation: A review on diesel engine performance and emission improvement techniques. Energy Convers. Manag. 2022, 260, 115614. [Google Scholar] [CrossRef]
Figure 1. (a) Architecture of the hydrogen-based renewable microgrid at the University of Huelva. (b) Conceptual diagram of the power balance in the microgrid.
Electronics 12 03703 g001
Figure 2. Flowcharts for (a) the H2-based priority EMS and (b) the battery-based priority EMS.
Electronics 12 03703 g002
Figure 3. Net power balance graphs for (a) the hydrogen-based priority EMS and (b) the battery-based priority EMS.
Electronics 12 03703 g003aElectronics 12 03703 g003b
Figure 4. Expected evolution of the replacement cost over the lifespan of the microgrid of (a) alkaline electrolyser; (b) PEM FC; (c) Lead–acid battery bank.
Electronics 12 03703 g004
Figure 5. Evolution of O&M costs for the hydrogen-based priority (blue) EMS and the battery-based priority (orange) EMS.
Electronics 12 03703 g005
Figure 6. Economic performance of the microgrid with (a) the hydrogen-based priority EMS and (b) the battery-based priority EMS.
Electronics 12 03703 g006
Figure 7. Economic behaviour of the expected scenario for (a) the hydrogen-based priority EMS and (b) the battery-based priority EMS.
Electronics 12 03703 g007
Figure 8. Carbon footprint of the proposed microgrid for the years 2020, 2021, and 2022, compared to if the same loads with the same consumption were supplied entirely by the Spanish electricity grid.
Electronics 12 03703 g008
Table 1. Comparison between the authors’ proposal and the scientific literature analysed.
ReferenceInvestment CostsO&M CostsReplacement Costs as a Function of EMSAnnual ProfitsCO2 Footprint
[16]YesYesNo *YesNo
[17]Yes YesNoYesNo
[18]YesYesNo *NoYes
[19]NoYesNoYesNo **
[20]YesYesNoNoNo
[21]NoYesNo *NoNo
[22]YesYesYesNoNo
[23]NoYesNoNoNo
Author’s proposalYesYesYesYesYes
* Replacement costs are calculated but based on the lifespan of the element or its degradation, not on the actual use due to the EMS. ** The global warming potential (GWP), i.e., the relative potency of a greenhouse gas, taking into account how long it remains active in the atmosphere, is studied.
Table 2. Summary of microgrid elements.
ElementParametersModel
Lead–acid battery100 Ah (40.8 kWh)U-Power® UP100-12
Electrolyser10 kWe H2 Nitidor® 0074-01-PMO-001
H2 tank30 bar, 1.044 m3, 2.51 kg H2 (300 K)Lapesa® LSP1000H
PEM FC3.4 kWeBallard® FCgen 1020ACS
Wind turbine3 kWpEnair® E-30PRO
Solar PV mono-Si-based panels5 kWpIsofoton® ISF-250
Solar PV poly-Si-based panels5 kWpAtersa® A-230P
Solar PV thin-film a-Si-based panels5 kWpSchott® ASI 100
Table 3. Initial investment costs for microgrid elements.
ElementUnitsCAPEXTotal Cost (2022)
Lead–acid battery40.8 kWh200 EUR/kWh [12]EUR 8160
Electrolyser10 kW 1500 EUR/kW [12]EUR 15,000
H2 tank2.51 kg2000 EUR/kg [12]EUR 5025.27
PEM FC3.4 kW1500 EUR/kW [12]EUR 5100
Wind turbine (1)3 kW1303.54 EUR/kW [30]EUR 3519.56
PV panels (1)15 kW1247.79 EUR/kW [30]EUR 15,534.96
Total initial microgrid investmentsEUR 52,339.78
(1) Total cost = [CAPEX × Units × (1-annual_cost_reduction × number_of_years)]; number_of_years = 2022 − 2019 = 3. Total cost_WT = [CAPEX × Units × (1 − 0.05 × 3)]. Total cost_PV = [CAPEX × Units × (1 − 0.085 × 3)].
Table 4. Annual working hours and energy exchanged on the microgrid depending on EMS priority.
ElementHydrogen-Based Priority EMSBattery-Based Priority EMS
HoursEnergy (kWh)HoursEnergy (kWh)
Lead–acid battery charge1131 h 946.32797 h4127
Lead–acid battery discharge668.1 h874.63115 h3250
Electrolyser1618.4 h 5967846.1 h927.6
PEM FC2794.7 h2842133.6 h175.2
Table 5. Frequency and number of replacements over the time horizon of the microgrid (20 years).
H2-Based Priority EMSBattery-Based Priority EMS
ElementMaximum Element DegradationAnnual DegradationReplacement Frequency (Years)Number of Replacements
(in 20 Years)
Annual DegradationReplacement Frequency (Years)Number of Replacements (in 20 Years)
Battery bank1500 cycles [32]26.8 cycles>200108.5 cycles13.831
Electrolyser10,000 h [31]1617.8 h6.183846.1 h11.821
Fuel cell8000 mV/stack [33]3549.28 mV/stack2.258272.24 mV/stack>200
Table 6. Replacement costs for the microgrid over its lifespan based on the operating EMS.
Hydrogen-Based Priority EMSBattery-Based Priority EMS
ElementInitial Costs (EUR) (1)Cost Reduction over a Decade (%)Annual Cost Reduction (%) (2)Number of Replacements (in 20 Years)Replacements Costs (EUR) (3)Number of Replacements (in 20 Years)Replacements
Costs (EUR) (3)
Battery bank816039 [35]3.90014022.88
Electrolyser15,0009 [34]0.9340,140113,515
Fuel cell510017 [35]1.7834,037.400
Total replacement costs (EUR)74,177.4 17,537.88
(1) See Table 3. (2) Annual cost reduction is considered as one-tenth of the cost reduction over a decade. (3)  R e p l a c e m e n t   C o s t s = I n i t i a l c o s t s · 100     A n u a l c o s t r e d u c t i o n · R e p l a c e m e n t f r e q u e n c y 100 . Battery: Battery-based priority→ R e p l a c e m e n t   C o s t s = 8160 · 100     3.9 · 13 100 = E U R   4022.88 . Electrolyser: H2-based priority→ R e p l a c e m e n t   C o s t s = 15000 · 100     0.9 · 6 100 + 15000 · 100     0.9 · 12 100 + 15000 · 100     0.9 · 18 100 = E U R   40140 . Battery-based priority→ R e p l a c e m e n t   C o s t s = 15000 · 100     0.9 · 11 100 = E U R   13515 . Fuel Cell: H2-based priority→ R e p l a c e m e n t   C o s t s = 5100 · 100     1.7 · 2 100 + 5100 · 100     1.7 · 4 100 + 5100 · 100     1.7 · 6 100 + 5100 · 100     1.7 · 9 100 + 5100 · 100     1.7 · 11 100 + 5100 · 100     1.7 · 13 100 + 5100 · 100     1.7 · 15 100 + 5100 · 100     1.7 · 18 100 = E U R   34037.4 .
Table 7. Initial annual O&M costs of the different elements of the microgrid.
ElementUnitsInitial Costs (EUR) (1)O&M CostsTotal O&M Costs (EUR/Year)
Battery bank40.8 kWh81605% CAPEX/y [12]EUR 408
Electrolyser10 kW15,0005% CAPEX/y [12]EUR 750
H2 tank2.51 kg5025.272% CAPEX/y [12]EUR 100.51
Fuel cell3.4 kW51005% CAPEX/y [12]EUR 255
Wind turbine3 kW3519.5629.20 EUR/kW [30]EUR 87.60
PV panels15 kW15,534.9616.37 EUR/kW [30]EUR 245.55
Total initial annual O&M costs of microgridEUR 1849.67
(1) See Table 3.
Table 8. Evolution of O&M costs as a function of EMS.
YearO&M Costs (EUR/Year)
Hydrogen-Based Priority EMS
O&M Costs (EUR/Year)
Battery-Based Priority EMS
Years 0–11849.671849.67
Years 2–31841.001849.67
Years 4–51832.331849.67
Years 6–81783.161849.67
Years 9–101770.151849.67
Year 111761.481775.42
Year 121720.981775.42
Years 13–141712.311568.56
Years 15–171703.641568.56
Years 18–191650.141568.56
Total O&M costs during the lifespan of the microgrid (EUR)35,254.0334,877.08
Table 9. Annual cost savings and energy trading of the microgrid depending on the EMS used.
Hydrogen-Based Priority EMSBattery-Based Priority EMS
Unit Costs (EUR/kWh)Energy (kWh) (1)Savings (EUR)Energy (kWh) (1)Savings (EUR)
Load demand-12,050-12,050-
Battery bank discharge0.136 [12]874.6118.953250442.00
Fuel cell0.136 [12]2842386.51175.223.83
Grid in−0.136 [12]223.3−30.37514.6−69.99
RES0.136 [12]8110.11102.968110.21100.51
Grid out0.03 [12]8653259.5910,510315.3
Total annual savings1837.65 1814.13
(1) See Table 4.
Table 10. Annual and total costs and savings of the microgrid depending on the EMS applied.
H2-Based Priority EMSBattery-Based Priority EMS
Initial investment costs (EUR)EUR 52,339.78
O&M costs (EUR)Annual averageEUR 1762.70EUR 1743.85
Total (20 years)EUR 35,254.03EUR 34,877.08
Replacement costs (EUR)Total (20 years)EUR 74,177.40EUR 17,537.88
Cost savings (EUR)AnnualEUR 1837.65EUR 1814.13
Total (20 years)EUR 36,753.05EUR 36,282.58
Table 11. Expected scenario for initial investment and O&M costs.
Current ScenarioTarget ScenarioTotal Cost Reduction Needed to Achieve the Target Scenario (%)
Initial invest. costs (EUR)52,339.78FC: 510034,249.59FC: 142834.56
TANK: 5025.27TANK: 1407.08
ELECTROLYSER: 15,000ELECTROLYSER: 4200
BATT: 8160BATT: 8160
PV: 15,534.96PV: 15,534.96
WT: 3519.56WT: 3519.56
Initial annual O&M costs (EUR)1849.67FC: 2551053.70FC: 71.443.03
TANK: 100.51TANK: 28.14
ELECTROLYSER: 750ELECTROLYSER: 210
BATT: 408BATT: 408
PV: 247.77PV: 247.77
WT: 88.39WT: 88.39
Table 12. Carbon footprint of the proposed microgrid for the years 2020, 2021, and 2022, compared to if the same loads with the same consumption were supplied entirely by the Spanish electricity grid.
EMSConsumption (kWh)Spanish Electricity Carbon Footprint (kg CO2)
Year 2020 [36]
Carbon Footprint (kg CO2)
Year 2020
% CO2 Savings 2020Spanish Electricity Carbon Footprint (kg CO2)
Year 2021 [36]
Carbon Footprint (kg CO2)
Year 2021
% CO2 Savings 2021Spanish Electricity Carbon Footprint (kg CO2)
Year 2022 [36]
Carbon Footprint (kg CO2)
Year 2022
% CO2 Savings 2022
Microgrid with hydrogen-based priority223.30.1533.49598.150.1431.26298.150.1635.72898.15
Microgrid with battery-based priority514.60.1577.1995.730.1472.04495.730.1682.33695.73
Traditional connection to the main electrical grid12,0500.151807.5-0.141687-0.161928-
Table 13. CO2 emission costs based on the EMS for the years 2020, 2021, and 2022.
ApplicationCarbon Footprint (kg CO2) Year 2020CO2 Emission Costs 2020 (EUR)Carbon Footprint (kg CO2)
Year 2021
CO2 Emission Costs 2021 (EUR)Carbon Footprint (kg CO2)
Year 2022
CO2 Emission Costs 2022 (EUR)
Hydrogen-based priority33.4951.19–2.3731.2621.11–2.2135.7281.26–2.53
Battery-based priority77.192.73–5.4772.0442.55–5.1082.3362.91–5.83
Loads connected to the electrical grid1807.563.99–127.97168759.72–119.44192868.25–136.50
Table 14. Unitary investment costs per energy (EUR/kWh) based on the EMS implemented.
H2-Based PriorityBattery-Based Priority
ElementInvestment Costs (EUR) (1)Energy (kWh) (2)Unitary Costs (EUR/kWh)Investment Costs (EUR) (1)Energy (kWh) (2)Unitary Costs (EUR/kWh)
RES19,054.52162,2020.11719,054.52162,2020.117
ALKEL55140119,3400.4622851518,5521.537
PEM-FC39,137.456,8400.689510035041.455
Battery816017,4920.46612,182.8865,0000.187
H2 tank5025.2772,385 (3)0.0695025.2711,253 (3)0.447
Total126,517.19428,2590.29569,877.67260,5110.268
(1) See Table 3 and Table 6. I n v . c o s t s i E U R = I n i t i a l i n v . c o s t s i E U R + R e p . c o s t s i E U R . (2) See Table 4 and Table 9. E i k W h = E a n n u a l i k W h y e a r · T m i c r o g r i d ( y e a r ) , where T m i c r o g r i d = 20   y e a r s . (3) The total energy stored in the hydrogen tank is considered to be 60.65% (efficiency of the studied alkaline electrolyser) of the total energy used in the electrolyser to produce hydrogen during the lifetime of the microgrid.
Table 15. Unitary O&M costs per energy (EUR/kWh) based on the EMS implemented.
H2-Based PriorityBattery-Based Priority
ElementO&M Costs (EUR) (1)Energy (kWh) (2)Unitary Costs (EUR/kWh)O&M Costs (EUR) (1)Energy (kWh) (2)Unitary Costs (EUR/kWh)
RES6663162,2020.0416663162,2020.041
ALKEL14,028119,3400.11814,331.7518,5520.773
PEM-FC4332.70556,8400.076510035041.455
Battery816017,4920.4666712.0165,0000.103
H2 tank2010.272,385 (3)0.0285025.271253 (3)0.447
Total35,193.905428,2590.08237,832.03260,5110.145
(1) See Table 7 and Table 8. O & M . c o s t s T . i E U R = i = 1 T m i c r o g r i d O & M . c o s t s T . i E U R y e a r , where O & M c o s t s i E U R y e a r = I n v . c o s t s i E U R k W · % C A P E X . (2) See Table 4 and Table 9. E i k W h = E a n n u a l i k W h y e a r · T m i c r o g r i d ( y e a r ) , where T m i c r o g r i d = 20   y e a r s . (3) The total energy stored in the hydrogen tank is considered to be 60.65% (efficiency of the studied alkaline electrolyser) of the total energy used in the electrolyser to produce hydrogen during the lifetime of the microgrid.
Disclaimer/Publisher’s Note: The statements, opinions and data contained in all publications are solely those of the individual author(s) and contributor(s) and not of MDPI and/or the editor(s). MDPI and/or the editor(s) disclaim responsibility for any injury to people or property resulting from any ideas, methods, instructions or products referred to in the content.

