
Fast Adaptive Binarization of QR Code Images for Automatic Sorting in Logistics Systems

Abstract
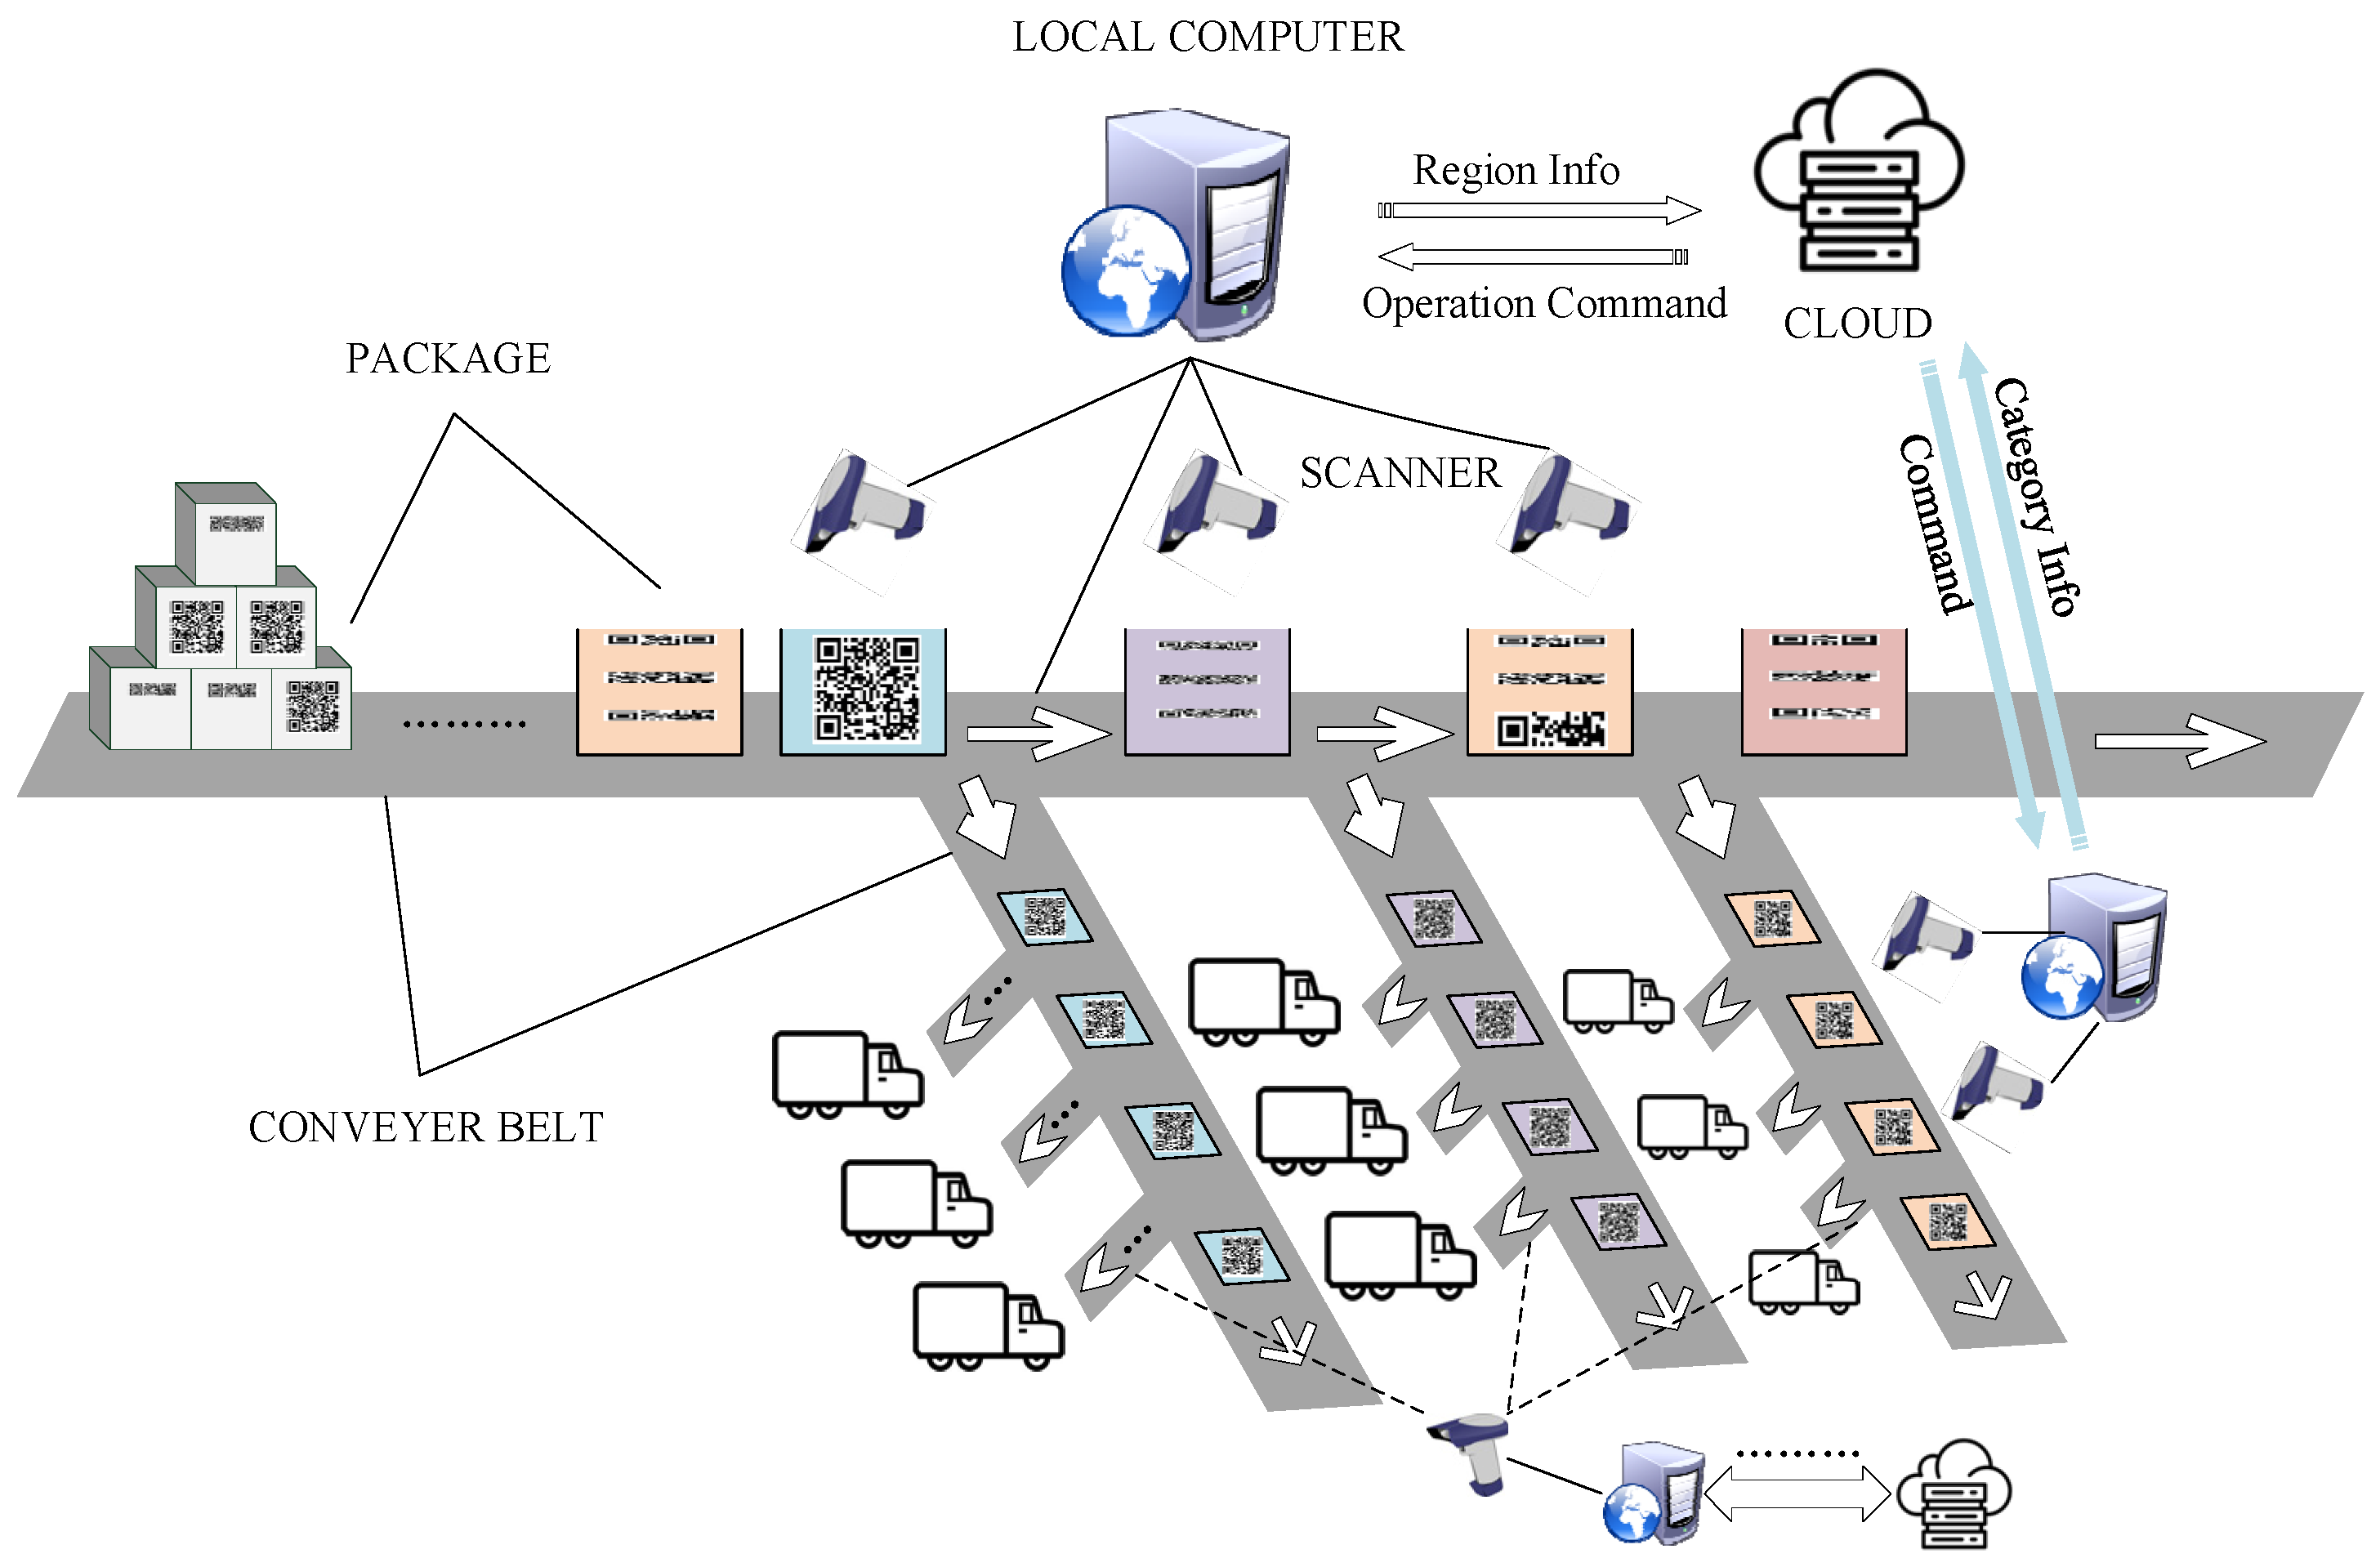
:1. Introduction
2. Related Work
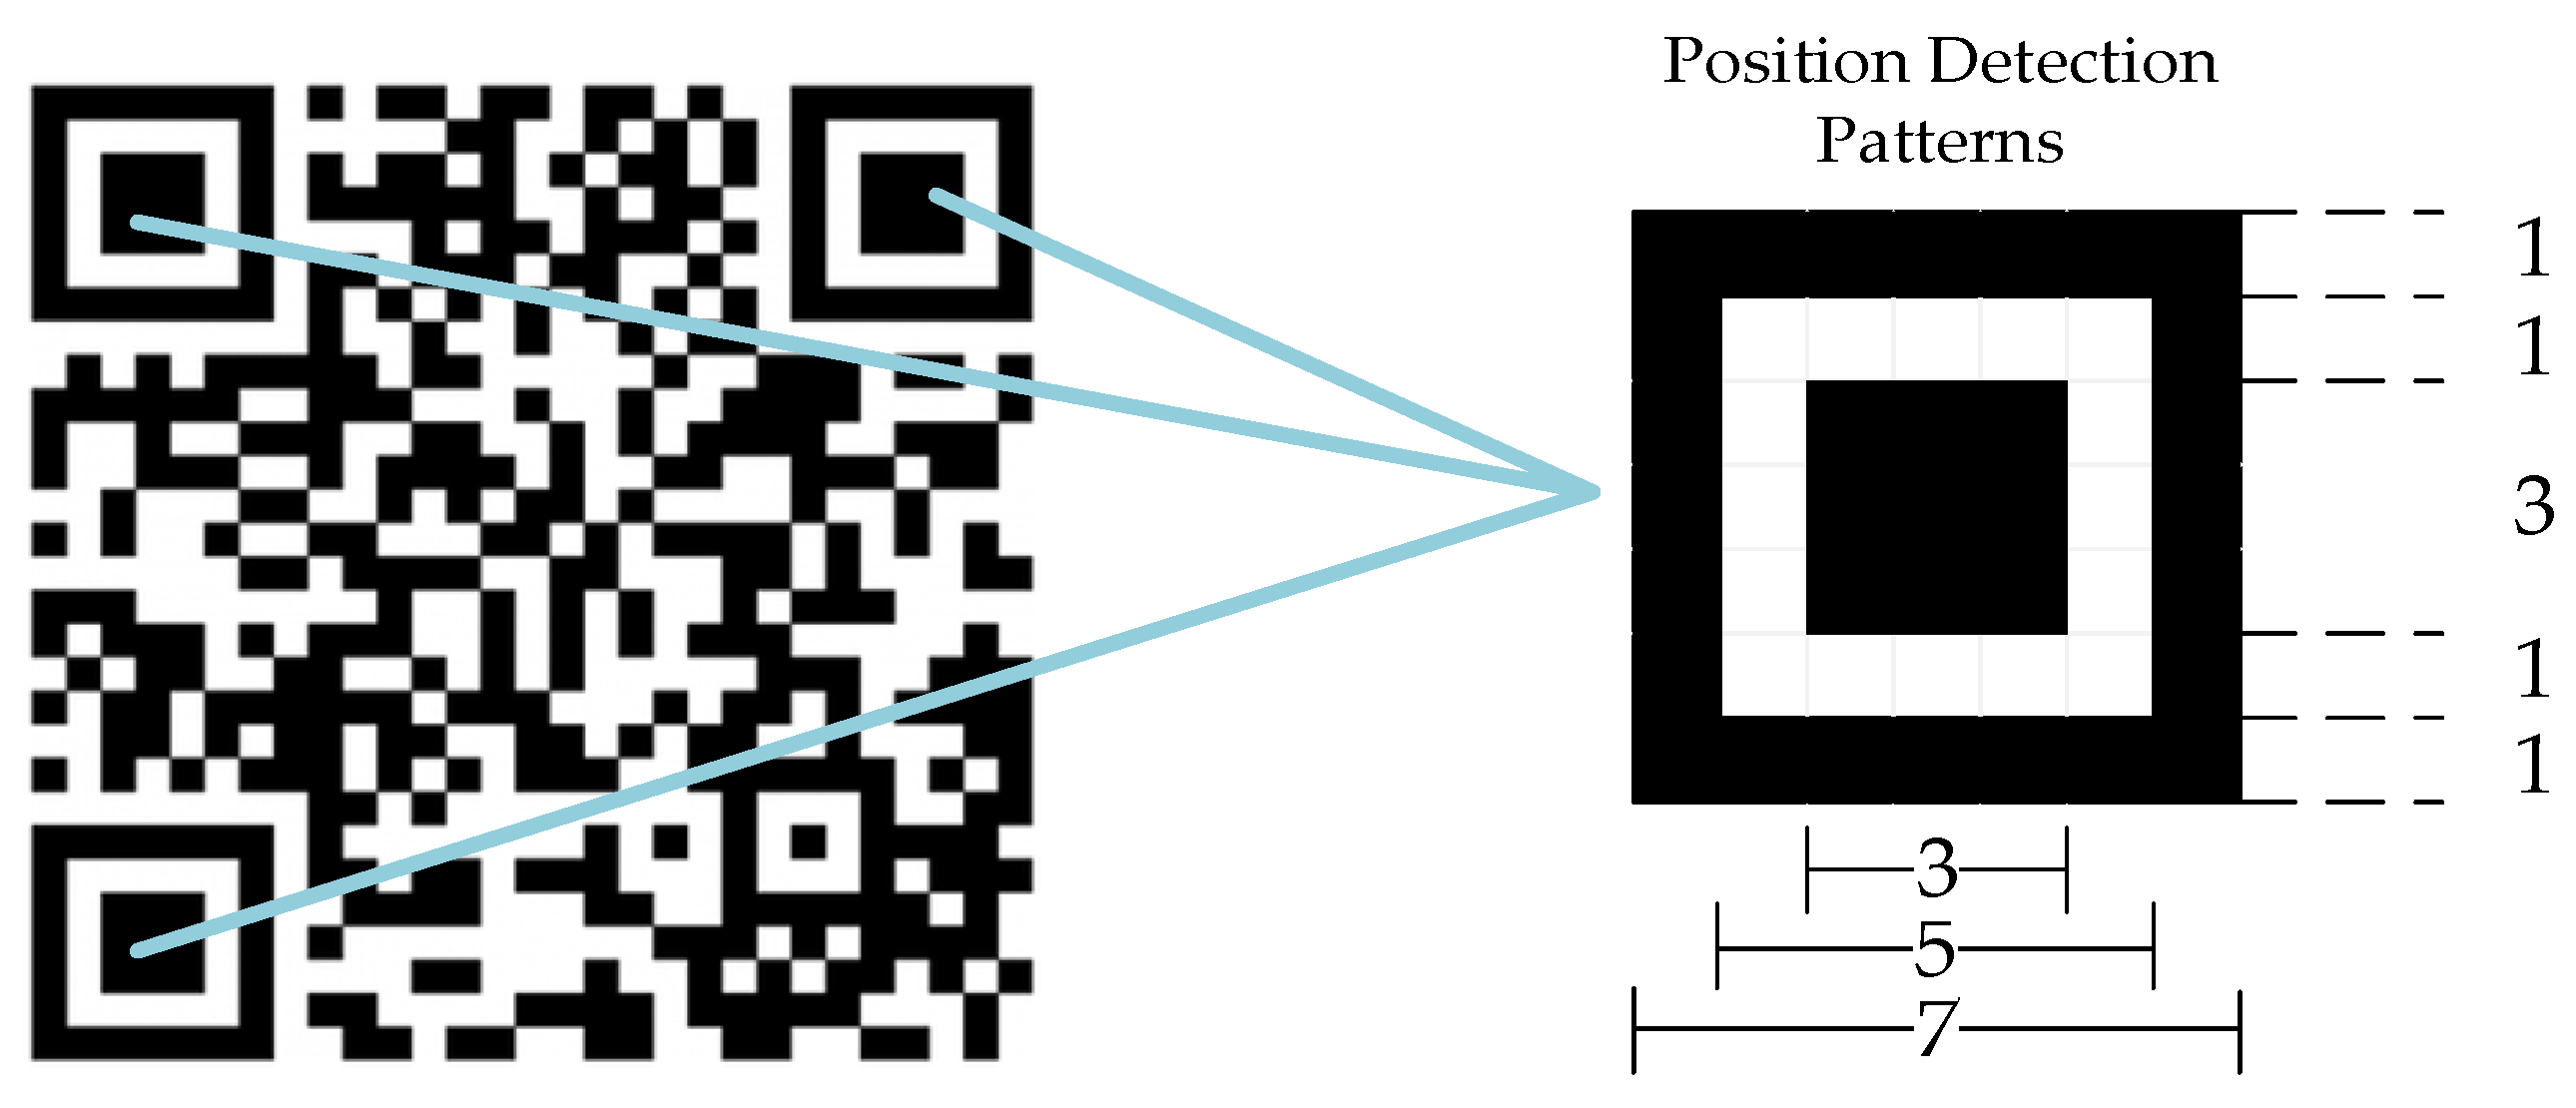
2.1. Features of QR Code
2.2. Some Binarization Algorithm
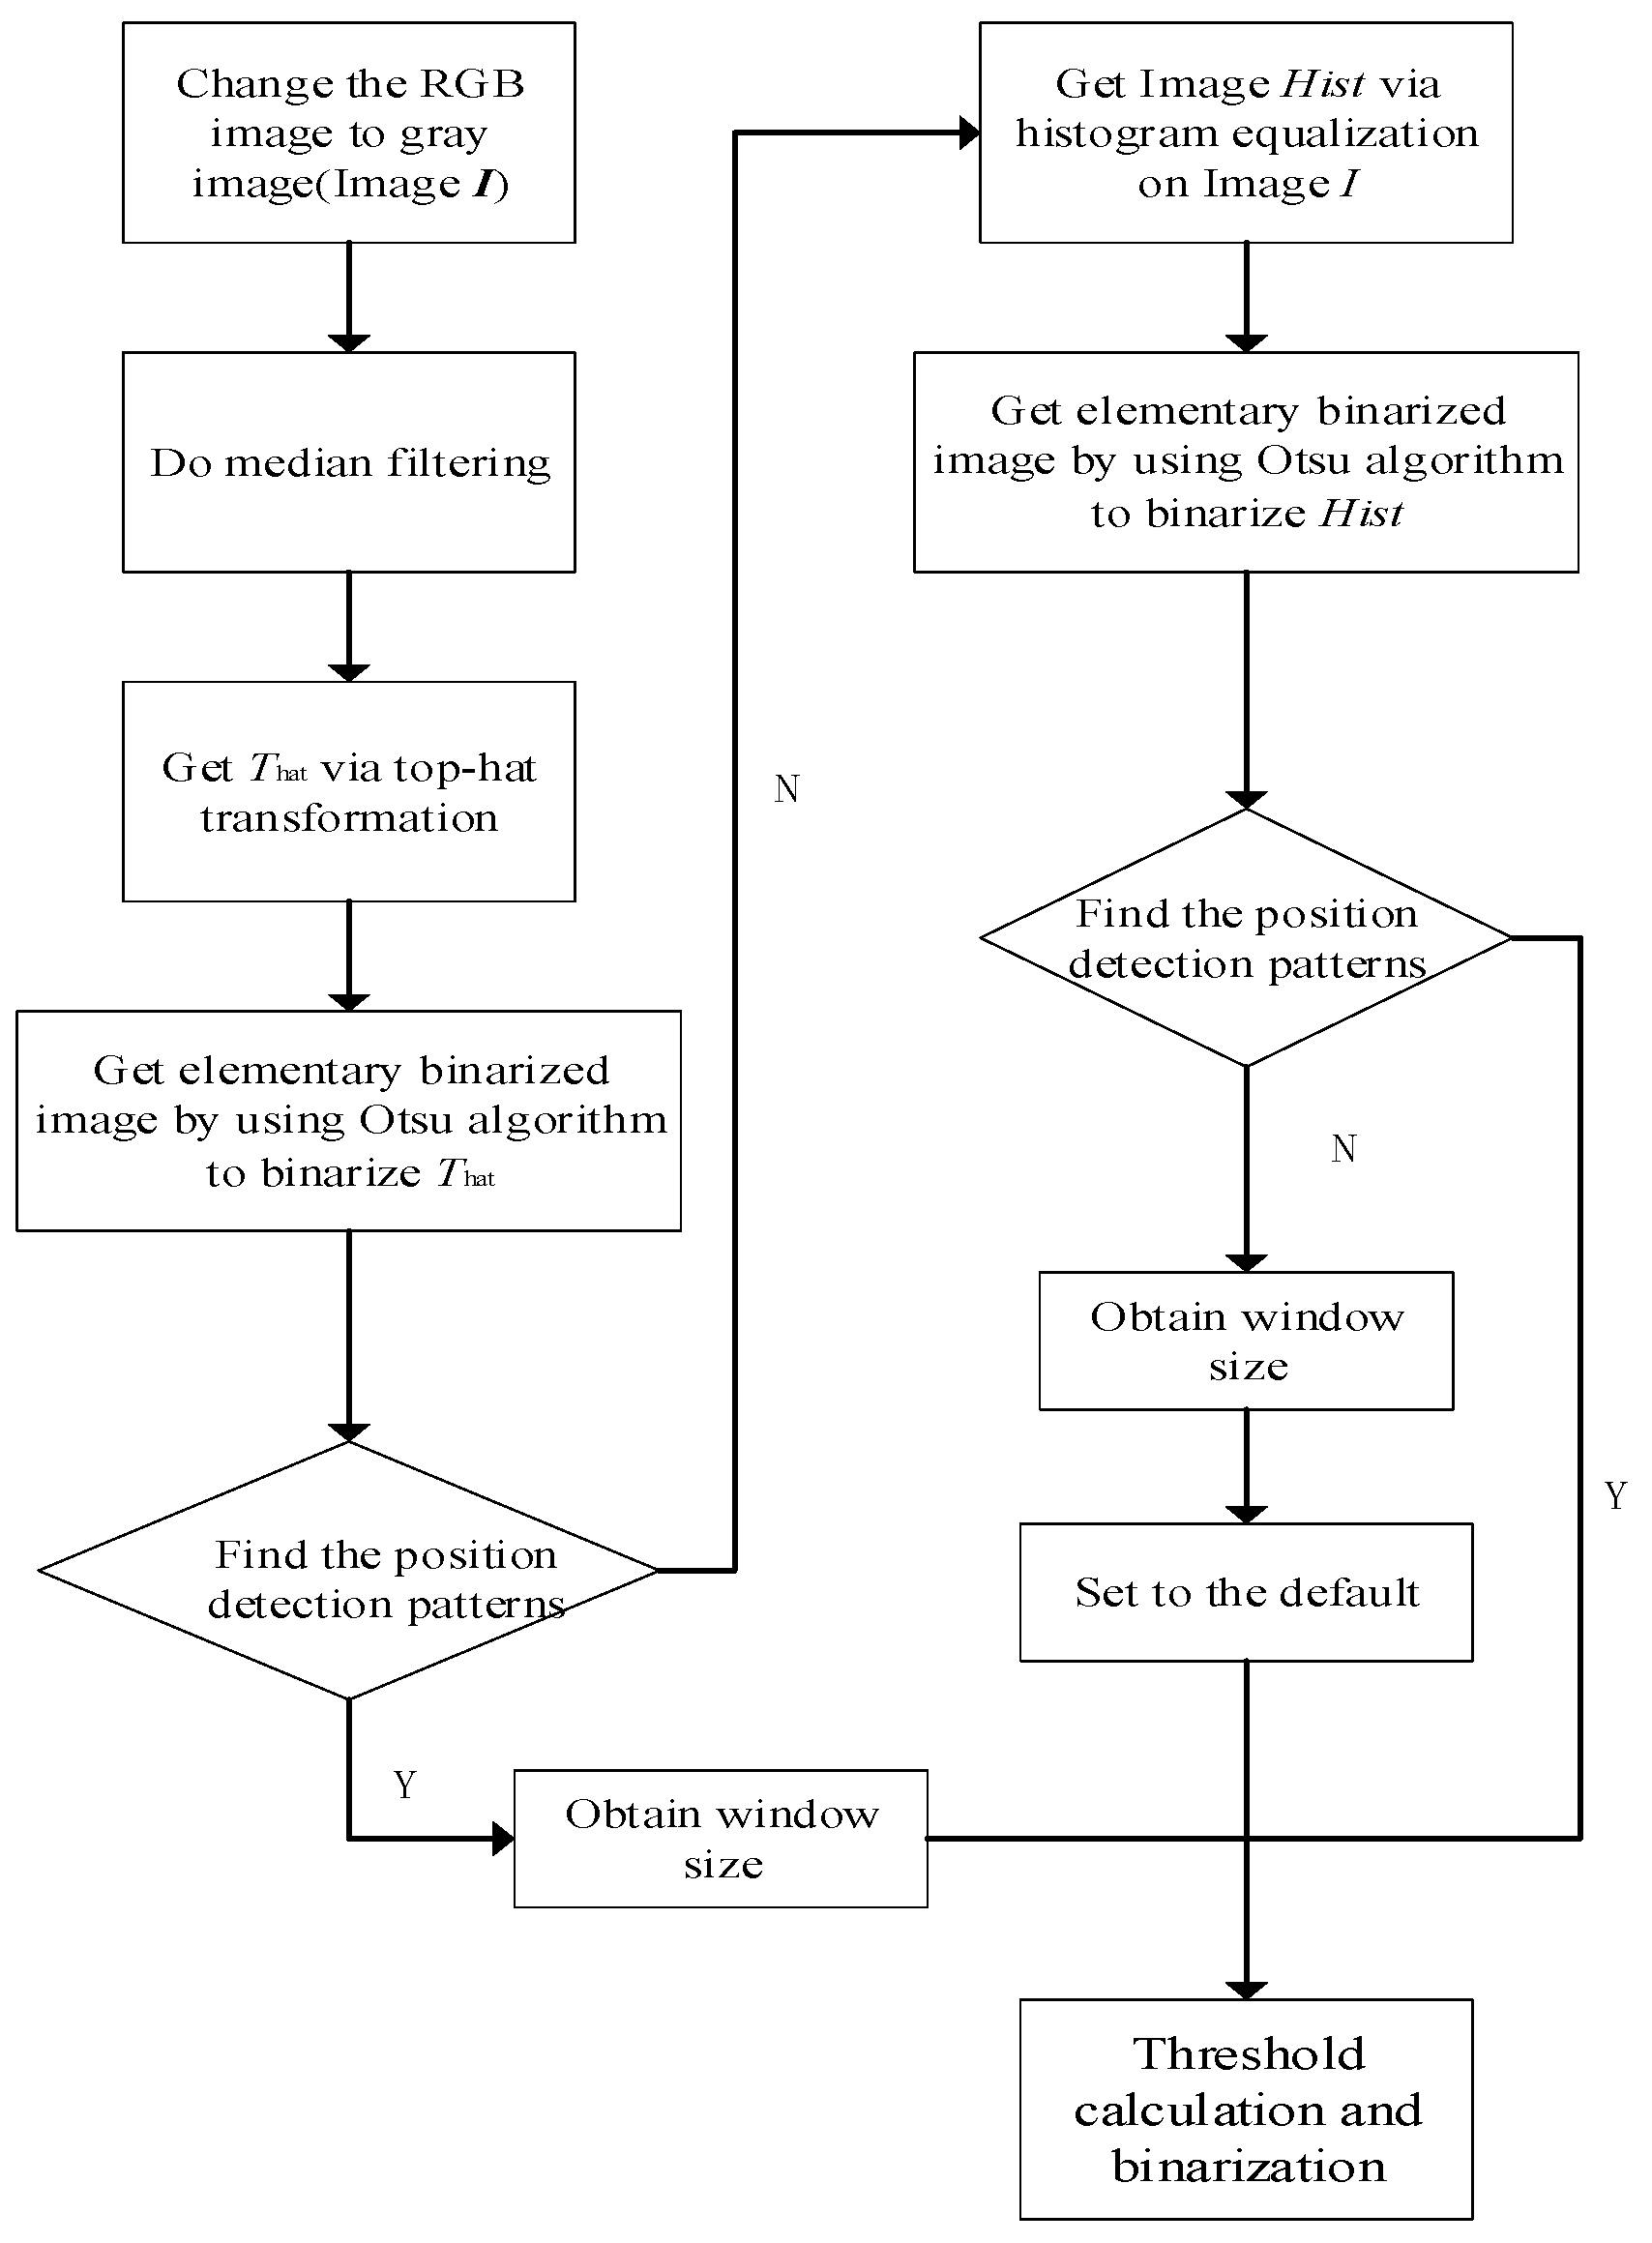
3. Method
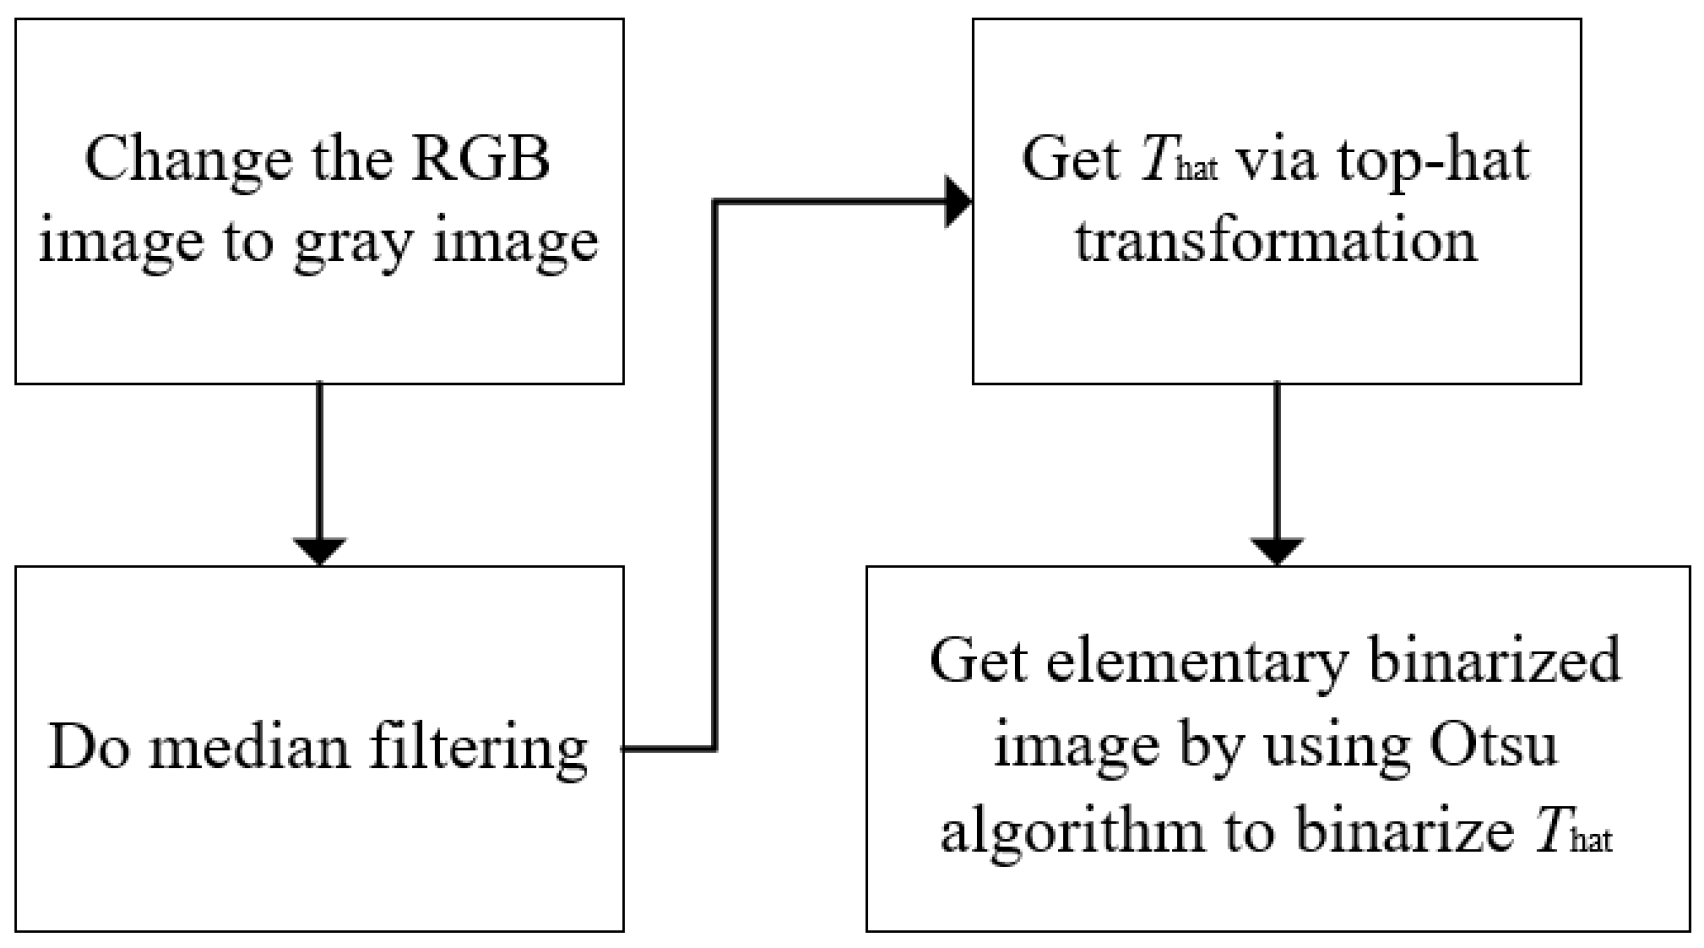
3.1. Preprocessing
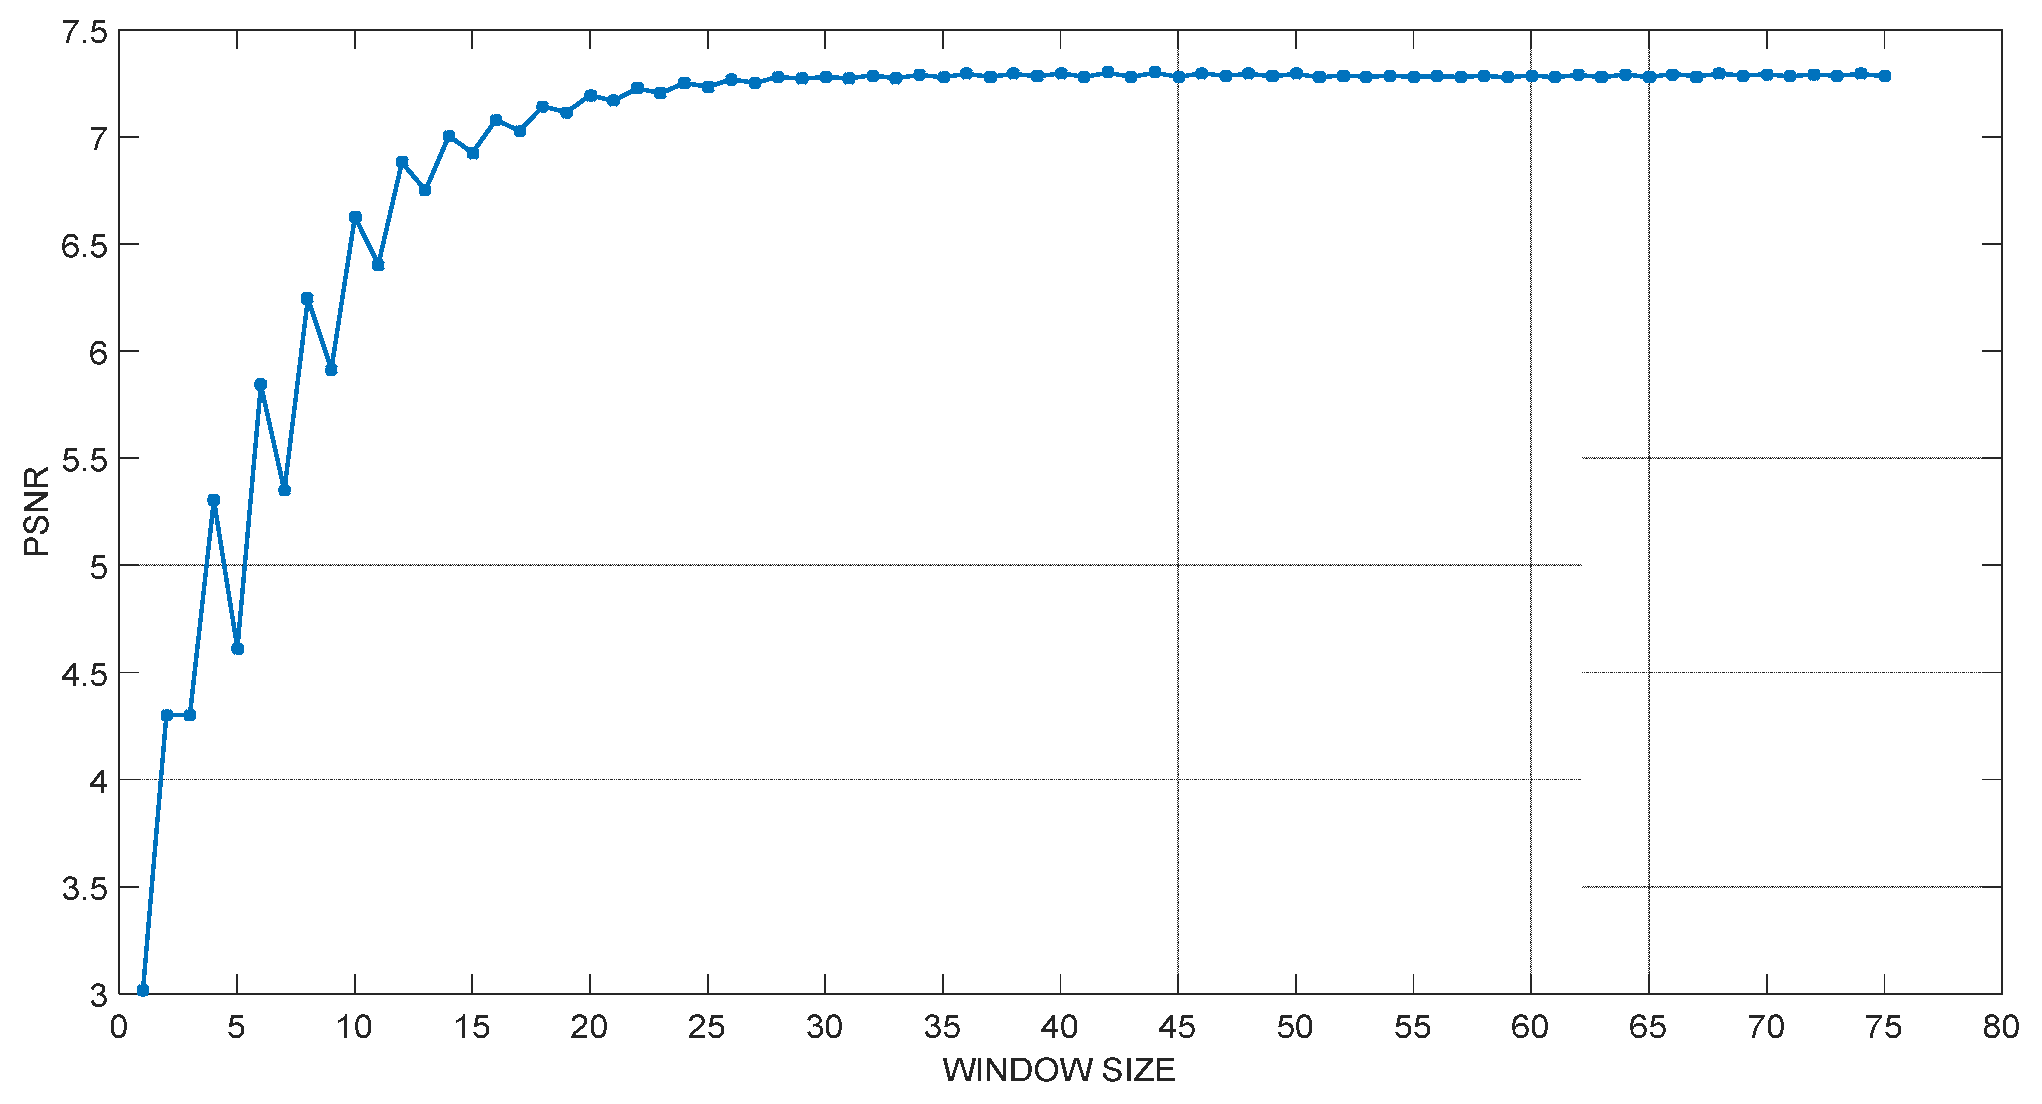
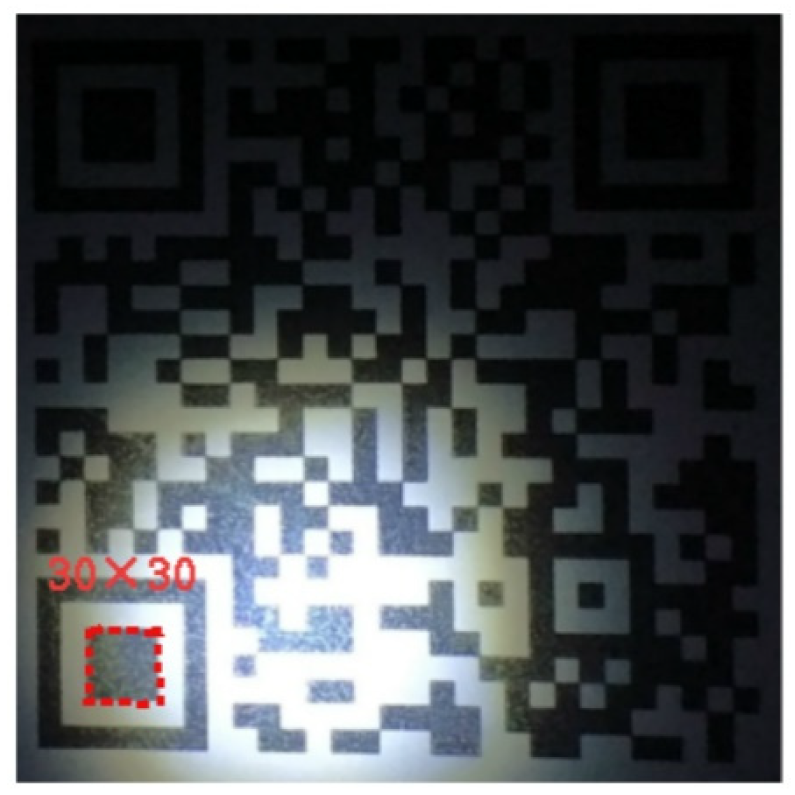
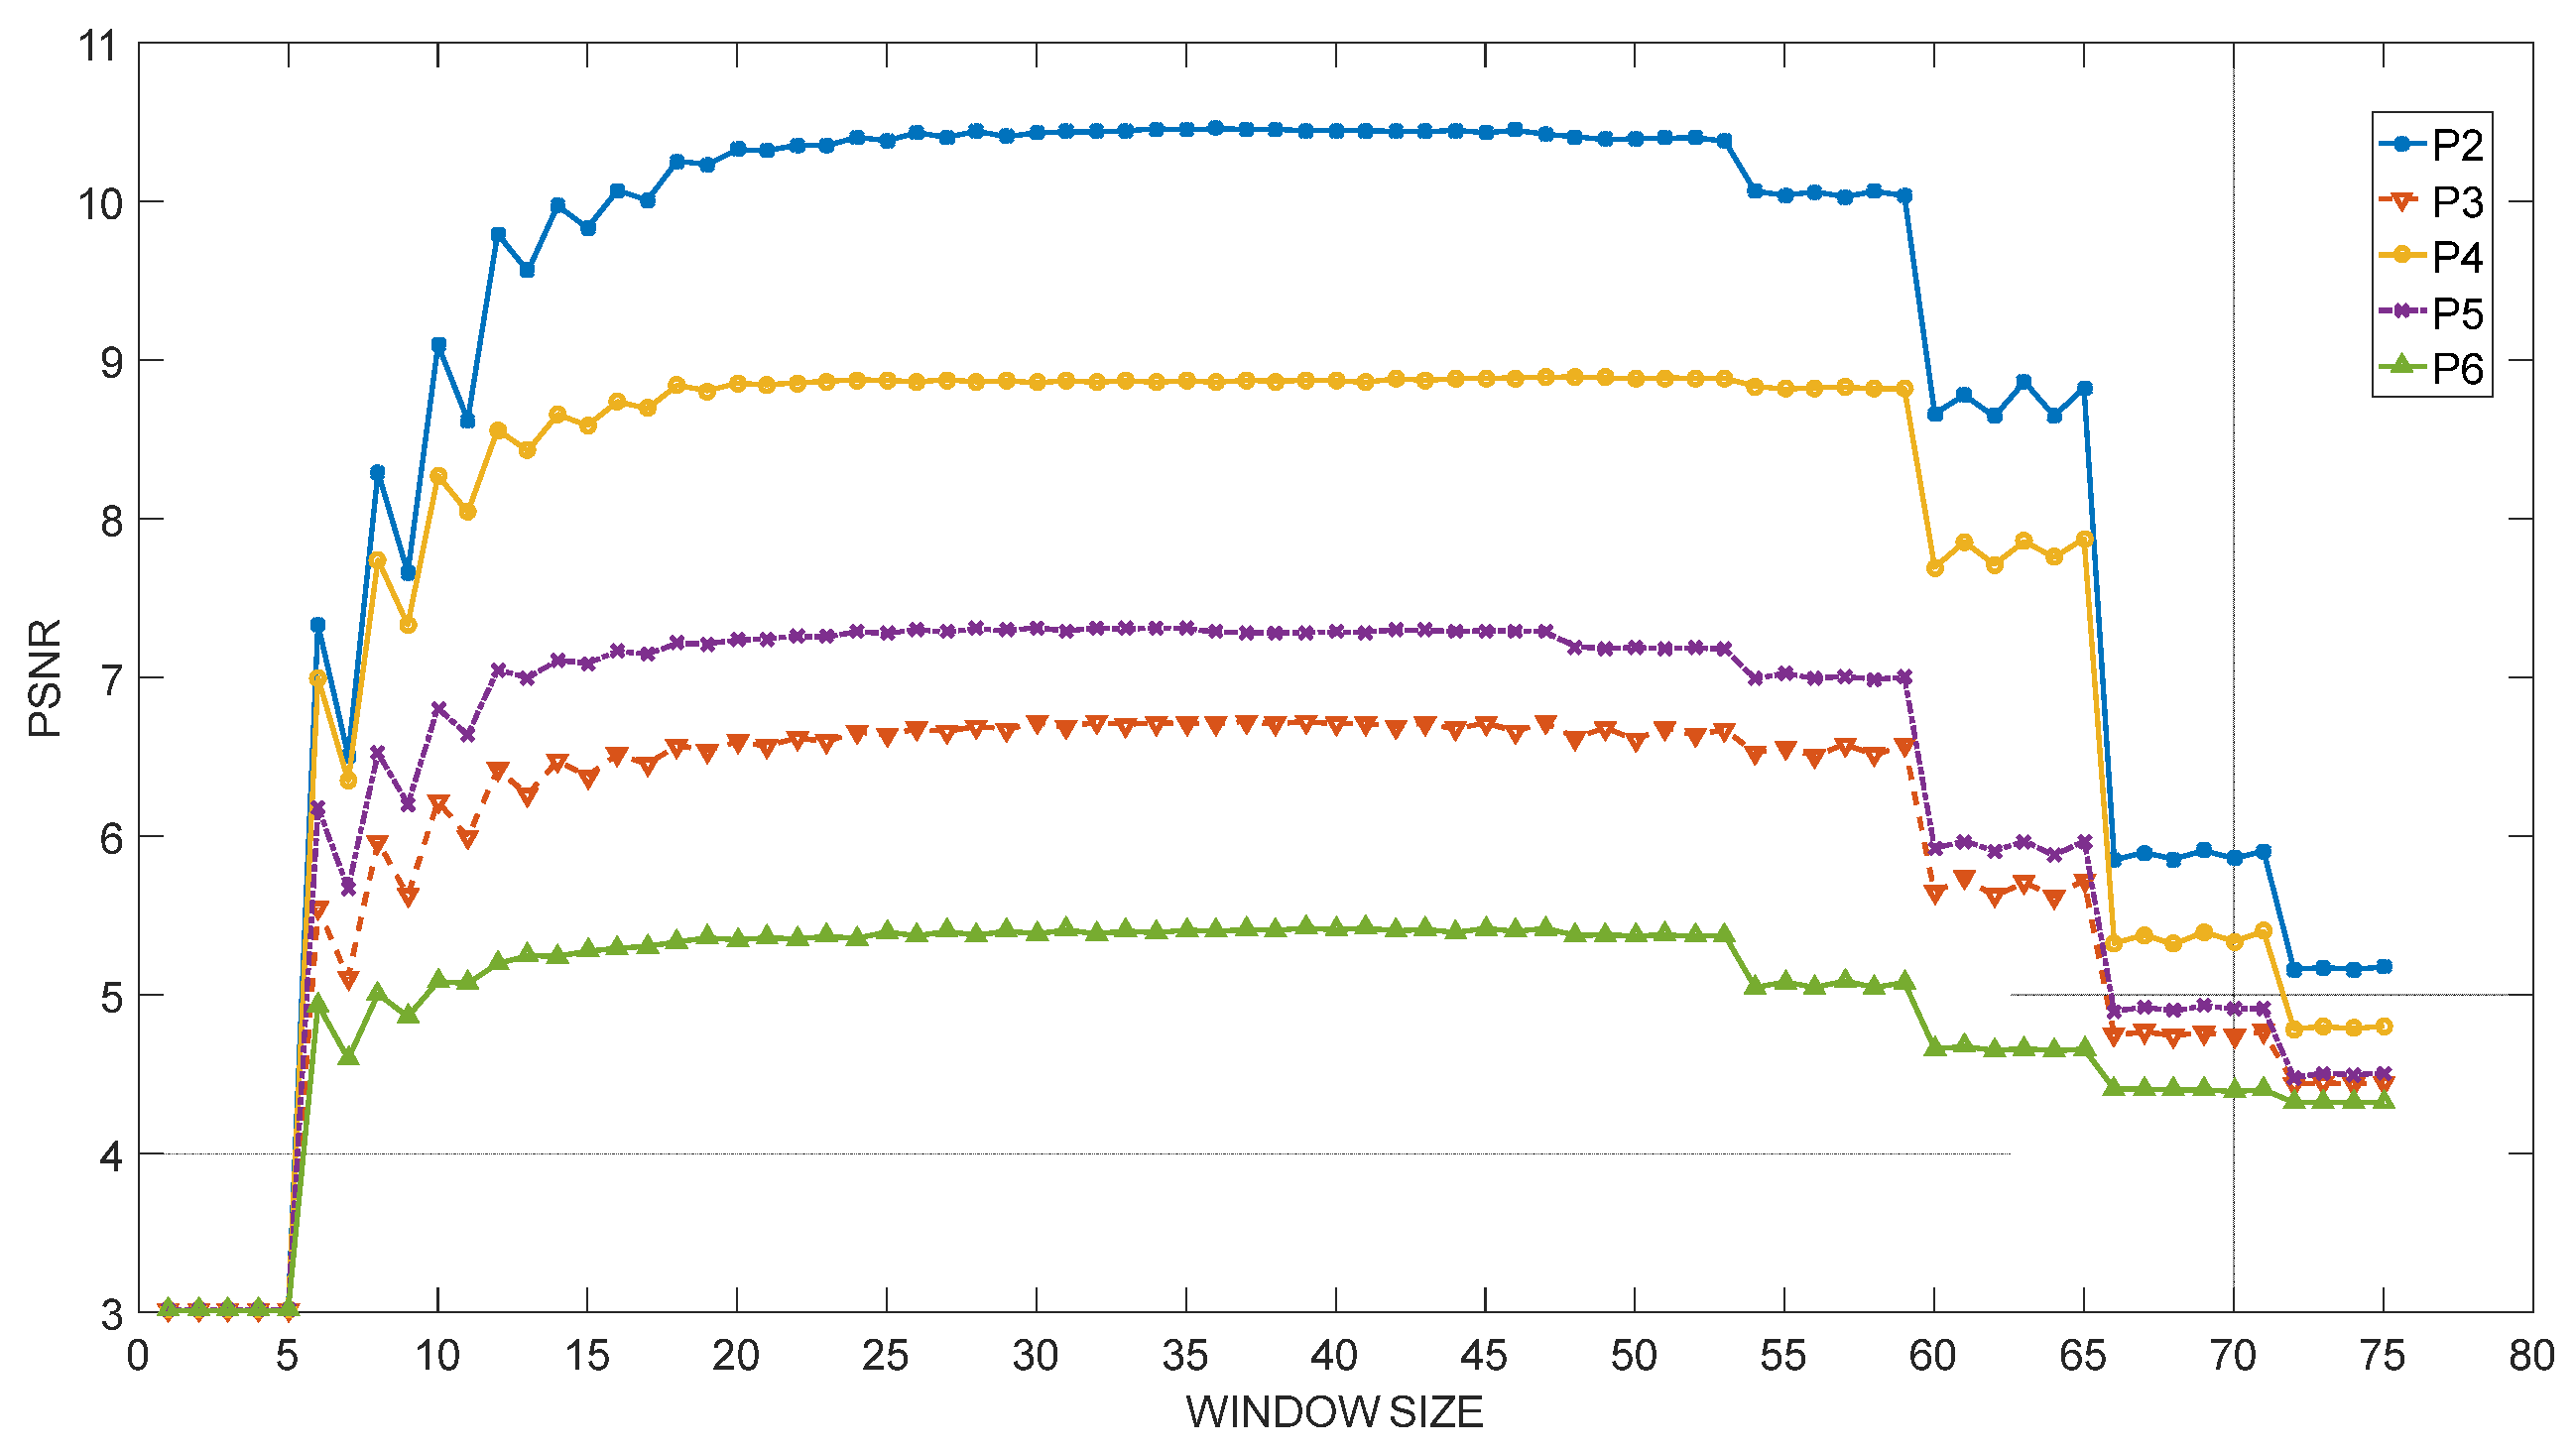
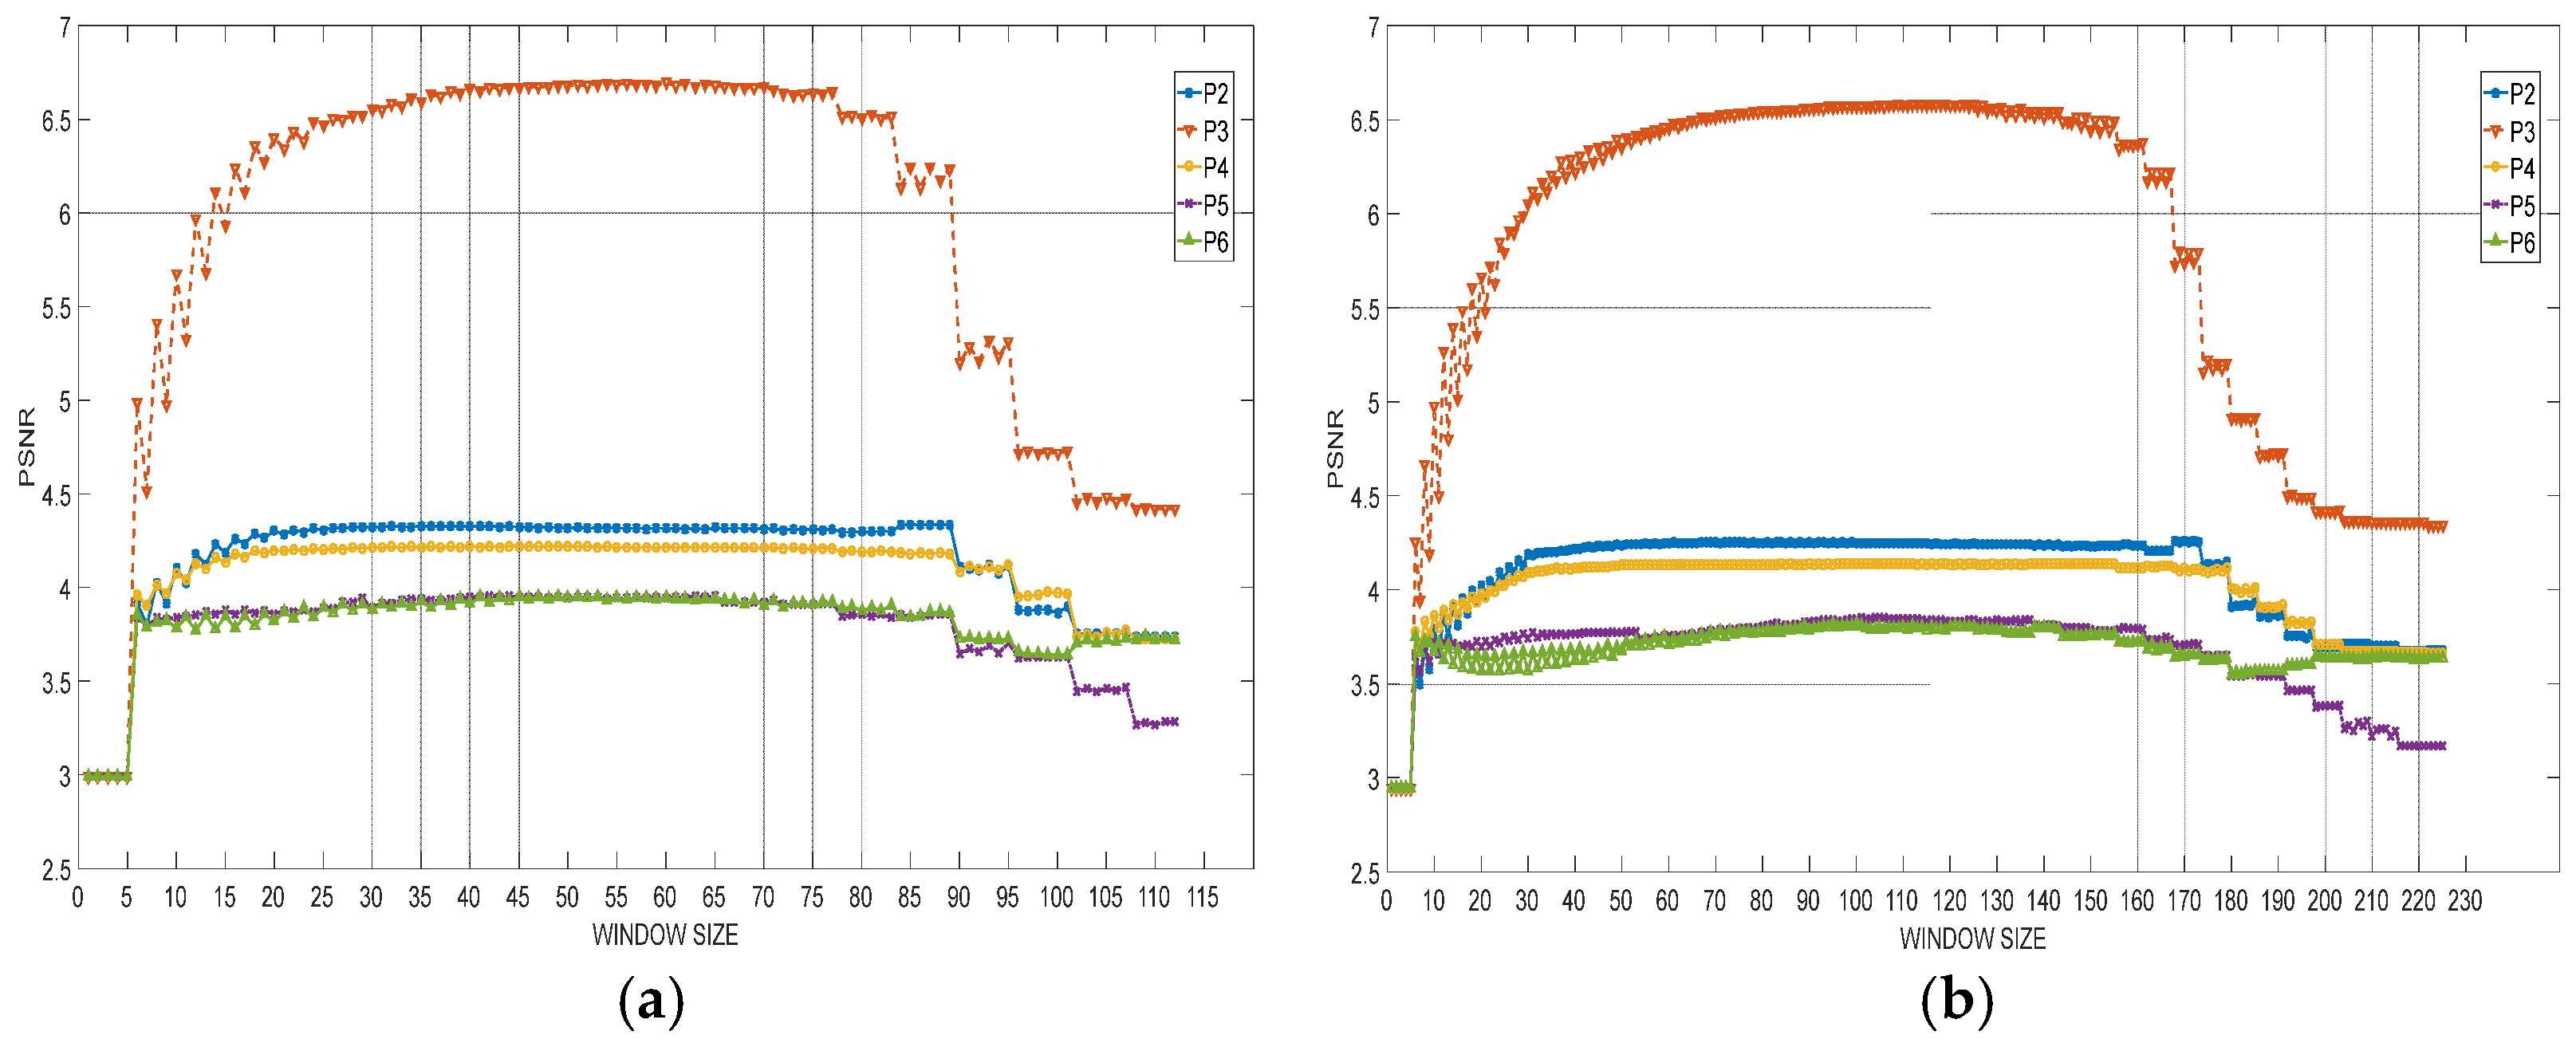
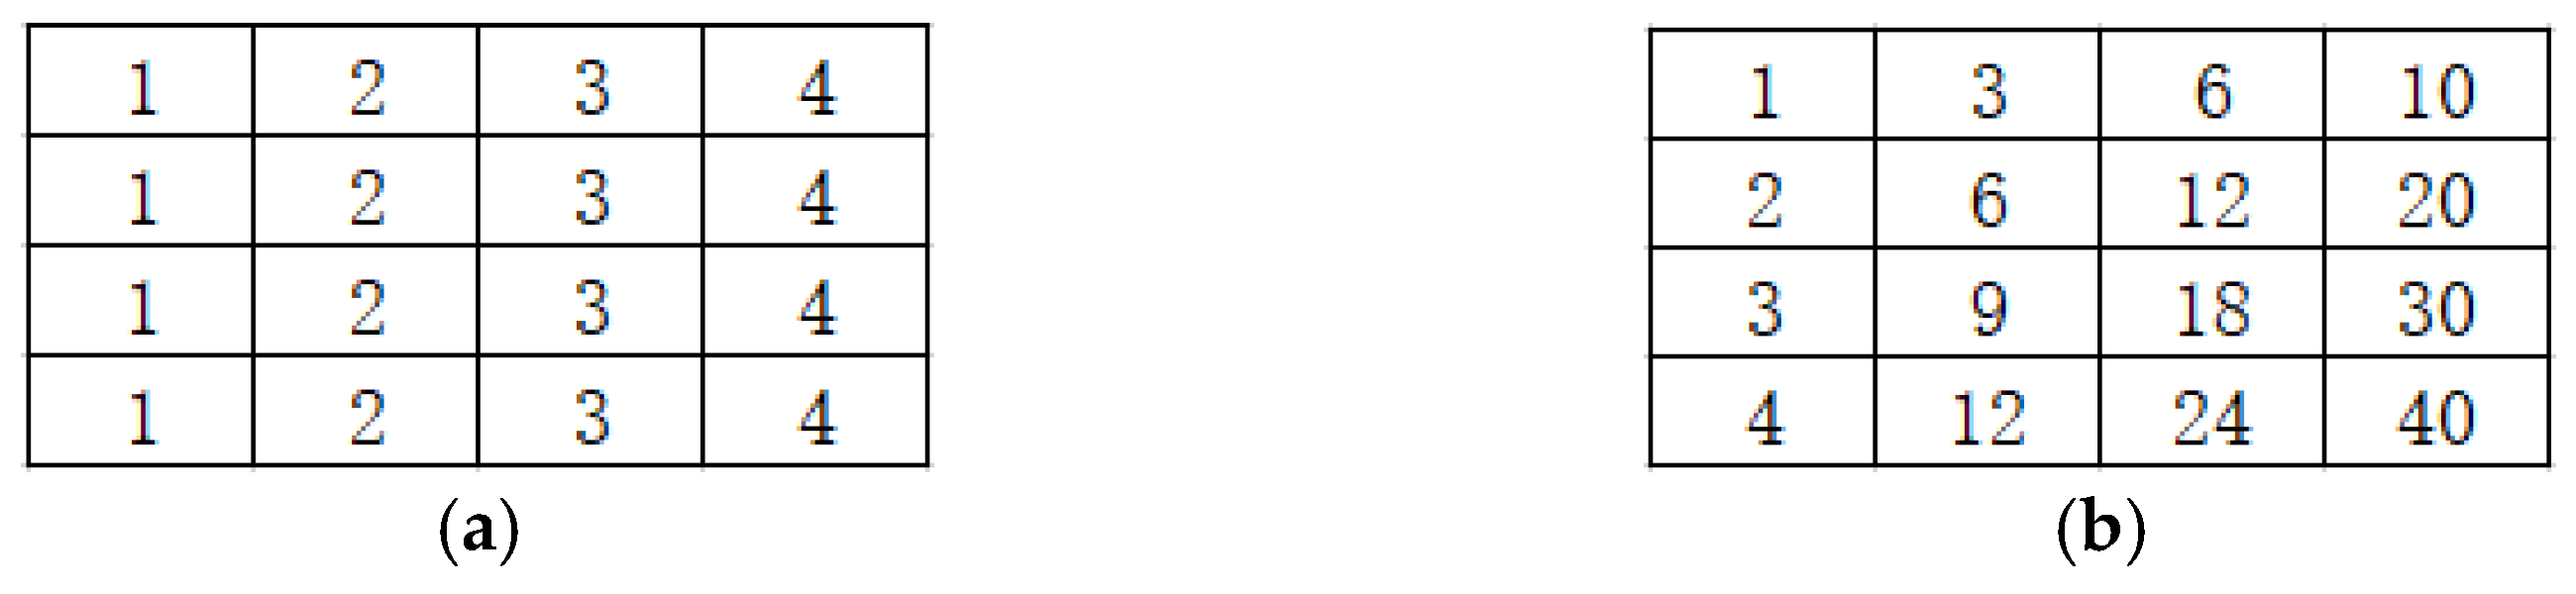
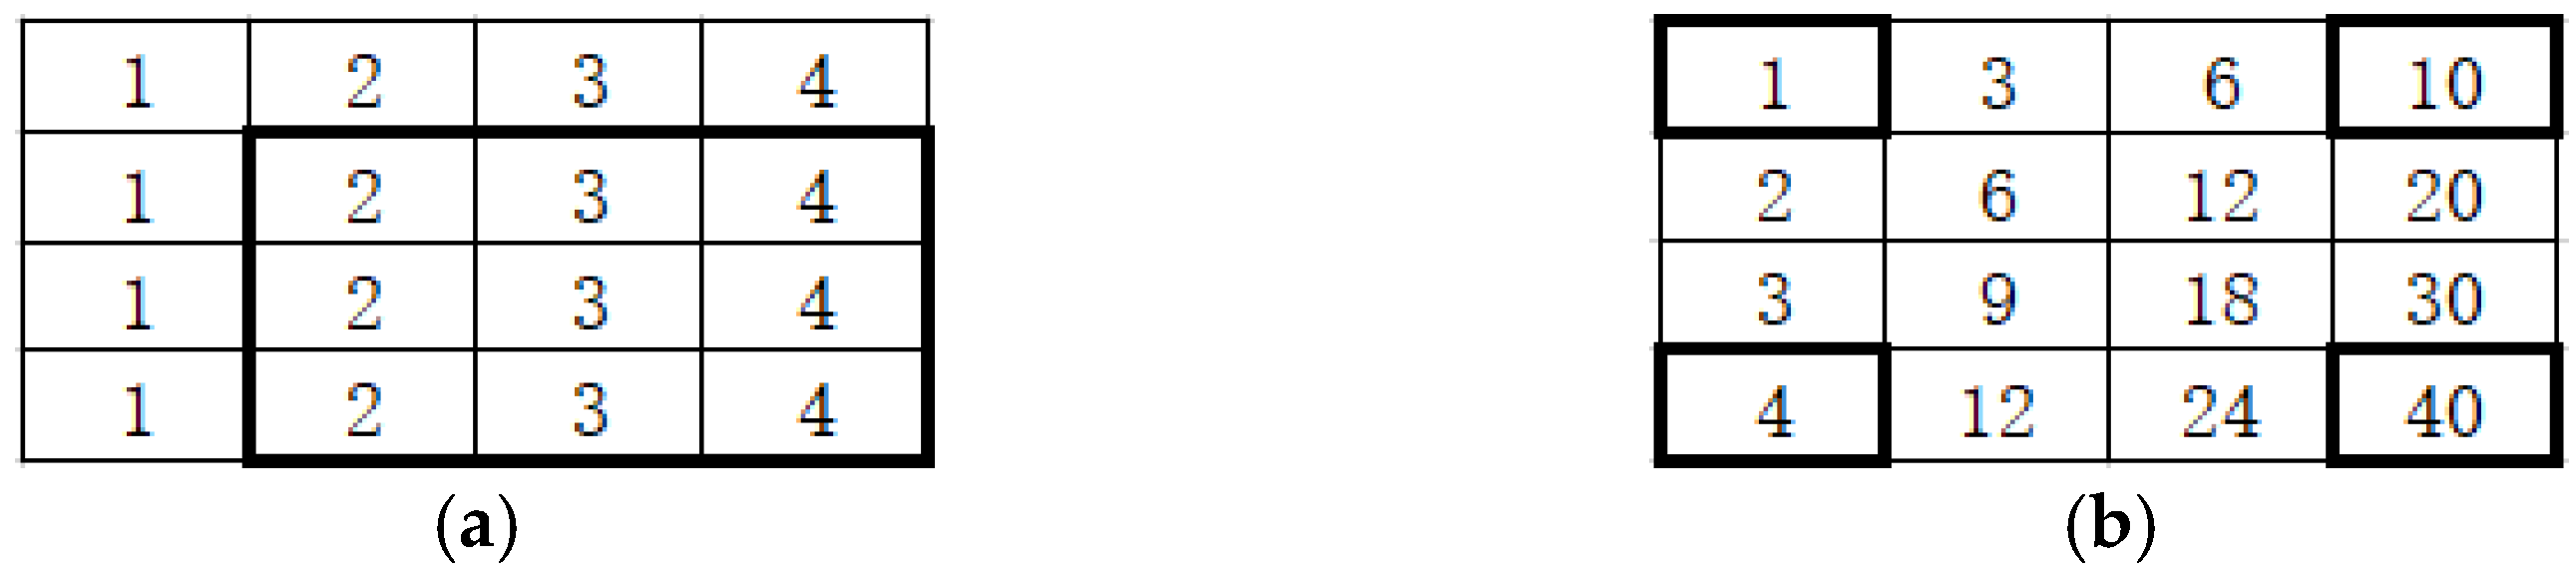
3.2. Define Window Size Adaptively
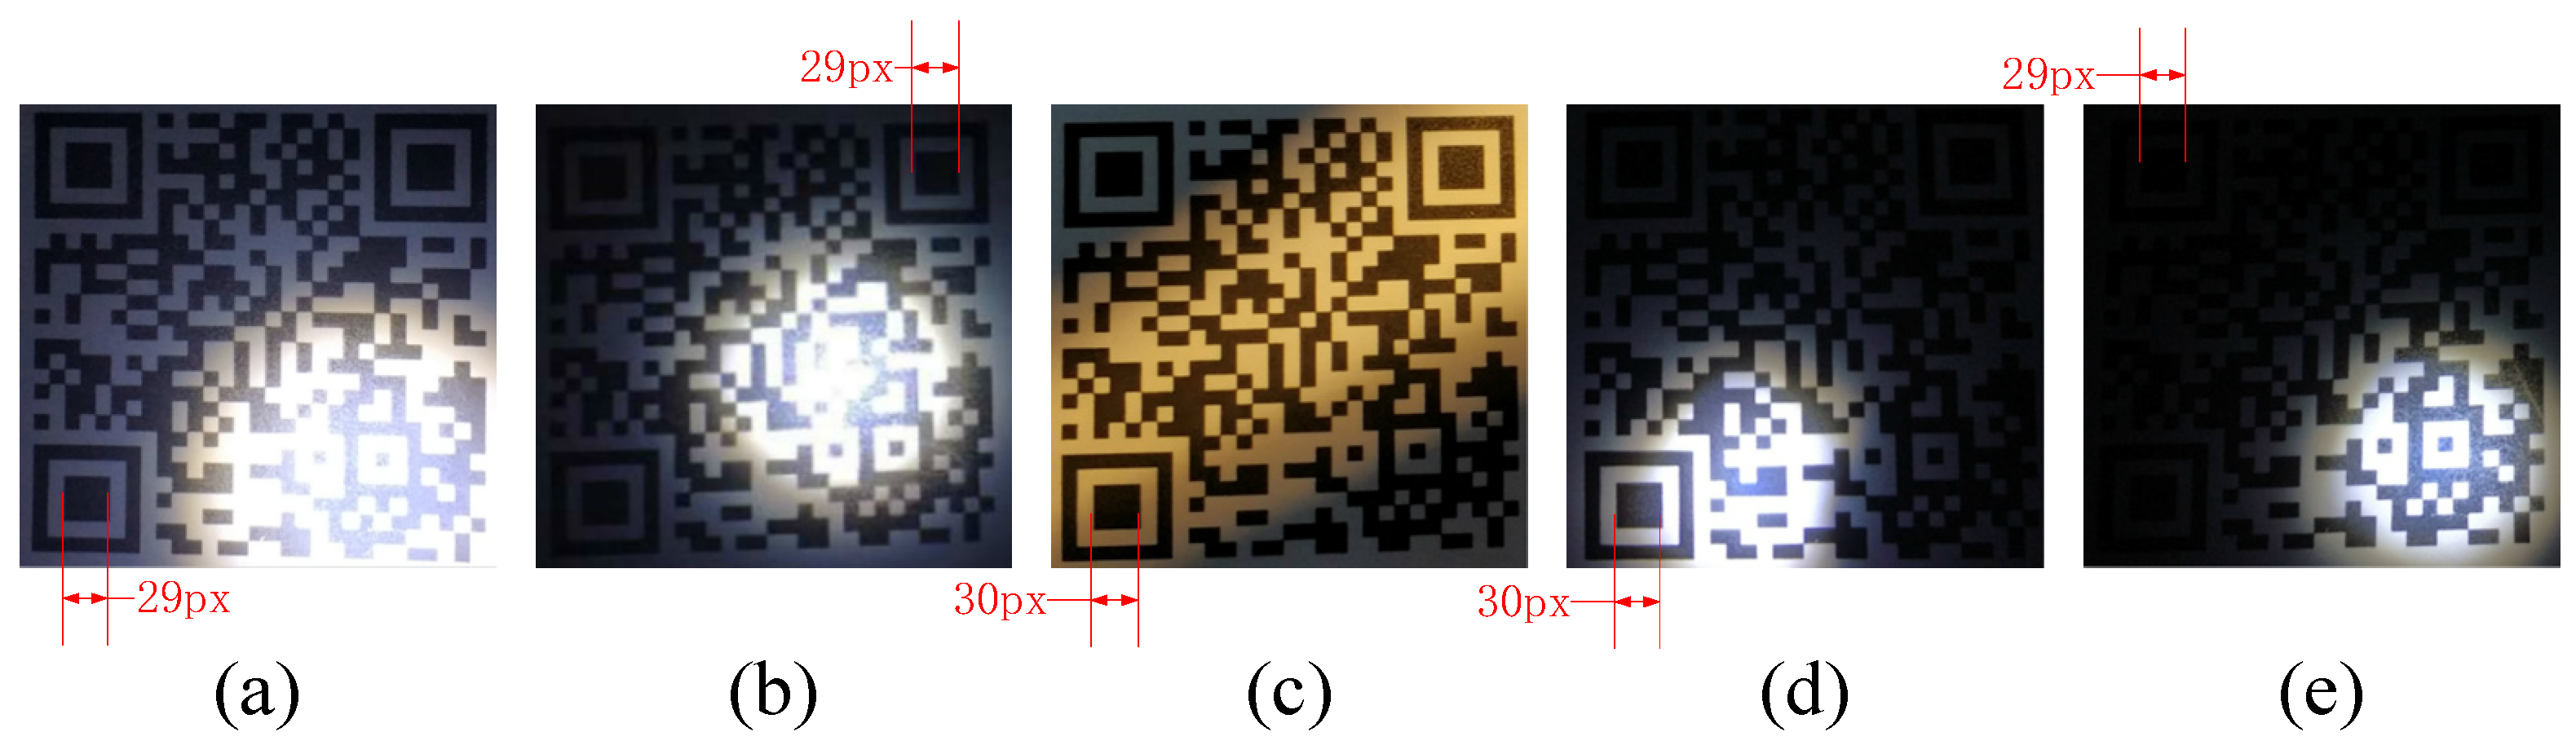
3.3. Window Size Correction
3.4. Threshold Calculation and Binarization
3.5. Morphological Processing
4. Experiments
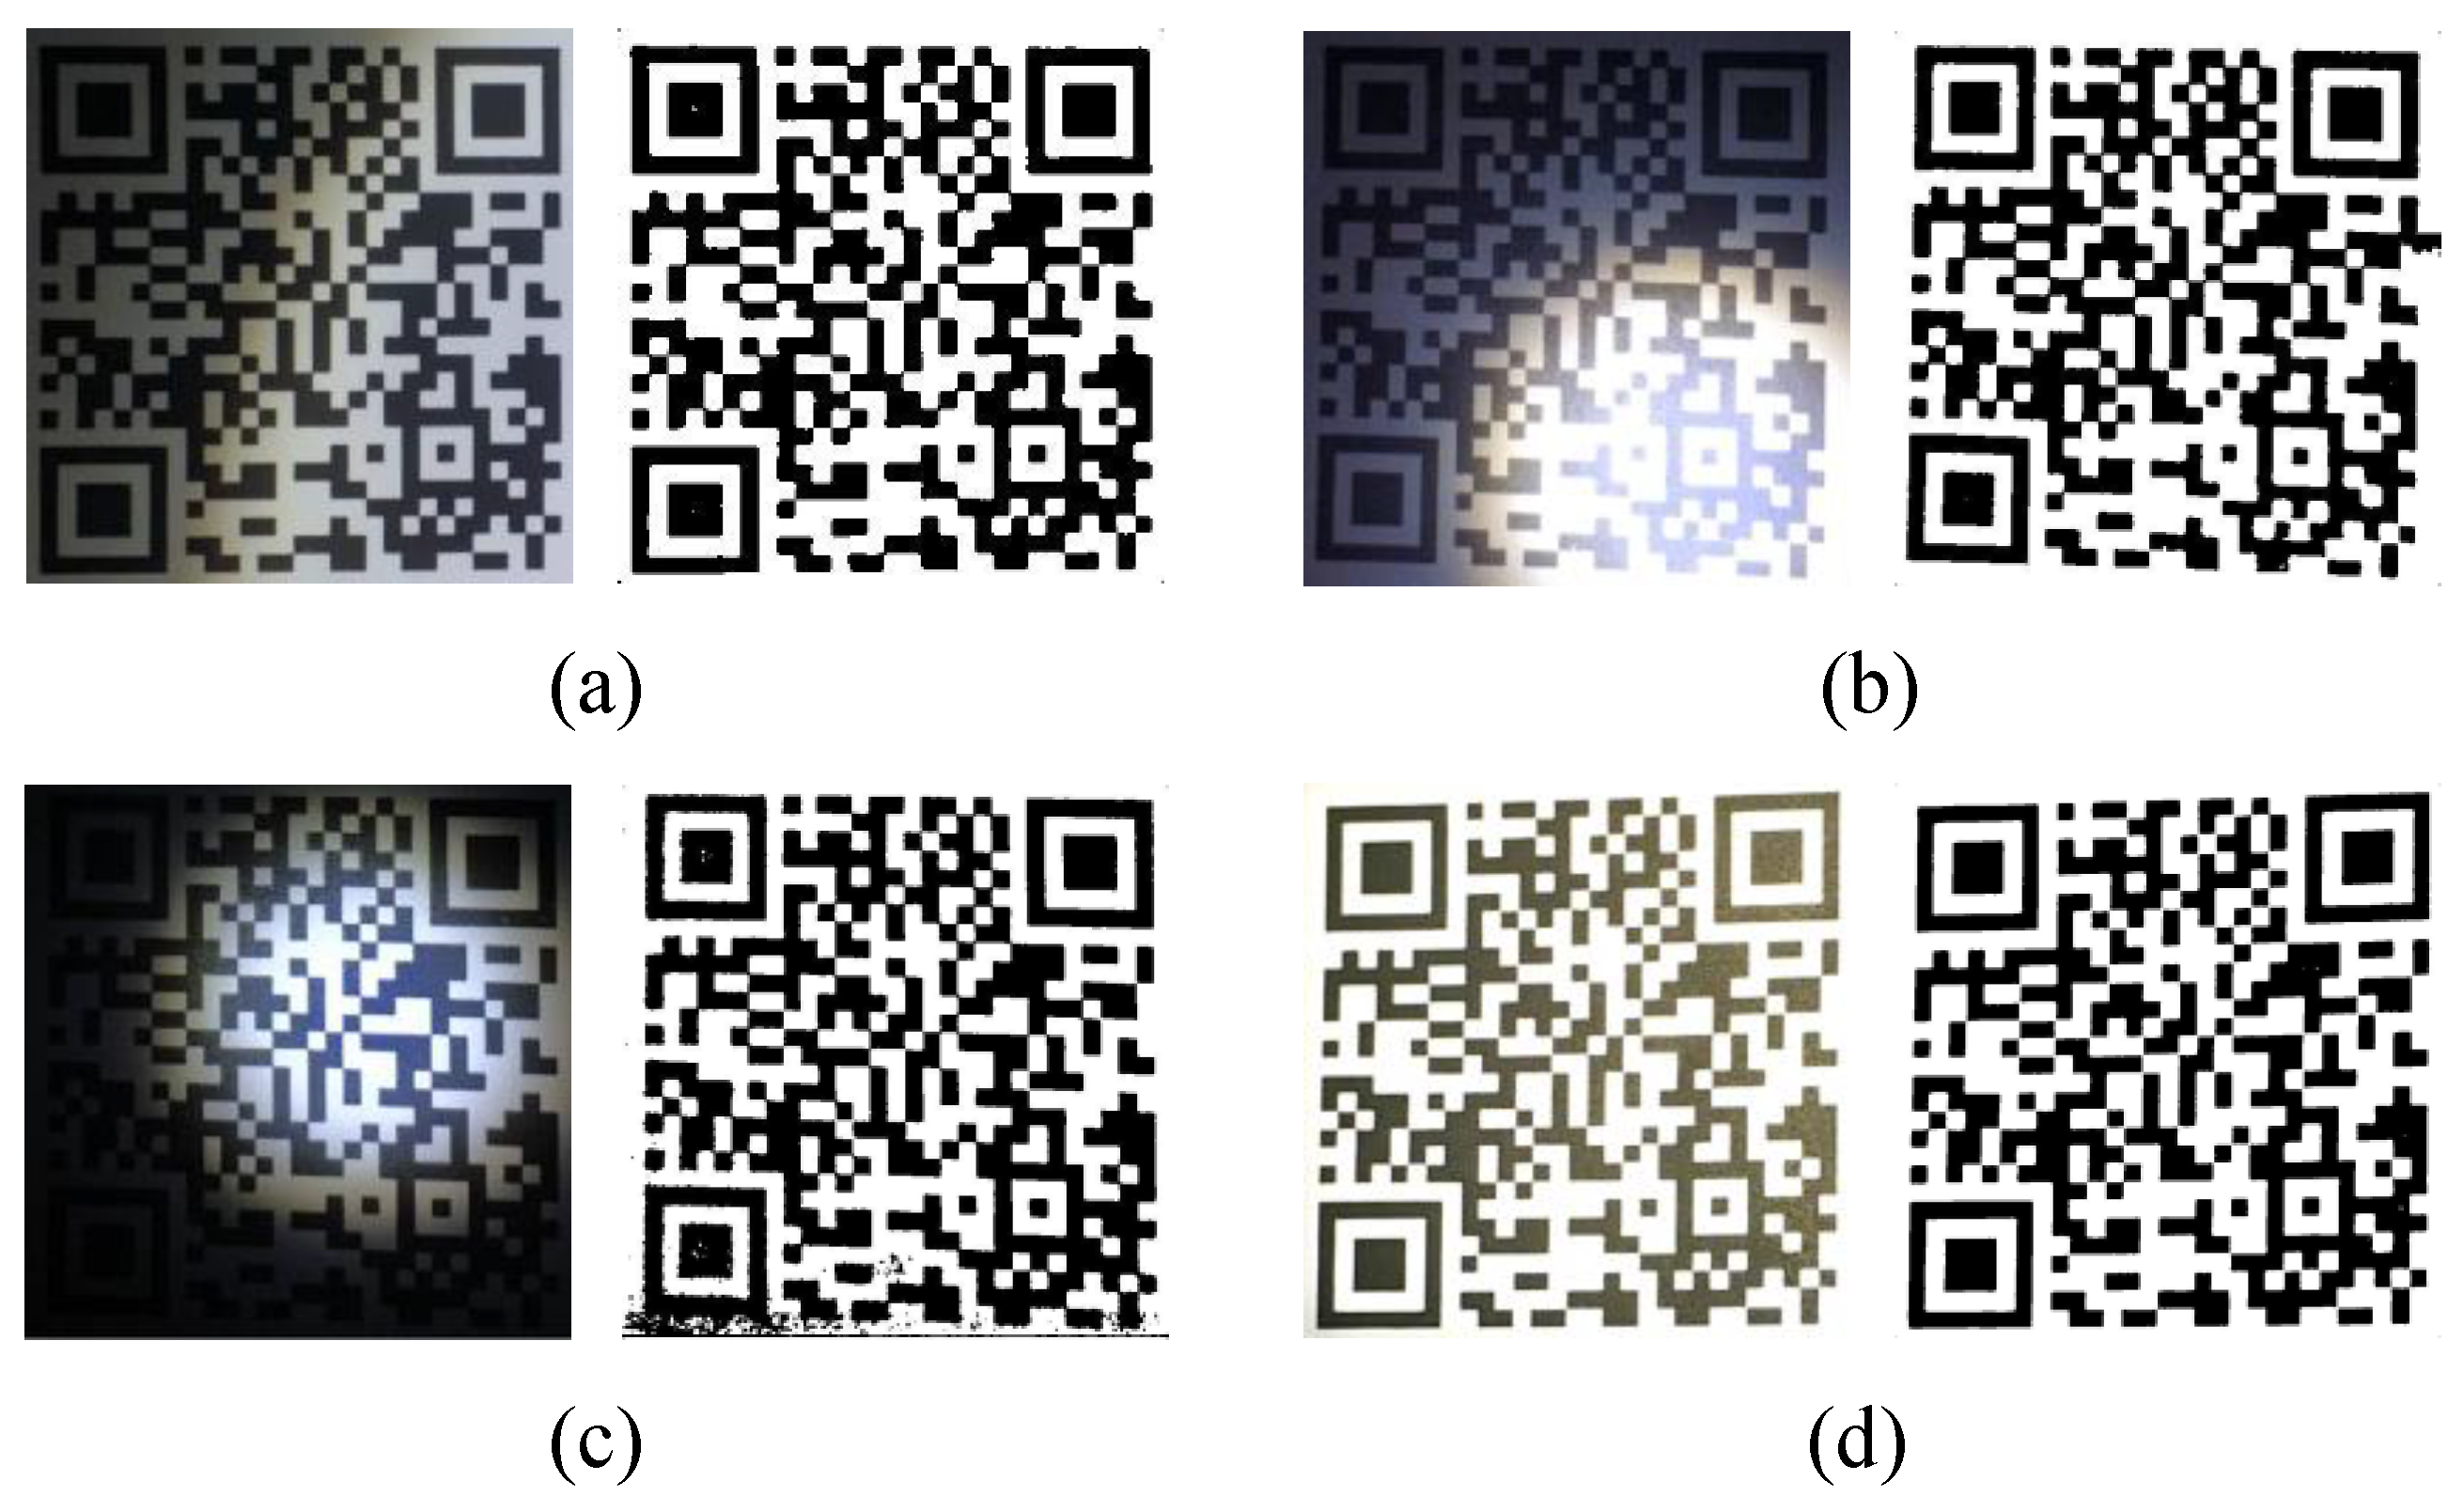
4.1. Image Quality
- (1)
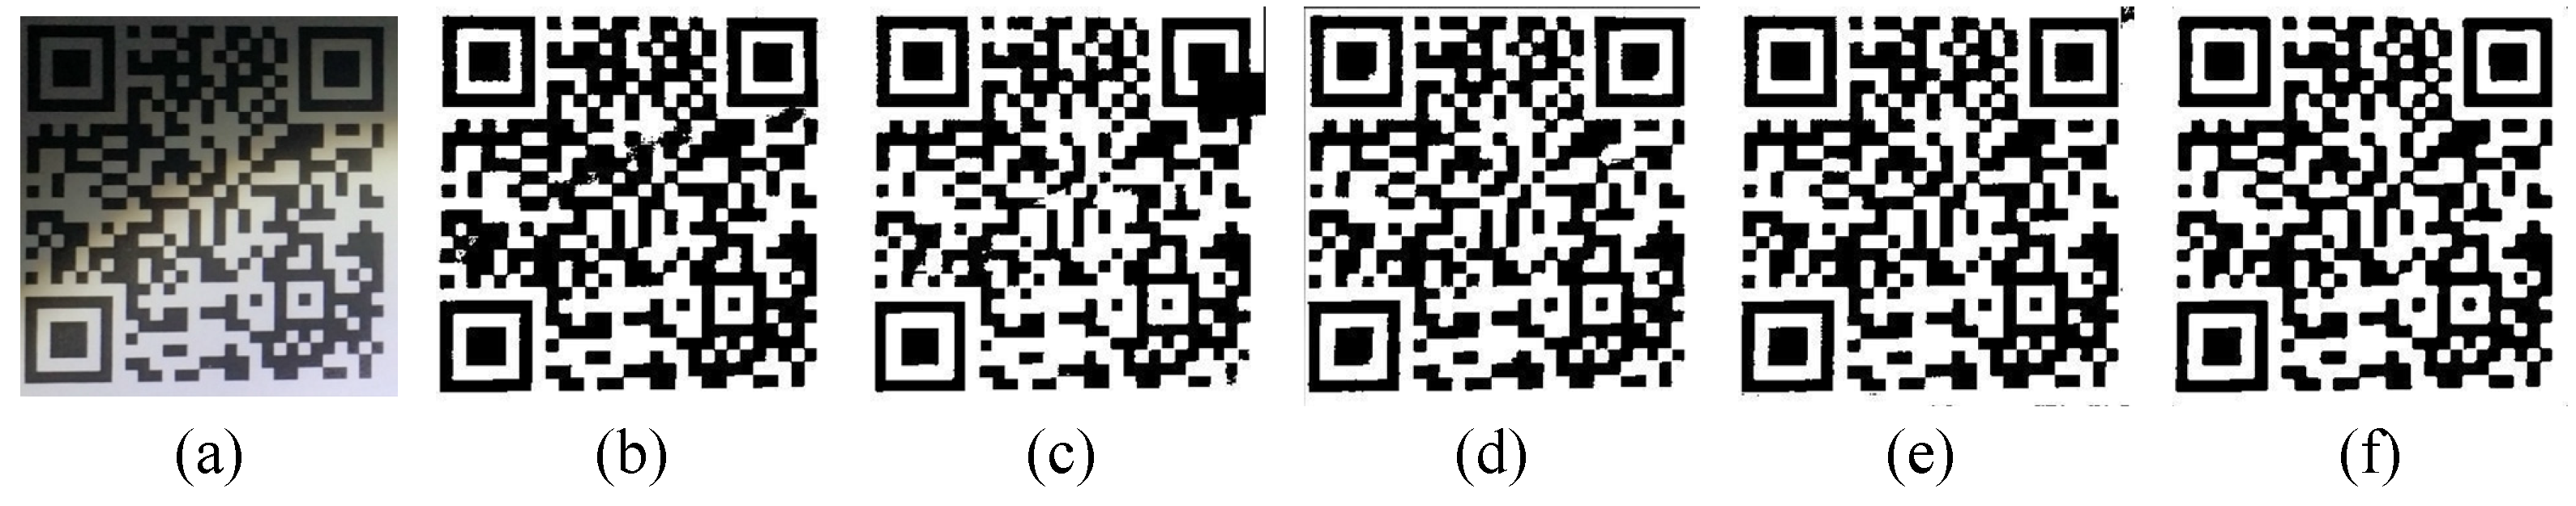
- Figure 14 shows the effect of different algorithms in processing the QR code, which had a soft light in the lower right corner. We can still see the most details through our eyes.
- (2)
- Figure 15 shows the effect of different algorithms in processing the QR code. Due to a beam of light passing through in a diagonal direction, the QR code had an increased uneven illumination phenomenon.
- (3)
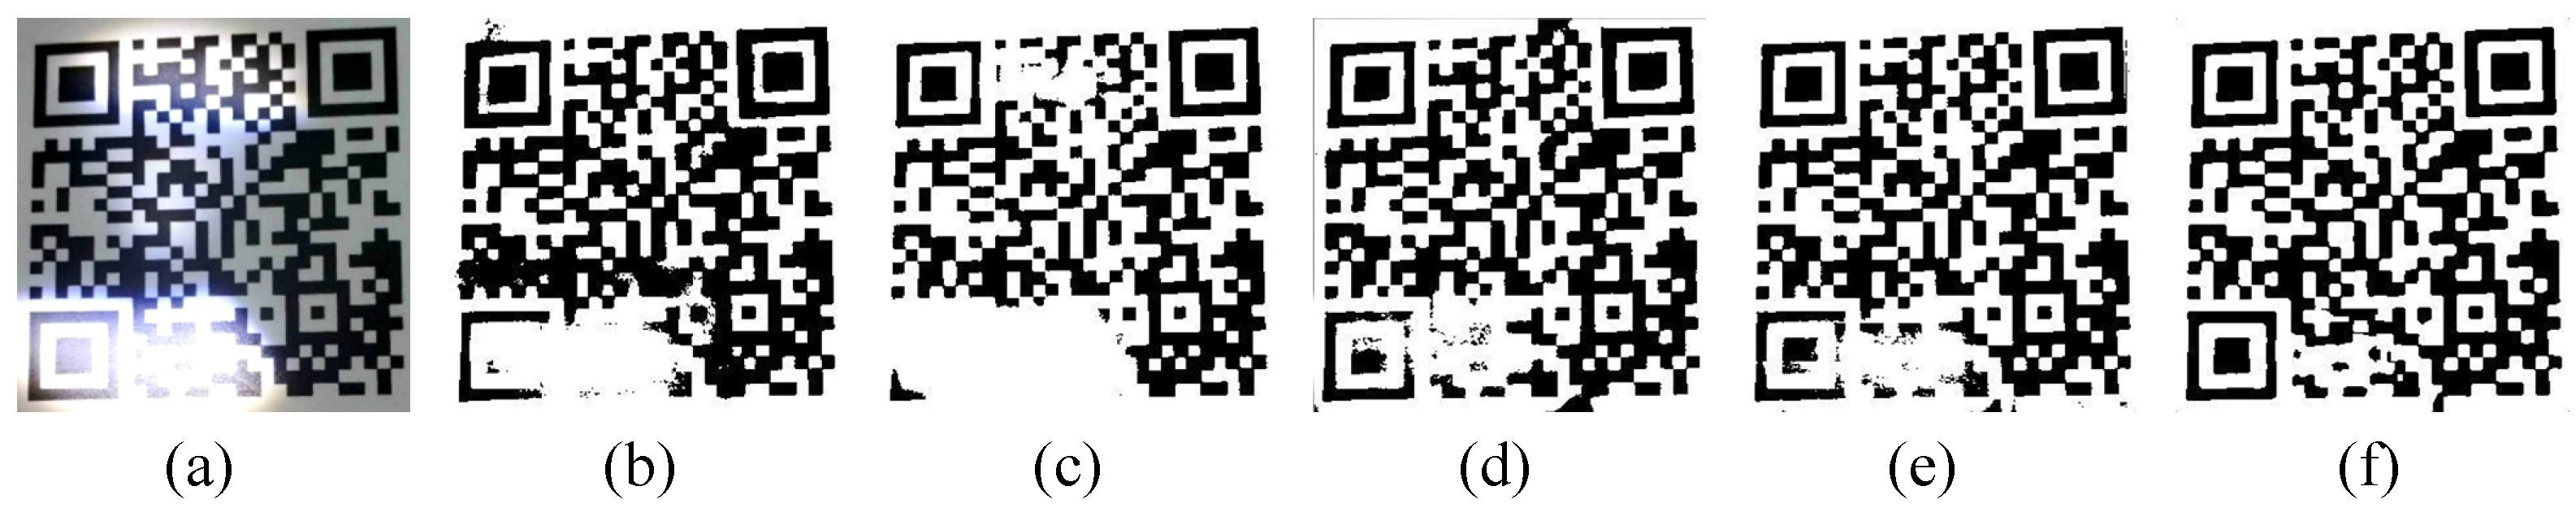
- Figure 16 shows the effect of different algorithms in processing the QR code. Two strong lights focused on the QR code made it have different illumination acquisition in different areas.
- (4)
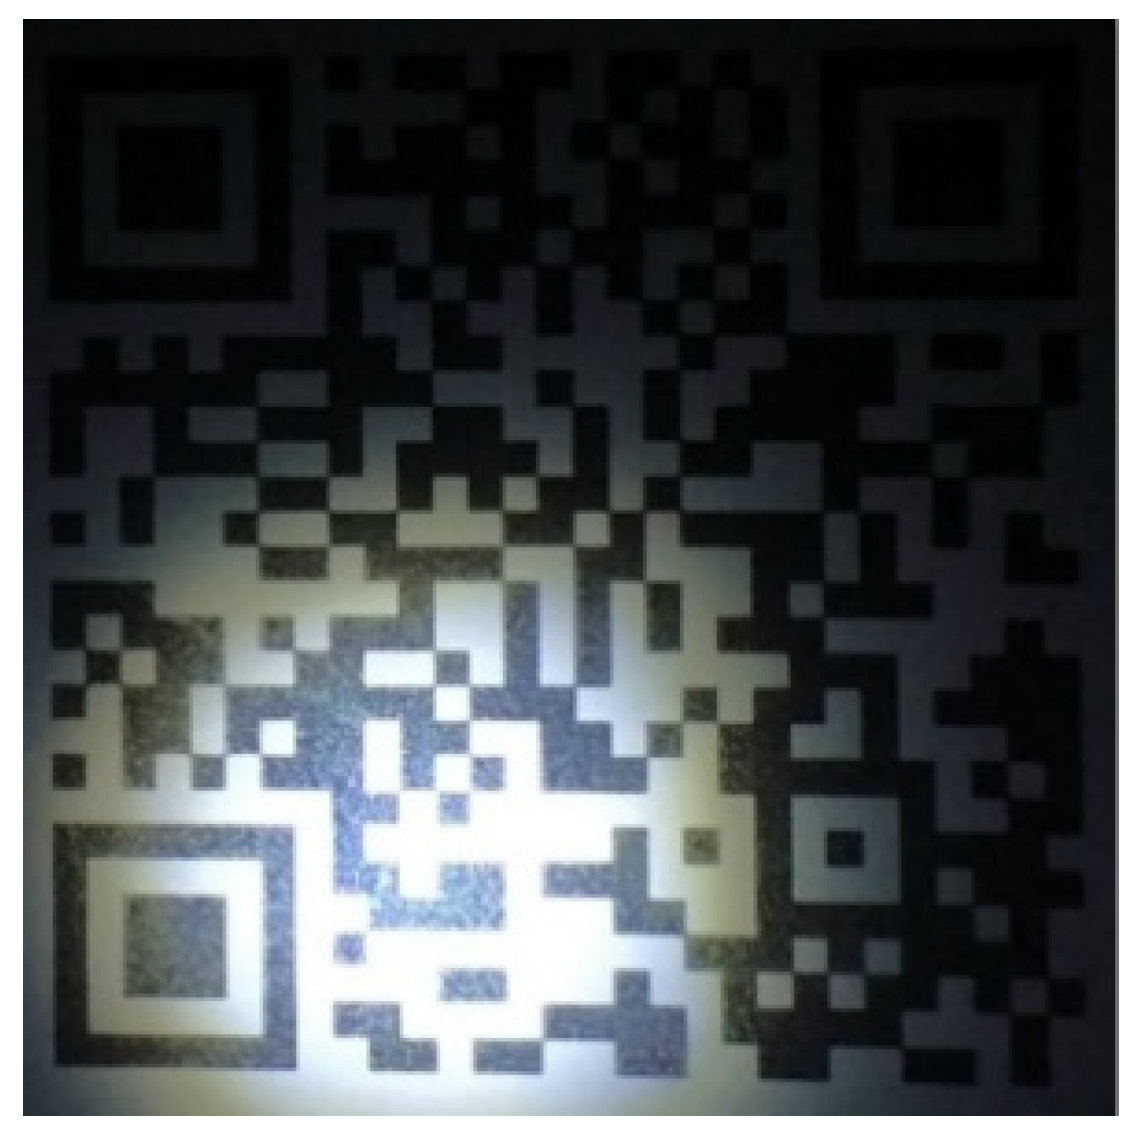
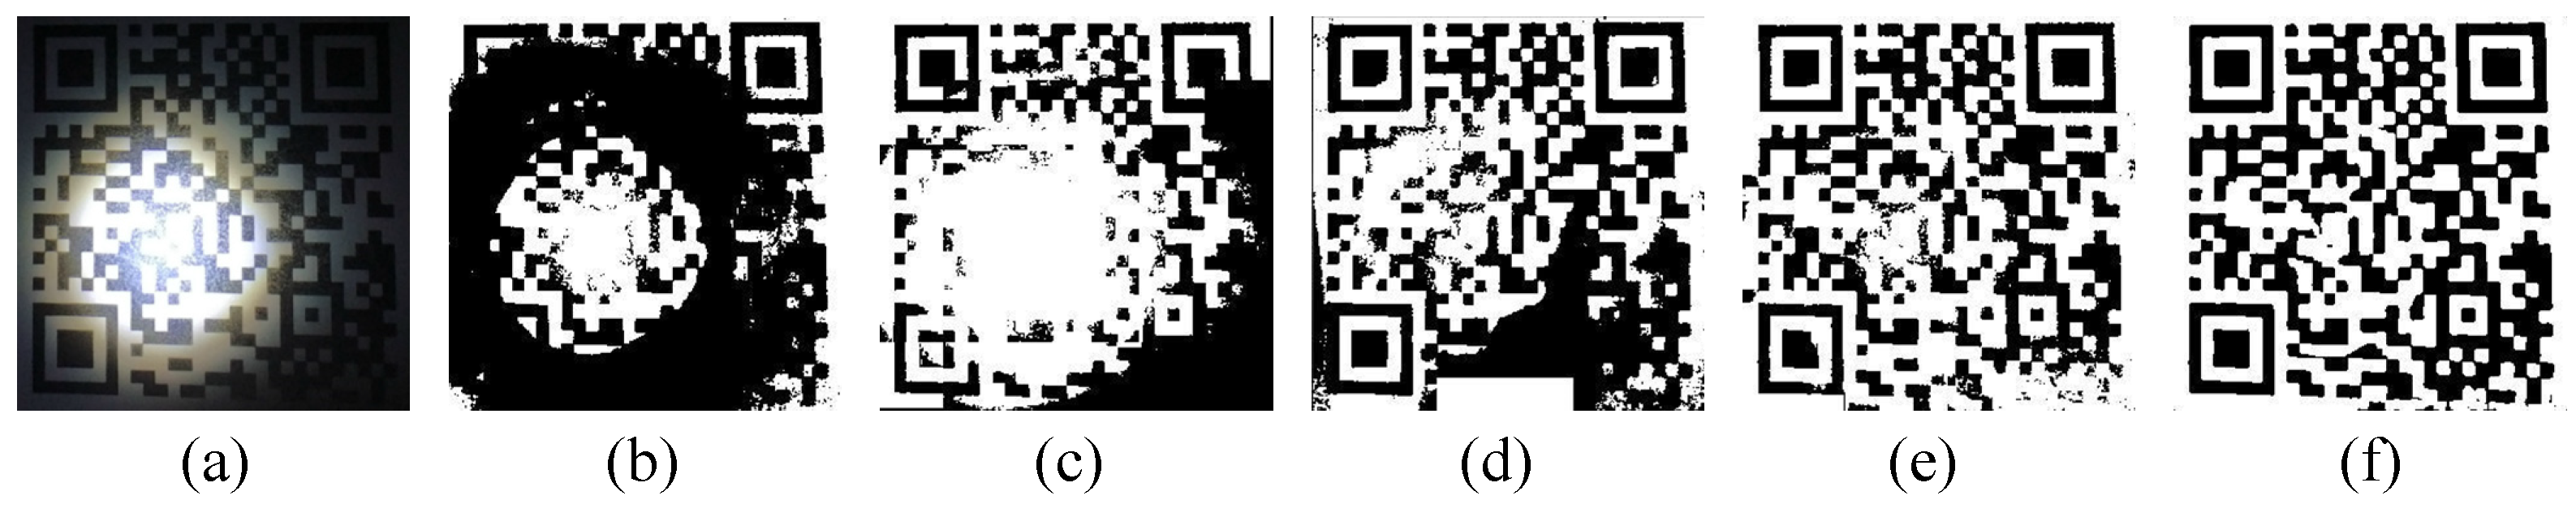
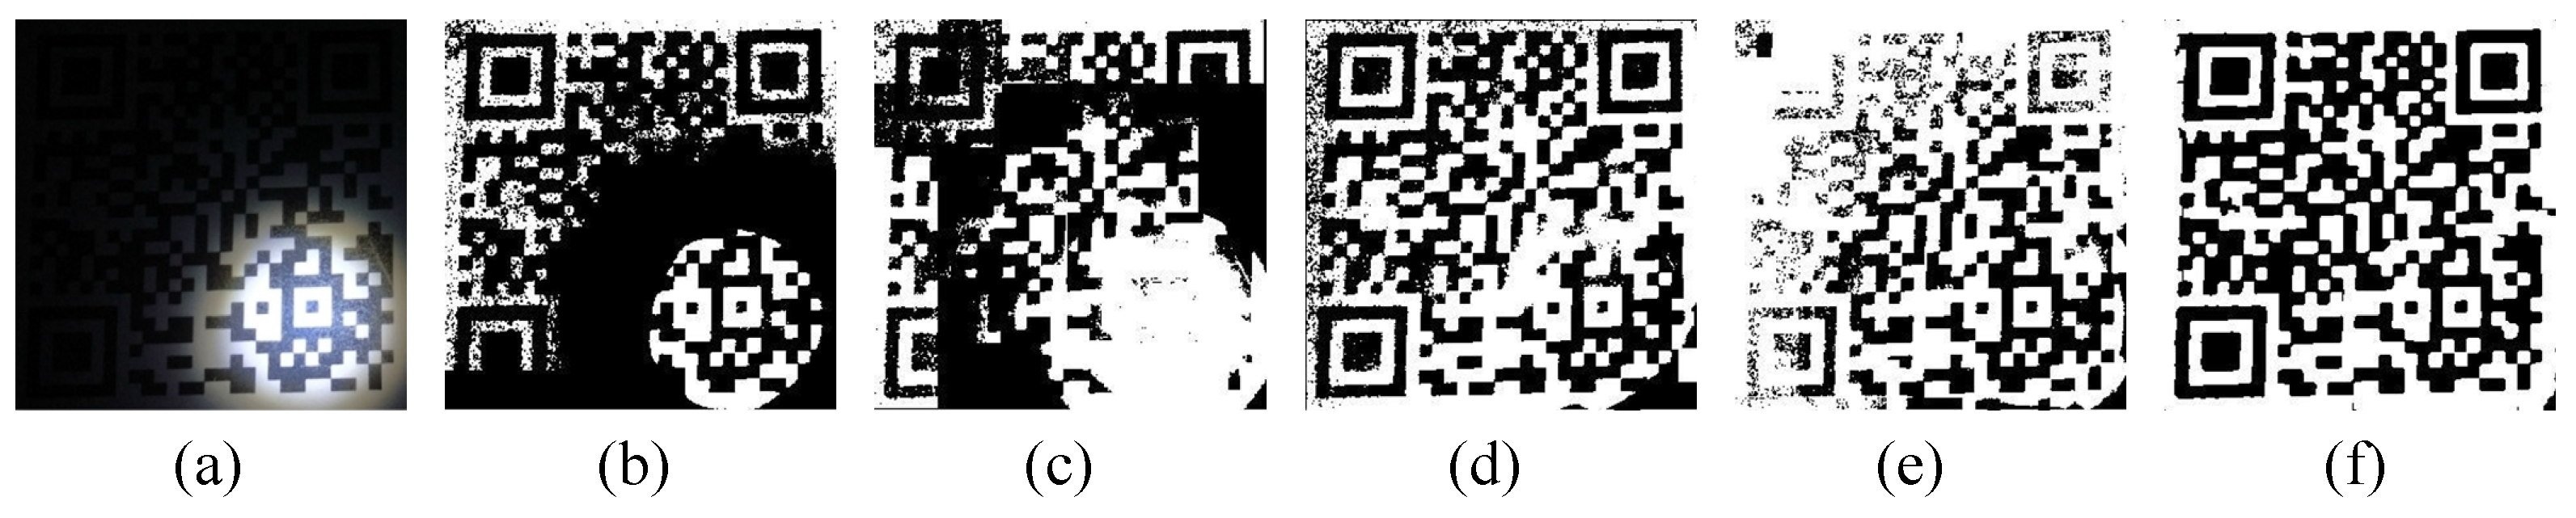
- Figure 17 shows the effect of different algorithms in processing the QR code. What caused the uneven illumination phenomenon was that a local highlight stayed in the middle part of the QR code. In this case, we can hardly see the modules in the image.
- (5)
- Figure 18 shows the effect of different algorithms in processing the QR code. The original image was shot under the environment where a glare gathered in the lower right corner of the image. As a result, it is hard to recognize the position detection patterns with our eyes.
4.2. Recognition Rate and Processing Speed
5. Conclusions
Author Contributions
Funding
Institutional Review Board Statement
Informed Consent Statement
Data Availability Statement
Acknowledgments
Conflicts of Interest
References
- Centenaro, M.; Costa, C.E.; Granelli, F.; Sacchi, C.; Vangelista, L. A Survey on Technologies, Standards and Open Challenges in Satellite Iot. IEEE Commun. Surv. Tutor. 2021, 23, 1693–1720. [Google Scholar] [CrossRef]
- Laghari, A.A.; Wu, K.; Laghari, R.A.; Ali, M.; Khan, A.A. A Review and State of Art of Internet of Things (IoT). Arch. Comput. Methods Eng. 2022, 29, 1395–1413. [Google Scholar] [CrossRef]
- Kumar, D.; Singh, R.K.; Mishra, R.; Wamba, S.F. Applications of the Internet of Things for Optimizing Warehousing and Logistics Operations: A Systematic Literature Review and Future Research Directions. Comput. Ind. Eng. 2022, 171, 108455. [Google Scholar] [CrossRef]
- Su, J.-P.; Wang, C.-A.; Mo, Y.-C.; Zeng, Y.-X.; Chang, W.-J.; Chen, L.-B.; Lee, D.-H.; Chuang, C.-H. I-Logistics: An Intelligent Logistics System Based on Internet of Things. In Proceedings of the 2017 International Conference on Applied System Innovation (ICASI), Sapporo, Japan, 13–17 May 2017; IEEE: Piscataway, NJ, USA, 2017; pp. 331–334. [Google Scholar]
- Wellner, P.D. Adaptive Thresholding for the DigitalDesk. Xerox 2021, EPC-1993-110, 1–19. [Google Scholar]
- Sauvola, J.; Pietikainen, M. Adaptive Document Image Binarization. Pattern Recognit. 2000, 33, 225–236. [Google Scholar] [CrossRef] [Green Version]
- Zhang, W.; Yang, T. An Improved Algorithm for QR Code Image Binarization. In Proceedings of the 2014 International Conference on Virtual Reality and Visualization, Shenyang, China, 30–31 August 2014; IEEE: Piscataway, NJ, USA, 2014; pp. 154–159. [Google Scholar]
- Di, Y.-J.; Shi, J.-P.; Mao, G.-Y. A QR Code Identification Technology in Package Auto-Sorting System. Mod. Phys. Lett. B 2017, 31, 1740035. [Google Scholar] [CrossRef] [Green Version]
- Yang, L.; Feng, Q. The Improvement of Bernsen Binarization Algorithm for QR Code Image. In Proceedings of the 2018 5th IEEE International Conference on Cloud Computing and Intelligence Systems (CCIS), Nanjing, China, 23–25 November 2018; IEEE: Piscataway, NJ, USA, 2018; pp. 931–934. [Google Scholar]
- Bernsen, J. Dynamic thresholding of gray-level images. In Proceedings of the Eighth International Conference on Pattern Recognition, Paris, France, 28-31 October 1986. [Google Scholar]
- Otsu, N. A Threshold Selection Method from Gray-Level Histograms. IEEE Trans. Syst. Man Cybern. 1979, 9, 62–66. [Google Scholar] [CrossRef] [Green Version]
- Wu, Y.; Yu, S.; Yang, M. Quick Response Code Binary Research Based on Basic Image Processing. Sens. Mater. 2019, 31, 859–871. [Google Scholar] [CrossRef]
- Chen, R.; Yu, Y.; Xu, X.; Wang, L.; Zhao, H.; Tan, H.-Z. Adaptive Binarization of QR Code Images for Fast Automatic Sorting in Warehouse Systems. Sensors 2019, 19, 5466. [Google Scholar] [CrossRef] [PubMed] [Green Version]
- Ren, J.; Sun, H.; Zhao, H.; Gao, H.; Maclellan, C.; Zhao, S.; Luo, X. Effective Extraction of Ventricles and Myocardium Objects from Cardiac Magnetic Resonance Images with a Multi-Task Learning U-Net. Pattern Recognit. Lett. 2022, 155, 165–170. [Google Scholar] [CrossRef]
- Sun, G.; Fu, H.; Ren, J.; Zhang, A.; Zabalza, J.; Jia, X.; Zhao, H. SpaSSA: Superpixelwise Adaptive SSA for Unsupervised Spatial-Spectral Feature Extraction in Hyperspectral Image. IEEE Trans. Cybern. 2021, 7, 6158–6169. [Google Scholar] [CrossRef] [PubMed]
- Zhou, J.; Liu, Y.; Li, P. Research on Binarization of QR Code Image. In Proceedings of the 2010 International Conference on Multimedia Technology, Ningbo, China, 29–31 October 2010; IEEE: Piscataway, NJ, USA, 2010; pp. 1–4. [Google Scholar]
- Zhang, Y.; Gao, T.; Li, D.; Lin, H. An Improved Binarization Algorithm of QR Code Image. In Proceedings of the 2012 2nd International Conference on Consumer Electronics, Communications and Networks (CECNet), Yichang, China, 21–23 April 2012; IEEE: Piscataway, NJ, USA, 2012; pp. 2376–2379. [Google Scholar]
- Yao, S.; Li, P.; He, L.; Li, Y. Uneven Illumination Two-Dimensional Code Image Recognition Algorithm Research. In Proceedings of the 2018 2nd IEEE Advanced Information Management, Communicates, Electronic and Automation Control Conference (IMCEC), Xi’an, China, 25–27 May 2018; IEEE: Piscataway, NJ, USA, 2018; pp. 2043–2046. [Google Scholar]
- Mukhopadhyay, S.; Chanda, B. A Multiscale Morphological Approach to Local Contrast Enhancement. Signal Process. 2000, 80, 685–696. [Google Scholar] [CrossRef] [Green Version]
- Gonzalez, R.C.; Woods, R.E. Digital Image Processing; Pearson Education India: Delhi, India, 2009; ISBN 81-317-2695-9. [Google Scholar]
- Bradley, D.; Roth, G. Adaptive Thresholding Using the Integral Image. J. Graph. Tools 2007, 12, 13–21. [Google Scholar] [CrossRef]
- Wang, Z.; Bovik, A.C.; Sheikh, H.R.; Simoncelli, E.P. Image Quality Assessment: From Error Visibility to Structural Similarity. IEEE Trans. Image Process. 2004, 13, 600–612. [Google Scholar] [CrossRef] [PubMed]


| Algorithm | Average Time Consuming/s |
|---|---|
| Sauvola’s | 4.2544 |
| Savuola’s combined with integral image | 0.0157 |
| Hardware | Parameters |
|---|---|
| Processor | Intel(R) Core(TM) i7-6700HQ CPU @ 2.60 GHz (8 CPUs) |
| Memory | 16 GB SAMSUNG DDR4 2133 MHz |
| Smart Phone | OnePlus 3 64 GB |
| Software | Versions |
|---|---|
| Operating System | Windows 10 Pro 64-bit (10.0, Build 18362) |
| MATLAB | R2016a 64-bit |
| ZXing AndroidSDK | 3.4.0 |
| 7.0.10 |
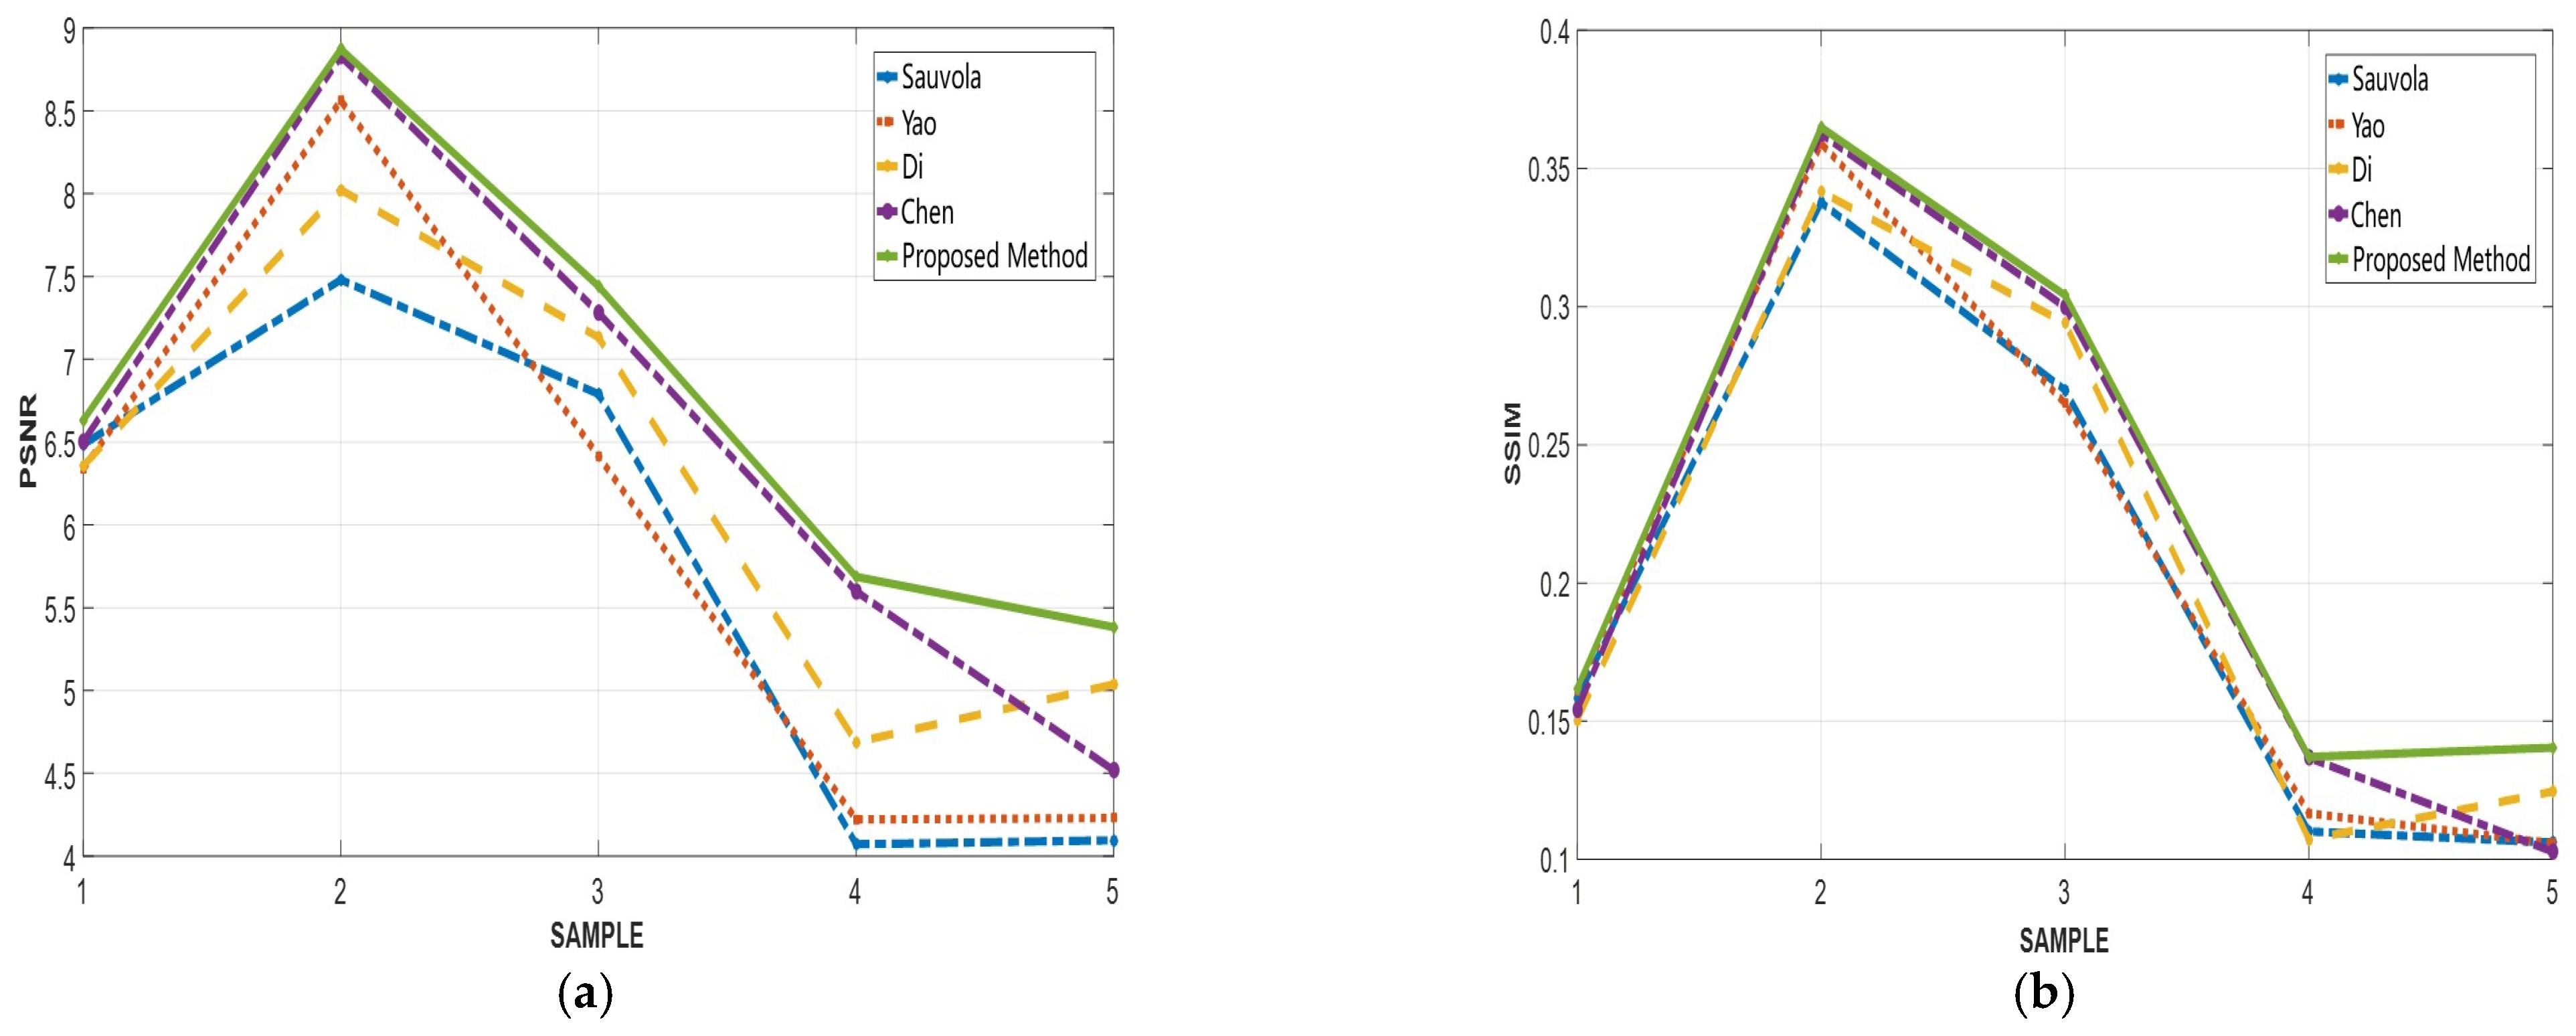
| Sample | Standard | Sauvola | Yao | Di | Chen | Proposed Method |
|---|---|---|---|---|---|---|
| (1) | PSNR | 6.4850 | 6.3371 | 6.3560 | 6.5013 | 6.6319 |
| SSIM | 0.1583 | 0.1611 | 0.1505 | 0.1540 | 0.1619 | |
| (2) | PSNR | 7.4802 | 8.5616 | 8.0232 | 8.8290 | 8.8727 |
| SSIM | 0.3377 | 0.3590 | 0.3415 | 0.3625 | 0.3649 | |
| (3) | PSNR | 6.7898 | 6.4156 | 7.1323 | 7.2810 | 7.4410 |
| SSIM | 0.2698 | 0.2650 | 0.2941 | 0.2999 | 0.3042 | |
| (4) | PSNR | 4.0721 | 4.2207 | 4.6880 | 5.5986 | 5.6867 |
| SSIM | 0.1101 | 0.1167 | 0.1072 | 0.1368 | 0.1371 | |
| (5) | PSNR | 4.0956 | 4.2298 | 5.0369 | 4.5181 | 5.3828 |
| SSIM | 0.1061 | 0.1058 | 0.1245 | 0.1028 | 0.1404 |
Disclaimer/Publisher’s Note: The statements, opinions and data contained in all publications are solely those of the individual author(s) and contributor(s) and not of MDPI and/or the editor(s). MDPI and/or the editor(s) disclaim responsibility for any injury to people or property resulting from any ideas, methods, instructions or products referred to in the content. |
© 2023 by the authors. Licensee MDPI, Basel, Switzerland. This article is an open access article distributed under the terms and conditions of the Creative Commons Attribution (CC BY) license (https://creativecommons.org/licenses/by/4.0/).
Share and Cite
Chen, R.; Li, W.; Lan, K.; Xiao, J.; Wang, L.; Lu, X. Fast Adaptive Binarization of QR Code Images for Automatic Sorting in Logistics Systems. Electronics 2023, 12, 286. https://doi.org/10.3390/electronics12020286
Chen R, Li W, Lan K, Xiao J, Wang L, Lu X. Fast Adaptive Binarization of QR Code Images for Automatic Sorting in Logistics Systems. Electronics. 2023; 12(2):286. https://doi.org/10.3390/electronics12020286
Chicago/Turabian StyleChen, Rongjun, Weijie Li, Kailin Lan, Jinghui Xiao, Leijun Wang, and Xu Lu. 2023. "Fast Adaptive Binarization of QR Code Images for Automatic Sorting in Logistics Systems" Electronics 12, no. 2: 286. https://doi.org/10.3390/electronics12020286