Article

Multi-Objective Optimization for Solar-Hydrogen-Battery-Integrated Electric Vehicle Charging Stations with Energy Exchange

Department of Electronic and Electrical Engineering, Brunel University London, London UB8 3PH, UK
*
Author to whom correspondence should be addressed.
Electronics 2023, 12(19), 4149; https://doi.org/10.3390/electronics12194149
Submission received: 21 August 2023 / Revised: 21 September 2023 / Accepted: 2 October 2023 / Published: 5 October 2023

Abstract

:
The importance of electric vehicle charging stations (EVCS) is increasing as electric vehicles (EV) become more widely used. EVCS with multiple low-carbon energy sources can promote sustainable energy development. This paper presents an optimization methodology for direct energy exchange between multi-geographic dispersed EVCSs in London, UK. The charging stations (CSs) incorporate solar panels, hydrogen, battery energy storage systems, and grids to support their operations. EVs are used to allow the energy exchange of charging stations. The objective function of the solar-hydrogen-battery storage electric vehicle charging station (SHS-EVCS) includes the minimization of both capital and operation and maintenance (O&M) costs, as well as the reduction in greenhouse gas emissions. The system constraints encompass the power output limits of individual components and the need to maintain a power balance between the SHS-EVCSs and the EV charging demand. To evaluate and compare the proposed SHS-EVCSs, two multi-objective optimization algorithms, namely the Non-dominated Sorting Genetic Algorithm (NSGA-II) and the Multi-objective Evolutionary Algorithm Based on Decomposition (MOEA/D), are employed. The findings indicate that NSGA-II outperforms MOEA/D in terms of achieving higher-quality solutions. During the optimization process, various factors are considered, including the sizing of solar panels and hydrogen storage tanks, the capacity of electric vehicle chargers, and the volume of energy exchanged between the two stations. The application of the optimized SHS-EVCSs results in substantial cost savings, thereby emphasizing the practical benefits of the proposed approach.

1. Introduction

Since the beginning of the 21st century, there has been an increasing recognition of the imperative to solve greenhouse gas emissions and environmental pollution stemming from the heavy reliance on fossil fuels [1]. Consequently, renewable energy sources have gained significant prominence and are now widely acknowledged as primary energy alternatives in numerous countries worldwide. It is noteworthy that the electricity generation and transportation sectors are major contributors to carbon dioxide emissions, accounting for approximately 64% of the total emissions [1]. This has sparked considerable public concern regarding the irreversible environmental consequences associated with such emissions. As emphasized in [2], the integration of renewable energies is indispensable for achieving the necessary reduction targets in carbon dioxide (CO2) emissions in the domains of electricity generation and transportation. Electric vehicles (EVs) have emerged as one of the viable solutions for curbing CO2 emissions. Extensive reviews of existing studies on EVs [3,4] have revealed that the adoption of these vehicles delivers evident societal benefits in terms of environmental impact, as well as economic advantages for EV purchasers through reduced operational expenses. However, the development of EV charging infrastructure has remained a significant hurdle in stimulating higher rates of EV adoption. Ref. [5] highlights that the growth of charging stations (CSs) for EVs has been relatively sluggish, thereby impacting the willingness of potential users to purchase EVs. Correspondingly, Ref. [6] attributes the slow progress of EV charging infrastructure to the substantial investment costs faced by infrastructure developers, compounded with the uncertainties surrounding EV demand.
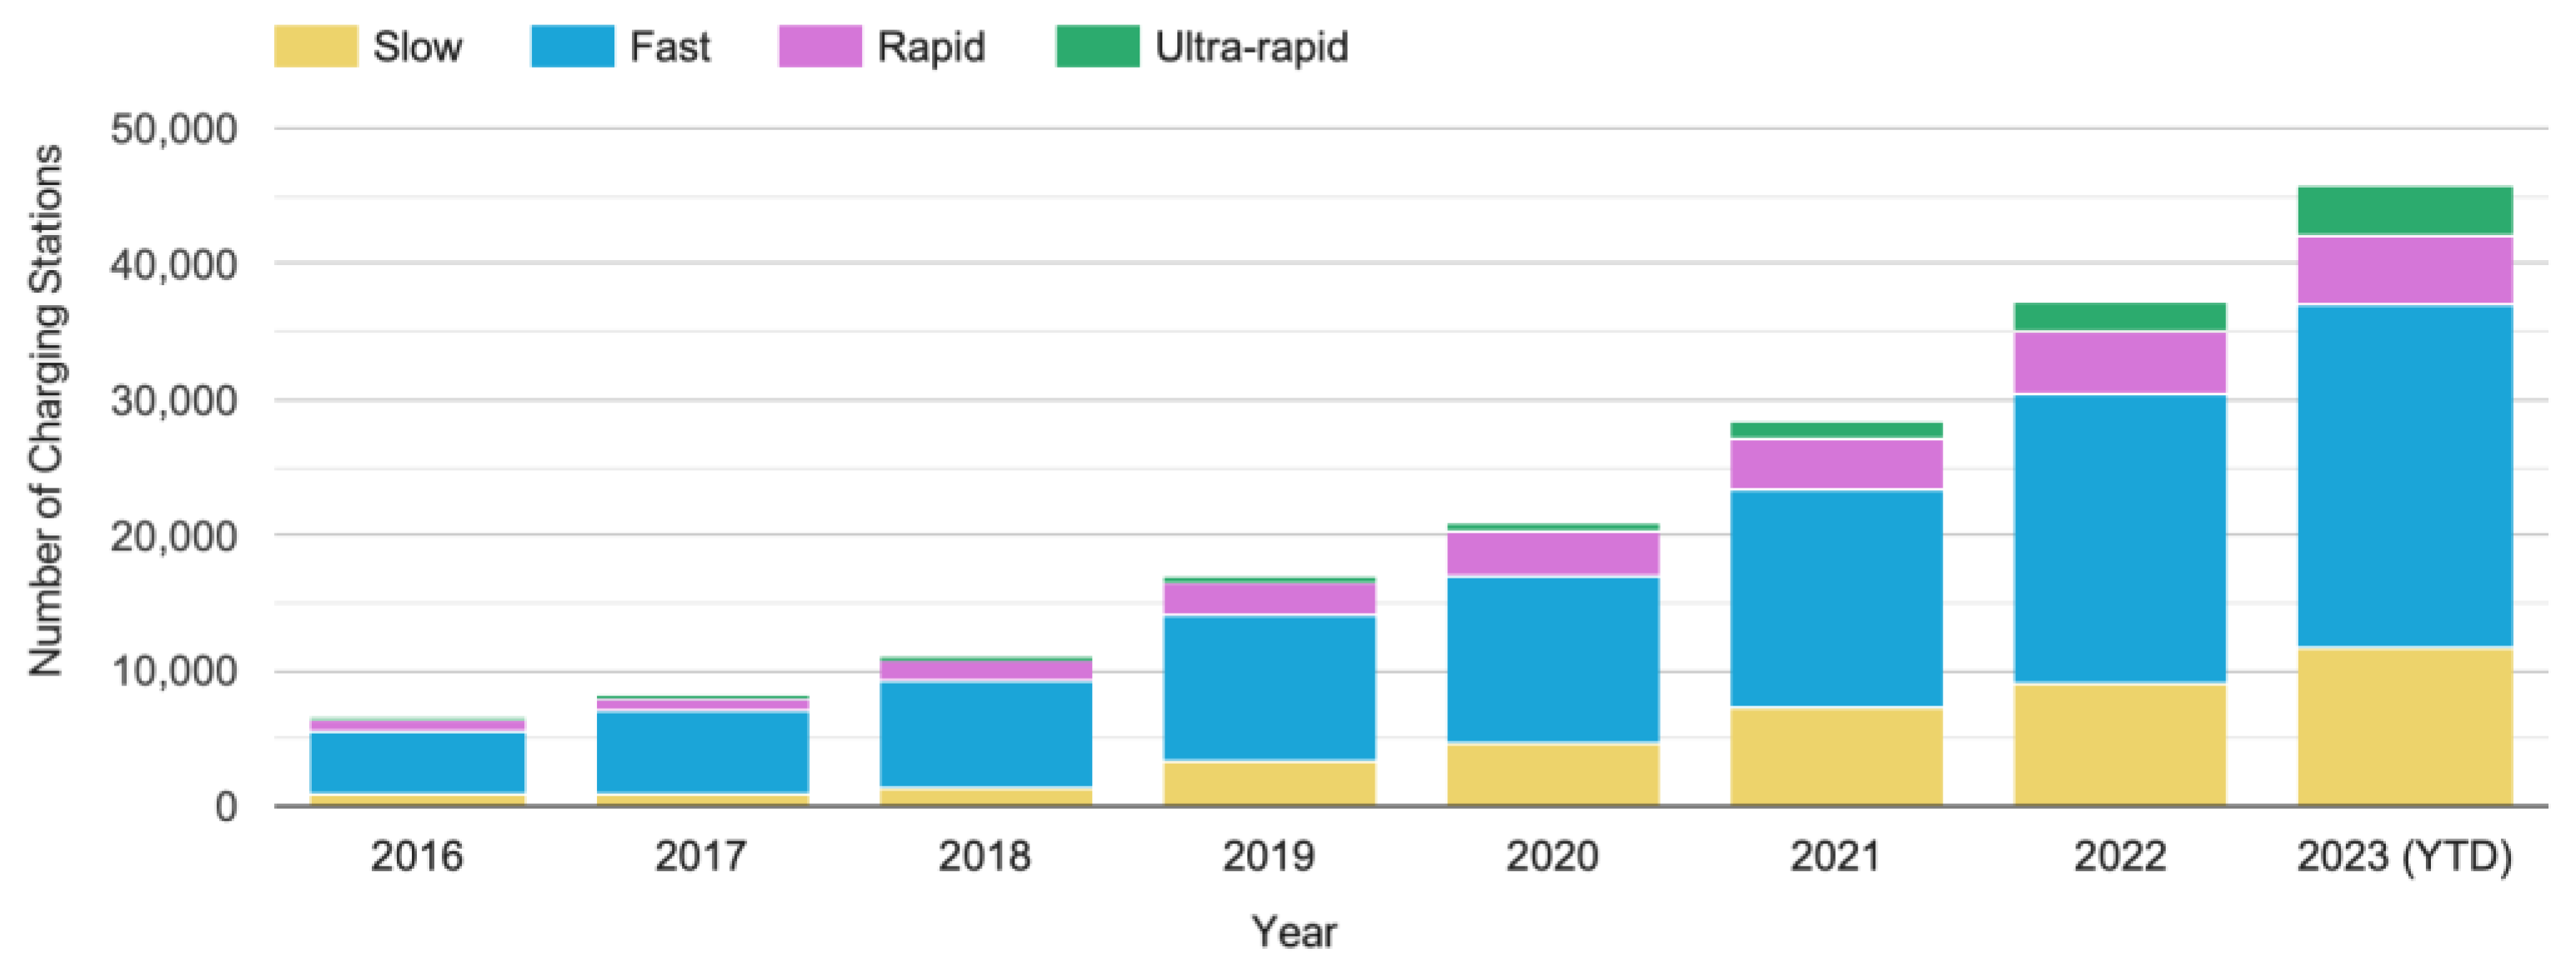
 Figure 1 and Table 1 show the evolution of these four categories of charging stations (slow, fast, rapid and ultra-rapid) throughout the years. In the case of London, projections indicate a need for over 500,000 charging points in the city and its environs by 2040, with nearly 50,000 charging points required in public locations [7].
The previous research identifies that in most residential CSs, slow charging ports are mainly used [4]. Previously, government agencies have been the main developers of charging infrastructure. However, recent times have been marked by increased development of infrastructure by commercial developers. For example, Tesla has over 14,000 superchargers in 36 countries; EV go has over 750 chargers across 34 countries, while a firm such as Charge Hub in Canada has over 7906 CSs [4,9]. In the UK, attribute growth in a number of CSs has led to an elaborate strategy by the UK government to improve charging infrastructure [10]. As part of this strategy, the government has put in place national legislation to enhance the quantity, spread, and reach of alternative fuel infrastructure. In addition, the government has been involved in provision of grants for EV charging infrastructure including schemes for installation of such infrastructure at workplaces and homes. While fast CSs can help solve the problem of time used in recharging batteries relative to normal gasoline refuelling, research indicates such stations will take considerable time before being deployed in standard residential settings [11]. This has been attributed to the special equipment required to develop DC fast-charging infrastructure.
Furthermore, it has been indicated that electric vehicle charging stations (EVCSs) during high-usage times have the potential to lead to a low voltage profile [12]. In detail, EVCSs are likely to affect voltage stability due to sudden increases in loads often within a short duration. This makes the grid unstable and thus necessitates effective scheduling of EV charging. Lastly, an increase in EVCSs negatively affects transformer performance. Precisely, [13] indicates that the mass development of EVs creates additional stress on the distribution transformers. Consequently, the transformers could have their life cycle shortened. This literature suggested that considerable measures must be investigated for the planning and operation of EVCSs to ensure the power quality of the existing grid will not be negatively affected.
Turning to direct energy exchange, also known as point-to-point power transmission, can offer several advantages over energy exchange through a distribution network. There are two direct energy exchange methods, one is through the electricity wire from point to point, while the other one is using EVs, which is also known as a Vehicular Energy Network, to transfer the energy [14]. For the first method, direct energy exchange typically involves high-voltage transmission lines, which have lower resistive losses compared to distribution networks [15,16]. This means that more power can be transmitted over longer distances with minimal losses. In contrast, distribution networks have numerous intermediate transformers and distribution lines that introduce additional losses [15,17]. For the second method, direct energy exchange using EVs allows for more flexibility in terms of routing. It enables the transmission of electricity from a specific source to a specific destination without relying on intermediate distribution systems [14]. This flexibility can be crucial for large-scale power transactions, where buyers and sellers may be geographically distant from each other. Energy exchange through a distribution network is subject to the vulnerabilities of that network, including potential faults, outages, and capacity limitations [14,15,18,19]. While establishing a direct energy exchange infrastructure requires upfront investment, it can be more cost-effective in the long run. By reducing transmission losses and improving efficiency, direct energy exchange can result in overall cost savings compared to reliance on distribution networks, which may require ongoing maintenance, upgrades, and losses associated with their operation [15]. In this paper, the EVs’ method will be considered as the only way for direct energy exchange.
It is essential to recognize that both direct energy exchange and energy exchange through distribution networks offer unique advantages and can be employed in various situations. The choice of the most suitable approach relies on several factors, such as geographical constraints, the scale of energy exchange, existing infrastructure, and the specific requirements of the power system. These considerations play a pivotal role in the decision-making process when aiming to establish an efficient and dependable power transmission method. However, for the purpose of this research, which is the multi-objective functions, direct energy exchange was selected.
Table 2 shows the current discourse pertaining to EVCSs predominantly centred around various dimensions, such as their charging status, application, and development prospects. However, there exists a limited focus on the exploration of charging station facilities that integrate multiple energy sources, such as solar-hydrogen storage systems. Present investigations primarily revolve around microgrid technology, which synergistically integrates renewable energy sources, energy storage systems, and EV charging by means of internet-based system scheduling. The principal objectives of these studies primarily revolve around enhancing charging methodologies for individual EVs, efficiently allocating capacity among different components within the CS, and optimizing control systems. The primary emphasis is placed on enhancing the economic aspects of system operation. Research endeavours predominantly concentrate on augmenting the utilization rate of renewable energy sources, particularly photovoltaics, and devising charging modes for EVs based on the charging system dispatching within individual charging stations. In the specific context of constructing a CS, a comprehensive analysis of EV charging demands becomes imperative. While fulfilling these demands, it becomes crucial to meticulously plan the energy flow inside the EVCSs, taking into consideration the operational status of the charging station’s components, as well as the associated capital and operation and maintenance (O&M) costs. Moreover, there is a noticeable paucity of studies exploring energy scheduling strategies and optimal scheduling mechanisms encompassing charging stations in their entirety.
Drawing upon the extant literature, this paper delves into a specific inquiry encompassing the following focal points and makes the following contributions:
  • The establishment of an intricate model pertaining to EVCSs forms the crux of this study. A comparative assessment of simulation optimization techniques is conducted, involving the rigorous evaluation and juxtaposition of two distinct algorithms, which are the Non-dominated Sorting Genetic Algorithm and the Multi-objective Evolutionary Algorithm Based on Decomposition. Through examination, the optimal outcome is identified and selected based on predetermined criteria and performance metrics.
  • Moreover, the investigation incorporates a notable consideration, namely the direct exchange of electric energy between EVCSs without energy exchange through the distribution network. By scrutinizing the intricacies and implications associated with direct energy exchange, the study aims to shed light on the viability, benefits, and challenges of this novel paradigm.
  • An additional crucial facet of the optimization objective revolves around minimizing not only the capital and O&M costs, but also greenhouse gas emission costs. By integrating environmental sustainability as a pivotal criterion, the research endeavours to explore the intricate nexus between economic efficiency and environmental impact. The holistic optimization approach aims to strike an optimal balance between minimizing costs and mitigating the ecological footprint associated with greenhouse gas emissions.
In summary, this paper takes an academically rigorous stance by synthesizing the existing body of literature and undertaking a focused investigation. It entails the establishment of an intricate model for electric vehicle charging stations, comparative analysis of simulation optimization algorithms, exploration of the direct exchange of electric energy, and inclusion of greenhouse gas emission costs in the optimization objective.

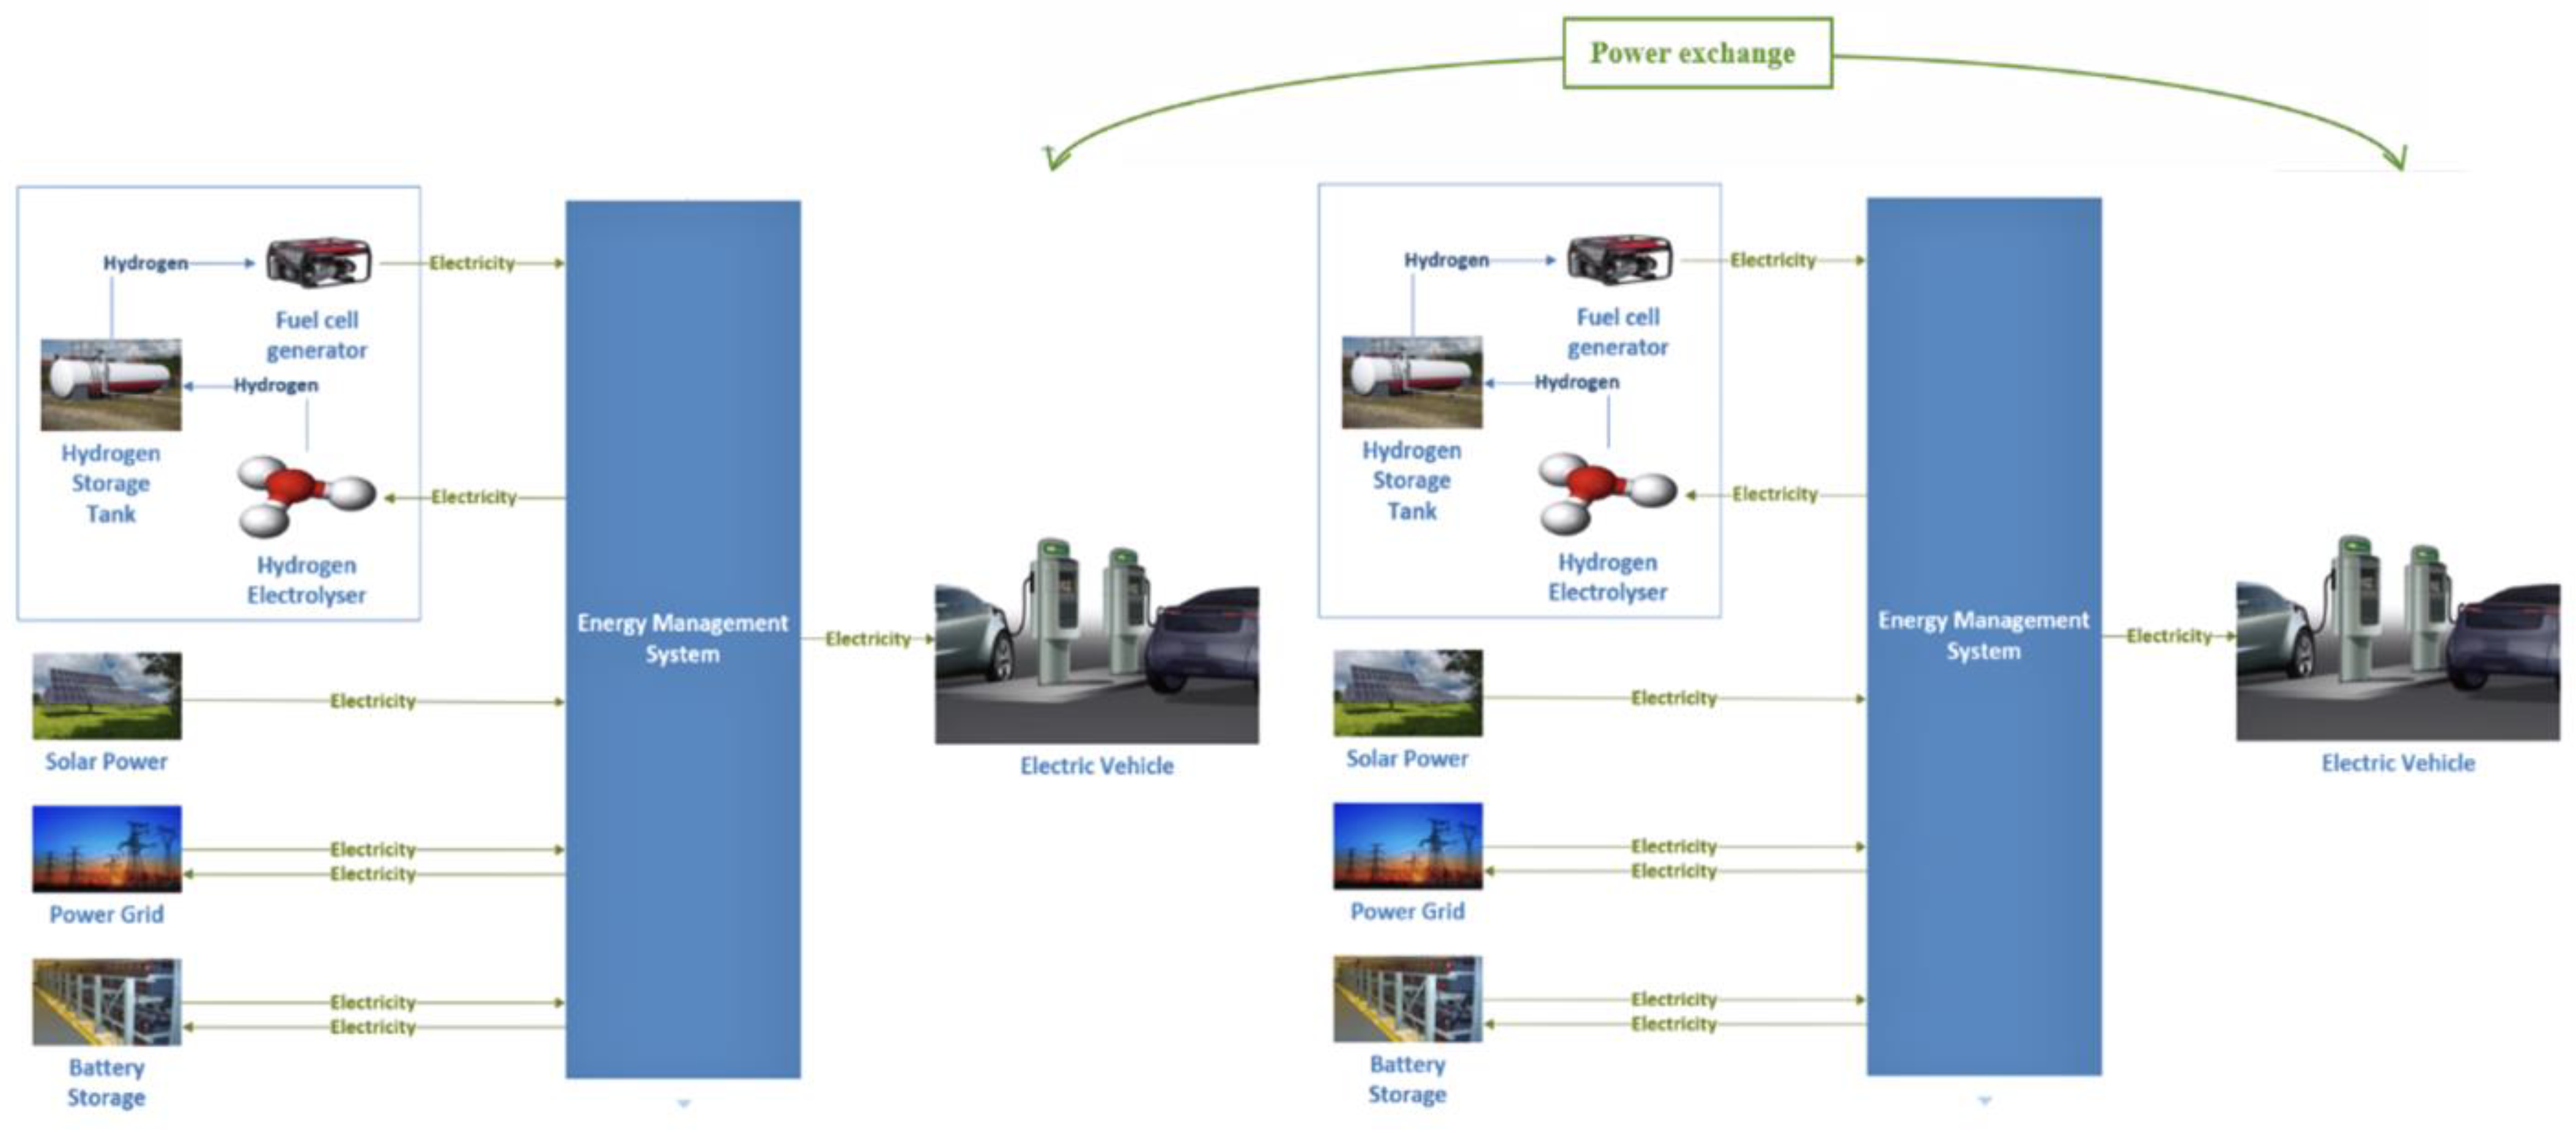
2. Problem Formulation

The first objective function of SHS-EVCS design is minimizing the capital and O&M costs of the system. This objective function comprises two primary components, that is, the initial capital cost ( C 0 ) and the subsequent system O&M cost ( C 1 ). The initial capital cost includes the construction and procurement of each distributed unit within the SHS-EVCS system, and the size of the energy storage device also influences this cost. The aim is to identify the optimal design size for the energy storage device through this optimization objective. The later operating cost comprises the costs related to the operation and maintenance of each component within the microgrid system, fuel cell expenses, transaction costs between the system and the grid, as well as transaction costs between the two electric vehicle charging stations. The system optimizes this cost component to enable energy storage and other distributed equipment to function as controllable loads during the scheduling period while adhering to operational constraints. The second objective function is from an environmental protection standpoint within the SHS-EVCS context, which focuses on the cost analysis of greenhouse gas emission for each unit. In order to account for both environmental considerations and overall benefits, a comprehensive benefit optimization model has been developed and implemented [30,31]. This model aims to establish an objective function that optimizes capital and O&M costs while effectively addressing the emission cost objectives of the SHS-EVCS.
Although, the SHS-EVCS is integrated with the grid, with an emphasis on ensuring the self-sufficiency of the EVCS’s own power supply. Under this circumstance, the primary objective is to rely on the internally generated energy of the EVCS to meet the daily load requirements. However, in instances where the energy generation falls short of meeting the demand, the consideration of purchasing electricity from the grid or another EVCS is considered.

2.1. Objective Function

m i n F = m i n ( C 0 + m = 1 N t = 1 T C 1 m , t )
m i n F G E = t = 1 T j = 1 J ζ j i = 1 N δ j P m t + γ j Q m t
C 0 = m = 1 N C m 0 × r × r + 1 y r + 1 y 1
C 1 m , t = C O M m , t + C F u e l m , t + C g r i d m , t + M b u y 1 M s e l l 1
where N is the subsystem, which is 2; T is 24 h; C m 0 is the initial capital cost in the m subsystem; j is the greenhouse gases in class j (including CO 2 ,   SO 2 ,   and   NO x ); J is the number of greenhouse gases, which is 3; ζ j is the disposal cost for class j greenhouse gases (GBP/kW); δ j and γ j are the class j greenhouse gases’ coefficient number of the SHS system and grid (GBP/kW); P m t and Q m t are the SHS system and grid power (kW) output in time t; C O M m , n , C F u e l m , n , and C g r i d m , n are the operating and maintained cost, fuel cell cost, and selling and buying electricity price from grid cost, respectively; r is the discount rate, which is 6%; and M b u y 1 and M s e l l 1 are the buying and selling electricity to another EV charging station cost and revenue, respectively.
C O M m , t = C O M p v n m , t + C O M h s n m , t + C O M b a t n m , t
C O M p v m , t = K O M p v P p v m , t
C O M h s m , t = K O M h s P H 2 , i t m , t
C O M e s m , t = K O M b a t P B a t , a , t m , t
C F u e l m , t = a m f m
C g r i d m , t = b P g , b u y c P g , s e l l
M b u y 1 = d P E V C S , b u y 1
M s e l l 1 = e P E V C S , s e l l 1
where C O M p v n m , t , C O M h s n m , t , and C O M b a t n m , t are the photovoltaic, hydrogen, and battery storage O&M cost; K O M p v , K O M h s , and K O M b a t are the operation and maintenance cost, which is 28.70 GBP/kW, 14.18 GBP/kW, and 4.75 GBP/kW, respectively; P p v m , t , P H 2 , i t m , t , and P B a t , e , t m , t are the output power for PV, hydrogen, and battery storage, respectively; a m   and   f m are the price for the fuel cell and capacity for the fuel cell, respectively; b and c are the buying and selling prices for the grid (these prices are changeable depending on the time period, but in this paper, the selling price c is 0.33 GBP/kWh), respectively; P g ,   b u y and P g , s e l l are the buying and selling power from the grid, respectively; and d and e are the buying and selling prices from another EV charging station (these prices are changeable depending on the time period, respectively, but in this paper, the buying price d is 0.24 GBP/kWh and buying prices e are 0.31 GBP/kWh). P E V C S , b u y 1 and P E V C S , s e l l 1 are the buying and selling power from EVCS, respectively.

2.2. Components’ Model

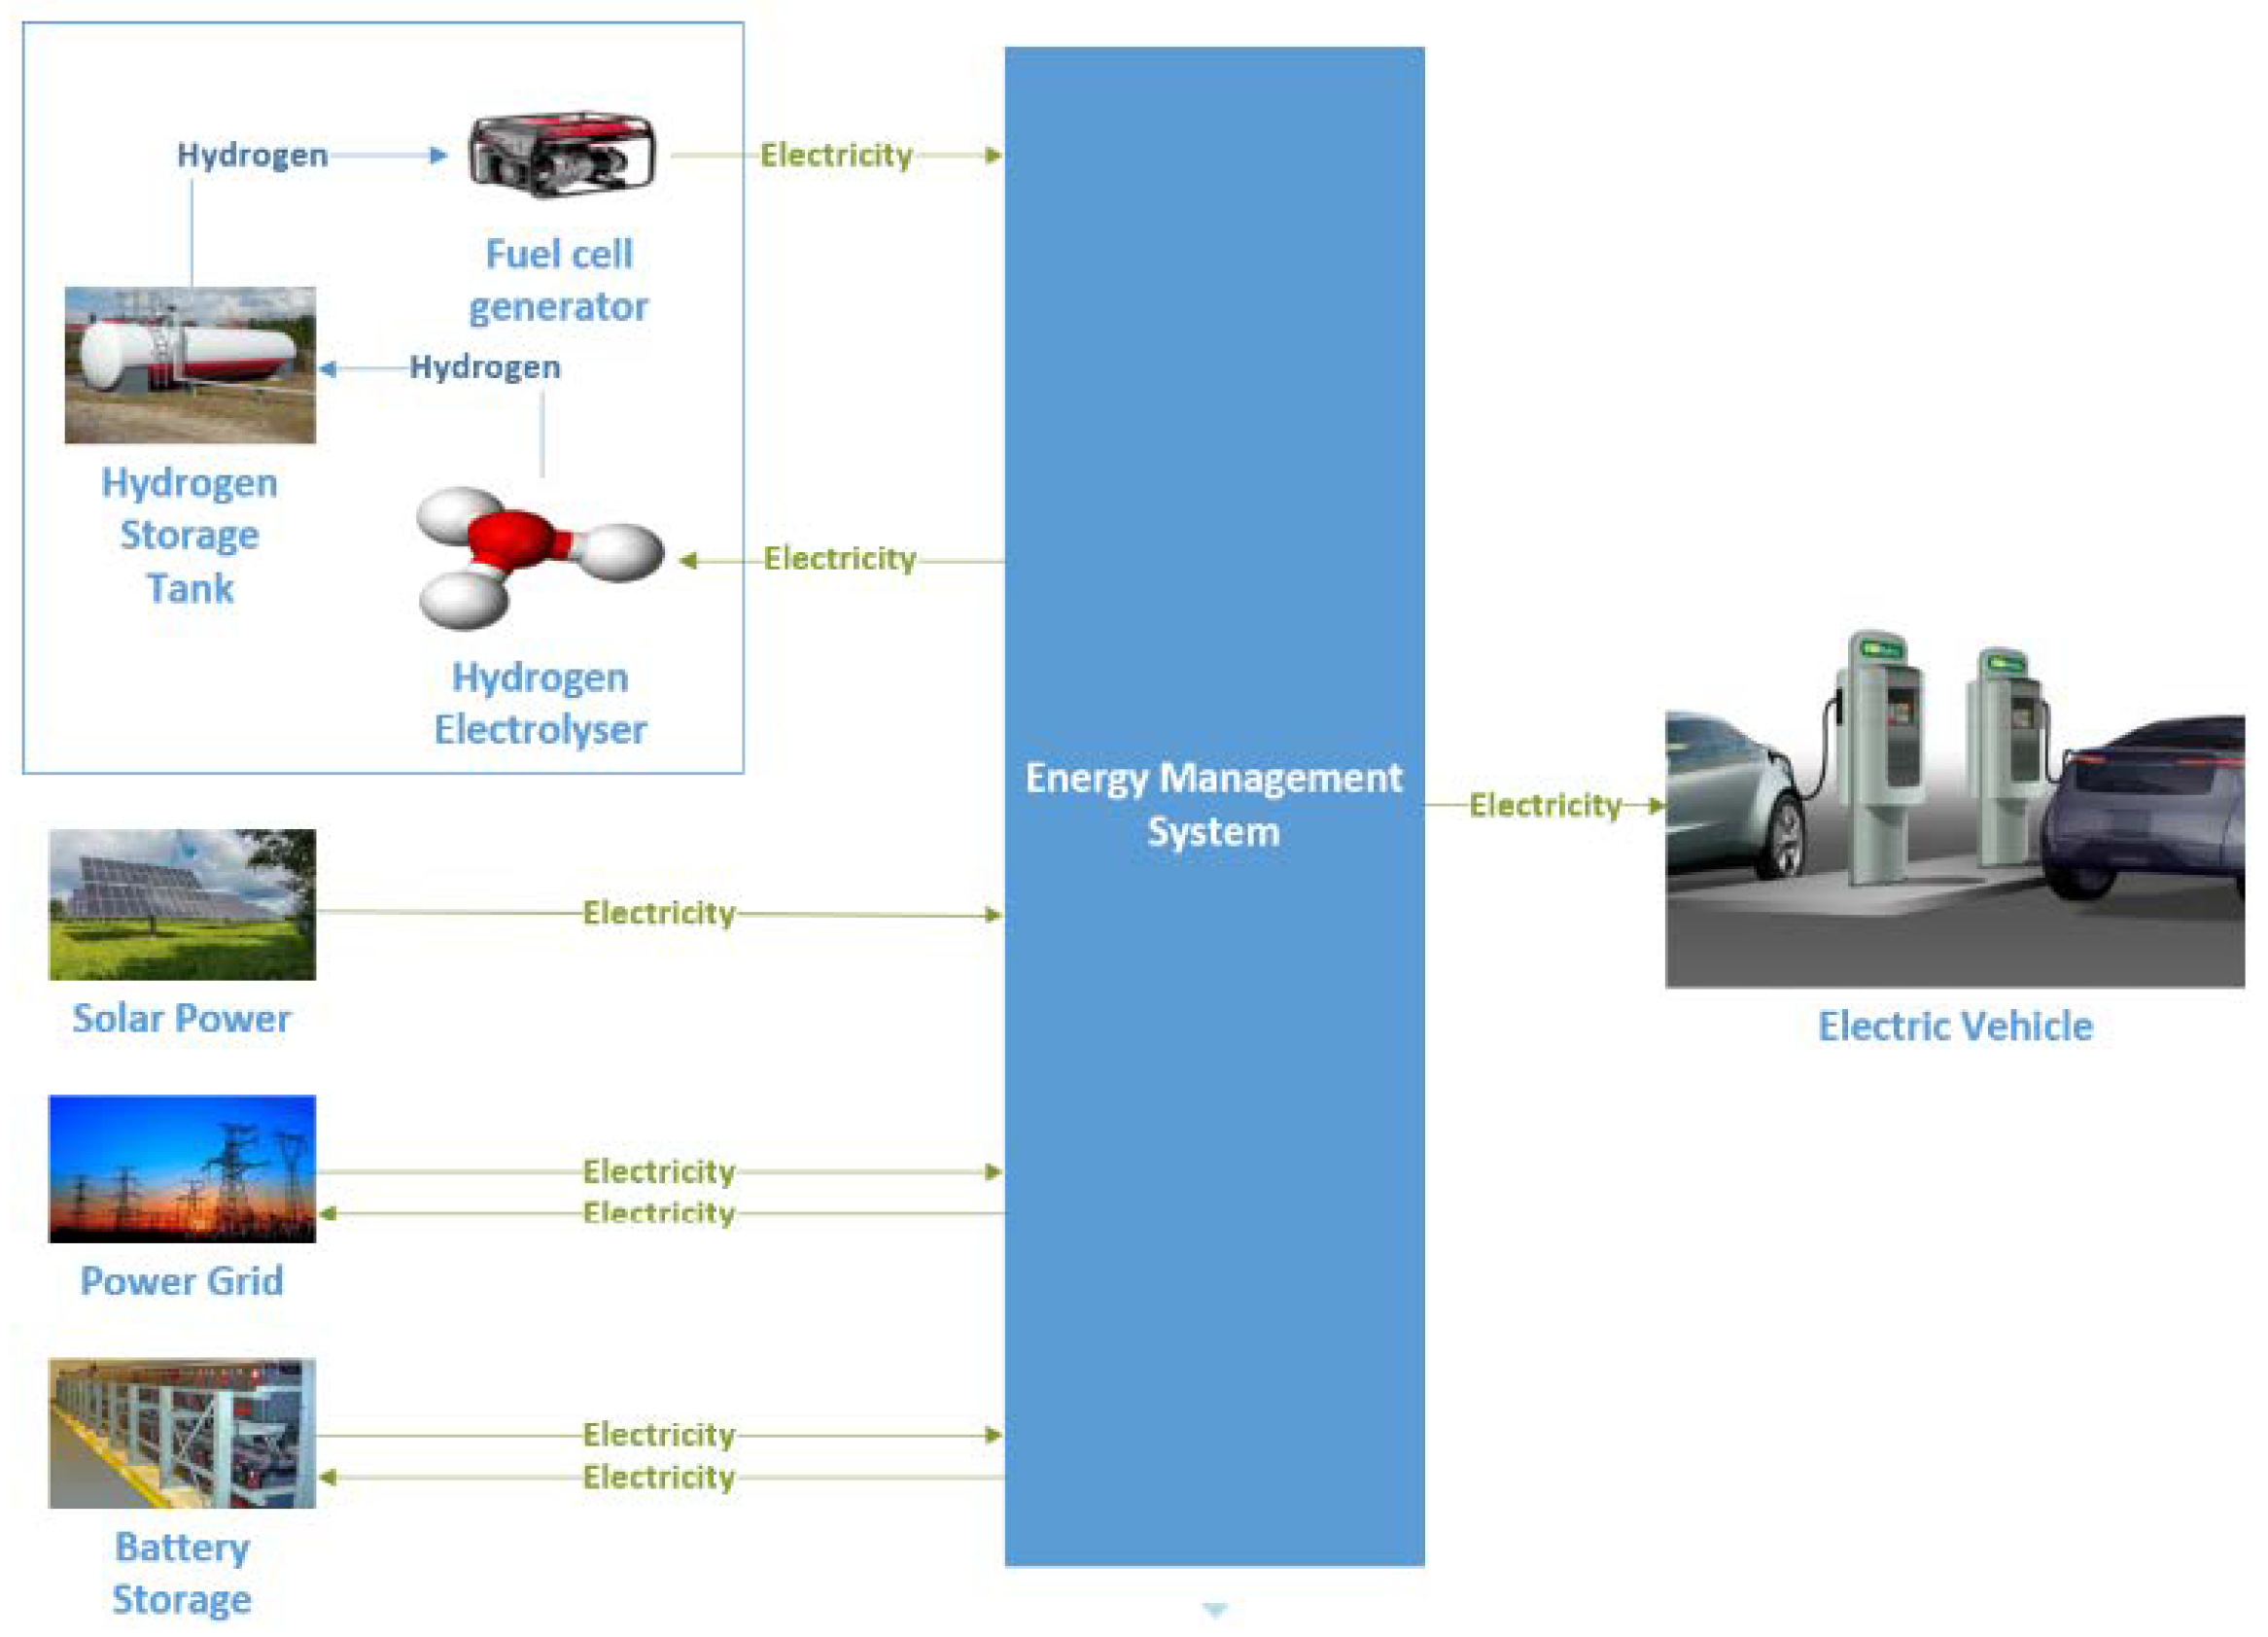
2.2.1. Hydrogen System Model

Considering the unpredictable and often cloudy weather conditions in the UK, it becomes apparent that relying solely on photovoltaic energy may not be sufficient to meet the demands of EVCS. Additionally, while battery technology has made significant strides, the cost of batteries still presents a significant challenge for widespread deployment and scalability. Considering these factors, hydrogen emerges as a promising alternative among renewable energy options. Its versatility and ease of transport make it an attractive choice for urban settings [32]. Hydrogen energy storage stands out due to its remarkable energy storage density. The use of hydrogen energy storage not only enhances energy resilience but also offers a means to balance the grid by providing a stable and on-demand energy source when needed. This innovative solution represents a vital step towards reducing greenhouse gas emissions, fostering cleaner transportation options, and building a more sustainable energy infrastructure, for the future, into hydrogen through a process like electrolysis and then stored for later use.
The equivalent electric power of hydrogen output in the t period of hydrogen production with an electrolyser is as follows:
P H 2 , i t = P E 2 H t α E 2 H i N HSS
The power generation of the hydrogen fuel cell is as follows:
P H 2 P ,   i t = P H F C t β E 2 P η F C , i N HSS
The equivalent SOC of the hydrogen storage capacity of the hydrogen storage tank in the t period is as follows:
E H 2 , i t = E H 2 , i t 1 P H F C ,   i t + P S H , i t + P H 2 , i t Δ t , i N HSS
where P E 2 H t and P H F C t are the power consumption of electrolysis and the fuel cell, respectively; α E 2 H and β E 2 P are the conversion efficiency of the electrolyser and fuel cell, respectively; η F C represents the FC efficiency; E H 2 , i t 1 , P S H , i t , and Δ t are the residual hydrogen storage equivalent electricity in the t−1 period, and the equivalent power of the hydrogen load and unit time period, respectively; and N HSS is the set of hydrogen system nodes.

2.2.2. Photovoltaic Power Model

A photovoltaic power generation model was adopted [33] as follows:
P p v = P S T C G A C 1 + k T c T r G S T C
where P p v is photovoltaic cell output power; G A C is light intensity; P S T C is the maximum test power under standard test conditions (sunlight incident intensity of 1000 W/m2 and ambient temperature of 25 °C); and G S T C is the illumination intensity under standard test conditions, and its value is 1000 W/m. K is the power temperature coefficient; T c is the operating temperature of the panel; and T r is the reference temperature.

2.2.3. Battery Storage Model

This paper used the battery as the energy storage component. A battery plays an important role in balancing power fluctuation and improving power quality in an SHS-EV charging station. The available capacity S B a t , a , t of the battery is the following [34]:
P B a t , e , t = P B a t , e , t 1 1 σ B a t , e + ( P B a t , e , t c h a η B a t , e c h a + P B a t , e , t d i s η B a t , e d i s ) Δ t
where P B a t , e , t and P B a t , e , t 1 are the residual capacity of battery pack e in time t and t1, respectively; σ B a t , e is the self discharge rate of battery group e; P B a t , a , t c h a and P B a t , a , t d i s are the charging power and discharge power of battery pack e in time t, respectively, and the power during discharge is negative; and η B a t , e c h a and η B a t , e d i s are the charging efficiency and discharge efficiency of battery pack e in period t, respectively.

2.3. Constraints’ Condition

2.3.1. Photovoltaic Power Output Constraints

Due to the randomness and volatility of solar energy, the photovoltaic power output is coordinated according to the predicted power.
P P v , k , t f o r ,   0 P P v , k , t P P v , k n
where P P v , k , t f o r and P P v , k n are the predicted power and rated power of the k photovoltaic cells at time t, respectively.

2.3.2. Battery Storage Output Constraints

A battery is an energy storage unit that does not generate electricity, so the battery capacity remains unchanged throughout the coordination period.
S B a t , e , T = S B a t , e , 0
where S B a t , e , T and S B a t , e , 0 are the ending capacity and initial capacity of the battery pack e in the coordination period, respectively.

2.3.3. Hydrogen Storage Output Constraints

E H 2 , i m i n E H 2 , i t E H 2 , i , C A P ,   i N HSS
where E H 2 , i , C A P and E H 2 , i m i n are the capacity and lower limit of the hydrogen storage tank, respectively, and the lower limit is 20%.

2.3.4. The Power Output of each Energy Source

P m i n i n ,   e l e c t r o l y s e r P t i n ,   e l e c t r o l y s e r P m a x i n ,   e l e c t r o l y s e r P m i n F C P t F C P m a x F C S O C m i n S O C S O C m a x
where P t p v is the power consumed of PV at time slot t; P m i n i n ,   e l e c t r o l y s e r and P m a x i n ,   e l e c t r o l y s e r are the upper and lower limits of P t i n ,   e l e c t r o l y z e r , respectively; and P m i n F C and P m a x F C are the upper and lower limits of fuel cell generation, respectively.

2.3.5. Power Balance Constraint

t = 1 T P p v t + P H 2 , i t t + P B a t , e , t t + P g t + P E V C S t = P l o a d t
P g and P E V C S are the grid and another EV charging station energy exchange (positive means buying electricity and negative means selling electricity) at time t, respectively. P l o a d is the load power at time t.

2.4. Algorithm

This paper compares NSGA-II (Non-dominated Sorting Genetic Algorithm) and MOEA/D (Multi-objective Evolutionary Algorithm Based on Decomposition); both are multi-objective optimization algorithms that have been widely used in many fields including renewable energy.
NSGA II is an optimization method based on populations, drawing inspiration from natural selection, genetics, and evolution to seek the best possible solution for a given problem [35]. NSGA-II sorts individuals based on their dominance relations and assigns them to different fronts, with the individuals on the first front being non-dominated, i.e., no other individual in the population has better objective function values. NSGA-II then applies a crowding distance metric to maintain diversity in the population [35,36,37,38]. NSGA II is an optimization method based on populations, drawing inspiration from natural selection, genetics, and evolution to seek the best possible solution for a given problem. MOEA/D, on the other hand, is a decomposition-based algorithm that decomposes the multi-objective optimization problem into several subproblems, each with a single objective. MOEA/D solves these subproblems simultaneously and then aggregates the solutions to obtain the Pareto optimal front. The algorithm iteratively updates the weights assigned to each objective in the subproblems to improve the convergence and diversity of the solutions [39].
Compared to NSGA-II, MOEA/D has a faster convergence rate and requires less computational resources, such as scalarizing function and population management, making it suitable for large-scale optimization problems. However, NSGA-II has been shown to have better diversity preservation and is more robust in finding the global Pareto front in complex problems [35]. In addition, NSGA-II has been applied to a wide range of problems and has been widely accepted as a benchmark algorithm for multi-objective optimization. In summary, both NSGA-II and MOEA/D are effective multi-objective optimization algorithms that have been successfully applied to renewable energy problems. The choice between the two depends on the specific problem and the trade-off between computational efficiency and solution quality [40]. This paper will also select the optimal algorithm based on the Pareto front and Pareto optimal solutions. MOEA-D and NSGA-II have different characteristics and approaches to solving multi-objective optimization problems. MOEA-D decomposes the problem into several subproblems and optimizes them separately, while NSGA-II uses a non-dominated sorting approach to evolve a population of solutions. Comparing them could support understanding on how these different approaches impact their performance on specific problem types. The key settings of the two algorithms are given in Table 3.

2.4.1. NSGA-II

This section describes how the NSGA-II operated in the MATLAB, NSGA-II uses a ranking-based approach to find non-dominated solutions, which represent the optimal solutions in a multi-objective optimization problem. 
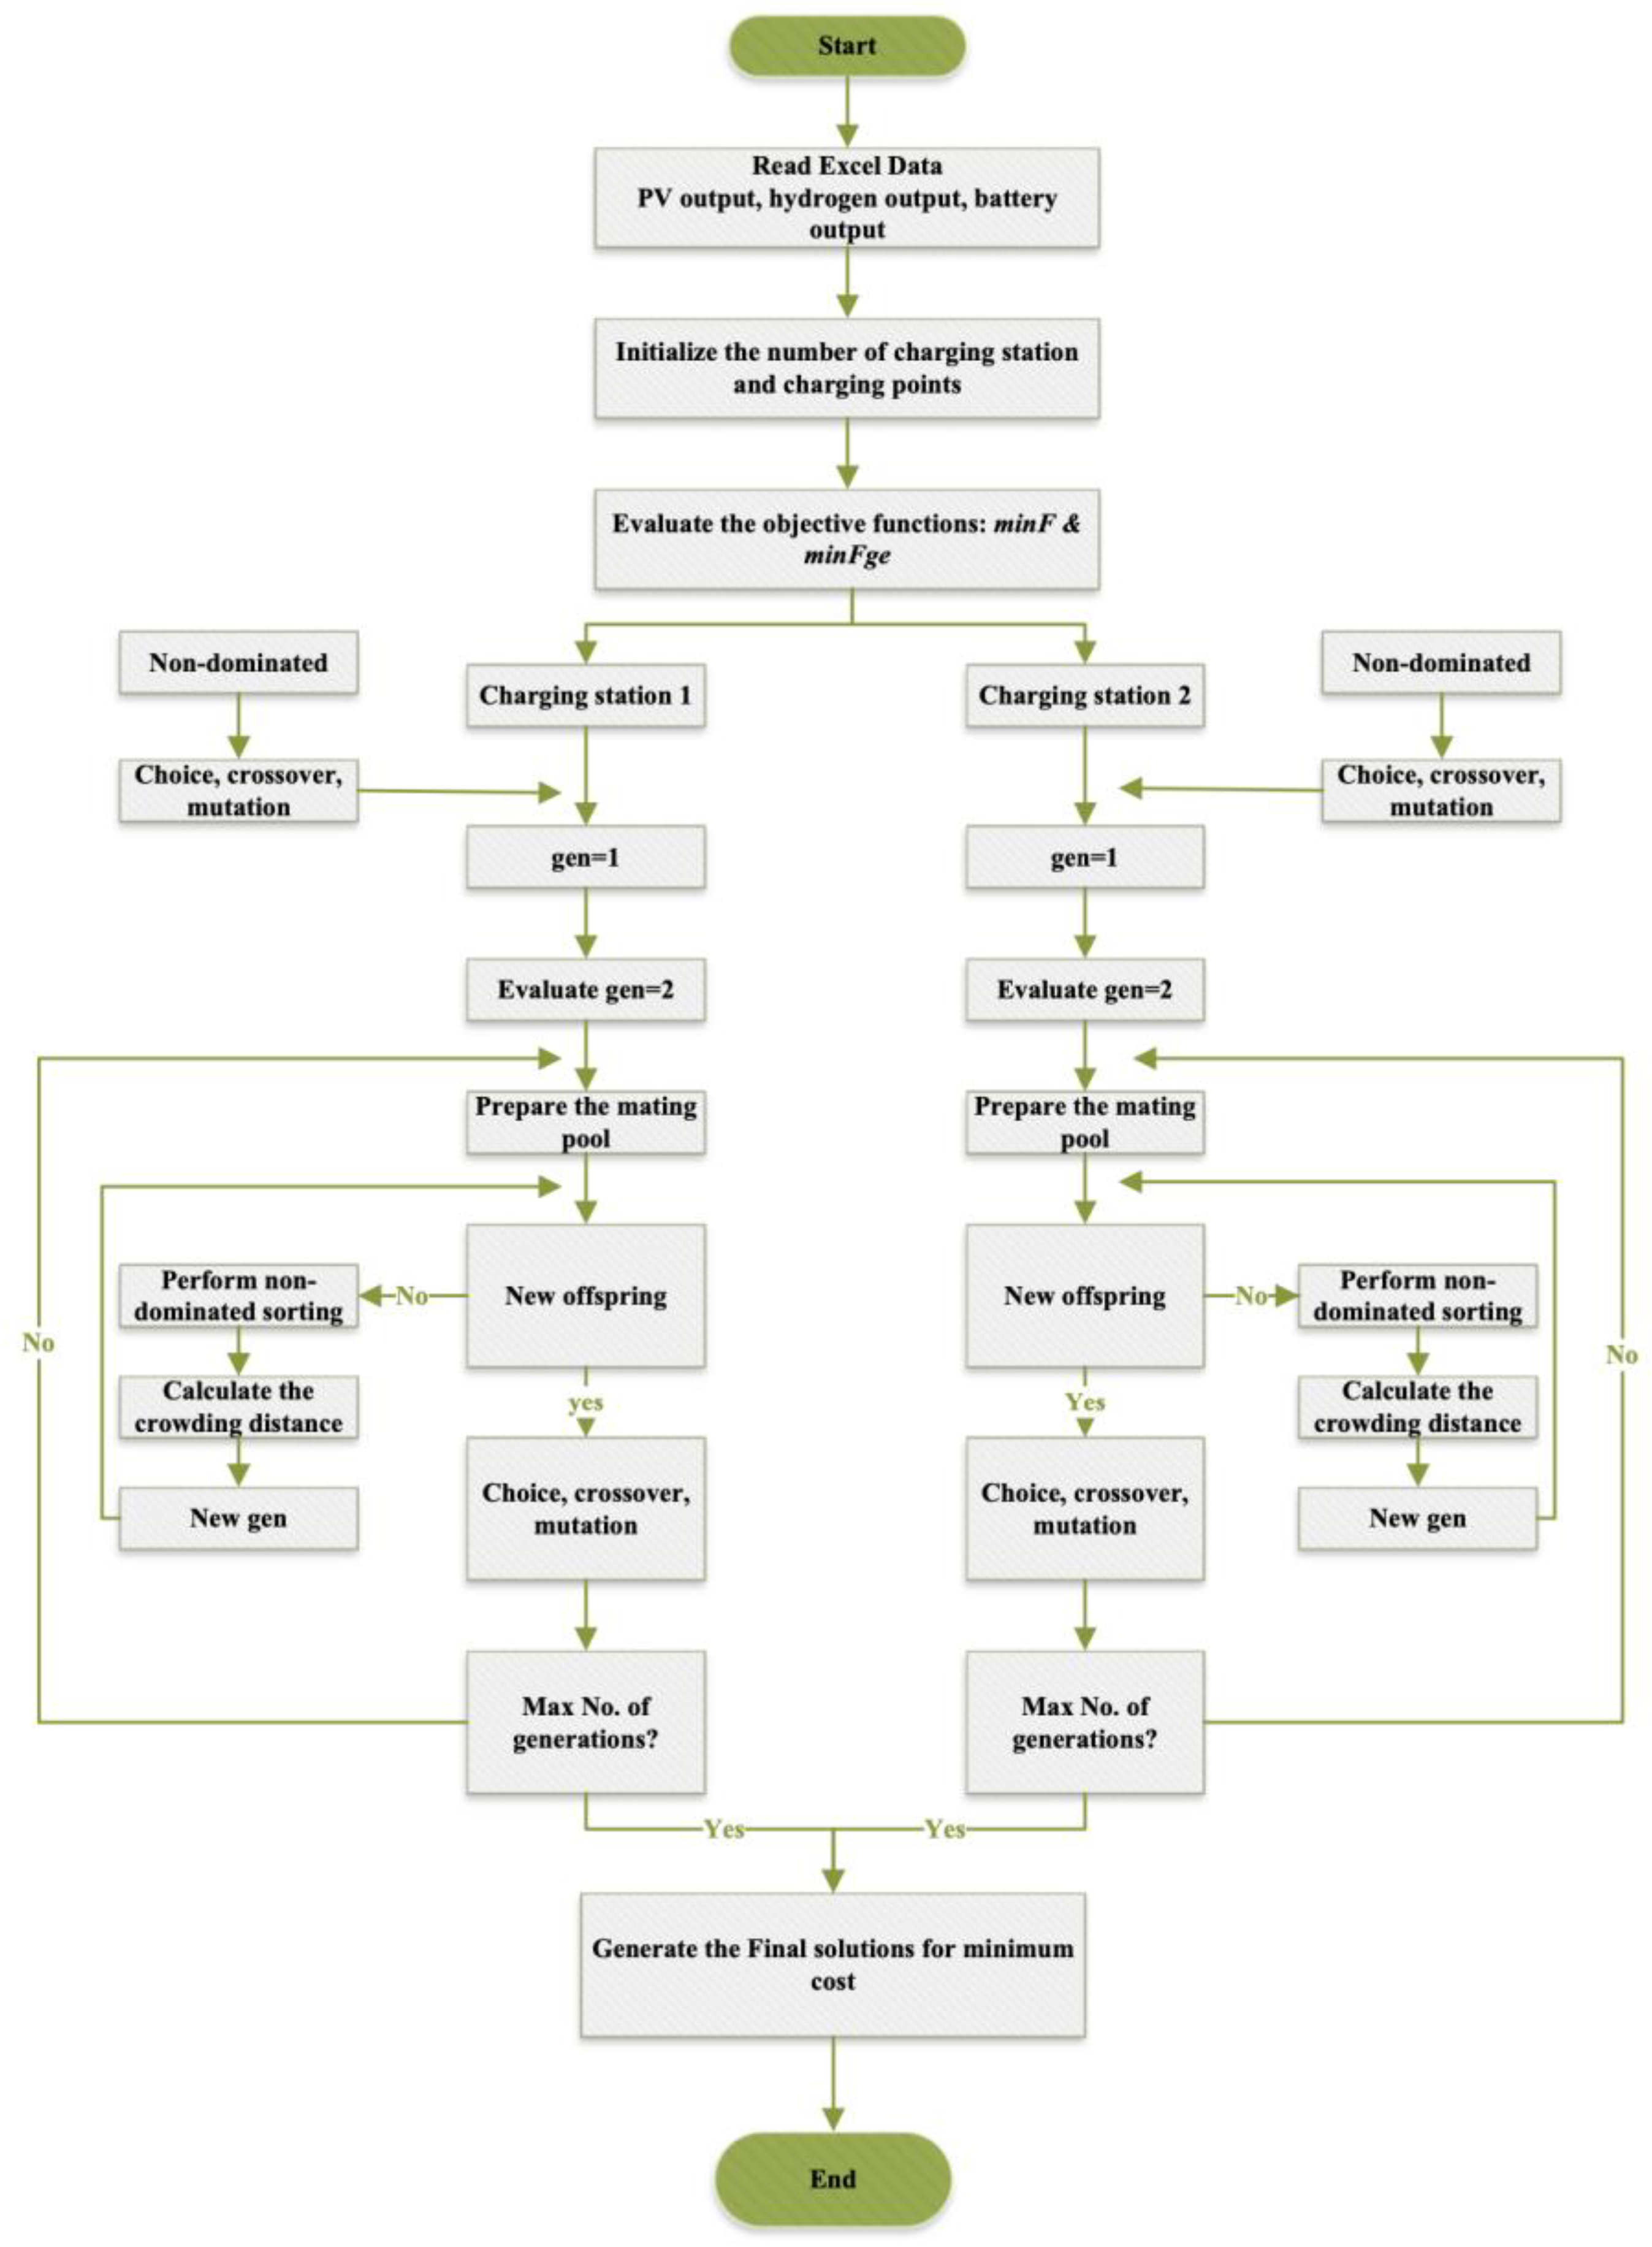
Figure 2 demonstrates the flowcharts of 2 SHS-EVCS using NSGA-II optimization.
Data input: Topological matrix. n: generation number; minF; minFGE.
The algorithm for using NSGA-II in the SHS-EVCS optimization process can be described as follows [20]:
Algorithm 1: Non-dominated Sorting Genetic Algorithm (NSGA-II)
 1. Problem definition.
   a. Define the objective function.
   b. Define the constraints.
 2. Initialization.
   a. Generate a set of initial solutions.
   b. Evaluate the solutions using the objective function and constraints.
 3. Fast Non-dominated Sorting.
 4. Create the offspring population.
   a. Crossover and mutation.
   b. Evaluate the offspring solutions using the objective function and constraints.
 5. Merge the parent and offspring populations.
 6. Environmental selection.
   a. Select the next generation of solutions.
   b. Lowest non-domination level and highest crowding distance are preferred.
 7. Repeat from Step 3.
 8. Return the best solution.
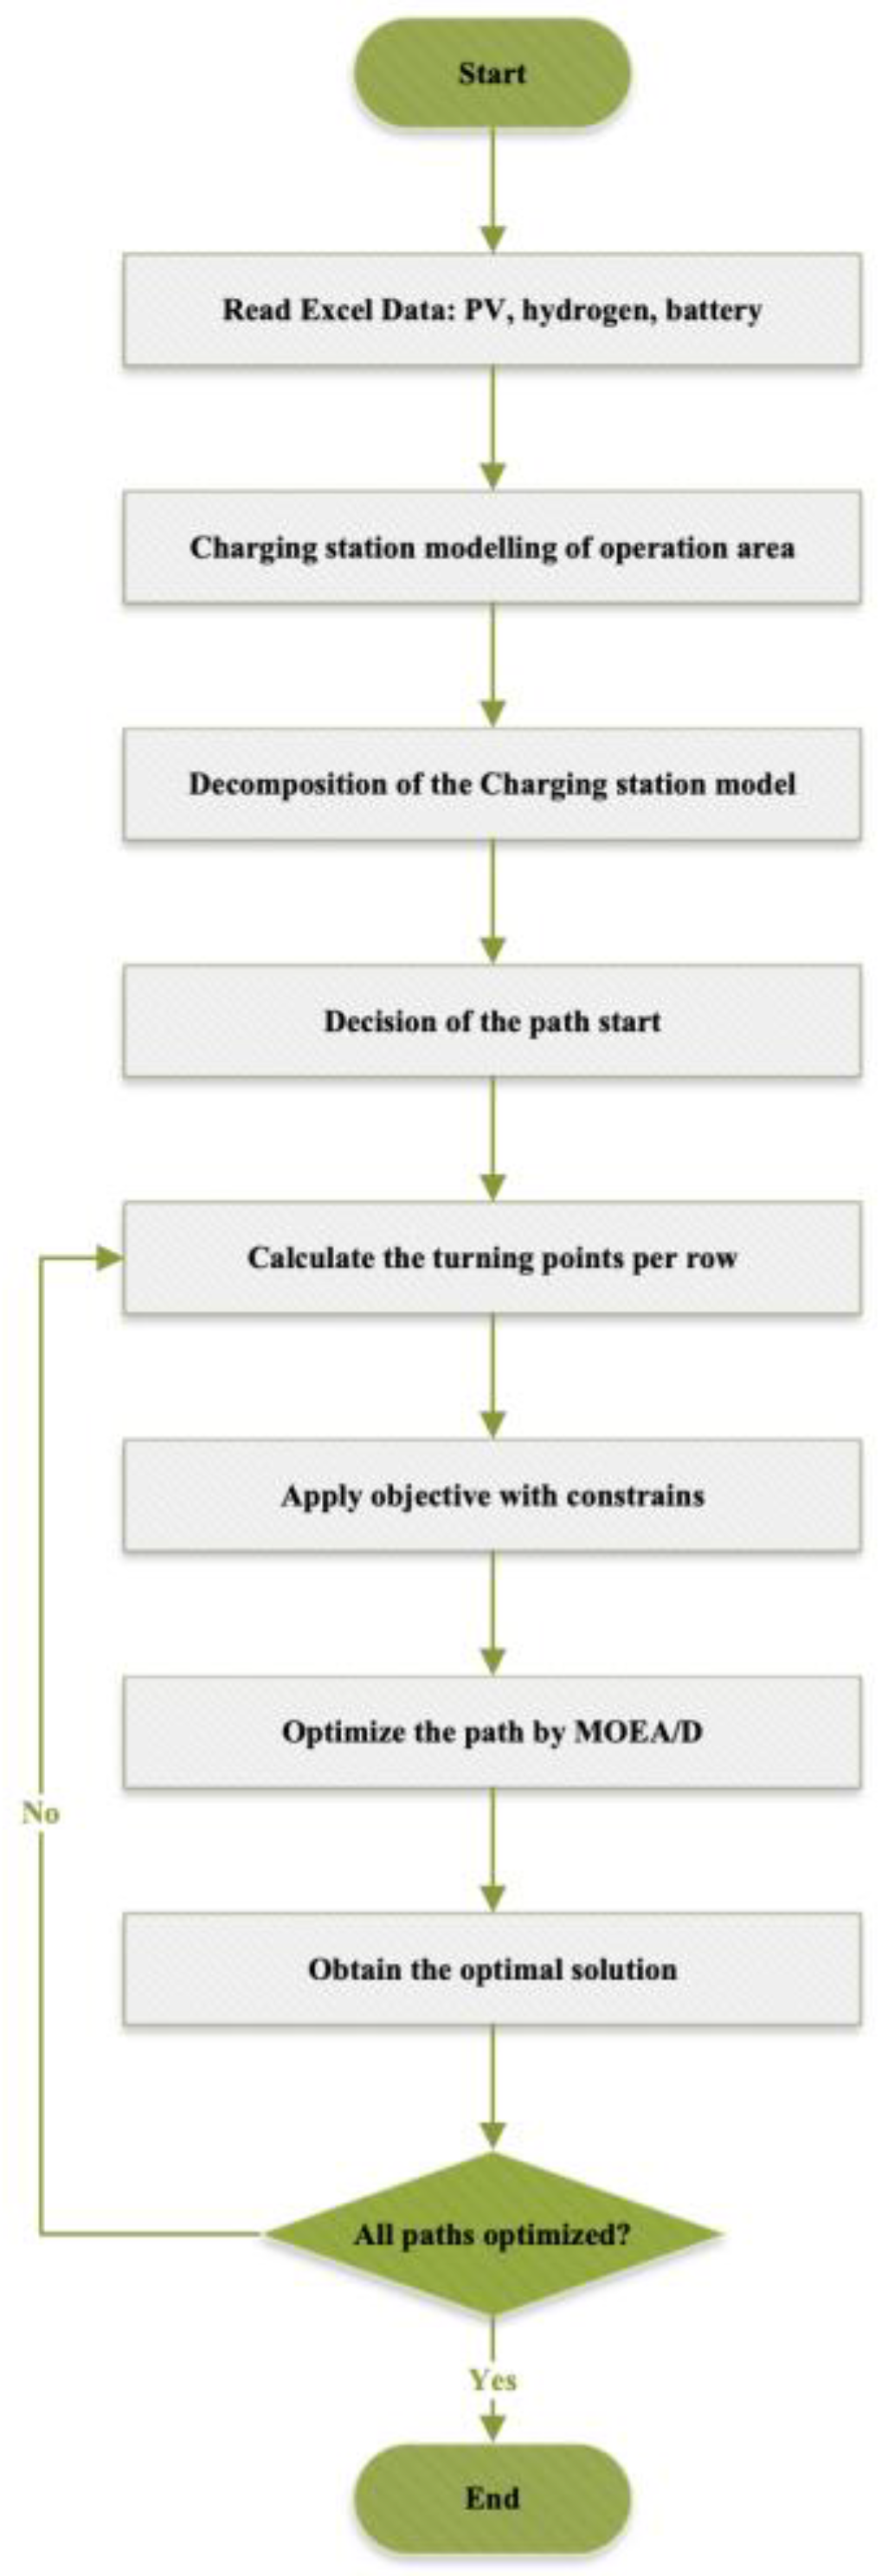
2.4.2. MOEA/D

This section describes how the MOEA/D operated in the MATLAB, MOEA/D aims to find a set of solutions, known as a Pareto front, which represents the trade-offs between these objectives [39]. Figure 3 demonstrates the flowcharts of 2 SHS-EVCS using MOEA/D optimization.
MOEA/D can be summarized as follows:
Algorithm 2: Multi-objective Evolutionary Algorithm Based on Decomposition (MOEA/D)
 1. Input: Maximum no. of iterations 200; population; size N; decision making; preference information.
 2. Set ItrCounter = 1.
 3. Generate the initial population by uniform sampling method.
 4. Evaluate the objective values of the population.
 5. Determine the Pareto-based non-dominated rank by fast sorting operator.
 6. Compute the preference degree of decision making.
 7. Compute the weighted distance.
 8. Rank individuals according to weighted distance.
 9. Select the top N individuals as the new parent population.

3. Case Study

Solar-Hydrogen-Storage-Integrated Electric Vehicle Charging Station

Figure 4 shows that the solar-hydrogen-storage-integrated electric vehicle charging station (SHS-EVCS) is a type of electric vehicle charging station that uses solar energy, hydrogen energy storage, and battery energy storage as the main power sources. This type of charging station is designed to reduce carbon emissions and minimize capital and O&M costs. The solar component of the charging station uses photovoltaic panels to convert sunlight into electricity. The electricity can be used directly to charge electric vehicles or stored in batteries for later use. The hydrogen energy storage system uses an electrolyser to split water into hydrogen and oxygen. The hydrogen is then stored in a high-pressure tank for later use. When needed, the hydrogen is combined with oxygen in a fuel cell to produce electricity to charge electric vehicles. The battery energy storage system uses lithium-ion batteries to store excess electricity generated using the solar panels or produced using the fuel cell. The stored electricity can be used to charge electric vehicles during times when solar energy and hydrogen are not available. The SHS-EVCS system is designed to optimize the use of renewable energy sources and minimize the use of fossil fuels. By using solar and hydrogen energy, the charging station can reduce carbon emissions and help to mitigate the effects of climate change. Additionally, the use of battery storage helps to ensure that electric vehicles can be charged even when renewable energy sources are not available.
SHS-EVCS can also interact with the grid through a process called energy exchange. During periods of excess energy generation, such as during the daytime when solar energy is abundant, the charging station can export excess energy to the grid. Conversely, during periods of high energy demand, such as during peak hours when many electric vehicles are being charged, the charging station can import energy from the grid to supplement its own renewable energy sources. This energy exchange allows the SHS-EVCS to further optimize its use of renewable energy sources and minimize the use of fossil fuels. By exporting excess energy to the grid during periods of high renewable energy generation, the charging station can help to balance the grid and increase the overall use of renewable energy. And by importing energy from the grid during periods of high demand, the charging station can ensure that electric vehicles can be charged even when renewable energy sources are not available.
The siting and sizing of EV charging stations require a comprehensive understanding of local EV adoption patterns, infrastructure capabilities, and user preferences. It is crucial to balance accessibility, convenience, and scalability to create a charging network that supports the growing EV market effectively [41]. Figure 5 shows that when two SHS-EVCSs are connected to the grid, they can also exchange power between each other. If one charging station has excess energy while the other is in high demand, the charging station with excess energy can supply power to the other station. This energy exchange also helps to optimize the use of renewable energy sources and minimize the use of fossil fuels, same as interacting with the grid. Figure 6 contributes with a visual representation of the geographical layout of these two distinct locations. This visualization serves as a valuable reference for understanding the spatial relationship between the two sites. The distance between the two sites is about 8 km by car. To optimize the accessibility and convenience of charging infrastructure, a strategic decision was made to establish a connection between the two closest charging stations. By doing so, it aims to enhance the overall efficiency and usability of these charging points.
In the methodology section, two SHS-EVCSs were modelled. Table 4 and Table 5 present the key technical and economic parameters of each station. Table 6 outlines the greenhouse gas emission coefficient and disposal cost; the objective function for environmental protection operation considered these factors. For the case study, a 24-h scheduling period was utilized, and an hourly energy dispatch solution was implemented on a summer reference day. Table 7 shows some design variables for SHS-EVCS.

4. Results and Discussion

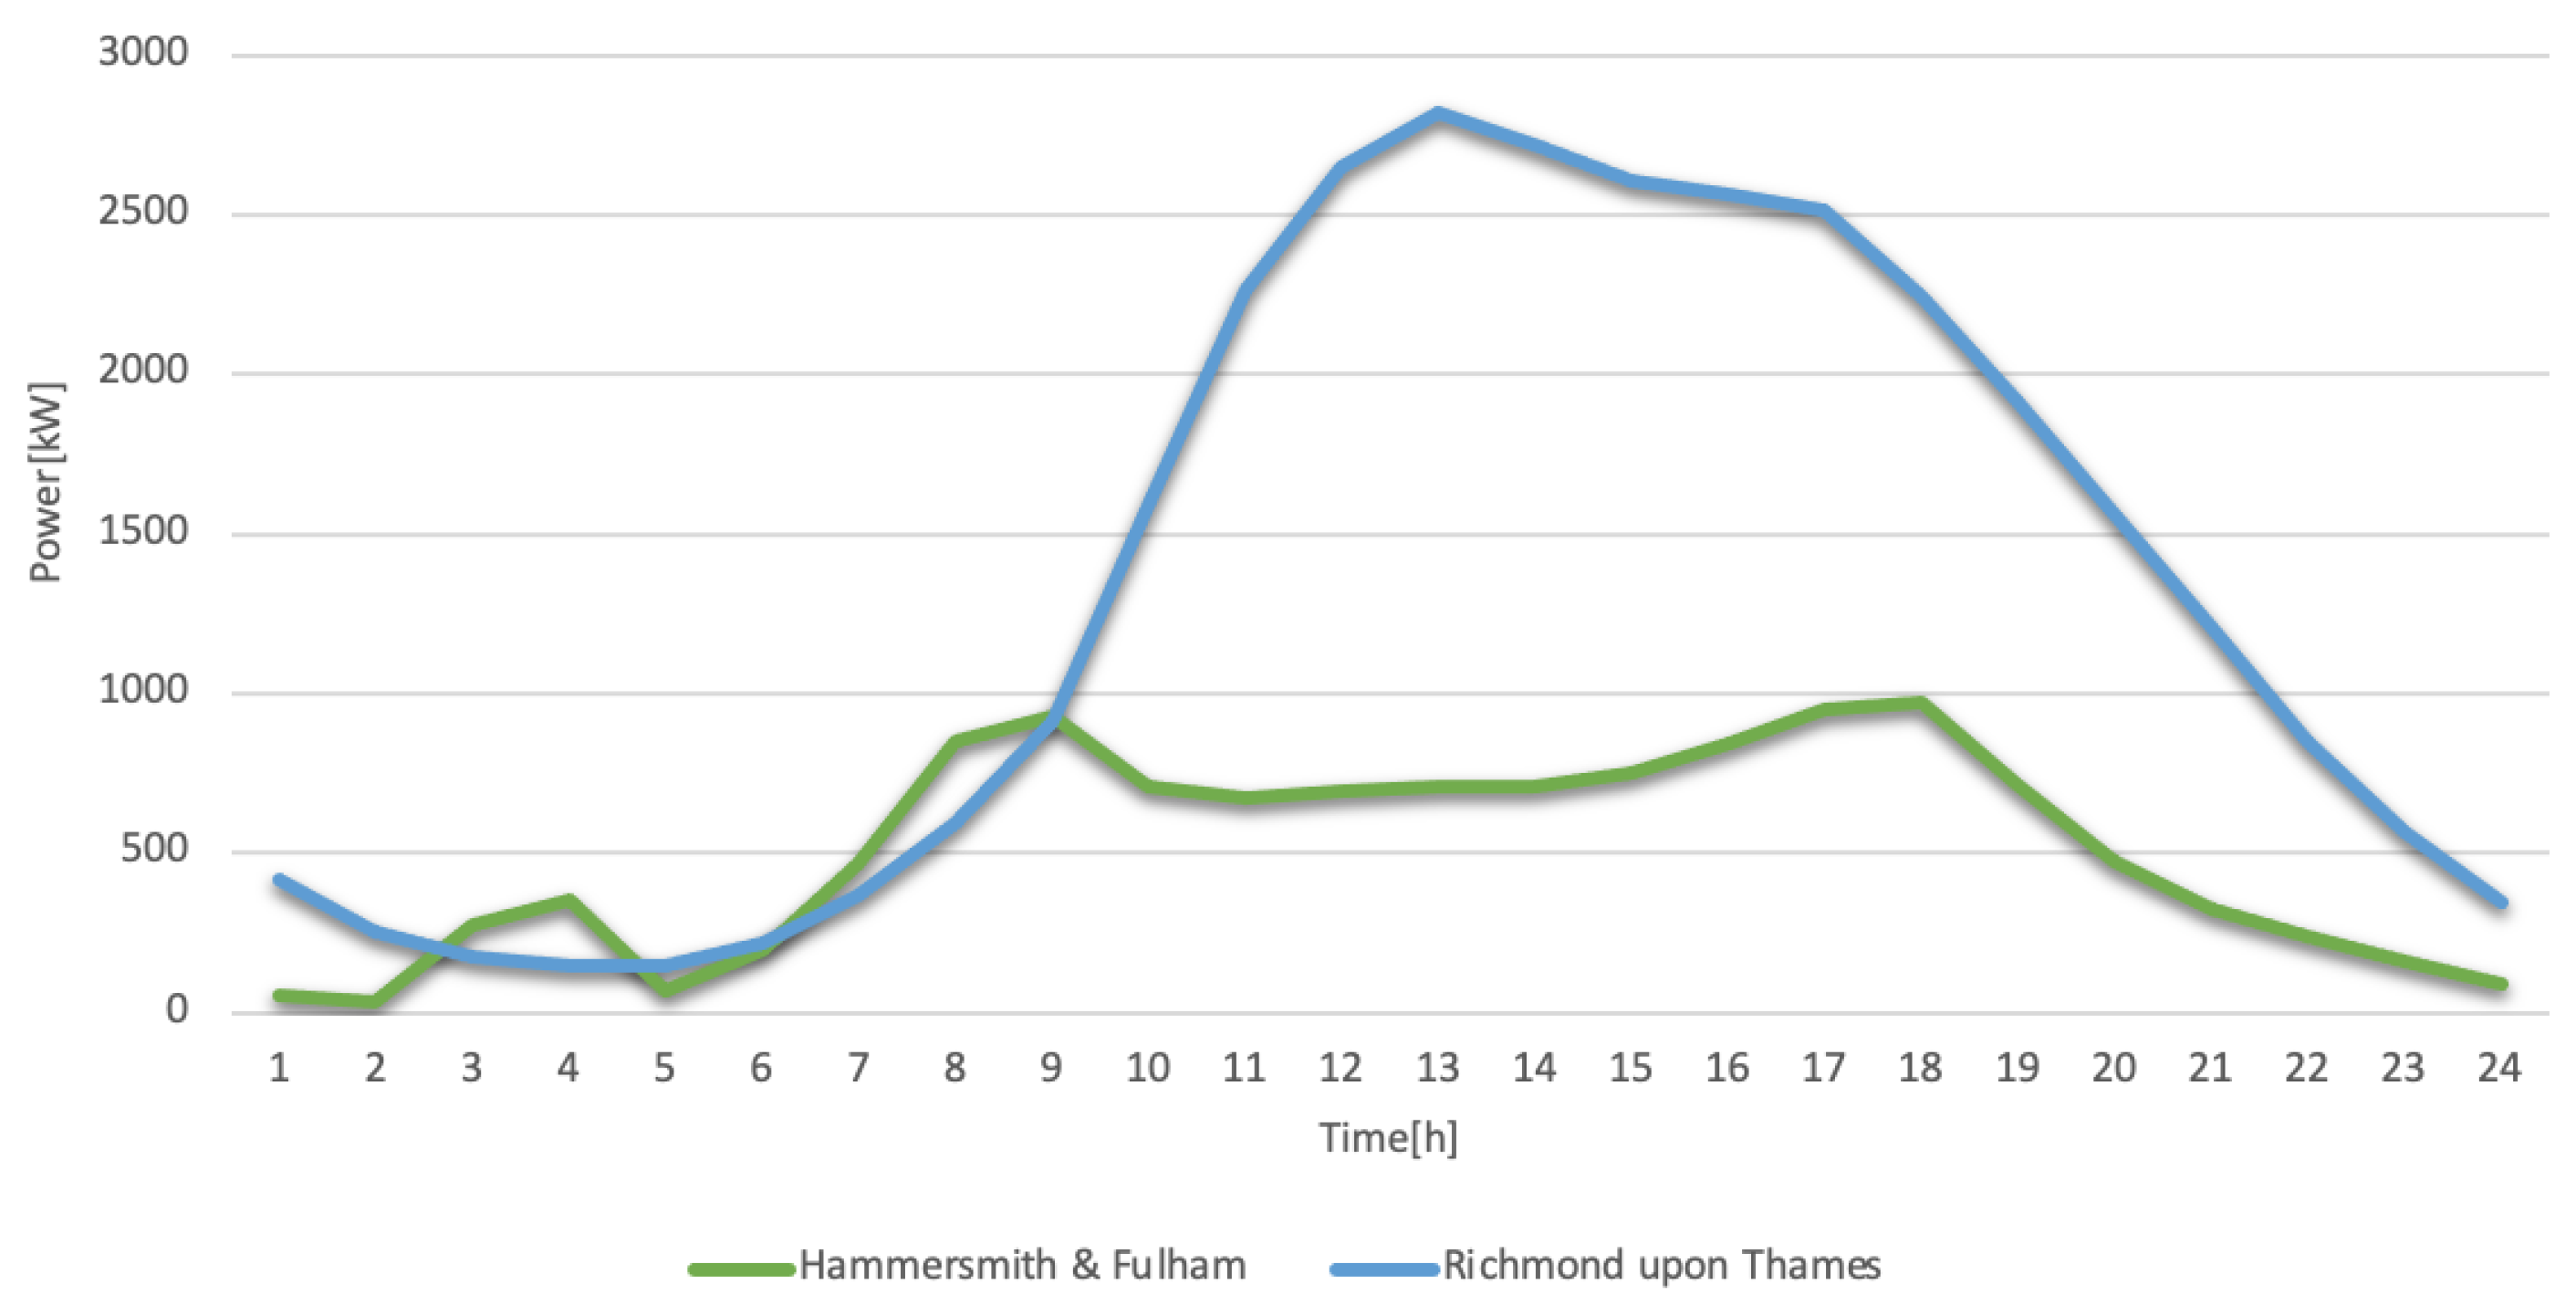
Figure 7 presents the projected profile of EV charging demand, commonly referred to as the load curve, within the SHS-EVCS across two specific boroughs in London. Each EV charging load curve corresponds to a distinct SHS-EVCS. It is assumed that Hammersmith and Fulham will have 5 SHS-EVCSs, while Richmond upon Thames will have 14, based on the existing number of petrol stations within these respective boroughs [46]. Among these stations, Richmond exhibits the highest EV charging load, reaching a peak value of 2.8 MW. To accommodate this peak charging load, eight chargers are required within the charging stations. This calculation is based on the assumption that a 360 kW charger is necessary to charge an EV equipped with a 60 kWh battery. Consequently, by employing eight chargers, the peak charging load in Richmond can be adequately managed. Conversely, the SHS-EVCS in Hammersmith and Fulham experiences the lowest charging load, remaining below 1000 kW. Accordingly, three chargers with a capacity of 360 kW each are deemed sufficient.
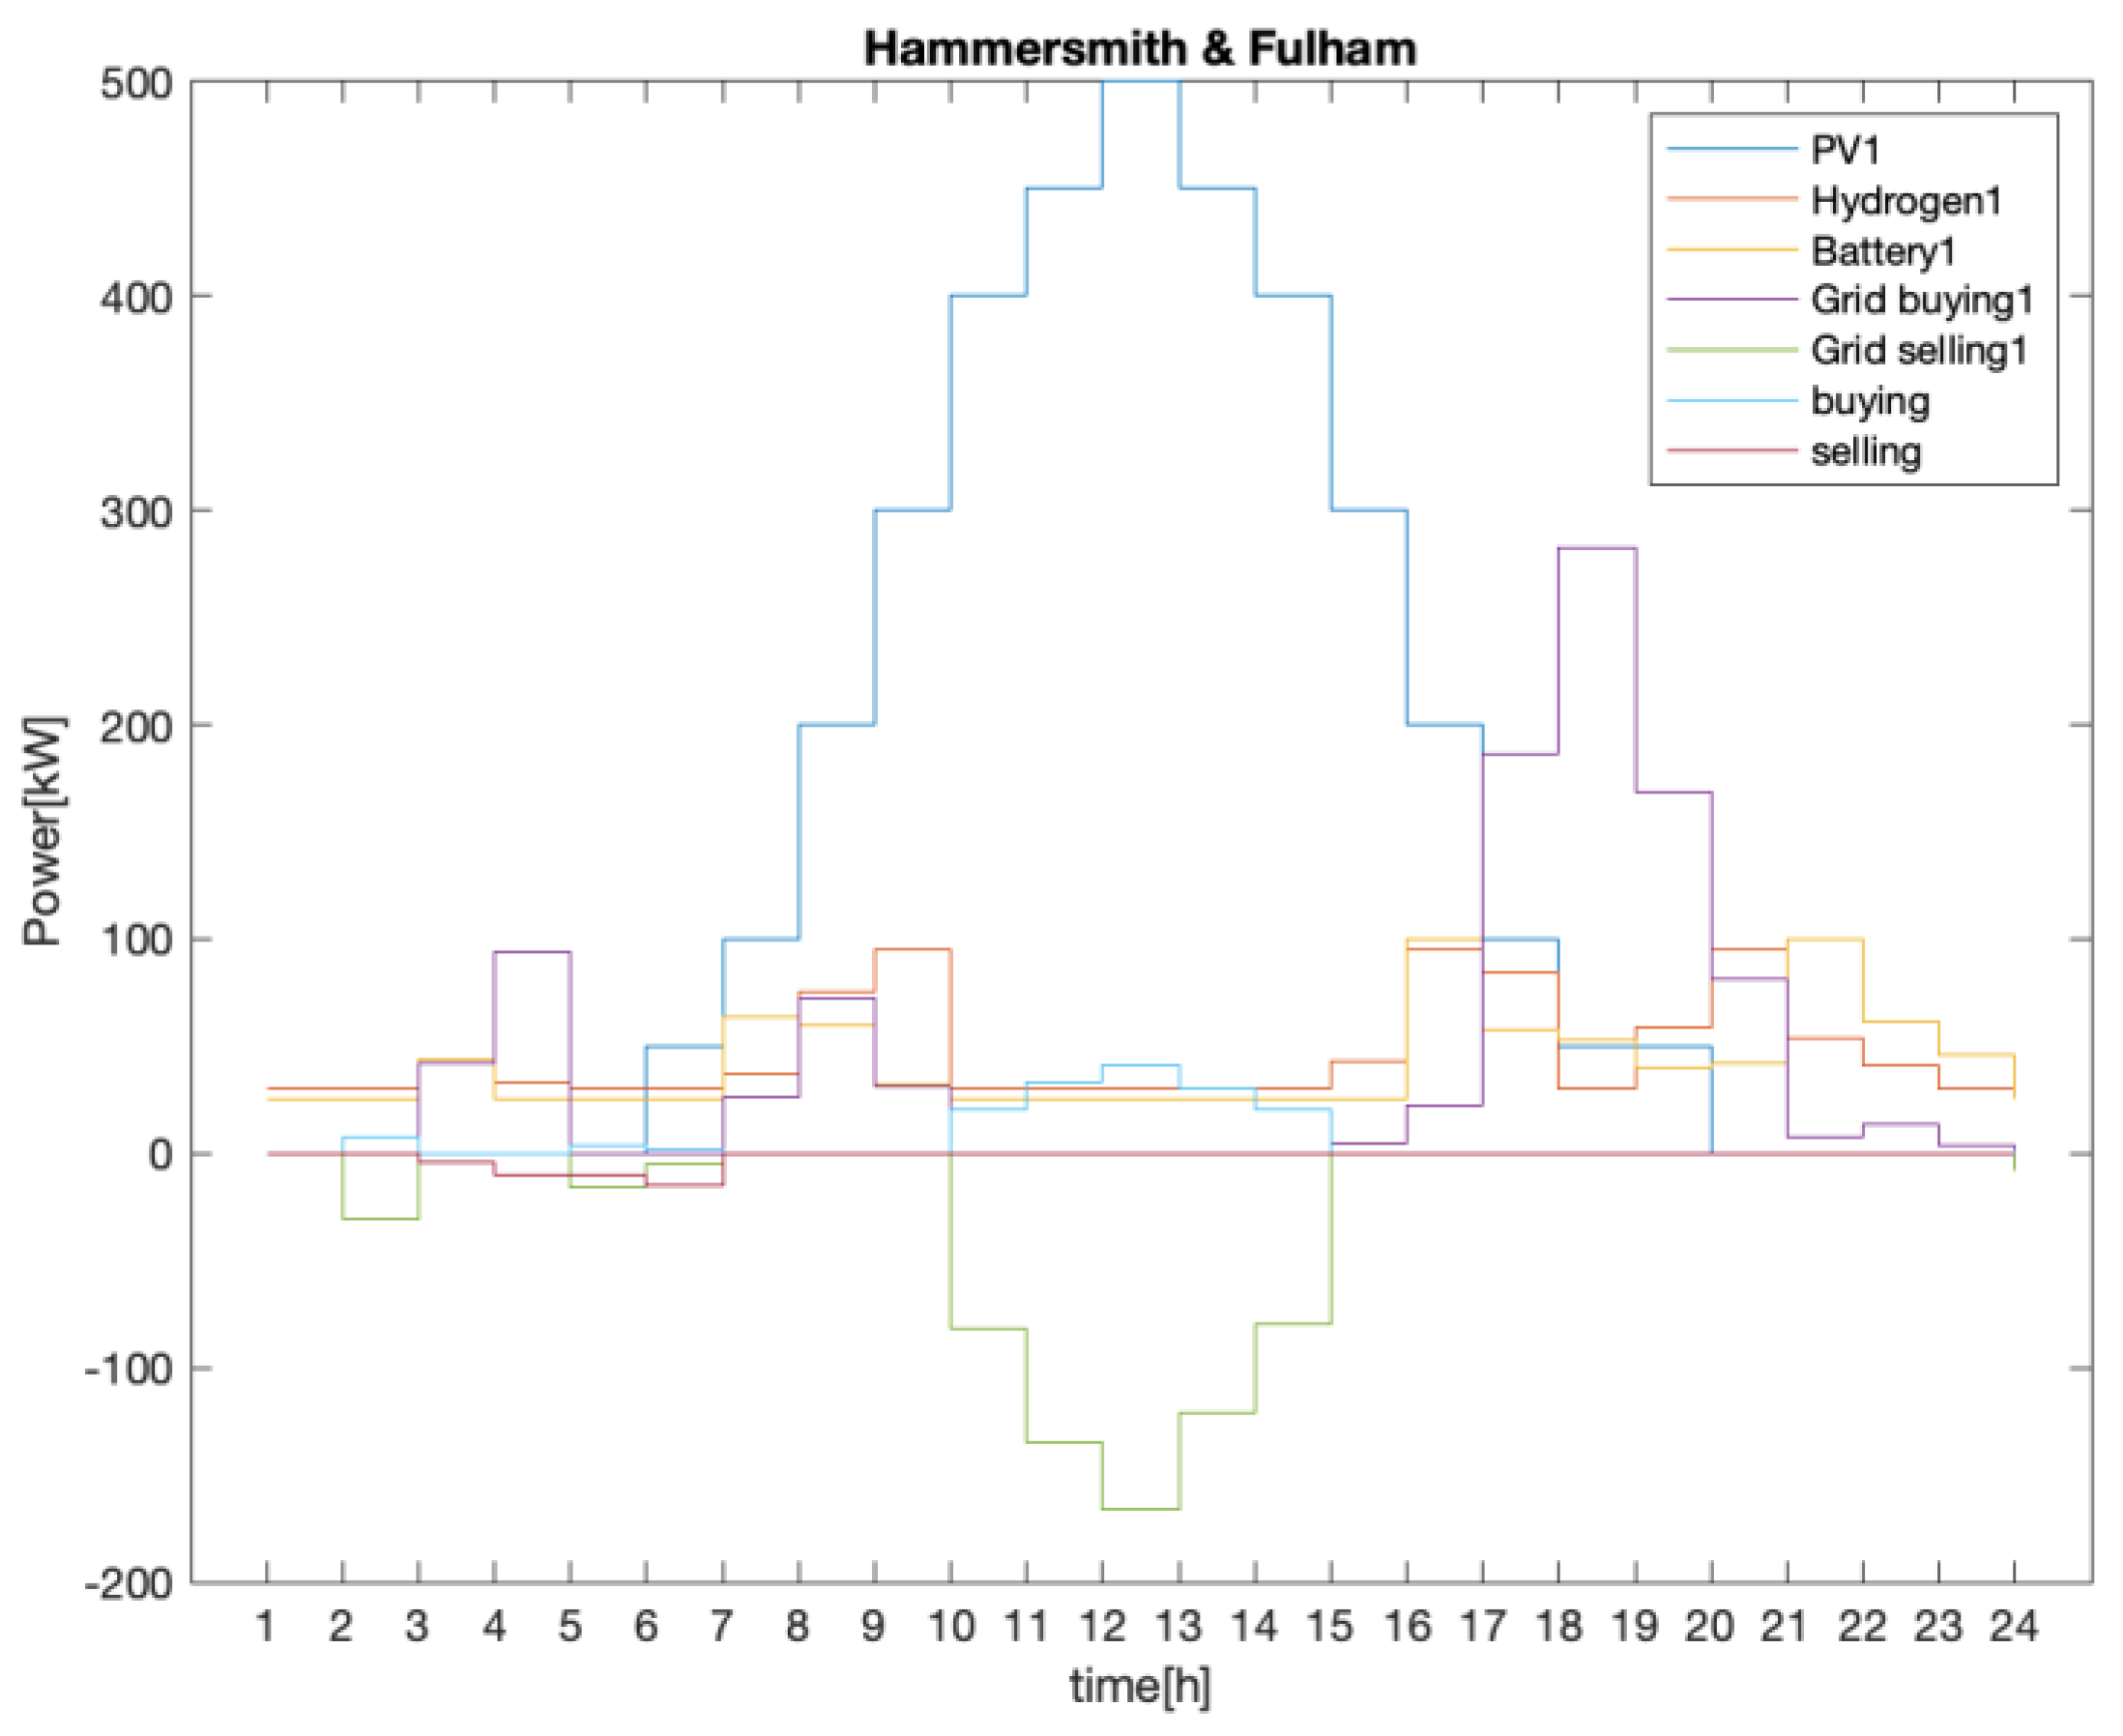
Figure 8 shows that solar energy plays a dominant role as the primary energy source between 7 am and 7 pm, with a maximum capacity of 500 kW. This heavy dependence on solar power emphasizes the importance of utilizing this renewable energy source to meet the energy demands necessary for charging EVs at the SHS-EVCSs during this specific time frame. To ensure a reliable and consistent energy supply throughout these hours, the charging station integrates both hydrogen energy storage and electric energy storage systems, working in synergy to effectively meet the changing requirements throughout the day.
Furthermore, during the period of 10:00 to 15:00, characterized by peak electricity prices, the SHS-EVCS engages with the power grid to ensure a sufficient supply of electricity. While relying on the power grid during these hours may entail considerable costs, it becomes imperative in order to meet the elevated energy demands for charging purposes. Nonetheless, the charging station optimizes its operational expenditures through the implementation of a time-of-use pricing strategy. By capitalizing on lower electricity prices during off-peak hours, the station procures electricity and stores it for subsequent utilization during peak hours. This strategic approach not only mitigates the financial burden associated with high electricity prices but also facilitates cost savings for the charging station.
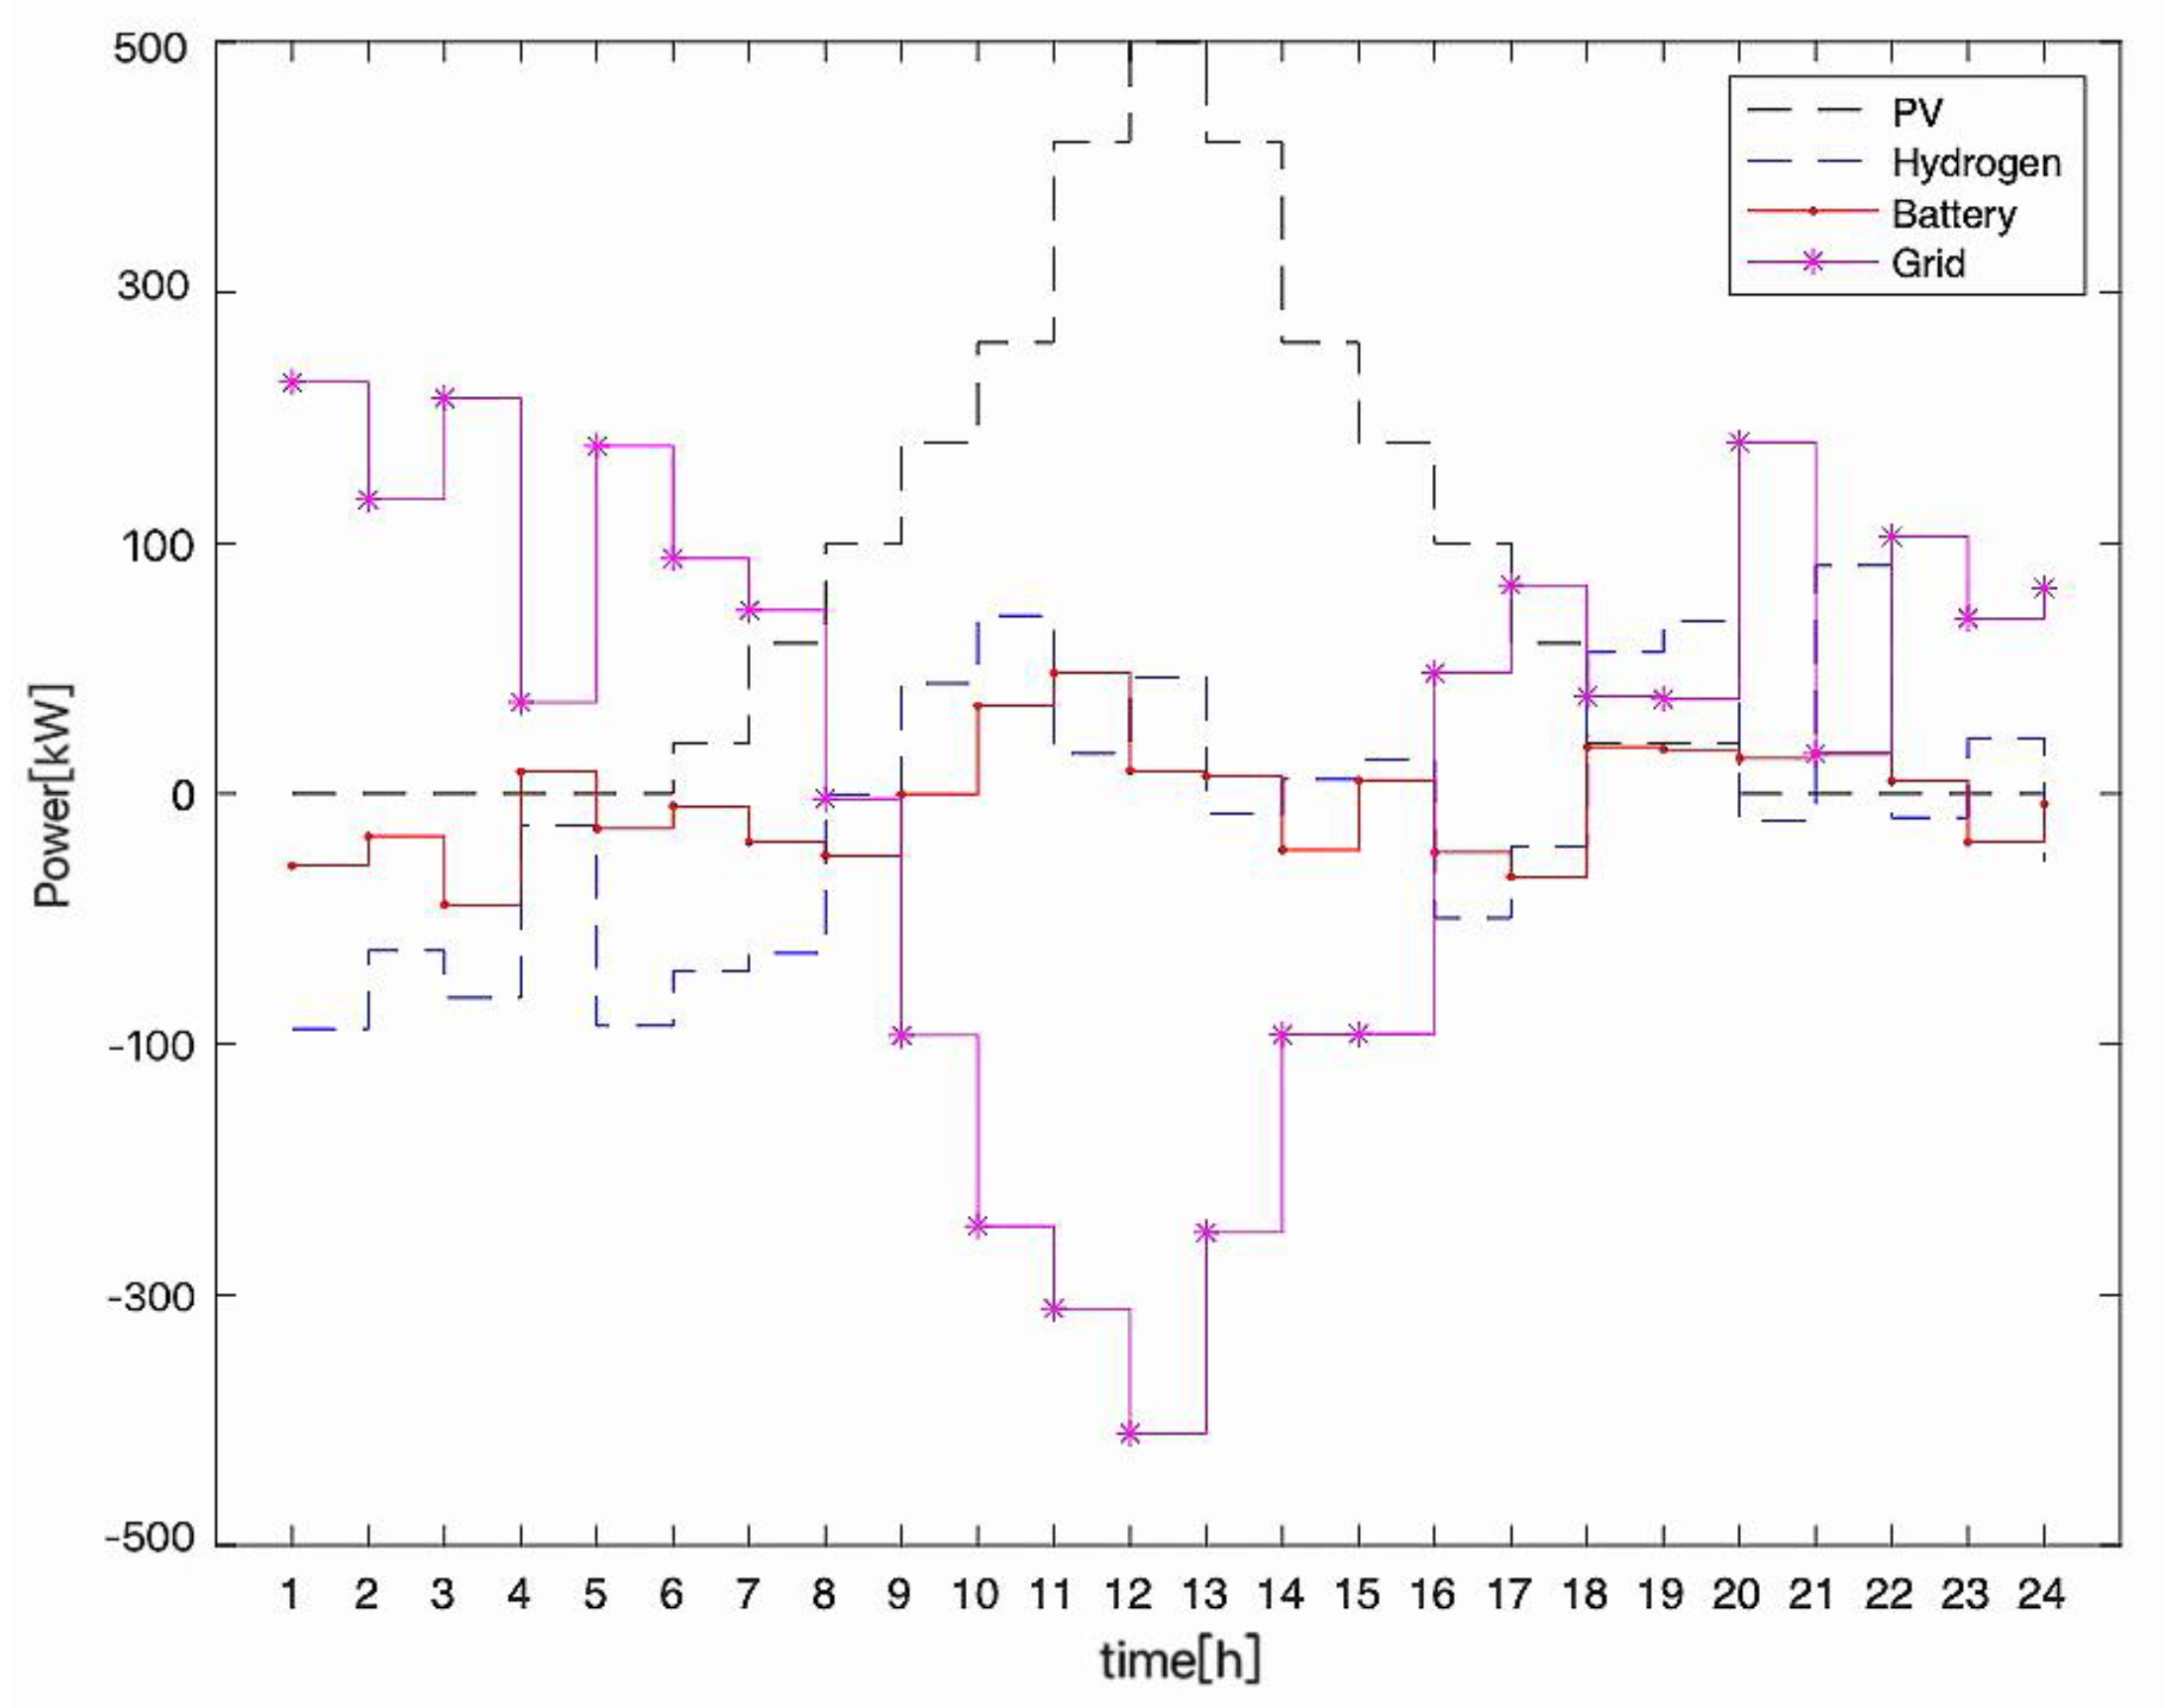
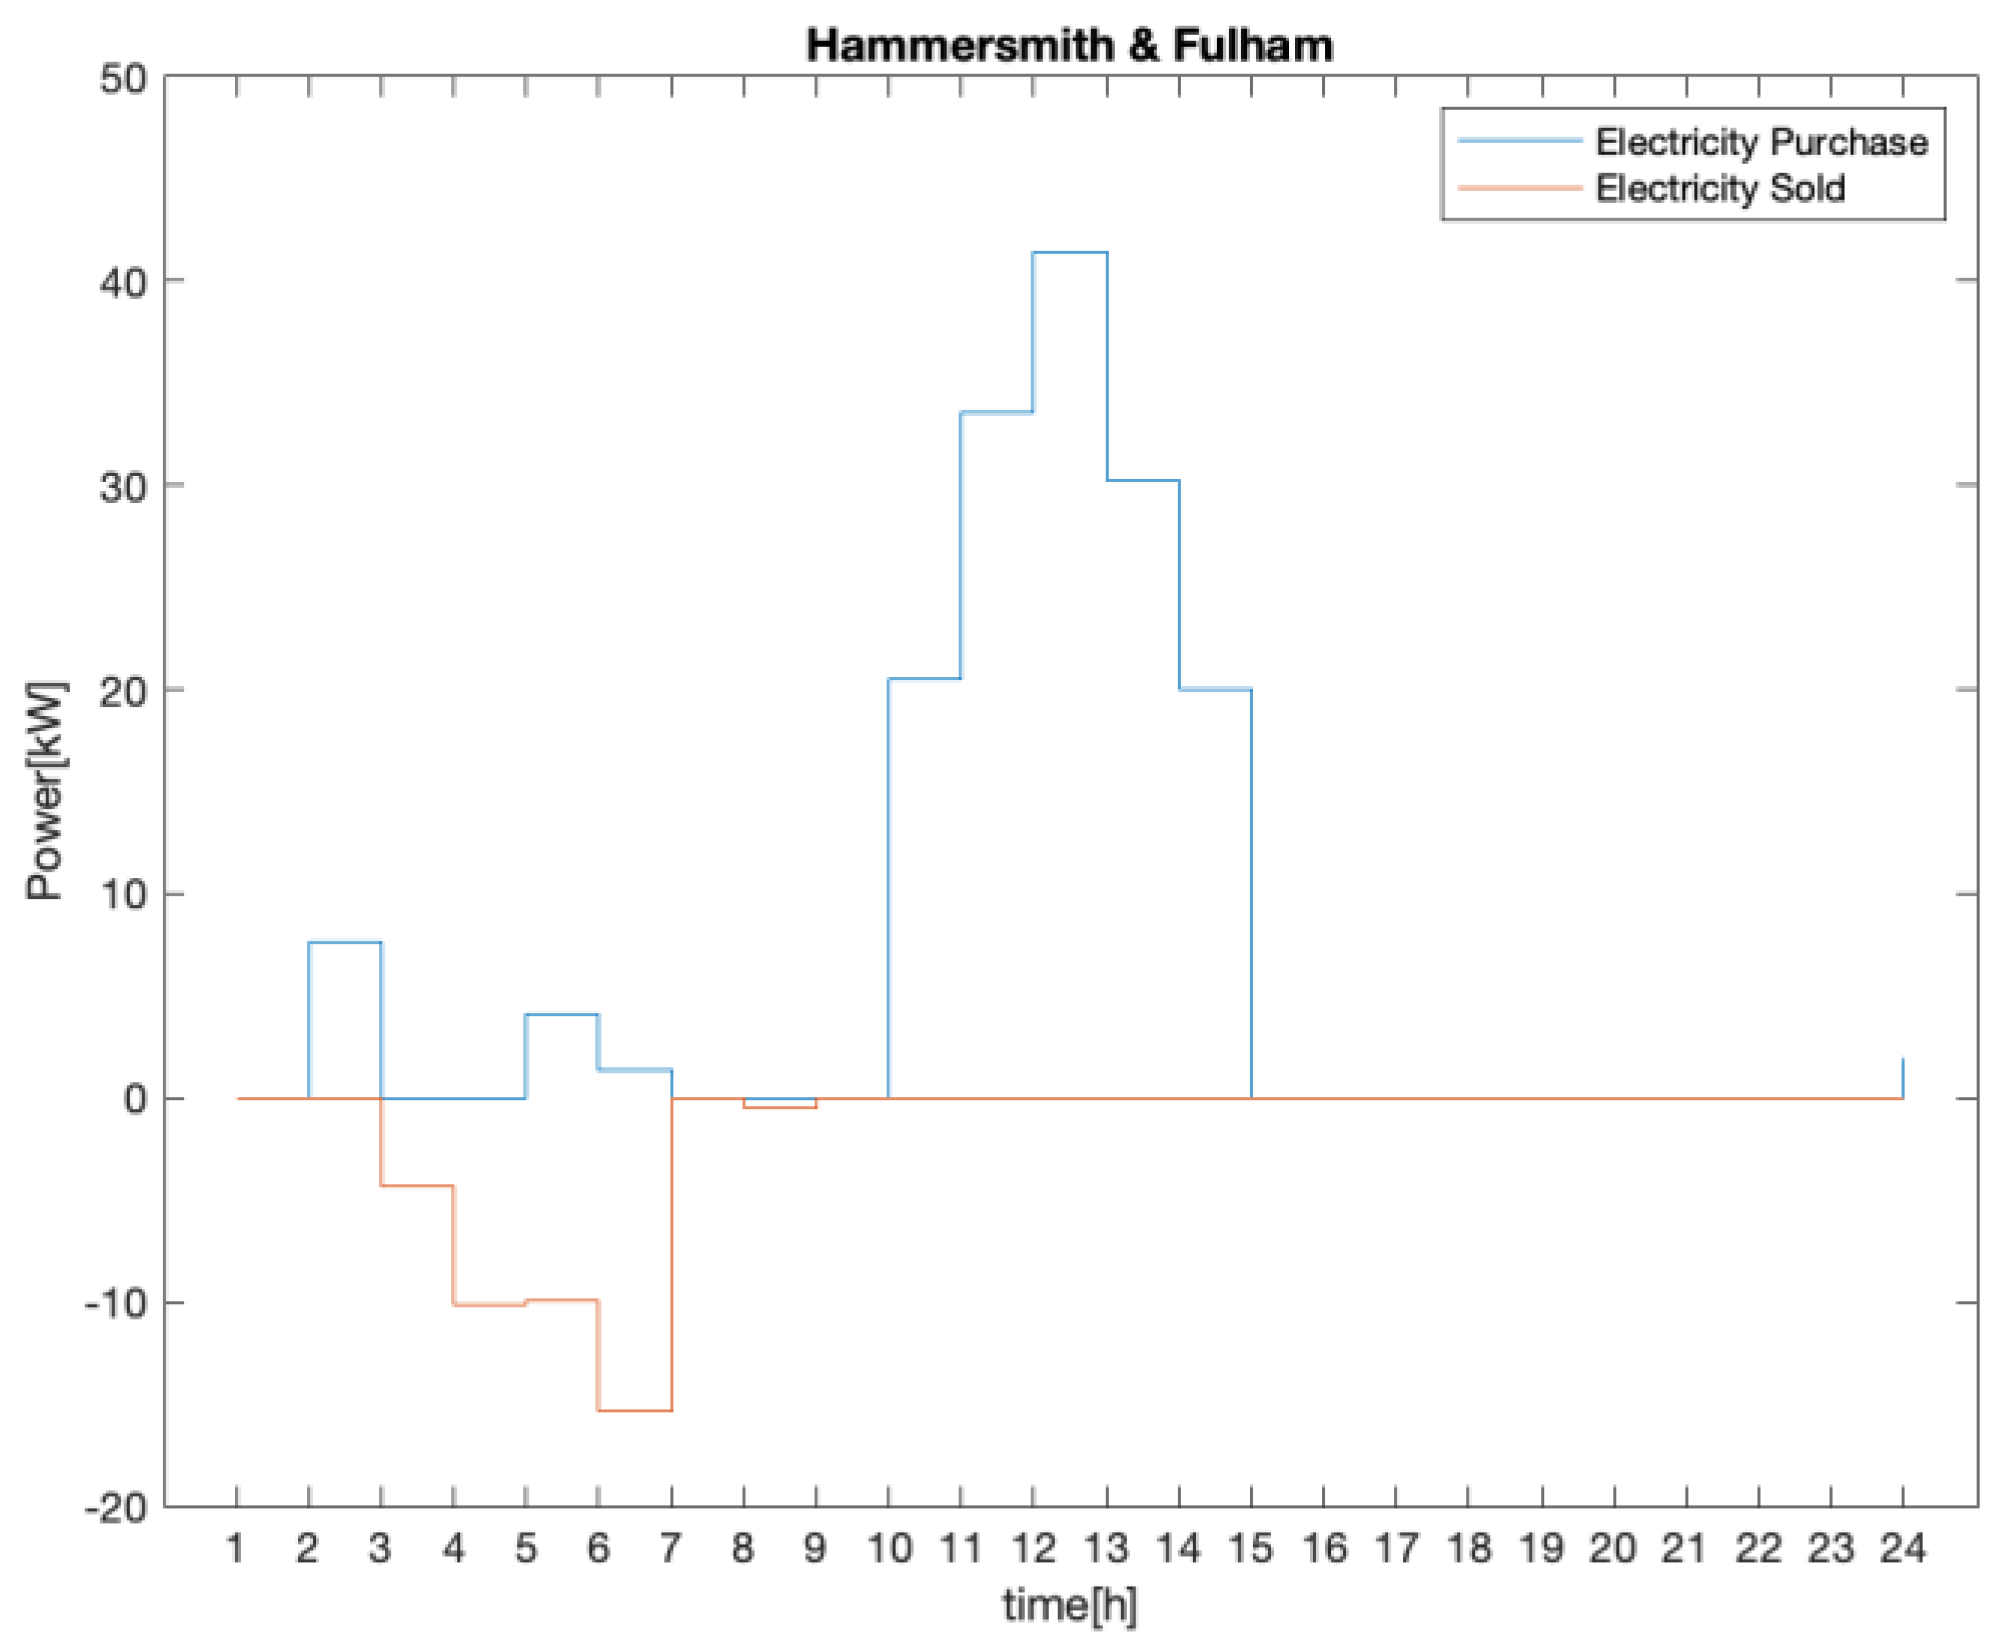
Figure 9 provides a depiction of the energy dispatch analysis conducted on a singular SHS-EVCS without energy exchange in the Hammersmith and Fulham area. The comparison between the two images shows that there is not a big difference between the two pictures but a reduction in grid electricity procurement is observed. Despite the absence of price information, the capital and O&M costs, as well as reduced expenses associated with greenhouses gas disposal, can be derived from the examination of the two graphs, which align with the two objective functions.
Figure 10 shows the energy exchange dynamics between two SHS-EVCSs within specified time intervals, wherein the power transfer is constrained with a maximum limit of 50 kW. The analysis depicted in Figure 11 reveals that when autonomous energy generation systems are integrated into the EVCSs and interconnected with the grid, the energy exchange between them becomes inconsequential. This finding implies that the impact of energy exchange on the cost minimization objective of the SHS-EVCSs is negligible somehow. By conducting a comprehensive analysis and optimizing the energy exchange dynamics between the charging stations, it becomes feasible to minimize the overall operating costs while concurrently ensuring an optimal energy supply.
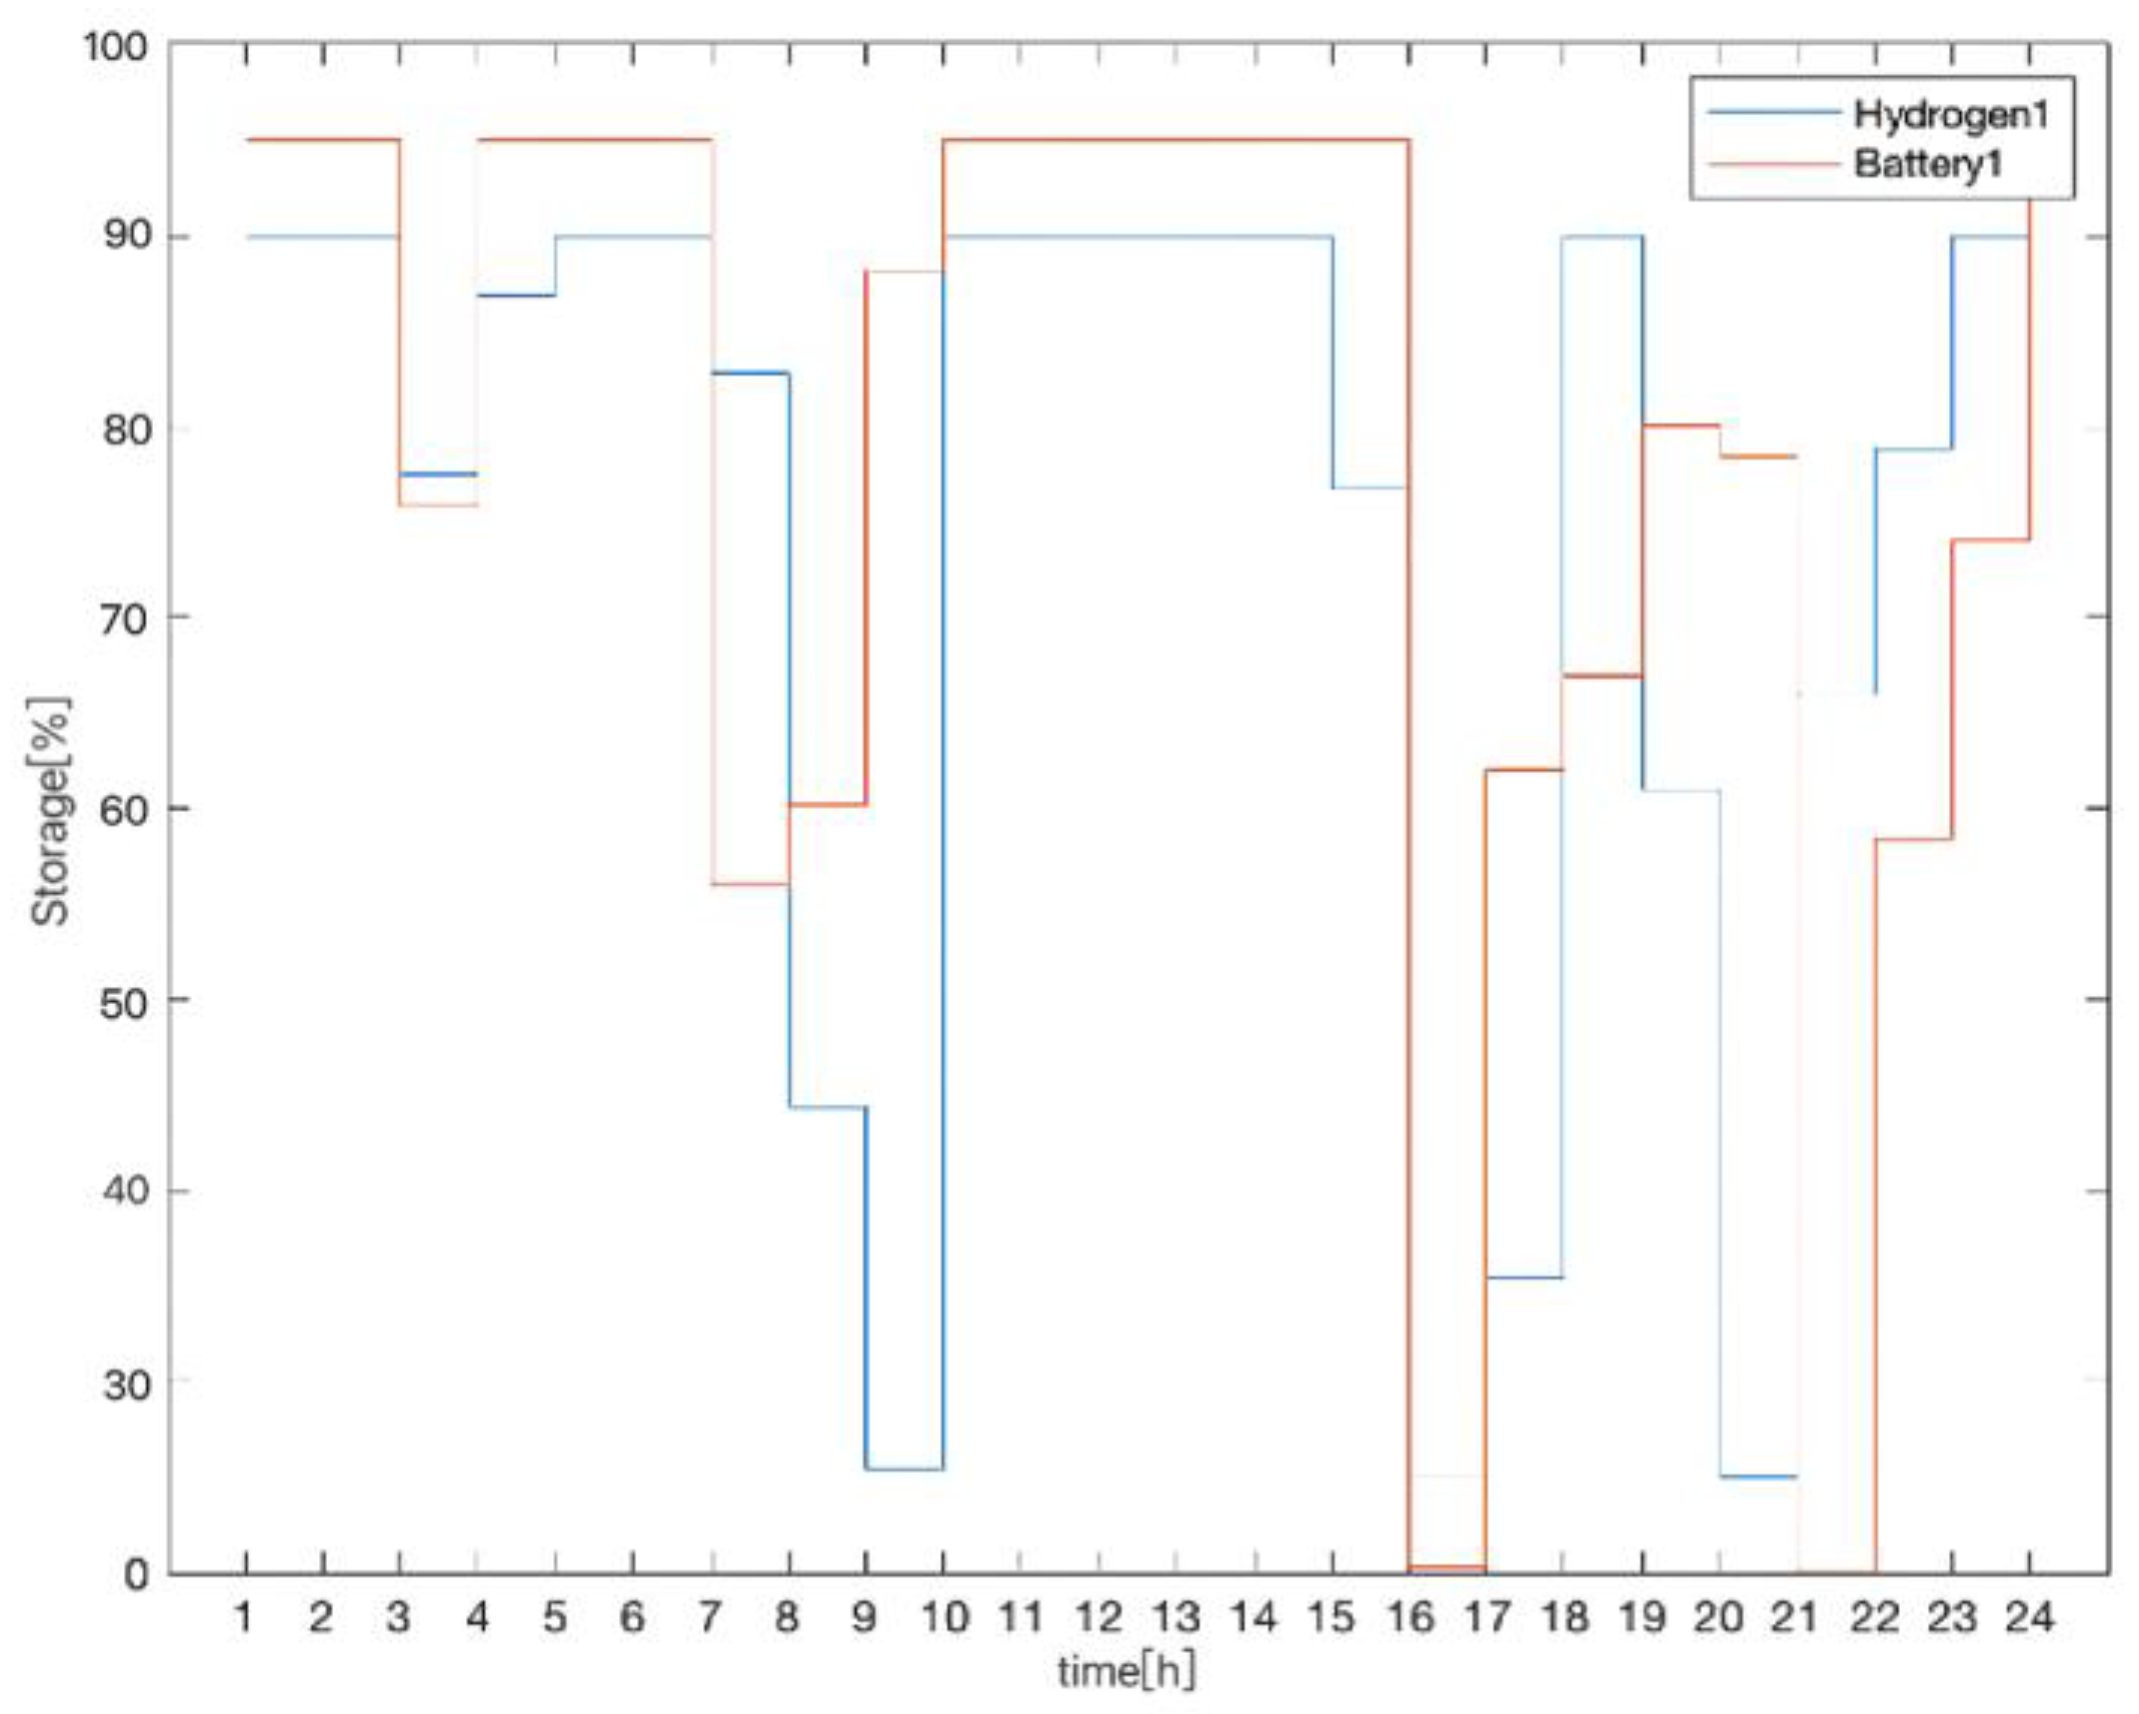
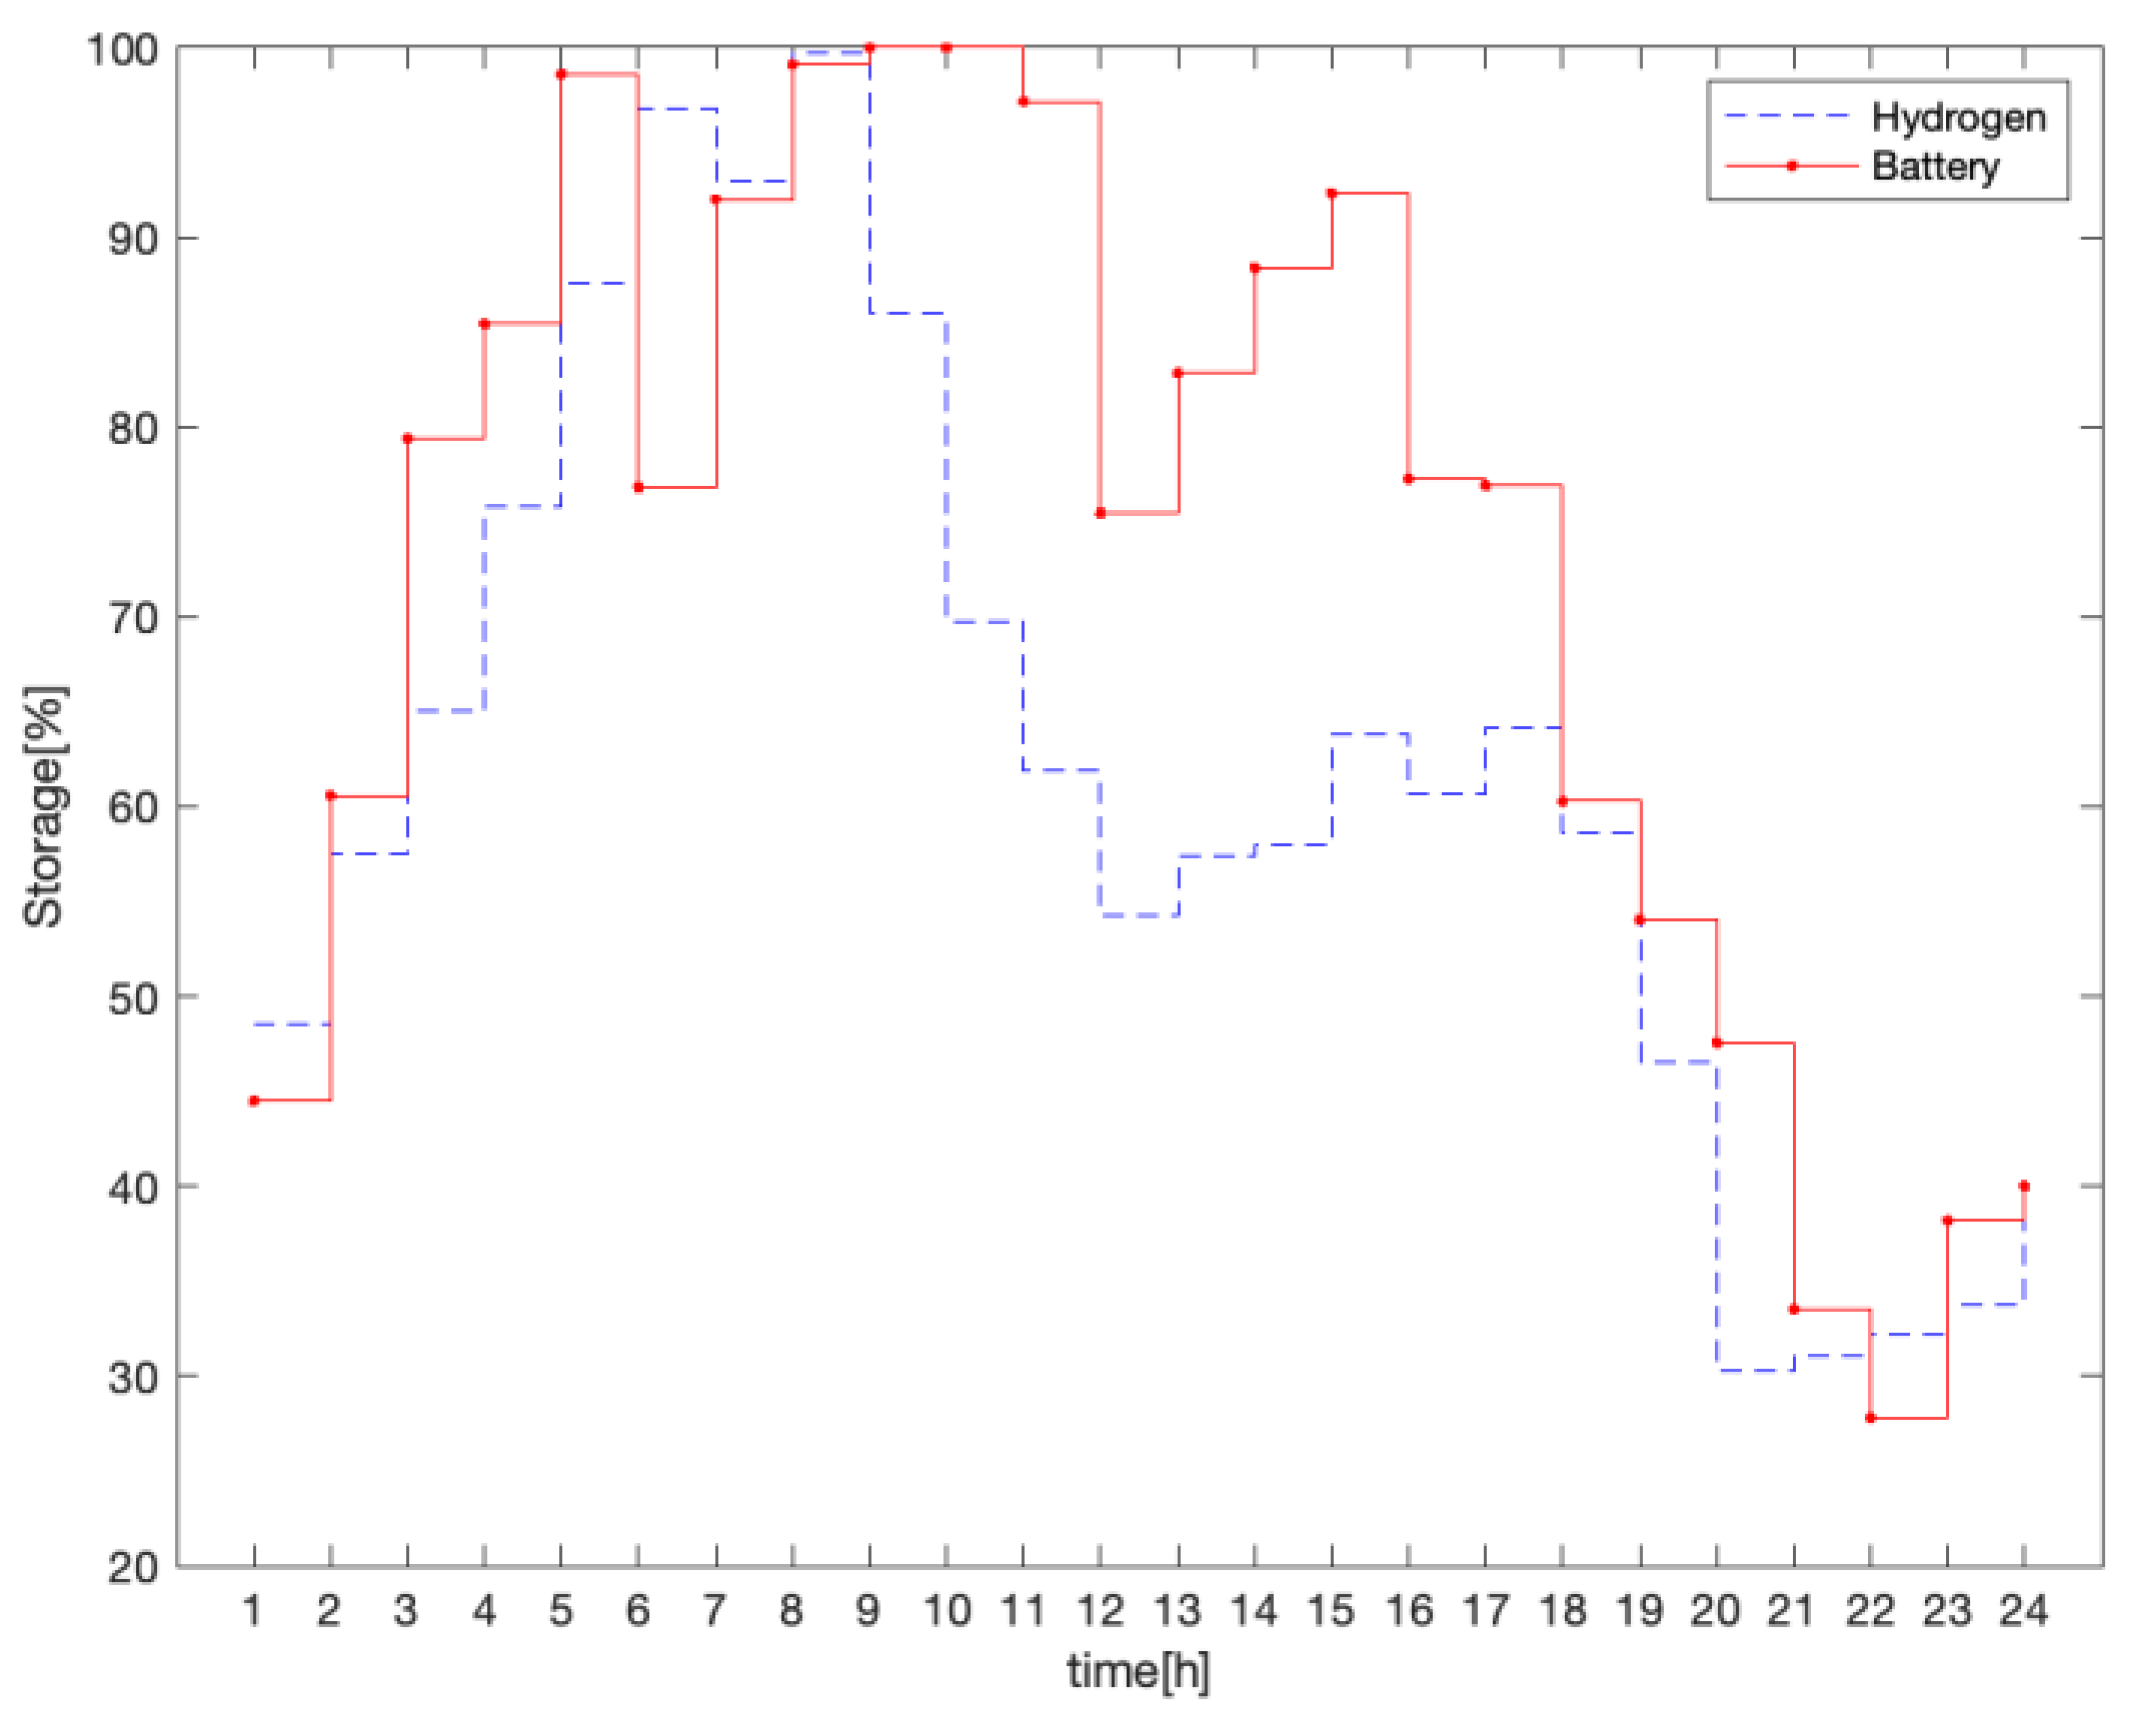
Based on the energy storage depicted in Figure 11 and Figure 12, we observe that hydrogen and battery energy storage are mostly used in the case of energy exchange during specific time periods. These time periods include 8:00 am to 10:00 am, 4:00 pm to 5:00 pm, and 9:00 pm to 10:00 pm. Additionally, during midnight hours, these two energy sources are mostly used in the case of without energy exchange.
Figure 13 demonstrates point A is the Utopia point, and the B area is the Pareto front with valid Pareto optimal solutions. The superior performance of NSGA-II over MOEA/D is evident in this research paper. The effectiveness of NSGA-II is evident, as it outperforms MOEA/D in terms of optimization objectives, particularly in achieving better cost outcomes. The results indicate that NSGA-II offers a more efficient and effective approach to optimization compared to MOEA/D, making it a favourable choice for the given objectives.
Table 8 provides essential insights into the economic aspects of two SHS-EVCSs, focusing on capital and O&M costs. It is worth noting that when the SHS-EVCS is expected to last 10 years and undergoes daily maintenance with component replacements every decade, the daily cost amounts to a modest GBP 4761.13. A comparison with the data in Table 9 clearly demonstrates that the daily cost for the two conventional charging stations is three times higher than that of the SHS-EVCS. This comparison underscores the significant advantage of employing energy conversion within SHS-EVCSs, resulting in optimized energy utilization and reduced operational expenses. Considering the safety concerns associated with hydrogen, an alternative design approach is to eliminate the utilization of hydrogen energy in SHS-EVCS. In contrast to employing hydrogen energy, the decision to forgo hydrogen in SHS-EVCS would lead to a minimum daily expenditure increase of at least GBP 500. While this cost is relatively economical when contrasted with solely procuring electricity from the grid, it remains insufficient to meet the minimum cost threshold. There are other factors such as supply chain costs, labour costs, energy prices, taxation, etc., that will affect the installation and O&M costs, but this paper is focused on the technical part. These questions will be considered in the future work.
Nevertheless, it is imperative to carefully evaluate the necessary adaptations when integrating these stations with the larger power grid. These adjustments inevitably incur additional costs, necessitating thorough consideration. Striking a delicate balance between these costs and the associated benefits assumes paramount importance, particularly in the pursuit of promoting sustainable transportation practices.

5. Conclusions

This study introduces a novel multi-objective optimization model for EV charging stations, which considers both economic and environmental factors. Specifically, NSGO-II and MOEA/D algorithms are employed to optimize the rated power of distributed energy resources and the capacity of the energy storage system for SHS-EVCS. By comparing the optimization results obtained from both algorithms, it becomes evident that the proposed optimization method exhibits certain advantages. Notably, it offers a comprehensive consideration of various influential factors, leading to the attainment of optimal trade-off results. Through meticulous management of the energy flow among various sources, such as solar power, hydrogen energy storage, electric energy storage, and the power grid, the charging station ensures an energy supply that is cost-effective depending on the minimum daily costs. This comprehensive approach to energy optimization enables the station to meet the fluctuating energy demands for charging electric vehicles while minimizing expenses and maximizing sustainability.

Author Contributions

Conceptualization, L.D. and C.S.L.; methodology, L.D., Z.G., and C.S.L.; software, L.D.; validation, L.D.; formal analysis, L.D.; investigation, L.D.; resources, L.D.; data curation, L.D.; writing—original draft preparation, L.D.; writing—review and editing, L.D., Z.G., C.S.L. and G.T.; visualization, L.D.; supervision, C.S.L. and G.T.; project administration, C.S.L. and G.T. All authors have read and agreed to the published version of the manuscript.

Funding

This research received no external funding.

Data Availability Statement

Not applicable.

Conflicts of Interest

The authors declare no conflict of interest.

References

  1. Zeng, J.; Li, M.; Liu, J.F.; Wu, J.; Ngan, H.W. Operational optimization of a stand-alone hybrid renewable energy generation system based on an improved genetic algorithm. In Proceedings of the 2010 IEEE Power and Energy Society General Meeting, Providence, RI, USA, 25–29 July 2010. [Google Scholar]
  2. Tushar, W.; Yuen, C.; Huang, S.; Smith, D.B.; Poor, H.V. Cost minimization of charging stations with photovoltaics: An approach with EV classification. IEEE Trans. Intell. Transp. Syst. 2016, 17, 156–169. [Google Scholar] [CrossRef]
  3. Keyhani, A. Design of Smart Power Grid Renewable Energy Systems; John Wiley & Sons: Hoboken, NJ, USA, 2019; pp. 1–606. [Google Scholar]
  4. Das, H.; Rahman, M.; Li, S.; Tan, C. Electric vehicles standards, charging infrastructure, and impact on grid integration: A technological review. Renew. Sustain. Energy Rev. 2019, 120, 109618. [Google Scholar] [CrossRef]
  5. Bohnsack, R.; Pinkse, J.; Kolk, A. Business models for sustainable technologies: Exploring business model evolution in the case of electric vehicles. Res. Policy 2013, 43, 284–300. [Google Scholar] [CrossRef]
  6. Markkula, J.; Rautiainen, A.; Jäventausta, P. The business case of electric vehicle quick charging—No more chicken or egg problem. World Electr. Veh. J. 2013, 6, 921–927. [Google Scholar] [CrossRef]
  7. Madina, C.; Zamora, I.; Zabala, E. Methodology for assessing electric vehicle charging infrastructure business models. Energy Policy 2015, 89, 284–293. [Google Scholar] [CrossRef]
  8. EV Charging Statistics 2023. Zap-map.Com. Available online: https://www.zap-map.com/ev-stats/how-many-charging-points (accessed on 31 August 2023).
  9. Hawkins, A. Tesla Vehicles Can Soon Be Charged at EV Go Charging Stations in the US. Available online: https://www.theverge.com/2019/12/19/21030330/tesla-evgo-ev-charging-station-us-ccs-chademo (accessed on 19 December 2019).
  10. Chen, T.; Zhang, X.P.; Wang, J.; Li, J.; Wu, C.; Hu, M.; Bian, H. A review on electric vehicle charging infrastructure development in the UK. J. Mod. Power Syst. Clean Energy 2020, 8, 193–205. [Google Scholar] [CrossRef]
  11. Sehar, F.; Pipattanasomporn, M.; Rahman, S. Demand management to mitigate impacts of plug-in electric vehicle fast charge in buildings with renewables. Energy 2016, 120, 642–651. [Google Scholar] [CrossRef]
  12. Arias, M.B.; Bae, S. Prediction of electric vehicle charging-power demand in realistic urban traffic networks. Appl. Energy 2017, 195, 738–753. [Google Scholar] [CrossRef]
  13. International Energy Agency. Global EV Outlook 2019—Analysis. Available online: https://www.iea.org/reports/global-ev-outlook-2019 (accessed on 30 May 2019).
  14. Yu, J.; Lam, A.; Tan, S. Energy exchange coordination of off-grid charging stations with vehicular energy network. In Proceedings of the 2017 IEEE International Conference on Smart Grid Communications (SmartGridComm), Dresden, Germany, 23–27 October 2017; pp. 375–380. [Google Scholar]
  15. Cao, C.; Wu, Z.; Chen, B. Electric Vehicle–grid integration with voltage regulation in radial distribution networks. Energies 2020, 13, 1802. [Google Scholar] [CrossRef]
  16. Khan, W.; Ahmad, F.; Alam, M.S. Fast EV charging station integration with grid ensuring optimal and quality energy exchange. Eng. Sci. Technol. Int. J. 2019, 22, 143–152. [Google Scholar]
  17. Panchanathan, S.; Vishnuram, P.; Rajamanickam, N.; Bajaj, M.; Blazek, V.; Prokop, L.; Misak, S. A comprehensive review of the bidirectional converter topologies for the Vehicle-to-Grid system. Energies 2023, 16, 2503. [Google Scholar] [CrossRef]
  18. Chang, M.; Bae, S.; Cha, G.; Yoo, J. Aggregated electric vehicle fast-charging power demand analysis and forecast based on LSTM neural network. Sustainability 2021, 13, 13783. [Google Scholar] [CrossRef]
  19. Zhao, Z.; Lee, C.K.M.; Huo, J. EV charging station deployment on coupled transportation and power distribution networks via reinforcement learning. Energy 2023, 267, 126555. [Google Scholar] [CrossRef]
  20. Jan, E.; Jan, M.Z.; Tatiana, G.; Mattia, M. Energy management of a multi-battery system for renewable-based high power EV charging. eTransportation 2022, 14, 100198. [Google Scholar]
  21. Rehman, W.; Bo, R.; Mehdipourpicha, H.; Kimball, J.W. Sizing battery energy storage and PV system in an extreme fast charging station considering uncertainties and battery degradation. Appl. Energy 2022, 313, 118745. [Google Scholar] [CrossRef]
  22. Li, D.; Zouma, A.; Liao, J.; Yang, H. An energy management strategy with renewable energy and energy storage system for a large electric vehicle charging station. eTransportation 2020, 6, 100076. [Google Scholar] [CrossRef]
  23. Shafiei, M.; Ghasemi, M.A. Electric vehicle fast charging station design by considering probabilistic model of renewable energy source and demand response. Energy 2023, 267, 126545. [Google Scholar] [CrossRef]
  24. Mehrjerdi, H.; Hemmati, R. Electric vehicle charging station with multilevel charging infrastructure and hybrid solar-battery-diesel generation incorporating comfort of drivers. J. Energy Storage 2019, 26, 100924. [Google Scholar] [CrossRef]
  25. Krishnamurthy, N.K.; Sabhahit, J.N.; Jadoun, V.K.; Gaonkar, D.N.; Shrivastava, A.; Rao, V.S.; Kudva, G. Optimal placement and sizing of electric vehicle charging infrastructure in a grid-tied DC microgrid using modified TLBO Method. Energies 2023, 16, 1781. [Google Scholar] [CrossRef]
  26. Mohan, H.M.; Dash, S.K. Renewable energy-based DC microgrid with hybrid energy management system supporting electric vehicle charging system. Systems 2023, 11, 273. [Google Scholar] [CrossRef]
  27. Alshammari, N.F.; Samy, M.M.; Barakat, S. Comprehensive analysis of multi-objective optimization algorithms for sustainable hybrid electric vehicle charging systems. Mathematics 2023, 11, 1741. [Google Scholar] [CrossRef]
  28. Wu, Z.; Bhat, P.K.; Chen, B. Optimal configuration of extreme fast charging stations integrated with energy storage system and photovoltaic panels in distribution networks. Energies 2023, 16, 2385. [Google Scholar] [CrossRef]
  29. Ahmed, H.Y.; Ali, Z.M.; Refaat, M.M.; Aleem, S.H.E.A. A multi-objective planning strategy for electric vehicle charging stations towards low carbon-oriented modern power systems. Sustainability 2023, 15, 2819. [Google Scholar] [CrossRef]
  30. Duan, L.; Lai, C.S.; Taylor, G.; Zhang, X. Optimal energy exchange of two electric vehicle charging stations with solar-hydrogen-battery storage systems. In Proceedings of the 2023 58th International Universities Power Engineering Conference (UPEC 2023), Dublin, Ireland, 29 August–1 September 2023. [Google Scholar]
  31. Yan, B.; Luh, P.B.; Warner, G. Operation and design optimization of microgrids with renewables. IEEE Trans. Autom. Sci. Eng. 2017, 14, 573–585. [Google Scholar] [CrossRef]
  32. Van, L.P.; Do, C.K.; Duc, T.N. Review of hydrogen technologies based microgrid: Energy management systems, challenges and future recommendations. Int. J. Hydrogen Energy 2023, 48, 14127–14148. [Google Scholar] [CrossRef]
  33. Li, C.B.; Zhang, J.Y.; Li, P. Multi-objective optimization model of micro-grid operation considering cost, pollution discharge and risk. Proc. CSEE 2015, 35, 13334. [Google Scholar]
  34. Zhu, L.; Yan, Z.; Yang, X.; Fu, Y.; Chen, J. Optimal configuration of battery capacity in microgrid composed of wind power and photovoltaic generation with energy storage. Power Syst. Technol. 2012, 12, 26–31. [Google Scholar]
  35. Delyová, I.; Frankovský, P.; Bocko, J.; Trebuňa, P.; Živčák, J.; Schürger, B.; Janigová, S. Sizing and topology optimization of trusses using genetic algorithm. Materials 2021, 14, 715. [Google Scholar] [CrossRef]
  36. Yan, Y.; Du, H.P.; He, D.F.; Li, W.H. Pareto Optimal Information Flow Topology for Control of Connected Autonomous Vehicles. IEEE Trans. Intell. Veh. 2023, 8, 330–343. [Google Scholar] [CrossRef]
  37. Ibrahim, A.E.; Nor, N.M.; Nawi, I.B.M.; Mohd, F.R.; Mohd, K.N. Genetic algorithm to improve power output of photovoltaic system under partial shaded condition. Int. J. Power Electron. Drive Syst. (IJPEDS) 2019, 10, 2182. [Google Scholar] [CrossRef]
  38. Bianco, N.; Fragnito, A.; Iasiello, M.; Mauro, G.M.; Mongibello, L. Multi-objective optimization of a phase change material-based shell-and-tube heat exchanger for cold thermal energy storage: Experiments and numerical modeling. Appl. Therm. Eng. 2022, 215, 119047. [Google Scholar] [CrossRef]
  39. Deb, K.; Pratap, A.; Agarwal, S.; Meyarivan, T. A fast and elitist multi-objective genetic algorithm: NSGA-II. IEEE Trans. Evol. Comput. 2002, 6, 182–197. [Google Scholar] [CrossRef]
  40. Deb, K.; Jan, H. An evolutionary many-objective optimization algorithm using reference-point-based nondominated sorting approach, Part I: Solving problems with box constraints. IEEE Trans. Evol. Comput. 2014, 18, 577–601. [Google Scholar] [CrossRef]
  41. Zhou, B.; Littler, T.; Meegahapola, L.; Zhang, H. Power system steady-state analysis with large-scale electric vehicle integration. Energy 2016, 115, 289–302. [Google Scholar] [CrossRef]
  42. London Geographic Map. Zap-map.Com. 2023. Available online: https://www.zap-map.com/live/ (accessed on 30 September 2023).
  43. Barakat, S.; Samy, M.M. A Hybrid Photovoltaic/Wind Green Energy System for Outpatient Clinic Utilizing Fuel Cells and Different Batteries as a Storage Devices. In Proceedings of the 2022 23rd International Middle East Power Systems Conference (MEPCON), Cairo, Egypt, 13–15 December 2022; pp. 1–6. [Google Scholar]
  44. Allan, M. Hydrogen Cars: How the Fuel Cell Works, Where the UK’s Filling Stations Are and How Expensive They Are to Run. The Scotsman. Available online: https://www.scotsman.com/lifestyle/cars/hydrogen-cars-how-the-fuel-cell-works-where-the-uks-filling-stations-are-and-how-expensive-they-are-to-run-1386285# (accessed on 23 November 2022).
  45. Li, S. Research on Optimization Operation of Microgrid Based on Genetic Simulated Annealing Particle Swarm Algorithm. Master’s Thesis, Nanjing University of Posts and Telecommunications, Nanjing, China, 2020. [Google Scholar]
  46. London Assembly Petrol Stations. London.gov.uk. Available online: https://www.london.gov.uk/who-we-are/what-london-assembly-does/questions-mayor/find-an-answer/petrol-stations (accessed on 18 June 2020).
Figure 1. Charging stations by type in the UK [8].
Electronics 12 04149 g001
Figure 2. The flowchart of SHS-EV charging station using NSGA-II optimization.
Electronics 12 04149 g002
Figure 3. The flow chart of SHS-EVCS using MOEA/D optimization.
Electronics 12 04149 g003
Figure 4. Prototype design of SHS-EVCS.
Electronics 12 04149 g004
Figure 5. Energy exchange between two SHS-EVCSs.
Electronics 12 04149 g005
Figure 6. Hammersmith and Fulham and Richmond upon Thames geographic location [42].
Electronics 12 04149 g006
Figure 7. Daily EV load curves in two London boroughs for SHS-EV charging station according to annual average.
Electronics 12 04149 g007
Figure 8. Hammersmith and Fulham optimal energy dispatch solution (with energy exchange).
Electronics 12 04149 g008
Figure 9. Hammersmith and Fulham optimal energy dispatch solution (without energy exchange).
Electronics 12 04149 g009
Figure 10. Energy exchange between two SHBS-EV charging stations.
Electronics 12 04149 g010
Figure 11. Hydrogen and battery energy storage for 24 h (with energy exchange).
Electronics 12 04149 g011
Figure 12. Hydrogen and battery energy storage for 24 h (without energy exchange).
Electronics 12 04149 g012
Figure 13. NSGA-II and MOEA/D comparison.
Electronics 12 04149 g013
Table 1. Power rating of four types of charging stations [8].
TypeSlowFastRapidUltra-Rapid
Power Rating (kW)3–67–2225–99100
Table 2. Literature review and benchmark of relevant work.
Ref.EV Charging Station Energy SourcesObjective FunctionCountryEnergy Exchange AppliedSolving MethodResults
[20]PV, battery, gridMaximize the charging station self-sufficiency and decrease the number of battery cycles. DenmarkDistribution networkMonte Carlo simulationThe enhanced control reduces the number of battery cycles
[21]Battery storage, PVMinimize the annualized total costUSAN/ARobust-optimization-based mixed integer linear programming modelMILP-based optimization model to obtain BESS and PV system sizing and optimal energy management
[22]Grid, PV, energy storage systemMinimize the total cost of charging and discharging EVs during their stay in the charging stationChinaDistribution networkCharging and discharging power scheduling algorithm solved with a chance constrained programming method The proposed contract capacity optimization algorithm yields a range of unanimous eligible contract capacity sizes
[23]PV, battery storage, wind, gridMaximize the net present value (NPV) of the investor’s profit during the useful lifeIranDistribution networkFuzzy-neural network and improved particle swarm optimizationProfitability increased by 6% on average
[24]Diesel generator, PV, battery storageMinimize the annualized costQatar Distribution networkGaussian probability distribution functionThe proposed model successfully designs the available energy resources and the objectives such as minimizing cost
[25]PV, wind, fuel cell, gridMinimize the capital and O&M cost; optimal place and sizeIndiaDistribution networkModified teaching–learning-based optimizationThe minimum value of cost obtained is USD 2.0250 × 10⁶. The CSs are optimally placed at bus numbers 2, 19, and 20 and 16, 43, and 107 on 33 and 123 test systems
[26]PV, fuel cell, battery storageThe balance of the terminal power of the power components under consideration and the quick regulationIndiaDistribution networkFuzzy sparrow search algorithm and particle swarm optimizationThe hybrid SSA-based response is effective and efficient
[27]PV, wind, batteryMinimize the total net present cost and minimize loss of power supply probabilitySaudi ArabiaDistribution networkMOPSO, NASG-II, NSGA-III, MOEA/DNSGA-II achieved the highest overall performance among the four algorithms, with the best scores for convergence and diversity. NSGA-III had the highest efficiency score, while MOPSO attained the highest diversity score
[28]PV, energy storage systemMinimize the capital costUSADistribution networkA novel Monte Carlo simulation tool A total annual cost savings of 26.55% at extreme fast charging 4 and 27.01% at extreme fast charging 8 due to reduced electricity purchases from the grid
[29]PV, energy storage system, fossil-fuel-based generation unitsMaximize EVs’ penetration, reduce the carbon dioxide emitted, and minimizing the capital and O&M costsSaudi ArabiaDistribution networkMulti-objective Gazelle Optimization Algorithm (MGOA),
multi-objective SALP swarm algorithm (MSSA),
multi-objective particle swarm optimization (MPSO)
The MGOA was superior in comparison with the MSSA and MPSO. The MGOA outperformed the MSSA and MPSO in terms of robustness and obtaining high-quality solutions when applied to solve the proposed problem
[30]PV, battery storage, hydrogen storage, gridMinimize the capital and O&M costs of the stationsUKDirect energy exchangeGAIt is nearly 3 times cheaper than buying electricity from grid
This workPV, grid, hydrogen storage, battery storage, other EV charging stationMinimize the capital and O&M cost; minimize the greenhouse gas emission costUKDirect energy exchangeNSGA-II and MOEA/DNSGA-II gives the optimal solution
Table 3. Key Settings in the Algorithms.
NSGA-II
Population Size100
Stopping Criteria200
Crossover Percentage0.8
Number of Parents80
Mutation Percentage0.4
Number of Mutants40
Mutation Rate0.01
MOEA-D
Population Size100
Stopping Criteria200
Number of Neighbours10
Crossover Percentage0.5
Table 4. Technical parameters of SHS-EVCS in two London boroughs [43,44].
ParametersHammersmith and FulhamRichmond upon Thames
Charger capacity (kW)360360
Number of chargers per station38
PV installed capacity (kW)5001000
Battery capacity (kWh)500800
Hydrogen tank capacity (m3)10001500
Fuel cell generator capacity (kW)8001000
Battery initial state of charge (%)4040
Minimum battery state of charge (%)2525
Maximum battery state of charge (%)100100
Battery charge and discharge efficiency (%)8585
Initial capacity of gas tank (%)3030
Tank storage efficiency (%)9595
Electric to gas efficiency (%)7575
Electricity-to-gas coefficient (kWh/m3)0.20.2
Gas-to-electric efficiency (%)6565
Gas-to-electricity coefficient (m3/kWh)0.2950.295
Table 5. Economic parameters of SHS-EVCS in two London boroughs.
ParametersHammersmith and FulhamRichmond upon Thames
PV capital cost (GBP/kW)11121112
Battery capital cost (GBP/kWh)331.55331.55
Hydrogen tank cost (GBP/m3)27.6327.63
Table 6. Greenhouse gas emission costs [33,45].
TypeFuel Cell Generator Eco-Efficiency (kg/kWh)Grid Eco-Efficiency (kg/kWh)Disposal Cost (GBP/kg)
CO21.5961.4320.088
SO20.0080.4546.237
NOx0.01421.826.46
Table 7. Design variables for SHS-EVCS.
InputTechnical Specification
Replace time (y) (year)10
PV O&M cost ( K O M p v ) (GBP/kW)28.70 [31]
Hydrogen O&M cost ( K O M h s ) (GBP/kW)14.18 [31]
Battery O&M cost ( K O M b a t ) (GBP/kW)4.75 [31]
PV output power ( P p v m , t ) (kW) P S T C G A C 1 + k T c T r G S T C [32]
Hydrogen output power ( P H 2 , i t m , t ) (kW) E H 2 , i t 1 P H F C , i t + P S H , i t + P H 2 , i t Δ t [32]
Battery output power ( P B a t , a , t m , t ) (kW) P B a t , e , t 1 1 σ B a t , e + P B a t , e , t c h a η B a t , e c h a + P B a t , e , t d i s η B a t , e d i s Δ t [33]
Discount rate (r) (%)6
Buying and selling prices from grid (b, c) (GBP/kW)0.33
Buying prices from another charging station (d) (GBP/kW)0.24
Selling prices from another charging station (e) (GBP/kW)0.31
Table 8. SHS-EVCS minimum cost.
Cost (GBP)Hammersmith and FulhamRichmond upon Thames
Capital cost for initial years1,478,7202,128,410
Discounted capital cost201,889.15268,422.33
Grid electricity purchase per day575.091994.36
Energy exchange per day77.1230.25
O&M cost per day205.65232.79
Minimum daily cost1673.323087.81
Daily cost without hydrogen storage2152.263552.24
Table 9. EVCS cost only buying electricity from grid.
Cost (GBP)Hammersmith and FulhamRichmond upon Thames
Daily cost4695.8812,225.81
Disclaimer/Publisher’s Note: The statements, opinions and data contained in all publications are solely those of the individual author(s) and contributor(s) and not of MDPI and/or the editor(s). MDPI and/or the editor(s) disclaim responsibility for any injury to people or property resulting from any ideas, methods, instructions or products referred to in the content.

