1. Introduction
Currently, new sources of energy are being sought, as fossil fuels are running out. In this respect, thermonuclear fusion might be an interesting and promising direction for energy production and is expected to become the dominant source of energy production in the future [
1]. The first steps to using thermonuclear fusion as an energy source in the future are to investigate further, understand, and control the behavior of hot plasma [
2,
3].
In tungsten plasma tokamaks such as the Tungsten Environment in Steady-state Tokamak (WEST) [
4], Axially Symmetric Divertor Experiment (ASDEX) Upgrade [
5], and International Thermonuclear Experimental Reactor (ITER) [
6], plasma contamination with heavy impurities is a major concern, as it can lead to radiative breakdown. Due to its high atomic number, W can radiate a very high amount of energy out of the plasma and thus reduce reactor efficiency [
7,
8,
9]. However, the issue of tungsten ion penetration into the plasma center and the effects of radiative breakdown have not been sufficiently investigated. The radiation emitted by such impurities consists mainly of soft X-rays (SXR) and hard X-rays of low energy [
10]. Diagnostics (and/or synthetic diagnostics) that allow rapid reconstruction of impurity distribution are important for operational purposes but also for understanding the physics and, in particular, transport analysis.
Promising candidates in this field are X-ray detectors that provide spectral information and are linked to tomographic capabilities [
11]. Convenient X-ray detectors used in existing tokamaks might quickly fail without protection from the intensive neutron fluxes that characterize the harsh thermonuclear reactor environment. Due to the radiation conditions during the nuclear phase of ITER, advanced detectors that exhibit high neutron and gamma radiation resistance are required, such as gas-filled detectors, e.g., gas electron multipliers (GEMs) [
12,
13,
14], which are currently envisioned to address this situation [
15]. The search for suitable SXR radiation detectors for a future experimental reactor has significant implications for fusion regarding access to information-rich SXR diagnostics.
One of the essential goals of such diagnostic systems is monitoring the plasma impurities, which can occur, e.g., from plasma–wall interaction [
16]. Ideally, a shaped magnetic field should isolate the plasma from the walls. In its volatile state, plasma can interact with the walls and detach atoms from their surfaces. As was already mentioned, such an admixture of impurities can even lead to a disruption of the plasma discharge. Therefore, plasma impurities should be monitored carefully and counteracted accordingly [
4].
In this perspective, such an advanced gas detector has been developed, and a new GEM-based tomographic system, available in real-time through field programmable gate array (FPGA) technology [
17] (namely the first camera for the vertical port), has recently been installed and tested on the WEST tokamak [
4]. After the upgrade, one of its main features is the actively cooled divertor and tungsten wall, making it suitable for ITER tokamak tests [
18]. The most interesting and challenging possibility from the diagnostic point of view is having a long-duration plasma, currently around 60–100 s, with the goal of even above that.
The developed measurement system is multi-channel with a state-of-the-art approach to process as many unprocessed signals as possible directly from the GEM detector in the form of analog pulse-shaped analog-to-digital-converter (ADC) samples. The processed data are transferred through FPGAs and stored on an embedded high-performance computing platform. With advanced raw data acquisition, it is possible to provide an in-depth evaluation of the spectra calculation algorithms, as well as provide signal and system quality studies. Due to the unique system design based on high-throughput signal acquisition, it is possible to calculate charges (and further, spectra) from accumulated signals revealing the corresponding original pulses. This problem is particularly important in the intense plasma radiation measurement environment, where such phenomena can easily reach more than 50% of the recorded signals [
17]. Storing high-quality GEM SXR data in the form of spectra in the WEST database might allow working with dedicated automated software for spectrum analysis.
The system’s primary purpose is to measure radiation emitted by tungsten at approx. 2–3 keV; tungsten, due to its properties such as high melting point, is considered to be used as a first wall material in the ITER reactor [
19].
The installed system is the second generation of the SXR diagnostics that were first committed to the Joint European Torus (JET) tokamak as a part of the KX1 spectrometer [
20]. Its main advantage is the simplified construction combined with radiation-hard design, effective data processing, and ability to register raw analog pulses (corresponding to each photon registered by the GEM detector) during each plasma reaction (for more details, see, e.g., [
21]).
Table 1 compares the two generations of SXR GEM FPGA systems: for the WEST experiment and the first KX1 for the JET experiment.
The main difference between the systems is that the first-generation KX1 produces real-time histogram data. The embedded FPGA algorithms process the signals completely in real-time, constructing the clusters and composing the final spectra among the full 256 measurement channels from the GEM detector. However, the main limitations of the system are the fixed histogram period (10 ms, due to experiment requirements), output only of the final data and lack of large-scale raw data acquisition. The raw signal acquisition function was limited. Thus, registering the signals for quality checkout or algorithm improvement was difficult during plasma scenarios. For example, observations of the signal fluctuations during plasma generation were very limited (it is possible to register only a few events in raw format).
The second-generation system designed for the WEST tokamak is doing the opposite. It registers the entire raw data events for each photon recorded by the GEM detector (called events). This property opens a broad spectrum of new possibilities, especially:
Performing computations offline—based on complete signal information. Very beneficial for proper algorithm construction;
Analysis of the quality of the registered data;
Extensive and unique database of raw plasma data (signals) without added data processing.
Both of the mentioned features were limited in the system’s first generation. On top of that, due to the streaming data transmission scheme and complete data registration, the final spectra are constructed with user-defined time resolution instead of a fixed one. Implementing the online data computation algorithms (post-processing) on the PC platform instead of FPGAs is also possible (under work). The mentioned mode significantly simplifies the time of the implementation of the computation stage, in parallel enabling the real-time data production for integration with real-time control systems.
The advantage is also in terms of the construction. The large 21 FPGA computation cluster is now replaced by only two FPGAs (for 256 channels, it would be four). On top of that, the synchronization between the boards is significantly simplified.
2. GEM SXR Measurement System Architecture for WEST Experiment
The diagnostics under consideration are able to provide SXR spectra in the 2–15 keV energy range for 85 vertical and 113 horizontal lines of sight (after the horizontal camera installation) and to monitor W radiation in the range of approximately 2–3 keV. With optimized tomographic reconstruction methods that are compatible with real-time applications, it would be possible to consider obtaining a two-dimensional W distribution for potential plasma control or plasma physics studies. Combined with advanced high-speed, high-performance electronics, such a measurement system will monitor radiation from the core to the edge of the plasma, offering excellent spatial (approx. 1 cm of plasma) and temporal (down to 1–10 ms depending on the statistics) resolution, as well as a charge spectrum from which photon spectra can be decomposed. High dynamic range in terms of fluxes was verified for this type of detector in a series of tests to values up to 10
5 Hz/mm
2. More detailed information on the system’s layout can be found in [
15].
The developed SXR measurement system’s main requirements cover the ability to work with multiple input channels from the GEM sensor, combined with efficient pre and post-processing stages to collect all of the raw data (in the form of the signals) for further post-processing. Another significant advantage is the possibility to treat the registered data with various versions of detailed algorithms, receiving satisfying output spectra—energy and topology of the measured impurities [
22].
Therefore, besides the high quality of the GEM detector, a fast electronic measurement system is equally important. The developed system and firmware were prepared and designed to meet the mentioned requirements. The detector developed for the WEST experiment can be classified as a second-revision detector and was successfully installed on the WEST tokamak [
21]. The first revision was designed for the JET experiment.
The diagnostic system is structurally divided into three main parts [
21,
23]:
The GEM detector with radiation-hard front-end electronics is placed in the finger port directly and the reactor chamber. Its role is to detect and register photons emitted by plasma and transmit this information as analog signals to the electronic measurement system.
The electronic measurement system is used to receive signals from the detector, convert them to digital form and perform initial processing, concentration, and sending of data to an embedded computer.
An embedded computer with central processing unit (CPU) performs advanced numerical calculations, fast communication, distribution, and storage of measurement data.
The structure of the diagnostic system with the specified modules is shown in
Figure 1.
The GEM detector consists of a readout 112-channel strip backplane with analog front-end boards (AFE) that convert electrical current signals into voltage signals. Those signals are transmitted over LVDS cable to analog-digital boards (ADB) consisting of ADCs connected directly to FPGAs. Each FPGA supports 64 measurement channels. As described in the Introduction section, the main idea was to design a system capable of continuously streaming data to the embedded computer performing signal analysis. For that reason, the FPGAs perform the following tasks:
Management of the electronic components on the AFE and ADB boards
Interfacing with ADCs over fast serialization links
Analog input channel individual offset management
By data acquisition IP component:
- ◦
External acquisition start/stop with synchronization among FPGA backplanes
- ◦
Real-time offset computation
- ◦
Triggering system—individual for each channel
- ◦
Trigger/active channel management upon user configuration
Data transmission link to embedded PC—implementation of PCIe Gen2 interface in DMA Mode (with custom Linux driver)
Data manager for packet transmission over PCIe
The triggering unit computes in real time the offset on each channel individually. It also receives the relative triggering level from the user configuration. Once the signal is above the offset level, including the user-set trigger value, it generates the trigger signal. The signal can be configured as a level or pulse type. Those signals are then delivered to the main data acquisition component. It can be a high-performance streaming data concentrator, global trigger acquisition mode engine, local trigger mode engine, or data quality monitoring engine. After this component, the data are provided to the data manager (over AXI4 interface) to be transmitted to the embedded PC platform over fast links. The transmitted data consist of events that are signal windows fixed to 40 samples. The user can tune the programmable delay level: trigger-to-signal to set the signal in the middle of the acquisition window.
Due to its versatile design, one can easily replace the firmware. For example, one of the modes of the FPGA is the data quality monitoring firmware. The design can actively analyze pulses to search for odd signals, labeling the signals with known defects. The firmware splits the signal based on quality models: low-quality type signals are stored for further analysis in DDR3 memory, and proper signals are sent directly to the PC. In this mode, various analyses about differences in the quality of the signals in relation to the radiation intensity are possible. Only having the ability to register raw data can perform such detailed analysis, with the potential to detect unknown signals. More details are provided in [
17].
The raw samples are transmitted over PCIe, arranged in event packets containing the following information:
Each event frame equals 96 bytes. The DMA packet size is set up to 4 MB to achieve the best performance of the transmission link and processing speed for algorithms. Based on a custom-designed PCIe switch (Gen3 × 16), up to eight FPGAs can be connected to the embedded PC, resulting in a 512-channel system. Due to high-performance custom readout software, the data volume can be of any size, limited only by the installed RAM in the embedded server.
Data during the measurement are streamed continuously to the embedded PC server platform. It records the data to the double data rate synchronous dynamic random-access memory (DDR-RAM). The length of the recording at the moment is limited only by the size of the RAM. Currently, complex algorithms for data post-processing and quality analysis are implemented in Matlab. The energy, topology spectra, and cumulative time traces are produced after converting binary data to Matlab format. Depending on final use, the data are available as final histograms or charge, time, and channel values.
In parallel, significant progress has been made regarding the development and real-time implementation of data processing algorithms in C/C++. The algorithm can produce final time slices of the spectra, significantly reducing the amount of space needed for data storage. It is planned for further implementation after tests.
A complex software program has been developed to manage and interface the system. The essential components perform the following tasks: controlling the onboard electronic chips and managing the measurement configuration, data transmission over Ethernet (the system is distributed), data readout, universal management server, WEST interface integration software, and protection software. Those applications were implemented in C/C++ and Python and are available on the server platform. More details about the technical aspects can be found in [
21].
Electronic Measurement System with Embedded Data Concentrator
The electronic measurement system designed for the WEST tokamak is characterized by suitable hardware parameters to meet the demanding requirements of the experiment. The system consists of analog front end (AFE) modules that receive analog signals from the detector. One AFE module supports 16 measurement channels. Each of the channels has a dedicated low-pass filter. The signals are then sent to A/D converters with a maximum sampling frequency of 125 MHz and resolution of 12 bits that accept signals in the 0–1.8 V range. Each channel has an individual offset calibration mode. Therefore, it is possible to select the dynamic range of the ADC inputs. Typically 90% of the ADC input range is used due to the specific shape of the signals. The sampled signals are then transferred to the backplane board with an FPGA from the Xilinx Artix 7 family. The FPGA chip performs synchronization and data preprocessing. Every FPGA can support up to 64 channels (four AFE boards). The backplane module is equipped with double data rate synchronous dynamic random-access memory (DDR-3 SDRAM) with a capacity of 2 GB for potential additional storage. The data are sent to the embedded computer module via the PCI Express Gen2 interface.
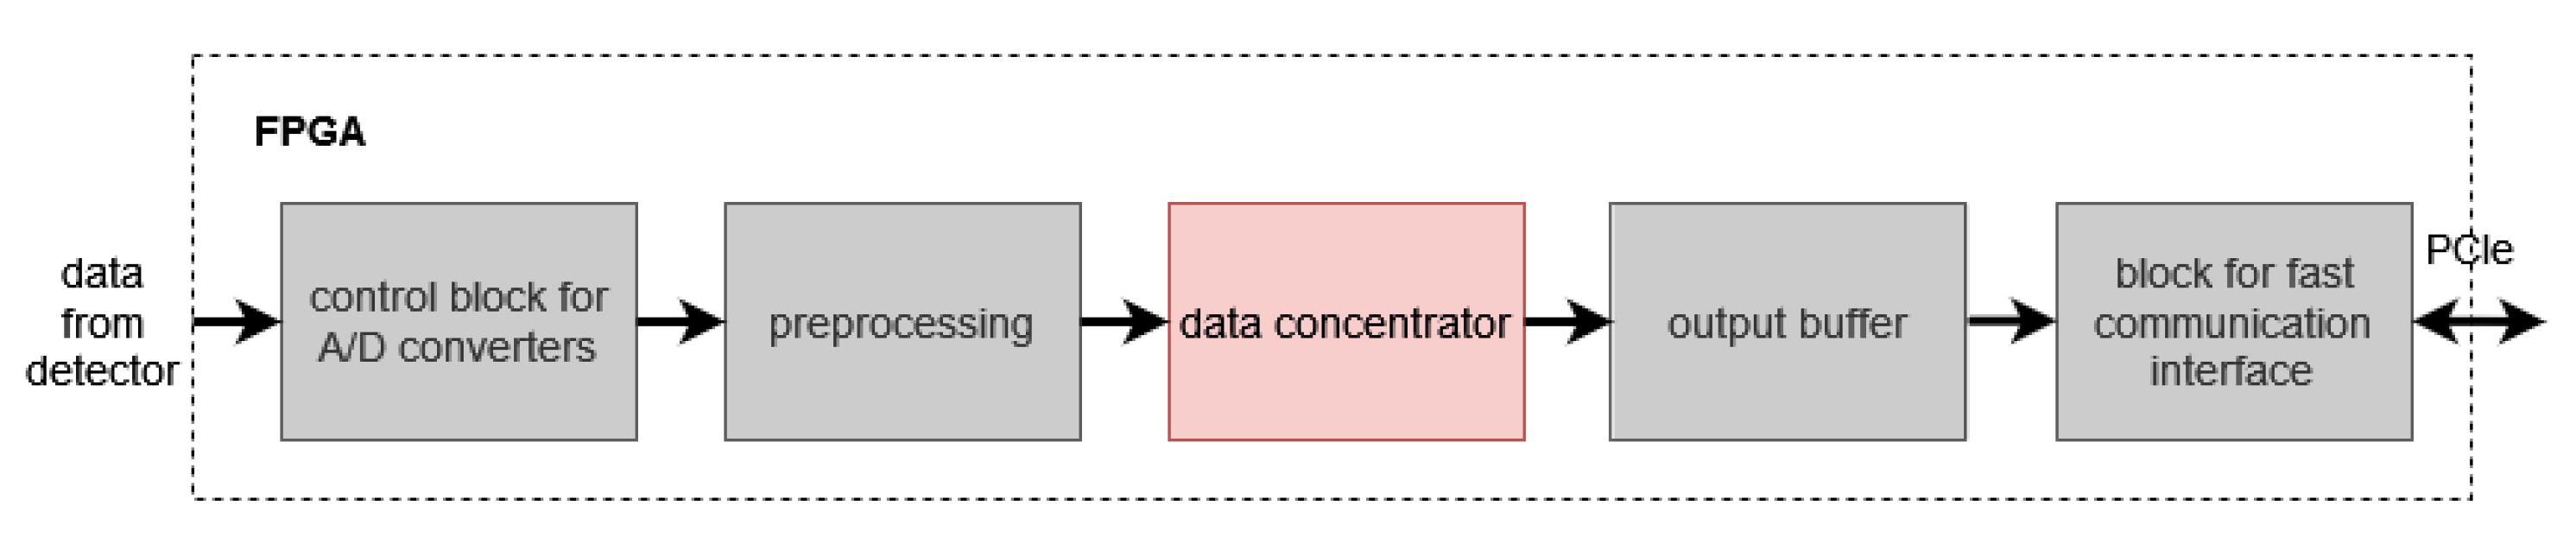
The main block elements in the SXR system FPGA firmware are shown in
Figure 2. It consists of the following stages:
Complex high-throughput ADC interfaces—simultaneous registration of all channels from ADCs. Includes fast data serialization link interface with training algorithms.
Preprocessing stages in the scope of triggering, offsets, configuration, and finite-state machine algorithms for detection of pulses.
The data concentrator—high-throughput parallel-to-serial data conversion module with time sorting capability.
Output buffer for output communication links—buffering stage to improve timing and unify with external interfaces.
Fast communication interface—Ipcore is used to stream raw data signals to embedded PC using PCIe Gen2 links. On the PC side, it uses a high-performance PCIe driver working in DMA mode (developed for this purpose). The Ipcore is also used for the configuration of FPGA boards.
Due to the expected high radiation fluxes from the plasma, it was necessary to implement a module to select and compress data on-the-fly. The data concentrator module performs the following tasks:
Data aggregation—prepares the data from multiple channels for buffering and processing in a sequenced order.
Data buffering—buffers the data during the processing stage, required for proper arrangement of events in time during serialization.
Data processing—sorts the data by time and position with a designed sorting algorithm.
Data transfer to the next module—uses the internal communication bus between subsequent modules of the data concentrator.
3. Data Concentrator Implemented in FPGA for WEST Experiment
The data concentrator is a crucial part of the data pipeline. As an input, it receives the raw analog signal from each channel with the triggering information from the previous preprocessing blocks. Then, all of the further data management is performed by this IP core.
It has a big impact on the system’s latency and the amount of data transferred, especially compared to the previous global mode triggering. Delivering sorted and preselected data to the embedded computer simplifies calculation at the following stages. The structure of the developed and implemented data concentrator is presented in
Figure 3.
The following basic elements can be distinguished in the data concentrator dedicated to tokamak WEST [
24]:
Input data synchronization module—registers and synchronizes the data from all channels simultaneously.
Trigger control module—detects the events according to the selected trigger mode.
Main counter module—delivers the relative time counter to other submodules.
Input data control module—creates the ID of the event with information like timestamp or channel. Next, it embeds those data into a frame.
Buffering measurement data module—stores the data while the IDs are sorted in the identifier sorter submodule.
Identifier sorter module—sorts all IDs by time and channel number.
Output multiplexer module—combines the buffered data with sorted IDs from the identifier sorter submodule.
Output control module—transfers the sorted data to the next submodules in FPGA by internal communication buses.
Each measurement channel has its own dedicated input and its processing path at the initial stage. The data go through the input data synchronization module in the initial phase. In that module, data from many channels are synchronized in terms of time, additionally removing delays between signals. Then, the data go to the trigger control module. The implemented design allows registering data in three trigger modes:
Global trigger (for compatibility with older version)—allows registering the complete picture of the GEM detector backplane consisting of active channels (at the moment of photon reception) along with inactive ones simultaneously. Has the lowest performance (however, still high enough to work on experimental setups).
Zero-suppression trigger—it behaves similarly to the previous mode; however, it discards the inactive channels. Any channel can trigger the acquisition, which starts a 40-sample measurement window. If some of the channels have active triggers, at least for one clock cycle, they are also registered during this time. If a channel becomes active during the acquisition window, it is possible that it will not be fully registered. The mode is a transition state design, mainly designed for middle-stage tests. It has an improved throughput. It is not channel-sensitive and, thus, not that efficient.
Local trigger (default)—registers only active channels. Registration of a channel is considered independently from other channel inputs. Each channel has its trigger—the most efficient mode in terms of throughput.
Data from the trigger control module go to the input data control module. There, it is verified whether the incoming data should be further processed or rejected. If the data pass the initial verification correctly, the controller calculates and assigns an identifier for the data—event ID, which contains three fields:
Status (optional). It may contain status information, e.g., controller data state events about previous sample rejection or other statistical or process information.
Channel number (required). The field contains the number of the channel on which the event occurred.
Timestamp (required). The current value of the main counter is registered in the field (the so-called timestamp is created). It should be emphasized that the timestamp registration procedure is simultaneous for all channels to ensure time synchronization between the channels.
All data that have passed the verification at the input to the concentrator will be processed and released at its output. When the data event ID is calculated, the data are sent to two places:
Input data in the form of samples from A/D converters (measurement data) are transferred to measurement data buffers. Each channel has a separate buffer.
The event IDs determined at the previous stage are transferred to the identifier sorter, where they are sorted by time (first-order priority) and position (second-order priority). The identifier sorter accepts identifiers simultaneously on all channels, while at the output, it issues them serially following arbitrarily set sorting priorities.
In the next step, the identifier from the sorter output is fed to the control input of the output multiplexer, whose inputs are connected to all measurement data buffers. The multiplexer outputs data from the buffer associated with the channel number stored in the identifier. Next, the output data controller retrieves the event identifier and measurement data, integrates them, and places them in the output buffer. Depending on the architecture, the output buffer may be a First In First Out (FIFO) queue, internal FPGA memory or external memory.
The designed module was verified under HDL simulation testbenches and then integrated with the complex FPGA firmware. The following steps consisted of the experimental laboratory tests and final implementation in a real environment at WEST tokamak.
4. Laboratory Tests of the Data Concentrator Implemented in FPGA Firmware
The designed module for the SXR measurement system has been tested under laboratory conditions. Tests were performed with the local trigger mode (integrated with FPGA streaming data concentrator Ipcore). The laboratory test stand presented in
Figure 4 is composed of:
Radiation source—the isotope or active source used for measurements and verification. With the use of active radiation sources, intense radiation can be achieved. It is used for throughput analysis of the designed FPGA streaming data concentrator.
GEM detector—soft X-ray detector with data acquisition (DAQ) module connected. Performs photon-to-current conversion.
Electronic measurement system (DAQ module)—the described system with FPGAs and embedded CPU used for data processing.
High-voltage control system—an external module used as the power supply for the GEM detector.
Water cooling circuits—used for active cooling of analog front-end boards installed at the GEM detector.
Gas supply—ArCO2 gas supply for the GEM detector.
Additional infrastructure elements—e.g., a remote power strip for power management, Ethernet switch.
Two external radiation sources were used to verify the throughput of the concentrator:
Iron isotope
55Fe is characterized by low radiation intensity (1 kBq) on the active surface of the detector and a known energy spectrum and spatial distribution. The source is presented in
Figure 5a.
X-ray tube (Mini-X X-Ray Tube 50 kV USB Controlled manufactured by Amptek Inc., Bedford, MA, USA) with adjustable radiation intensity and energy range. Necessary for much more intense data streams. The source is presented in
Figure 5b.
For
55Fe tests, the data was recorded with various trigger levels. The spectrum of the recorded data is presented in
Figure 6a. It can be noticed that the spectrum is similar for all level triggers. With a higher trigger level, there were fewer noises recorded and more high-quality events. For all trigger levels, the event rate was similar and close to 200 Hz. The events rate change in time is presented in
Figure 6b.
Measurements with an X-ray tube were recorded with various current-level settings. The X-ray tube was equipped with current feedback control. The applied current was carefully monitored during the experiment. No current drift was observed for the data obtained and discussed here. The recorded radiation intensity was much higher than that for the
55Fe source. The spectrum of recorded data is presented in
Figure 7a. The number of registered events was similar in all of the tests. The rate of the events depends on the radiation intensity, which can be adjusted by setting the tube’s current. For the current of 5 µA, the rate of the registered events is around 600 kHz. For the current set to 2 µA, the rate was above 200 kHz. For the current set to 1 µA, the rate was around 100 kHz. Due to the fixed amount of events to register, the acquisition time varies depending on the intensity. Results are presented in
Figure 7b.
The tests performed were successful and gave the expected results. The energy spectra for each test case were in the correct charge range. The adjusted intensity tests simulated conditions closest to the plasma experiments that could be expected. It can be noted that the system is capable of constant acquisition of the signals among all channels under 600 kHz event intensity.
5. Sorting Module at WEST Tokamak during the First Experimental Campaign in 2023
Based on the successful results, the designed module was integrated with base firmware working previously on WEST tokamak and introduced to work during the experimental campaign. One of the main reasons was the intense plasma radiation that only an optimized acquisition algorithm could handle. Another point was regarding the time of plasma. The reaction lasted even up to 100 s; therefore, the amount of raw data was extreme. Therefore, only optimized algorithms in the scope of data compression were suitable to work during the experimental campaign. The following sections describe the results of the implemented firmware with the new version of the acquisition mode.
5.1. Global Trigger Acquisition Mode
Before the data concentrator described in this article was used, the system worked with global trigger acquisition mode. The global trigger activates, registering data on all channels when any of them is triggered. In that way, most registered signals do not store any relevant event information but noise. In case of high rates, the system in such mode becomes quickly saturated in terms of filled memory due to the generation of huge diagnostic data. It is suitable for preliminary diagnostics of the newly installed system on-site.
The following figures show the maximal rates for which the algorithm works.
Figure 8 presents the spectrum of the plasma run, the number of events per channel, and the number of events in time. The system was saturated after 15 s. Despite proper energy and topology shapes, it could not register more data. The maximal summary rate for channels 1:64 was approx. 1 MHz during acquisition time, which is presented in
Figure 9 (related to the global events, however the rate can be higher if events that occurs in the same time on other channels are also considered). The maximum limit rate visible in the figure results from the minimum time distance between successive triggers, which was 612.5 ns (49 clock cycles), including 500 ns, which was the time frame of the recorded signal.
Figure 10 presents the rate only for channel 45. The channel was selected since it is the middle line of sight and receives the most intense radiation. It can be noticed that the average rate on that channel is ~12.77 kHz. Various event averaging windows were used, as presented in
Figure 11,
Figure 12 and
Figure 13, showing the performance of the design for a single channel.
The rate for each channel separately is presented in
Figure 14, with an average window equal to 1000. It can be noticed that the lowest rate is around 1 kHz, which is for channel 1. The rest of the rates range between 1 kHz and 13 kHz. It results not necessarily from the performance of the design. It results from various conditions, given the detector’s local plasma intensity and activation ratio of edge and central parts. The most intensive channels (center) have a similar performance ratio. It allows the retrieval of the real performance per channel of the global triggering mode and total throughput of a 1 MHz event rate (globally).
5.2. Data Concentrator in Local Trigger Acquisition Mode
To compare the new local trigger using the data concentrator module with the old global trigger, tests similar to the previous ones were performed during the C3 WEST plasma campaign.
The following figures show the maximal ratings of the designed algorithm with local trigger works.
Figure 15 presents the spectra of the WEST plasma run, the number of counts per channel, and the number of events in time. The plasma phenomena lasted over 50 s, and all of the data were registered.
Figure 16 presents the rate only for channel 45. It can be noticed that the average rate on that channel was around 210 kHz, and the peak rate per channel was approximately 1.9 MHz. The maximum limit rate visible in
Figure 16 resulted from the fact that the minimum time distance between successive triggers was 525 ns (42 clock cycles), including 500 ns, which was the recorded signal’s time frame. The gap here was very short (25 ns). The limit is a result of the FPGA sorting algorithm. The algorithm can transfer only one event at a time.
Figure 17,
Figure 18 and
Figure 19 present similar information using different average windows.
Similarly, the rates for every channel separately are presented in
Figure 20 using the average window. It can be noticed that the lowest rate was around 10 kHz, which was for channel 1. The rest of the rates ranged between 10 kHz and 230 kHz. The spread of values is a physics result confirmed in previous verification of global mode. The channels that were the most exposed had a very similar performance.
5.3. Experimental Results
The presented plots are based on different averaging time windows: none, of 100 events, of 1000 events, and of 10,000 events. It provides a field for a more detailed analysis of acceptable event frequency per triggering mode. With no averaging windows, one can observe the peak values corresponding to the highest trigger throughput (~210 kHz global trigger mode/~1.9 MHz local trigger mode). Moving further with the analysis, one can obtain the average trigger acquisition on the channels receiving the most intense radiation. The middle-range window shows stable oscillations around the base value.
Comparing global and local trigger mode results, one can notice that local triggering mode combined with data concentrator units resulted in a much higher rate per channel. The range for global mode was around 1–13 kHz; for local mode, it was around 10–230 kHz, even more than 17 times in average scale.
The peak values were even higher; however, those could persist for a shorter time until buffer saturation. The system in the local trigger mode did not go into a saturation state for such an event rate, which is what happened in global mode. Further limitations related to radiation intensity are related to the direct construction of the acquisition IPcores:
The global trigger mode trigger frequency is limited by the internal buffer that can store up to 10 events of 64 channels each. Afterward, it needs to wait for at least one event slot in memory, which typically takes up to 4 ms (assuming intense radiation above that value).
The local trigger mode has a different construction. Each of the channels has its buffer. The limitation factor is the internal bus occupancy. Each event consists of 96 bytes (768 bits) that need to fit the bus in only a few clock cycles.
The local trigger records much more relevant data because it collects the data only from the triggered channels. In the global mode, every trigger activates, recording data for all channels. In such cases, many of them store noise. Therefore, we have typically achieved data compression in a ratio of approx. 20 times.
The system in local triggering mode was able to record the data through the whole time of the long WEST plasma shot time at given rates.
Based on the presented tests, the data concentrator unit combined with local triggering mode can provide high-quality, preselected data. The design performance meets the criteria to work with intense plasma for long-duration pulses, as on WEST tokamak.
6. Summary
The presented SXR GEM FPGA-based measurement system is a second generation, currently installed at the WEST tokamak. Due to the demanding environment and predicted long and intense plasma pulses, optimizing the data acquisition path was necessary to satisfy the requirements.
Therefore, the FPGA firmware was improved by implementing the new data collection block: data concentrator and local triggering unit implementation. Combining both gives improved data acquisition performance and, at the same time, high data compression of registered signals.
The design was first tested using isotope and X-ray tube radiation in the laboratory. The experiments allowed verifying the development in terms of registered data quality (proper spectral shapes) and appropriate system response under intense incident radiation. Based on the gathered results, the decision was made to integrate the new component with the SXR measurement system.
The component was working during the most recent 2023 experimental campaign at the WEST tokamak, registering data with challenging long pulses of 60–100 s. The system successfully acquired multiple plasma pulses in the form of raw data throughout the campaign, available for further post-treatment.
The performance of the new component was compared with the previous global triggering mode. Based on the results based on plasma acquisition, it can be noted that in the scope of performance, the new mode provides at least 17 times better performance, with much higher peak throughput. The data compression is also much more improved, by approx. 20 times. The presented data concentrator module provides a unique opportunity to register a significant number of events from the detector at high rates that are available after plasma pulse for further post-treatment. The presented approach and results are very rare. It is a highly demanded feature of data acquisition (DAQ) systems, especially those working with intense data streams and numerous channels (for this camera, up to 85).
The new component was successfully verified and implemented during the WEST tokamak campaign and allowed to record long data streams.
Author Contributions
Conceptualization: P.K., K.T.P., G.K. Methodology: P.K., K.T.P., A.W. Data curation: P.L., D.G. Formal analysis: P.K., K.T.P., A.W., M.C., D.M., T.C., K.M. Investigation: P.K., T.C., A.W., P.L. Resources: K.T.P., M.C., D.M., G.K. Software: P.K., A.W., P.L., J.C. Supervision: K.T.P., A.W. Validation: P.K., K.T.P., T.C., A.W., P.L., M.C., D.M. Writing—original draft: P.K., K.T.P., M.C., A.W., D.M. Writing—review & editing: P.K., A.W., M.C., K.M. All authors have read and agreed to the published version of the manuscript.
Funding
This work has been carried out within the framework of the EUROfusion Consortium, funded by the European Union via the Euratom Research and Training Programme (Grant Agreement No 101052200—EUROfusion). Views and opinions expressed are, however, those of the author(s) only and do not necessarily reflect those of the European Union or the European Commission. Neither the European Union nor the European Commission can be held responsible for them. This scientific paper has been published as part of the international project co-financed by the Polish Ministry of Science and Higher Education within the program called ‘PMW’ for 2022–2023.
Data Availability Statement
Data sharing not applicable. No new data were created in this study. Data sharing is not applicable to this article.
Conflicts of Interest
The authors declare no conflict of interest.
References
- Magaud, P.; Marbach, G.; Cook, I. Nuclear Fusion Reactors. Encycl. Energy 2004, 4, 365–381. [Google Scholar] [CrossRef]
- Fusion—A clean future. Available online: https://ccfe.ukaea.uk/wp-content/uploads/2019/10/CPS16.49_May2016_low.pdf (accessed on 7 September 2022).
- Peluso, E.; Pakhomova, E.; Gelfusa, M. New Challenges in Nuclear Fusion Reactors: From Data Analysis to Materials and Manufacturing. Appl. Sci. 2023, 13, 6240. [Google Scholar] [CrossRef]
- Bucalossi, J.; Achard, J.; Agullo, O.; Alarcon, T.; Allegretti, L.; Ancher, H.; Antar, G.; Antusch, S.; Anzallo, V.; Arnas, C.; et al. Operating a full tungsten actively cooled tokamak: Overview of WEST first phase of operation. Nucl. Fusion 2022, 62, 042007. [Google Scholar] [CrossRef]
- Meyer, H.; Angioni, C.; Albert, C.G.; Arden, N.; Parra, R.; Arredondo Asunta, O.; De Baar, M.; Balden, M.; Bandaru, V.; Behler, K.; et al. Overview of physics studies on ASDEX Upgrade. Nucl. Fusion 2019, 59, 112014. [Google Scholar] [CrossRef]
- Geng, S. An Overview of the ITER Project. J. Phys. Conf. Ser. 2022, 82, 2386. [Google Scholar] [CrossRef]
- Philipps, V.; Neu, R.; Rapp, J.; Samm, U.; Tokar, M.; Tanabe, T.; Rubel, M. Comparison of tokamak behaviour with tungsten and low-Zplasma facing materials. Plasma Phys. Control. Fusion 2000, 42, B293–B310. [Google Scholar] [CrossRef]
- Ostuni, V.; Morales, J.; Artaud, J.-F.; Bourdelle, C.; Manas, P.; Fedorczak, N.; Dumont, R.; Goniche, M.; Maget, P.; Peysson, Y.; et al. Core radiative collapse characterisation and integrated modelling in WEST plasmas. Nucl. Fusion 2022, 62, 106034. [Google Scholar] [CrossRef]
- Kallenbach, A.; Neu, R.; Dux, R.; Fahrbach, H.U.; Fuchs, J.C.; Giannone, L.; Gruber, O.; Herrmann, A.; Lang, P.T.; Lipschultz, B.; et al. Tokamak operation with high-Zplasma facing components. Plasma Phys. Control. Fusion 2005, 47, B207–B222. [Google Scholar] [CrossRef]
- Botrugno, A.; Gabellieri, L.; Mazon, D.; Pacella, D.; Romano, A. Soft X-ray measurements in magnetic fusion plasma physics. Nucl. Instrum. Methods Phys. Res. Sect. A Accel. Spectrometers Detect. Assoc. Equip. 2010, 623, 747–749. [Google Scholar] [CrossRef]
- Ingesson, L.C.; Alper, B.; Peterson, B.J.; Vallet, J.-C. Chapter 7: Tomography Diagnostics: Bolometry and Soft-X-Ray Detection. Fusion Sci. Technol. 2008, 53, 528–576. [Google Scholar] [CrossRef]
- Sauli, F. The gas electron multiplier (GEM): Operating principles and applications. Nucl. Instrum. Methods Phys. Res. Sect. A Accel. Spectrometers Detect. Assoc. Equip. 2016, 805, 2–24. [Google Scholar] [CrossRef]
- Buzulutskov, A.F. Radiation detectors based on gas electron multipliers (Review). Instrum. Exp. Tech. 2007, 50, 287–310. [Google Scholar] [CrossRef]
- Muraro, A.; Claps, G.; Croci, G.; Cordella, F.; Gorini, G.; Grosso, G.; Hu, Z.; Mangiagalli, L.; McCormack, O.; Murtas, F.; et al. Development and characterization of a new soft x-ray diagnostic concept for tokamaks. J. Instrum. 2019, 14, C08012. [Google Scholar] [CrossRef]
- Chernyshova, M.; Czarski, T.; Malinowski, K.; Kowalska-Strzęciwilk, E.; Poźzniak, K.; Kasprowicz, G.; Zabołotny, W.; Wojeński, A.; Kolasiński, P.; Mazon, D.; et al. Conceptual design and development of GEM based detecting system for tomographic tungsten focused transport monitoring. J. Instrum. 2015, 10, P10022. [Google Scholar] [CrossRef]
- Tsitrone, E.; Pegourie, B.; Gunn, J.P.; Bernard, E.; Bruno, V.; Corre, Y.; Delpech, L.; Diez, M.; Douai, D.; Ekedahl, A. Investigation of plasma wall interactions between tungsten plasma facing components and helium plasmas in the WEST tokamak. Nucl. Fusion 2022, 62, 076028. [Google Scholar] [CrossRef]
- Wojenski, A.; Pozniak, K.; Mazon, D.; Chernyshova, M. FPGA-based novel real-time evaluation and data quality monitoring system for tokamak high-performance GEM soft X-ray diagnostic. J. Instrum. 2018, 13, P12024. [Google Scholar] [CrossRef]
- Iter. Available online: https://www.iter.org/newsline/-/531 (accessed on 7 September 2022).
- Hirai, T.; Panayotis, S.; Barabash, V.; Amzallag, C.; Escourbiac, F.; Durocher, A.; Merola, M.; Linke, J.; Loewenhoff, T.; Pintsuk, G.; et al. Use of tungsten material for the ITER divertor. Nucl. Mater. Energy 2016, 9, 616–622. [Google Scholar] [CrossRef]
- Kasprowicz, G.; Czarski, T.; Chernyshova, M.; Dominik, W.; Jakubowska, K.; Karpinski, L.; Kierzkowski, K.; Pozniak, K.; Rzadkiewicz, J.; Scholz, M.; et al. Fast ADC based multichannel acquisition system for the GEM detector. In Proceedings of the SPIE: Photonics Applications in Astronomy, Communications, Industry, and High-Energy Physics Experiments, Wilga, Poland, 28 May–3 June 2012; Volume 8454. [Google Scholar] [CrossRef]
- Wojenski, A.; Linczuk, P.; Kasprowicz, G.; Poźniak, K.T.; Chernyshova, M.; Mazon, D.; Czarski, T.; Krawczyk, R.D.; Malard, P.; Malinowski, K.; et al. Multichannel gas electron multiplier based soft X-ray field-programmable gate array measurement system for W-Environment in Steady-state Tokamak (WEST): Hardware, installation, and first plasma acquisition. Rev. Sci. Instrum. 2021, 92, 054704. [Google Scholar] [CrossRef] [PubMed]
- Mazon, D.; Jardin, A.; Malard, P.; Chernyshova, M.; Coston, C.; O’Mullane, M.; Czarski, T.; Malinowski, K.; Faisse, F.; Ferlay, F.; et al. SXR measurement and W transport survey using GEM tomographic system on WEST. J. Instrum. 2017, 12, C11034. [Google Scholar] [CrossRef]
- Kasprowicz, G.; Zabołotny, W.M.; Poźniak, K.; Chernyshova, M.; Czarski, T.; Gąska, M.; Kolasiński, P.; Krawczyk, R.; Linczuk, P.; Wojeński, A. Multichannel Data Acquisition System for GEM Detectors. J. Fusion Energy 2018, 38, 467–479. [Google Scholar] [CrossRef]
- Kolasinski, P.; Poźniak, K.; Czarski, T.; Chernyshova, M.; Gąska, M.; Linczuk, P.; Kasprowicz, G.; Krawczyk, R.; Wojeński, A.; Zabołotny, W. GEM detector charge signals sequencer implementation for WEST experiment. In Proceedings of the SPIE: Photonics Applications in Astronomy, Communications, Industry, and High-Energy Physics Experiments, Wilga, Poland, 26 May–2 June 2019; Volume 11176. [Google Scholar] [CrossRef]
Figure 1.
Structural overview of the GEM-FPGA SXR diagnostic system.
Figure 1.
Structural overview of the GEM-FPGA SXR diagnostic system.
Figure 2.
Datapath structure in the FPGA.
Figure 2.
Datapath structure in the FPGA.
Figure 3.
The architecture of the proposed data concentrator.
Figure 3.
The architecture of the proposed data concentrator.
Figure 4.
The equipment used during laboratory tests: measurement system, GEM detector, gas distribution unit, high-voltage power supply, and radiation sources.
Figure 4.
The equipment used during laboratory tests: measurement system, GEM detector, gas distribution unit, high-voltage power supply, and radiation sources.
Figure 5.
External radiation sources: (a) iron isotope 55Fe; (b) adjustable X-ray tube.
Figure 5.
External radiation sources: (a) iron isotope 55Fe; (b) adjustable X-ray tube.
Figure 6.
Results of tests of the system with iron isotope 55Fe as a radiation source: (a) energy spectrum; (b) event rates in time.
Figure 6.
Results of tests of the system with iron isotope 55Fe as a radiation source: (a) energy spectrum; (b) event rates in time.
Figure 7.
Results of tests of the system with an X-ray tube as a source. (a) spectrum; (b) event rates in time. Trigger level constant, uA refers to the current of the X-ray tube (radiation intensity).
Figure 7.
Results of tests of the system with an X-ray tube as a source. (a) spectrum; (b) event rates in time. Trigger level constant, uA refers to the current of the X-ray tube (radiation intensity).
Figure 8.
Tests with the global trigger under plasma reaction: (a) energy spectrum; (b) topology spectrum (events per channel); (c) number of events in time.
Figure 8.
Tests with the global trigger under plasma reaction: (a) energy spectrum; (b) topology spectrum (events per channel); (c) number of events in time.
Figure 9.
The maximal summary rate for channels in the range of 1–64 for the first 15 s.
Figure 9.
The maximal summary rate for channels in the range of 1–64 for the first 15 s.
Figure 10.
The rate for channel 45 for the first 15 s.
Figure 10.
The rate for channel 45 for the first 15 s.
Figure 11.
The rate for channel 45 with an average window equal to 100 for the first 15 s.
Figure 11.
The rate for channel 45 with an average window equal to 100 for the first 15 s.
Figure 12.
The rate for channel 45 with an average window equal to 1000 for the first 15 s.
Figure 12.
The rate for channel 45 with an average window equal to 1000 for the first 15 s.
Figure 13.
The rate for channel 45 with an average window equal to 10,000 for the first 15 s.
Figure 13.
The rate for channel 45 with an average window equal to 10,000 for the first 15 s.
Figure 14.
The rate for all channels in the range of 1–64 with an average window equal to 1000 for the first 15 s using global trigger mode.
Figure 14.
The rate for all channels in the range of 1–64 with an average window equal to 1000 for the first 15 s using global trigger mode.
Figure 15.
Tests of the system with the local trigger with an X-ray tube as a source: (a) energy spectrum; (b) topology spectrum (events per channel); (c) number of events in time.
Figure 15.
Tests of the system with the local trigger with an X-ray tube as a source: (a) energy spectrum; (b) topology spectrum (events per channel); (c) number of events in time.
Figure 16.
The maximal rate for channel 45.
Figure 16.
The maximal rate for channel 45.
Figure 17.
The rate for channel 45 with an average window equal to 100.
Figure 17.
The rate for channel 45 with an average window equal to 100.
Figure 18.
The rate for channel 45 with an average window equal to 1000.
Figure 18.
The rate for channel 45 with an average window equal to 1000.
Figure 19.
The rate for channel 45 with an average window equal to 10,000.
Figure 19.
The rate for channel 45 with an average window equal to 10,000.
Figure 20.
The rates for all channels in the range 1–64, with an average window equal to 10,000.
Figure 20.
The rates for all channels in the range 1–64, with an average window equal to 10,000.
Table 1.
Comparison between first and second generations of the SXR FPGA measurement system.
Table 1.
Comparison between first and second generations of the SXR FPGA measurement system.
| Parameter | KX1 JET | GEM SXR WEST |
|---|
| Key characteristic | Hardware histogramming system | Real-time raw data streaming system |
| Number of channels | 256 | 112 (for this design)
Up to 512 per unit |
Sampling
freq. | 77.78 MHz | 80.0 MHz |
| Sample resolution | 10 bits | 12 bits |
| Histogram resolution | 10 ms | Software based,
no limitation in hardware |
| Used FPGAs | 21× Xilinx Spartan6 | 2× FPGAs Xilinx Artix7 |
| System control | Software
based on C/Python/Matlab | Low-level software based on C/C++/Python.
Additional Matlab for laboratory tests |
| Data channels | PCI Express,
fast serial links | PCI Express Gen2 × 4 (multiple), SERDES links |
| Other features | Modular,
flexible construction,
FMC standard for ADC boards | Modular,
flexible construction, custom boards |
| Key elements | Whole data processing is performed in FPGAs
Real-time data processing | Real-time streaming of raw signal events from detector
Real-time data histogramming on the embedded PC platform (under work)
Radiation hard design
Analog path distributed on 10 m length |
| Disclaimer/Publisher’s Note: The statements, opinions and data contained in all publications are solely those of the individual author(s) and contributor(s) and not of MDPI and/or the editor(s). MDPI and/or the editor(s) disclaim responsibility for any injury to people or property resulting from any ideas, methods, instructions or products referred to in the content. |
© 2023 by the authors. Licensee MDPI, Basel, Switzerland. This article is an open access article distributed under the terms and conditions of the Creative Commons Attribution (CC BY) license (https://creativecommons.org/licenses/by/4.0/).


 ,
, 


