1. Introduction
General anesthesia is a medical procedure in which a person is put into a coma-like state, during which they lose consciousness and their protective reflexes are suppressed [
1,
2]. This allows them to undergo surgical or other medical procedures without being aware of or feeling pain. Clinically, general anesthesia is typically divided into three components: sedation, analgesia, and muscle relaxation. The depth of sedation and muscle relaxation during the procedure can be monitored using electroencephalogram (EEG) [
3] and electromyogram (EMG) [
4], respectively. However, there is still a lack of a relatively accurate method for measuring the level of intraoperative noxious stimulation and analgesia [
5]. Currently, anesthesiologists rely on their experience to control the dosage of anesthetic drugs to avoid postoperative pain. However, this approach can be unreliable, as different anesthesiologists may possess varying levels of experience and judgment, leading to inconsistent interpretations and outcomes. As a result, it is important to accurately predict the level of postoperative pain in order to help anesthesiologists determine the appropriate dosage of anesthetic drugs, improving the stability and reliability of the anesthetic process.
To reduce the risk of acute postoperative pain, researchers have focused on developing measures of intraoperative analgesia levels and have proposed a range of indicators. These efforts aim to improve the accuracy and reliability of anesthetic drug dosing to control pain levels after surgery better [
6,
7,
8,
9]. Although these indicators may aid anesthesiologists in improving the control of analgesic drug administration, their calculation often necessitates the use of additional monitoring equipment, which can make the deployment of these indicators expensive and may limit their widespread adoption in clinical settings.
We propose a postoperative pain prediction system that leverages two key opportunities: (i) the clinical experience of anesthesia medical staff and (ii) the data commonly collected by modern medical institutions. According to the guidelines of clinical anesthesiology, anesthesiologists typically consider two aspects of a patient when administering anesthetics: basic physical information (such as height, weight, and age) and fluctuations in physiological signs (such as blood pressure) during surgery. By using these factors to guide the amount and timing of drug administration, anesthesiologists aim to reduce the risk of acute postoperative pain. By modeling the relationship between these patient status variables and postoperative pain levels using historical data, we can develop a system that helps anesthesiologists better predict and control postoperative pain.
Predicting postoperative pain is challenging for several reasons: (i) each patient’s physiological conditions are unique, making it difficult to identify patterns of postoperative pain, and (ii) fluctuations in vital signs can be challenging to interpret and may not always provide reliable insights into a patient’s pain levels.
We design a framework named DoseFormer, which utilizes standard sensors and monitors to predict postoperative pain and assist in intraoperative narcotization by a dynamic graph transformer model. DoseFormer consists of two modules. The first module uses an attention-based long short-term memory (LSTM) model to combine static physical data and dynamic intraoperative data to create a hybrid semantic embedding that represents various aspects of the patient’s information. The second module uses a graph transformer network (GTN) to accurately predict postoperative pain by examining the relationships among the semantic embeddings of patients. Our main contributions are as follows:
To the best of our knowledge, we are among the first to use deep learning and prevalent patient data from current operating systems to measure intraoperative nociceptive stimulation and guide analgesia.
Technically, we developed DoseFormer, a multi-modal system designed for predicting postoperative pain. The DoseFormer system leverages a combination of static and dynamic features, as well as patient relationships, to assist anesthesiologists in making informed decisions about the optimal level of narcotization required during surgery.
We evaluated our model using real-world medical records from 999 patients and found that it achieved 92.16% accuracy, outperforming several baselines in terms of comprehensive performance. Data and codes are released at
https://github.com/zxh991103/DoseFormer accessed on 15 July 2023.
The rest of this paper is organized as follows.
Section 2 describes the motivation, and
Section 3 reviews the related works. In
Section 4, we introduce the system framework.
Section 5 describes the main design.
Section 6 evaluates the performance. Lessons learned and limitations are discussed in
Section 7, and finally,
Section 8 concludes the paper.
2. Motivation
In this section, we explain the importance of developing a system for predicting postoperative pain at the current level of analgesia. Then, we discuss the challenges of predicting postoperative pain.
2.1. Background
Intraoperative analgesia is crucial in clinical settings because insufficient analgesia can lead to acute postoperative pain and other complications. In a cross-sectional observational study [
10] of over 15,000 UK patients who underwent surgery in 2016, 11% reported experiencing severe pain in the first 24 h, and 37% reported experiencing moderate pain. A prospective cohort study in Germany [
11] found that up to 47.2% of 50,523 patients experienced severe pain (at least 8 out of 10 points) in the first 24 h after surgery. Due to the high prevalence of postoperative pain, it is crucial to improve intraoperative analgesia technology to help patients recover more quickly and comfortably after surgery.
2.2. Demand for Postoperative Pain Prediction
Currently, most hospitals rely on traditional methods of measuring analgesia, such as relying on anesthesiologists to determine the appropriate level of narcotization based on expert knowledge and clinical experience. In top hospitals, such as grade III level A hospitals in Zhejiang Province, China, the prevalence of analgesic level monitoring instruments is less than 80%. In other hospitals, such instruments often need to be improved. Our postoperative pain prediction system uses only the anesthesia monitor, which is already used in most general anesthesia procedures and does not require additional sensors or increase hospital costs. As a result, our system is more practical and less burdensome for patients compared to existing methods.
2.3. The Challenges
There are two challenges to be addressed in developing a postoperative pain level prediction system. (i) Fluctuations in patient signs during surgery: Clinical experience shows that anesthesiologists often only have the capacity to pay attention to changes in patient sign waveforms over a short period, leading to inaccurate dose control of intraoperative analgesics. It is necessary to extract features that may predict postoperative pain from the fluctuations in patient signs to address this issue. (ii) Diversity of patient physiological conditions: Different patients have complex, individual physiological conditions that can affect their need for narcotic drugs. For example, a patient’s height and weight may influence their dosage. These individual differences can make it difficult to identify the cause of pain and can challenge anesthesiologists with less clinical experience to provide appropriate care. Therefore, our prediction model considers these individual differences in patients.
3. Related Work
3.1. Monitoring of Intraoperative Analgesia
According to clinical teaching, there is a correlation between pain and disorders in vital signs [
12]. Traditional intraoperative analgesia techniques rely solely on manual observation of specific vital signs disorders. Several new monitoring devices have been developed that use measurements of the patient’s sympathetic and parasympathetic nervous systems to infer current levels of analgesia, including SPI, PPI, ANI, and NoL. These techniques have been demonstrated to assist anesthesiologists in controlling the dosage of opioids and reducing postoperative pain in patients [
13,
14]. However, few technologies are widely used in clinical practice, and some have limited applications. For example, SPI can be affected by drugs or pacemakers [
15], and PPI cannot be used on patients with eye diseases. Our research aims to develop an analgesic guidance technology that could be easy to implement in clinical practice. Additionally, since our method is still at the theoretical level and has not yet been tested in clinical trials, we are unable to compare the performance of different techniques using the same evaluation system.
3.2. Machine Learning Medical Application
Some studies apply machine learning algorithms to predict the onset of diseases, such as pneumonia and sepsis, as well as adverse reactions to drugs and other medical treatments. These methods have shown promising results in terms of accuracy and effectiveness and have the potential to significantly improve patient outcomes by allowing medical staff to take proactive measures. XGBoost and Logistic Regression are used to predict breakthrough pain during labor analgesia using neuraxial techniques. The authors of [
16,
17] used XGBoost to predict intraoperative hypoxemia, and [
18] used Logistic Regression to predict intraoperative hypotensive events.
In addition, deep learning techniques are utilized to predict the depth of anesthesia [
19,
20,
21] but not postoperative effects. Recently, a graph-based neural network that utilizes patient similarity has been applied to predict postoperative pain [
22]. However, it only separately utilizes static and dynamic temporal features instead of combining them for maximum effect. Therefore, to better exploit both static demographic and dynamic intraoperative information, we design the graph-based multi-modal
DoseFormer, aiming to predict the likelihood of postoperative pain in patients and suggest adjustments to the anesthesiologist’s use of analgesics.
4. System Overview
In this section, we provide an overview of the data collection and system functions. Then, we explain the design of the proposed postoperative pain prediction system.
4.1. Patient Data Collection
The data are sourced from the Fourth Hospital Affiliated with Zhejiang University’s hospital information system (HIS) and anesthesia information collection system (DoCare). The subjects are patients who received cardiothoracic surgery at the Fourth Hospital Affiliated with Zhejiang University from 1 January 2018 to 31 December 2020.
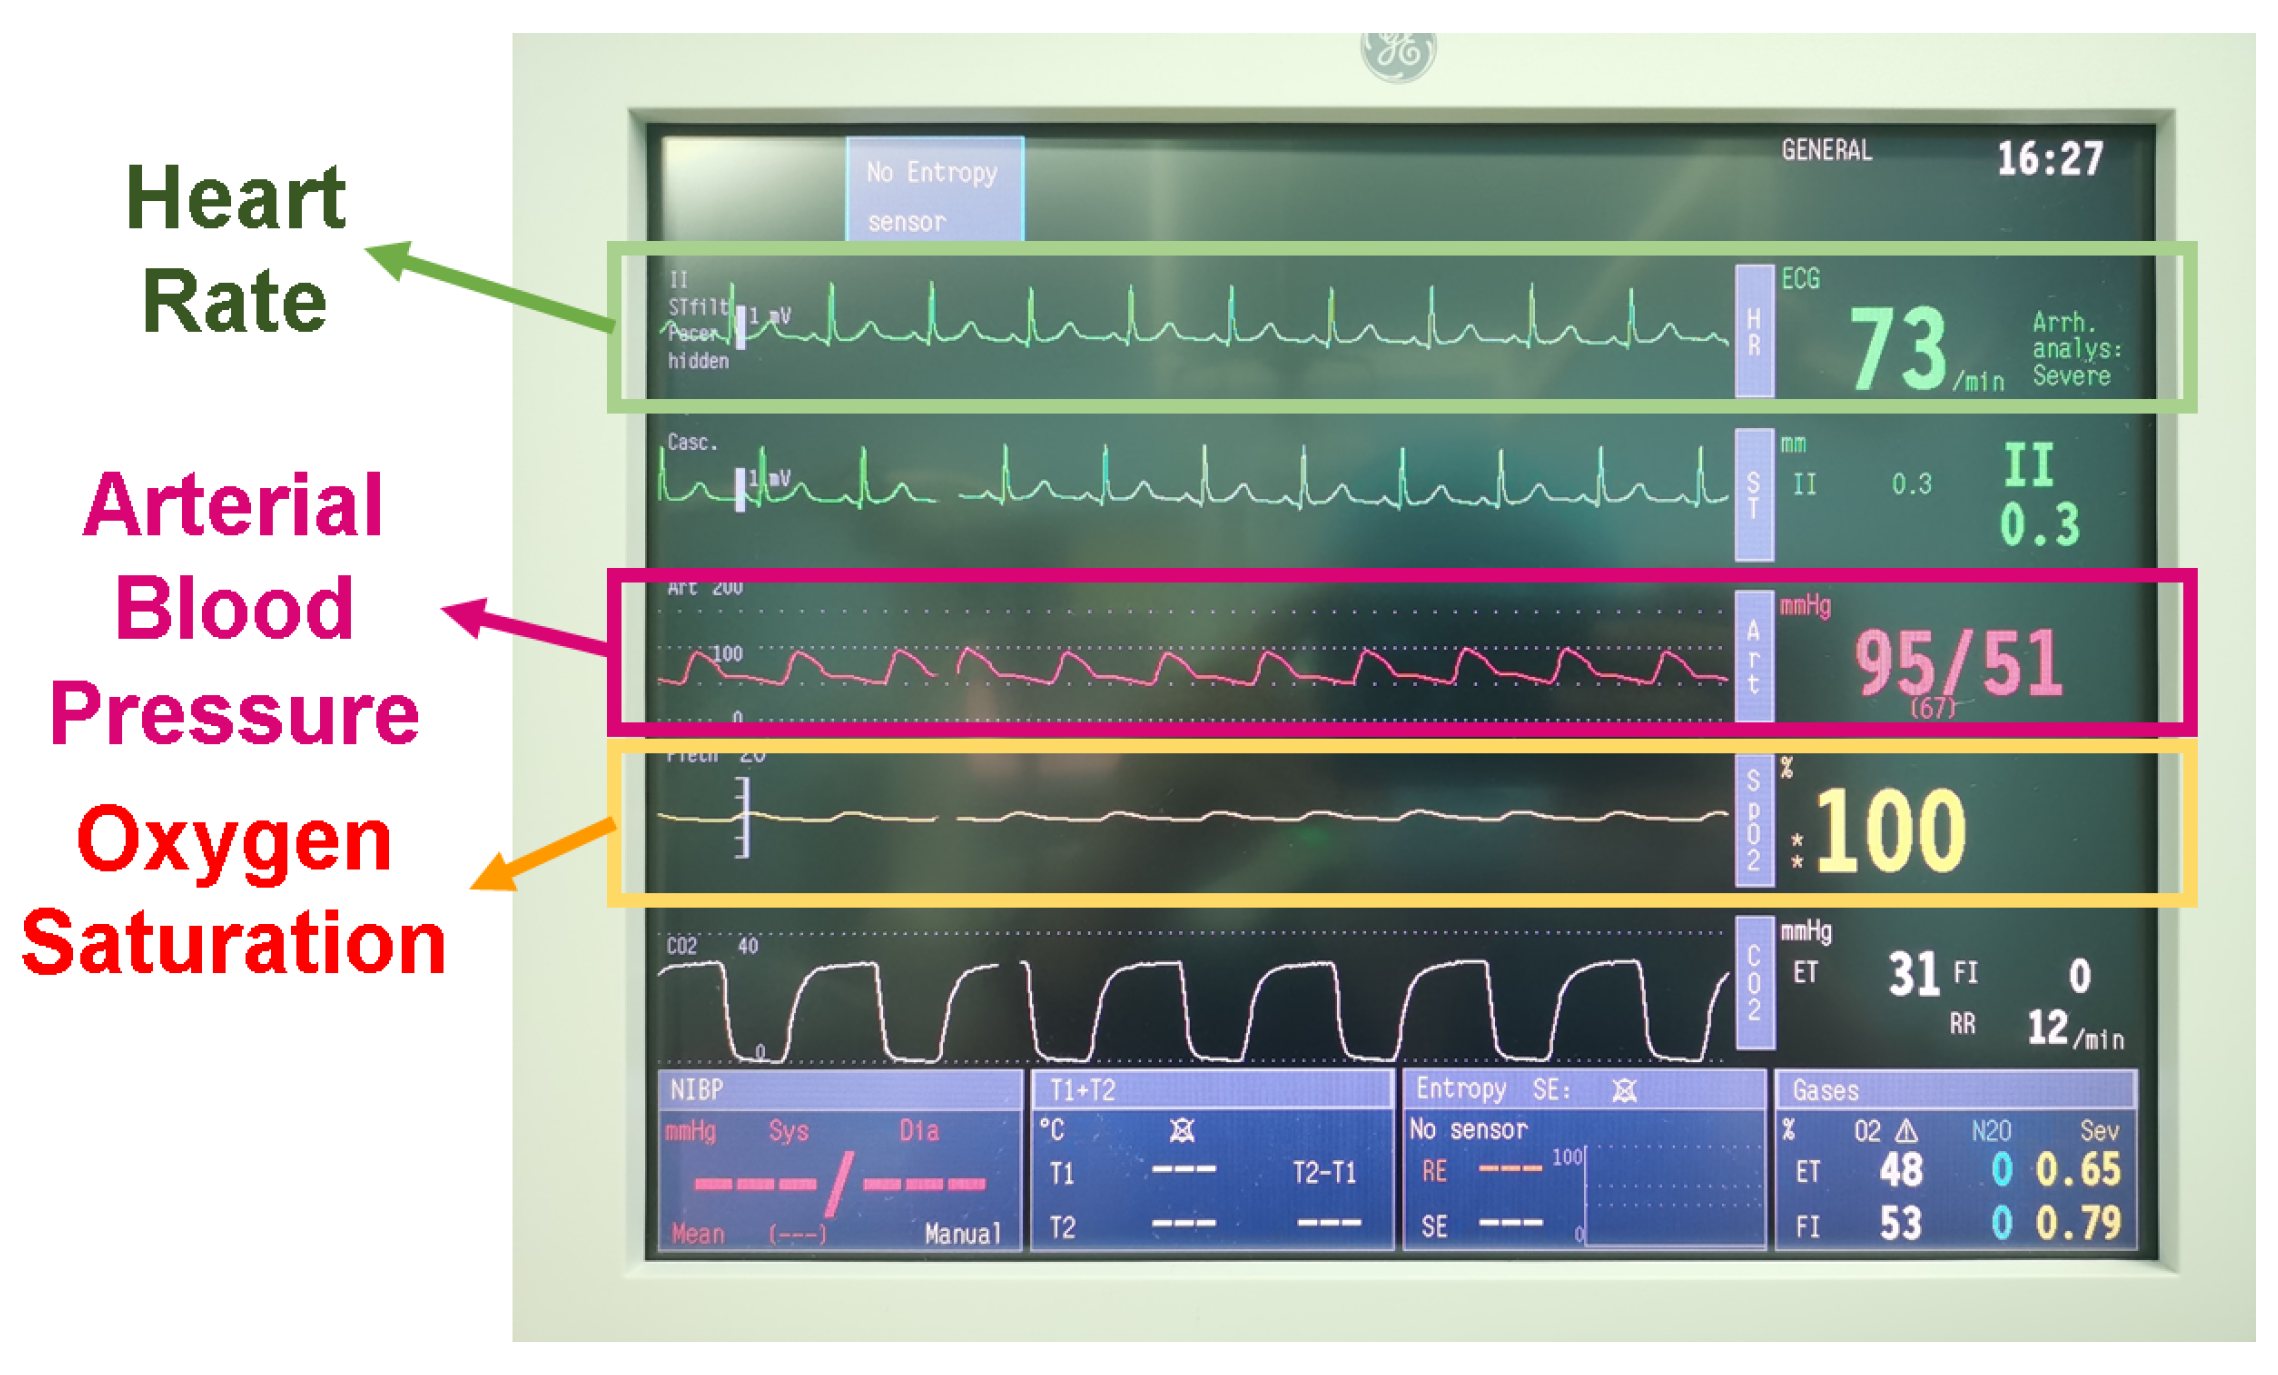
Figure 1 displays the anesthesia monitor used during the operation. It continuously collects the patient’s vital signs data every 5 min during surgery and saves these data in real time.
4.2. System Workflow
DoseFormer predicts the likelihood of postoperative pain in patients. Postoperative pain refers to the pain experienced by patients within 30 min of waking up from anesthesia. If the intraoperative analgesic drugs provide adequate pain relief, the patient will not experience discomfort during their postoperative recovery. The results of predictive models can indicate the sufficiency of the intraoperative analgesic drug dose and assist the anesthesiologist in making adjustments to ensure optimal pain management. The workflow of the
DoseFormer system is illustrated in
Figure 2a. The process starts with the vital record instrument collecting data even before the surgical procedure commences. These vital signs are recorded at 5-minute intervals and are transmitted to our system in real time. By incorporating these records with the patient’s static characteristics, the system generates a predicted postoperative pain index as its output.
4.3. Design Overview
The system architecture is depicted in
Figure 2b and comprises three essential components:
Data set: The Data set module is responsible for collecting and preprocessing data, which includes basic patient information and anesthesia data recorded in the DoCare system. This module continuously updates with 5-minute intervals on the patient’s status during surgery.
DoseFormer System: The DoseFormer system is in charge of performing inference. The server utilizes the collected data to continually update the model and predict the patient’s likelihood of experiencing postoperative pain. As new data are received, the calculation component adjusts the prediction results accordingly.
Guidance: The Guidance module handles interactions with users. Once the server returns the prediction results, they are displayed on the hospital client’s application. These results serve as a reference for anesthesiologists to make informed decisions on supplementing analgesic drugs for patients.
5. The DoseFormer Model
This section outlines the design of the DoseFormer model, including the overall framework and the function and structure of each module.
5.1. Overall Framework
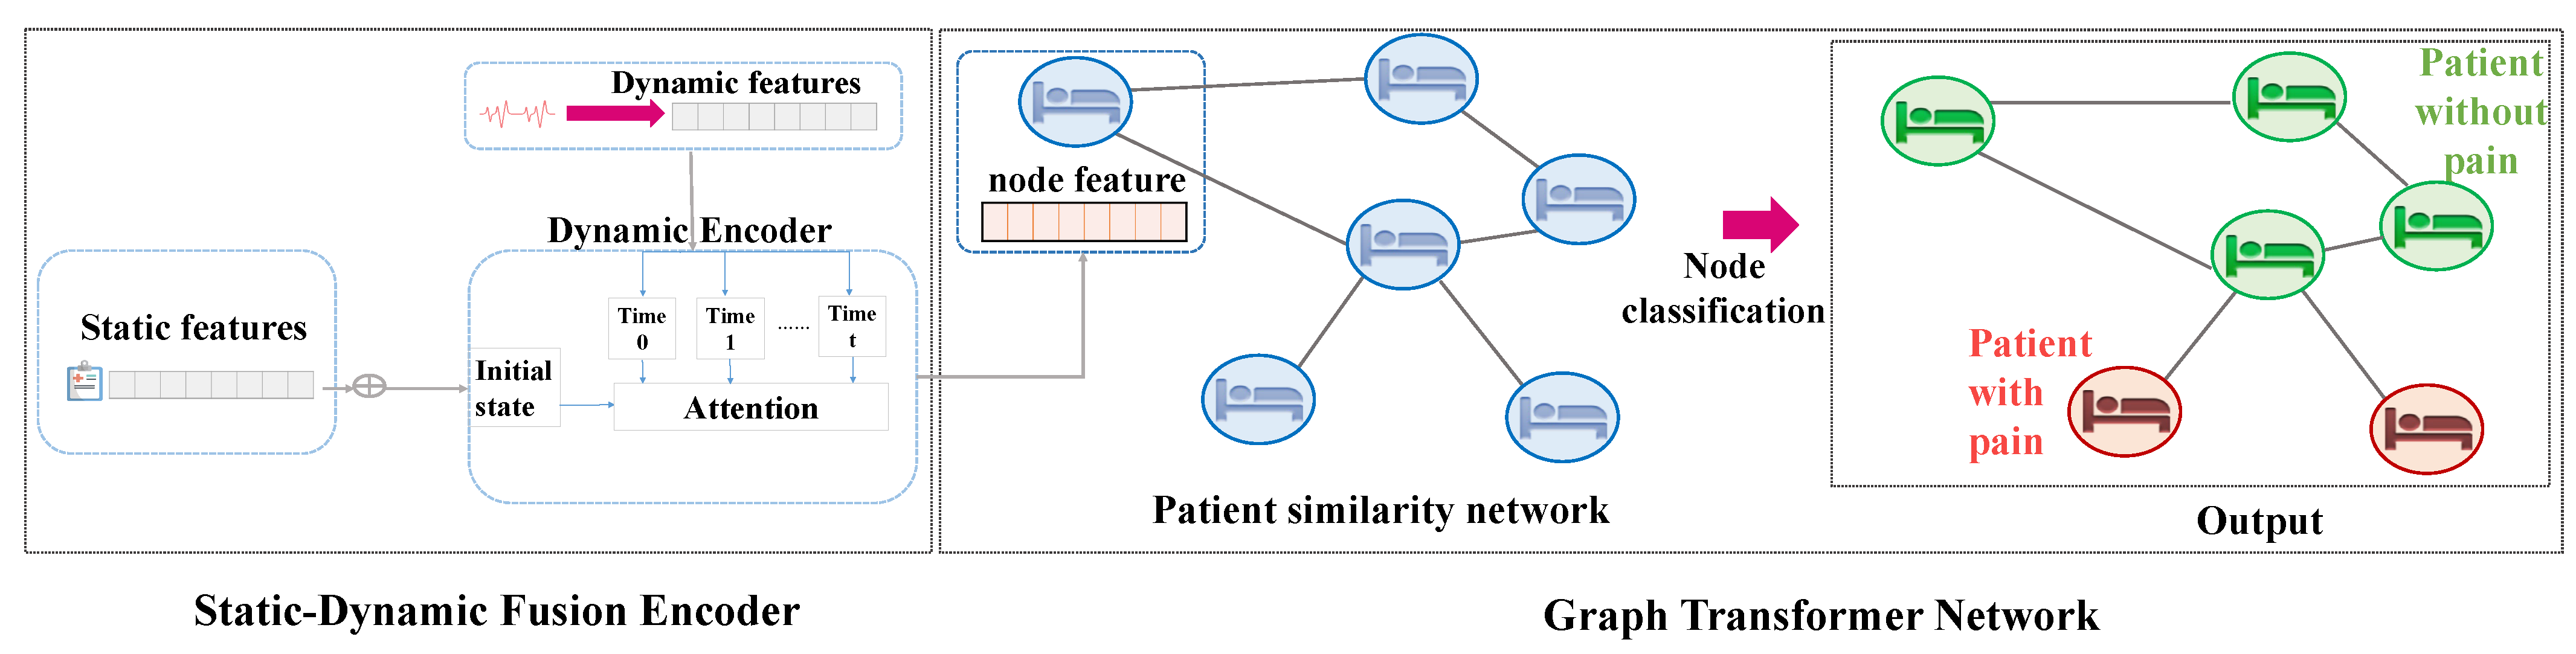
The overall
DoseFormer framework is shown in
Figure 3. Our model utilizes a dynamic encoder, initialized with static features, to extract the hybrid semantic features for each patient. Clinical experiences suggest that postoperative pain is correlated with a patient’s physiological status. This means patients with similar physiological conditions are likely to respond similarly to treatment and exhibit similar outcomes. To represent the similarity between patients, we use a graph structure and a graph neural network to uncover the patterns in the data. We introduce a dynamic forward process that utilizes static–dynamic fused embeddings for similarity-weighted graph construction as the input for the graph neural network, which enhances the representation of patient data. To enhance the representation capability of the graph neural network and adapt the dynamic forward process of graph construction [
23], we employ Graph Transformer Networks (GTN) [
24] to uncover the patterns in the data. GTN then classifies the nodes and predicts whether the patient is likely to experience postoperative pain based on their current state.
In summary, the task of our DoseFormer model is to predict whether a patient will experience postoperative pain. This prediction task involves two classes: not having postoperative pain, marked as 0, and having postoperative pain, marked as 1. Our model takes multiple inputs, including static physical features from the HIS system (e.g., age, gender), static clinical features from the DoCare system (e.g., anesthetic drug, surgical position), and dynamic signals recorded during surgery from the DoCare system (e.g., heart rate, oxygen saturation). Subsequently, the model outputs two probabilities: the probability of having postoperative pain and the probability of not having postoperative pain, where the sum of these two probabilities is one, enabling the model to directly compare them and predict whether a patient will experience postoperative pain.
Furthermore, postoperative pain typically occurs after surgery and can be managed by anesthesiologists. Based on the prediction results from our model, anesthesiologists can make informed decisions regarding whether to increase or decrease specific drugs to aid patients in alleviating and preventing postoperative pain effectively.
5.2. Dynamic Encoder
The dynamic encoder, depicted in
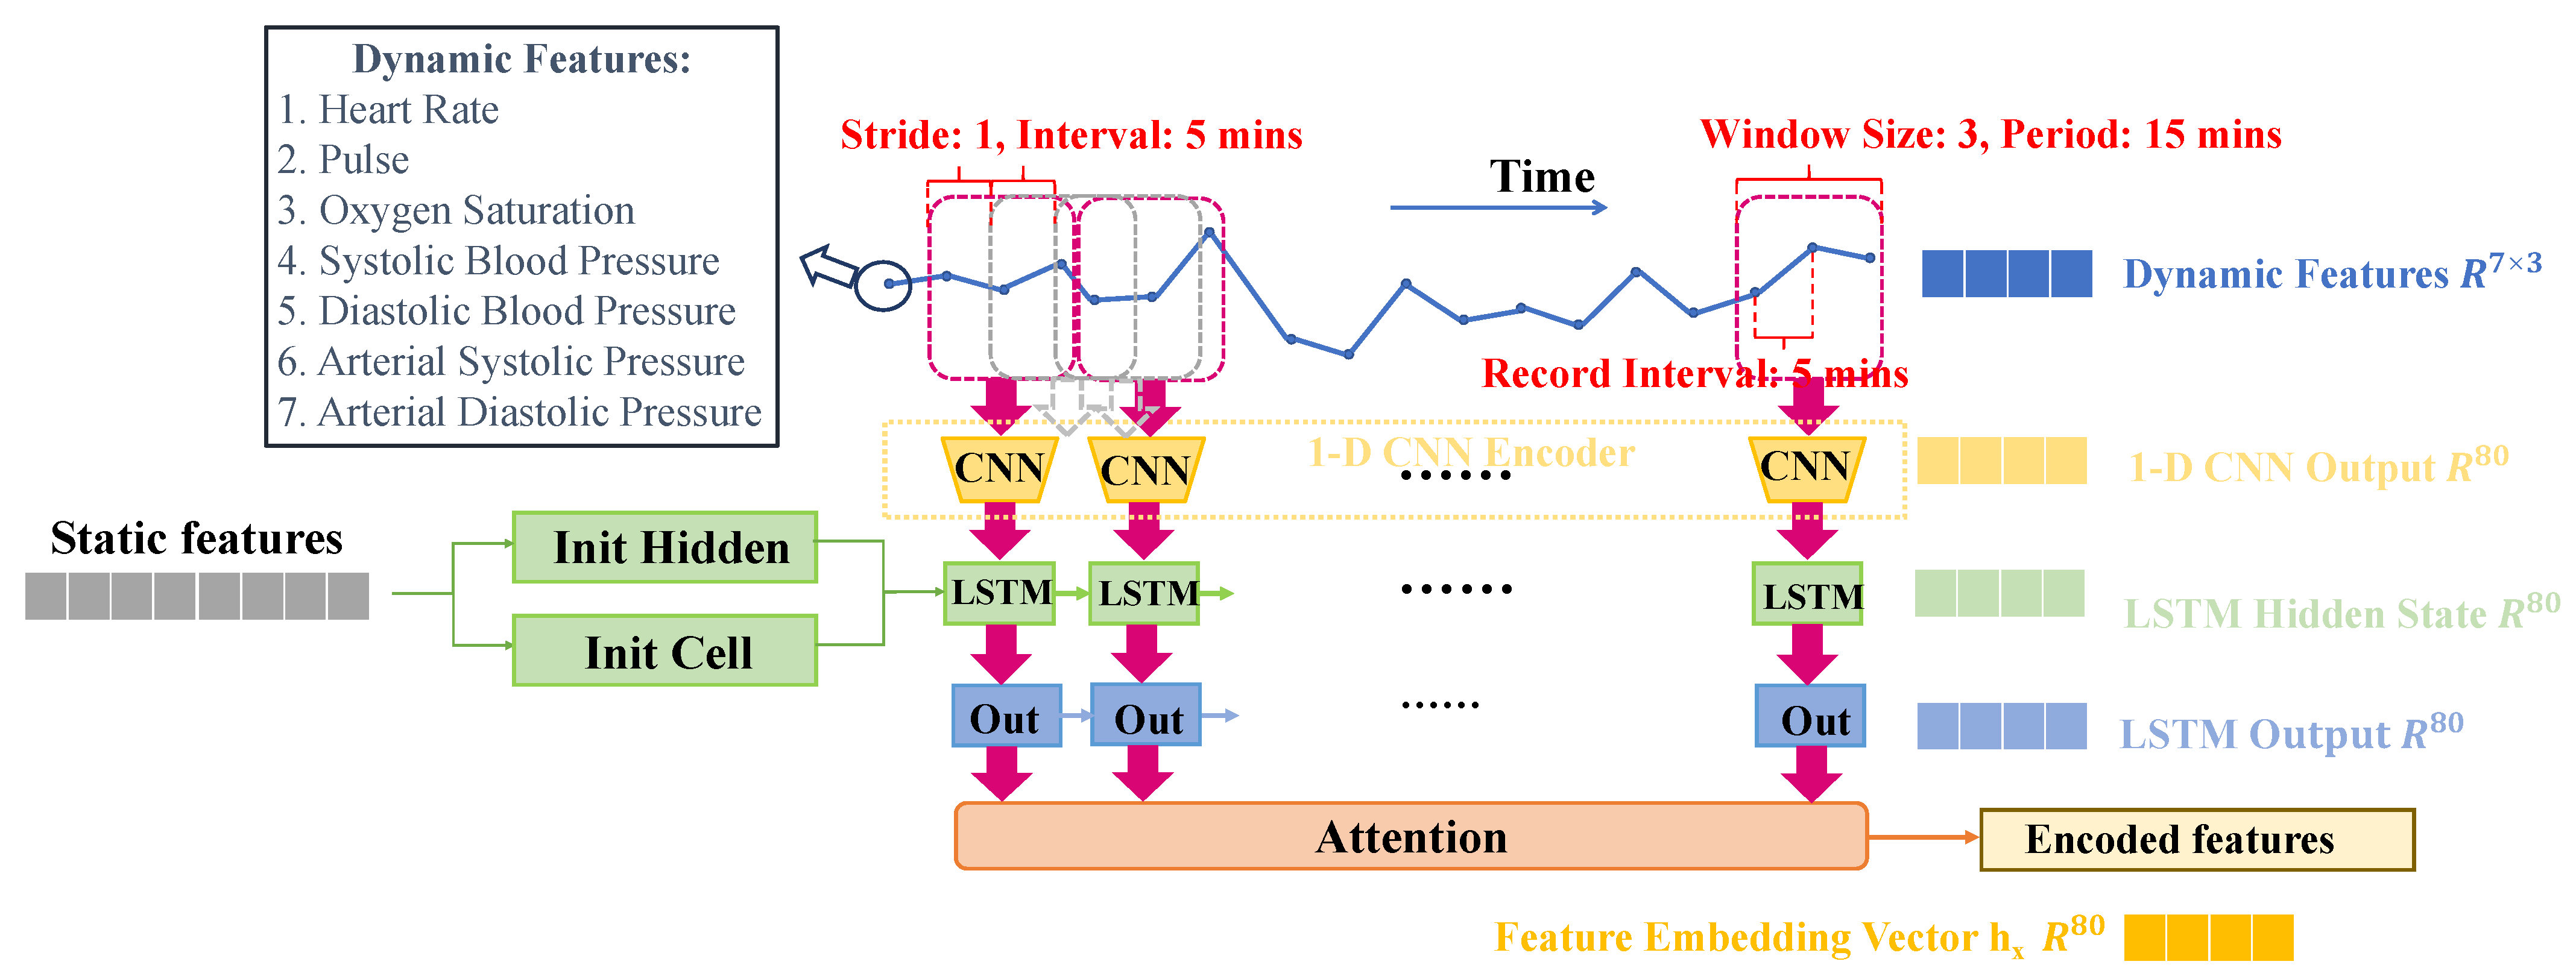
Figure 4, captures static features, such as age, sex, and type of operation, and dynamic features during the operation, such as systolic arterial pressure, heart rate, and oxygen saturation, and fuse both of them to a hybrid feature embedding. The dynamic encoder is divided into two sub-modules: a CNN-LSTM module and an attention module.
Firstly, anesthesiologists typically take into account static patient features, such as age and gender, before surgery. To leverage this prior knowledge effectively, we designed the CNN-LSTM module, where we utilize the static information to initialize the temporal model LSTM, aiming to model the prior knowledge of anesthesiologists when they observe the dynamic signs during surgery.
Secondly, after conducting further consultations with professional anesthesiologists, we gained insight into their practice of focusing more on signs during specific periods, notably when the patient begins anesthesia and when the surgery concludes. Considering this observation, we design the attention module to augment the temporal model LSTM, which captures the most significant signals during the surgery, aligning with the key moments of interest for anesthesiologists.
Finally, we were able to obtain a hybrid feature embedding for each patient from the dynamic encoder.
5.2.1. CNN-LSTM
In this module, we implement a long short-term memory (LSTM) model [
25] combined with a 1D convolutional neural network (CNN). In the 1D-CNN structure, we set the window size to three, based on insights from our investigation into surgical procedures and feedback from anesthesiologists. The patients’ dynamic physical signals, such as heart rate and oxygen saturation, are recorded every 5 min, and anesthesiologists typically consider the physical signals within a 15-min window. To effectively model the anesthesiologists’ experience, we opted for a window size of three, enabling us to capture pertinent dynamic information within a timeframe similar to their evaluation practices. Furthermore, to reflect the continuous monitoring approach of anesthesiologists during surgery, we set the stride of the CNN to one. This choice ensures that the dynamic feature windows overlap, aligning with medical norms. As a result, our 1D-CNN structure comprises three
1D-convolutional layers with 80 channels each, followed by a global average pooling layer, which transforms each window of temporal data into an 80-dimensional representation.
The LSTM model uses the static features (e.g., age, gender) to initialize the hidden and cell states and inputs the temporal embeddings in each time step. The outputs of the LSTM across all time steps represent the embedding of the whole dynamic feature during the operation. An attention module is then applied to these outputs to obtain the final encoder features for each patient.
In summary, the CNN-LSTM module takes multiple modalities as input, including systolic blood pressure, diastolic blood pressure, arterial systolic pressure, arterial diastolic pressure, heart rate, pulse, and oxygen saturation. For a patient x, the dynamic temporal features input into the CNN-LSTM module form a matrix , where 7 represents the number of feature types from the various modalities, and denotes the duration of the operation time. The module then produces a feature matrix as output, where t is the number of windows of temporal series data, and F is the LSTM output’s hidden size.
5.2.2. Attention
According to clinical experience, an anesthetist usually pays more attention to some intervals that represent the state change of the patient rather than the whole operation period. Therefore, we want to extract important information from the LSTM outputs across all time steps. In this module, we use the attention method to deal with the information extraction problem, which is mostly used in sequence prediction [
26] and classification [
27]. Shown in
Figure 5, details of our attention module are as follows:
Given the LSTM outs of a patient x,
,where
t is the number of the window of the temporal series data. As shown in Formula (
1), we are supposed to construct
to make attention operation, where the projects are trainable parameter matrices
,
,
We calculate the attention vector
by Formula (
2),where
,
Then, we obtain the feature embedding vector
of a a patient
x by Formula (
3),
5.3. Graph Transformer Network
5.3.1. Problem Description
Considering a patient’s features, x, , where n is the number of features in the feature set. The system is supposed to predict the likelihood of postoperative pain in the patient with the output . The postoperative pain prediction problem can be treated as a node classification problem in the context of graph neural networks.
5.3.2. Input Construction
Our data set is transformed into a graph for input into the GTN, with each patient represented as a node in the graph. We compute the cosine similarity distance using feature vectors from the dynamic encoder for each pair of patients. Let and be the feature embeddings for two patients. The similarity between them is calculated as . Subsequently, we introduce a threshold , which is a hyper-parameter. If the calculated distance is less than the threshold , we consider that there is no edge connection between the two patients. On the other hand, if the distance is equal to or greater than the threshold , we include it as the similarity weight between the two patients. In the above process, we add it to the network, and, finally, a stable graph structure can be obtained. In other words, if two patients have a high level of similarity, an edge is established between their corresponding nodes in the graph. The weight of the edge is proportional to the similarity between the two patients. To create the input for the model, we build a feature matrix and an arc table for each feature set.
Given a simple undirected weighted graph , is the node set and is the edge set, where and .
The node feature input is defined by the feature matrix , where N represents the number of features for each patient, and M represents the total number of patients. The feature matrix’s i-th row represents the feature embedding vector of the i-th patient, and the edge feature input is defined by an arc table. If an edge exists between nodes and with a weight of , a triple is included in the arc table to represent the edge.
5.3.3. Node Embedding Update
In the previous section, we outlined the input graph’s structure and node features. The graph neural network allows each node to extract the embedded information from its neighboring nodes [
28], leveraging the similarity between patients. The node features will be used to initialize the node’s hidden state by the dynamic encoder,
,
, where
N represents the number of nodes, and
F represents the number of node features for each node. In order to show the workflow of the graph transformer network, demonstrated in
Figure 6, we will detail how to obtain the aggregated embedding
from the embedding
from the static–dynamic fusion encoder.
For node
, the objective is to gather information from neighboring nodes, aggregate it, and use it to update the node
’s feature embedding. As shown in Formula (
4),
where
denote the transformation matrices of the center patient node
for querying, and
denote the transformation matrices of the neighboring patient node
, used for key and value, respectively. Additionally,
depicts the embedding of the center patient nodes that queries the neighboring patient nodes;
represents the index of the neighboring patient nodes, and
depicts the transformed embedding for the neighboring patient nodes.
The attention
for the center patient node
of the neighboring patient node
is calculated by:
where
, and
denotes the node set including
neighboring patient nodes relating to a center patient node
i.
Thus, the aggregated information of neighboring patient nodes for the center patient node
is denoted as
:
Finally, we utilize a gated residual connection module [
29] to obtain the hybrid embedding
of the center patient node
:
5.3.4. Prediction and Train
With the hybrid embedding
of the center patient node
, we utilize an MLP structure and a softmax layer to obtain the postoperative pain probability
of the patient
i:
Then, we utilize the MSE loss function to define the loss of the
DoseFormer model, and
represent the ground truth of patient
i:
6. Experiment Setups and Results
6.1. Data Sets
Our system is tested using real-world data sets. After conducting data cleaning, a total of 999 patient records were used for analysis. The HIS information in this study is presented in
Table 1, and the data from the DoCare system are shown in
Table 2. In this study, information that can be determined before surgery is referred to as static information, while continuously changing vital signs during surgery is referred to as dynamic information. Static data are represented as discrete values, while dynamic information is expressed as a continuous waveform signal. We processed the data set as follows:
For each patient, multiple treatments may be performed during a single surgery. Under expert guidance, these treatments are divided into 16 categories based on the similarity in the degree of intraoperative noxious stimulation they cause to patients. The surgical information is then encoded using 16 binary variables.
The data regarding drug administration during surgery consist of two primary features: the anesthesia method and anesthetic drug, both of which are recorded in the DoCare system. The anesthesia method is a non-numerical feature that indicates the type of anesthesia used, such as general anesthesia or local anesthesia. In contrast, the anesthetic drug is a numerical feature that conveys information about the type and dosage of the administered drug.
In the DoCare system, the ASA classification assesses drug efficacy on a scale from one to five, with each level representing the severity level from least to most serious.
To convert non-numerical features (e.g., the anesthesia method) into a numerical format, we utilize One-Hot encoding and combine them with numerical features (e.g., anesthetic drug). This procedure allows us to obtain the static features represented numerically. Subsequently, we feed these features for each patient into the MLP networks, which then initialize the hidden and cell states of the LSTM module in the dynamic encoder. This initialization step effectively models the prior knowledge of anesthesiologists when they observe the dynamic signs during surgery.
In total, 72 features are extracted from the original data set.
6.2. Evaluation Metrics
DoseFormer is designed to assist anesthesiologists in determining the appropriate dosage of analgesic drugs. Therefore, when evaluating the system’s performance, it is crucial to consider its clinical applicability. In line with this, four performance indicators have been chosen for evaluation: accuracy, sensitivity, specificity, and SS1-score, such as the F1-score in the Formula (
10).
Our data set consists of 254 patients with postoperative pain and 745 patients without postoperative pain, resulting in a ratio of approximately 1:3 between the two groups. Although there is a slight sample imbalance, we have implemented measures to account for this during our evaluation process. To ensure a comprehensive evaluation, we have not solely relied on the accuracy metric. Instead, we have incorporated sensitivity, specificity, and SS, which are widely utilized in the medical field. These additional metrics provide a more thorough assessment of the model’s performance across various aspects and help address the potential impact of the sample imbalance.
Sensitivity refers to the ability of the algorithm to identify patients with postoperative pain accurately. Given the goal of reducing opioid use while preventing postoperative pain, incorrect identification of patients with enough drug coverage would increase the risk of over-drug use, which is unacceptable. Hence, sensitivity is a crucial evaluation metric.
Specificity refers to the accuracy of the algorithm in identifying patients who did not experience pain after surgery. To evaluate the system’s ability to assist anesthesiologists, 100 patients were randomly selected. Real anesthesiologists were asked to examine the sub-data set and compare the results with the algorithm’s output.
6.3. Baseline Approaches
In order to verify whether the graph transformer network can utilize the similarity between patients and improve performance, we compared eight commonly used and powerful classic algorithms, including logistic regression (LR) [
30], support vector machine (SVM) [
31], k nearest neighbor (KNN) [
32], decision tree (DT) [
33], bagging algorithm (Bag) [
34], random forest (RF) [
35], extra trees (ET) [
36], extreme gradient boosting (XGB) [
37], and DoseGuide [
22]. The implementation details are outlined in
Appendix A.1.
6.4. Experimental Results
Table 3 demonstrates our algorithm’s improved accuracy, sensitivity, and specificity compared to others. In this context, accuracy can be used to measure the algorithm’s overall performance. The table shows that our model’s accuracy is higher compared to other algorithms. Compared to the state-of-the-art model DoseGuide, DoseFormer exhibits significant improvements in multiple performance metrics. Specifically, it enhances the accuracy rate by 7.34%, the sensitivity rate by 5.21%, the specificity rate by 15.11%, and the SS
rate by 10.9%. These improvements underscore the superior predictive capabilities of the DoseFormer model. We also conducted a t-test for the significance test that our results are statistically significant with a
p-value < 0.05 compared to the best baseline DoseGuide, and the differences between DoseFormer and DoseGuide are presented in
Appendix A.2.
The recall rate of our algorithm represents its ability to identify patients without postoperative pain correctly. The table demonstrates our model’s superior performance, with a sensitivity of over 90%. This indicates a low chance of misidentifying patients without pain, thereby avoiding the mistake of over-dosing them with analgesics. This is acceptable because, according to senior anesthesiologists, postoperative pain can be more harmful to patients than increased anesthesia. This highlights the practical application value of our model.
Real anesthesiologists use their experience and expertise to make predictions based on patient information and data. These predictions are then compared to the actual postoperative pain levels reported by the patients to evaluate the accuracy of the traditional pain management methods. Our model performs better and can help anesthetists identify 12% more pain patients.
Since we employ a 10-fold cross-validation to train the model, we calculate the standard deviation for each evaluation metric to assess the model’s robustness. The standard deviation for accuracy is 0.0174, for sensitivity is 0.0101, for specificity is 0.0193, and for sensitivity is 0.0135, demonstrating the stability of our model.
To validate the effectiveness of our proposed dynamic encoder structure, we conducted ablation experiments, and the results are presented in
Table 4. Our novel static–dynamic feature fusion method demonstrates significant improvements, yielding an increase of 3.15% in accuracy, 6.17% in sensitivity, 4.65% in specificity, and 5.37% in SS
score.
From the above
Table 4, we find that both the initialization state of LSTM and the output attention are significant. In summary, the performance of our model exceeds the baselines. This verifies our hypothesis that unstructured information, such as the similarity between patients, can improve the performance of the algorithm’s prediction task.
6.5. Visualization
6.5.1. t-SNE Visualization of Feature Embedding
In
Figure 7, there are a total of 509 points, with each point representing a patient who underwent surgery under anesthesia at the Fourth Affiliated Hospital of Zhejiang University School of Medicine between 1 January 2020 and 31 December 2020. The green points on the figure represent patients without postoperative pain, while the orange points represent patients with postoperative pain.
We utilize the t-SNE algorithm to reduce the feature embedding vectors, which are output by the dynamic encoder module, into a two-dimensional representation. Through this visualization, we observe that our dynamic encoder effectively fuses the static and dynamic features, allowing it to distinguish between the two types of patients with postoperative pain with clear separation on the t-SNE plot. This demonstrates the discriminative capability of our dynamic encoder module in capturing relevant patterns from the fused features of the patients.
6.5.2. Statistics of Attention Mechanism in Dynamic Encoder
In
Figure 8, we conduct an analysis of the most important time intervals in the attention vector generated by the attention mechanism within the dynamic encoder. This mechanism plays a crucial role in extracting relevant parts of the LSTM output, which ultimately leads to the feature embeddings displayed in
Figure 7. The surgical procedure usually has a duration of approximately 90 min. To facilitate our analysis, we divide the 90-min surgical procedure into 15-min intervals, denoted as Time.0 to Time.5. The results in this figure reveal that the attention mechanism in our model assigns higher importance to Time.1 and Time.5. In other words, the presence of postoperative pain is more strongly correlated with the dynamic physical signs observed at the beginning and end of the surgical procedure.
To gain deeper insights into this phenomenon, we sought the expertise of senior anesthesia researchers from Zhejiang University School of Medicine. They corroborated that anesthesiologists indeed focus significantly on the procedure’s initial and final stages, validating the rationale behind our attention mechanism. This finding enhances the medical interpretability of our model, reinforcing its ability to capture critical moments in the surgical process for predicting postoperative pain.
6.5.3. Graph Structure Visualization
As illustrated in
Figure 9a,b, we visualize the patient similarity graph learned by our model. Each node in these figures represents an individual patient. Due to the presence of 999 nodes in our graph model, we selectively display subgraphs of them to ensure clear visualization of the patient similarities. To identify the strength of relationships between patients, we categorize the relations based on their weights. Specifically, we define relations with weights greater than the upper quartile as strong connections, while others are considered general associations. In our visual representation, we utilize an orange edge to indicate strong relations between nodes and gray edges to represent general associations. From the figures, it becomes evident that certain patients exhibit strong similarities with each other. In the subsequent section, we perform case studies to further investigate and analyze the features responsible for these similarities between patients. This analysis aims to provide deeper insights into the reasons underlying the observed patient associations in the similarity graph.
Additionally, we have generated a heat map in
Figure 9c. The horizontal axis represents the time periods from Time.0 to Time.5, as described in
Section 6.5.2, while the vertical axis corresponds to patient IDs. The intensity of the color in the heat map indicates the attention values computed by our model. Upon analyzing
Figure 9c, we observe a pattern similar to the one presented in
Section 6.5.2. This consistency reinforces the validity of our findings and provides further evidence of our model’s ability to capture and prioritize relevant information from dynamic physical signs during the surgical procedure.
6.5.4. Patient Case Study
In the aforementioned samples, we observe a strong connection between Patient No. 263 and Patient No. 271, while a general association is evident between Patient No. 263 and Patient No. 292.
Figure 10a,b provide insights into the similarities between Patient No.
263 and Patient No.
271. We notice that there is a significant resemblance in the curves representing arterial diastolic pressure and arterial systolic pressure, which are representative dynamic physical signals during surgery. Moreover,
Figure 9c shows that both Patient No.
263 and Patient No.
271 have the highest attention value at Time.1, and this similarity is further reinforced by the more pronounced resemblance during Time.1 in
Figure 10a,b.
In contrast,
Figure 10c,d display the noticeable differences in the corresponding curves for Patient No.
263 and Patient No.
292. These distinctions align with the clinical practice, indicating that our
DoseFormer model demonstrates a comprehension similar to that of anesthesiologists. This consistency with real-world surgical scenarios holds significant practical value, emphasizing the effectiveness and relevance of our model in assisting anesthesiologists with their decision-making during surgeries.
We find that the two curves have a more significant similarity during Time.1 of 5–10 intervals. Many similarities exist, especially for arterial systolic pressure in the whole interval. However, Patient No. 263 and Patient No. 292 have no edge between them. From the comparison of signs in
Figure 10c,d, we find that the two curves are quite different. From the aspect of clinical practice, our model shows similar comprehension with the anesthesiologists, which means
DoseFormer is consistent with the actual situation of the operation and has great practical significance.
7. Discussion
7.1. Limitations
Our work has the following limitations: (i)
Measurement accuracy: The intraoperative data used are obtained through non-invasive measurement, a monitoring method that is safe for the patient. The DoCare system collects the patient’s biological data during surgery every 5 min with low frequency. Due to the low frequency, the collected data may not accurately reflect the real waveform seen by the anesthesiologist during the operation and may miss important details. (ii)
Data cleaning: Some of the data in the HIS and DoCare system databases may contain manual entry errors due to the manual recording process. Therefore, we are looking for an efficient data-cleaning process. (iii)
Clinical Caveat: It is essential to highlight that software intended for clinical use should undergo clinical trials in compliance with the relevant market’s procedures and regulations. Currently, our method
DoseFormer is still in the research stage, and it is not intended for direct utilization in clinical medical institutions. As a responsible approach, further validation through rigorous clinical trials and adherence to regulatory guidelines, such as MDR and ISO 13485 [
38], would be necessary before considering its potential application in real-world medical settings.
7.2. Potential
Our work shows the potential of deep learning in medical applications by demonstrating its ability to analyze past cases and extract patterns from a large amount of patient data, thereby reducing errors and improving decision-making in the medical field. Our work also highlights the importance of effective data cleaning and verification processes to ensure the accuracy and reliability of the results obtained using deep learning methods. Our goal is to continuously improve the accuracy and robustness of the system through ongoing research and collaboration with medical professionals. The system’s deployment in real-world scenarios will also provide valuable feedback for future improvements.
7.3. Ethics and Privacy
Before conducting this study, ethical approval was obtained from the Ethics Committee at The Fourth Affiliated Hospital, Zhejiang University School of Medicine. Our work places a strong emphasis on privacy protection, with a particular focus on ensuring the confidentiality of patient information.
To achieve this, we have adopted two specific methods to safeguard patients’ privacy. These methods are designed to minimize the risk of unauthorized access to sensitive information and ensure that patient data are handled according to relevant privacy regulations and standards.
(i) Anonymous processing: The cooperating hospital will utilize our system to enhance and support patient treatment. The system will receive input from the hospital’s database, which serves as its source of information. To maintain patient privacy and confidentiality, all personally identifiable information, such as names, medical record numbers, and operation numbers, will be encrypted and replaced with unique serial numbers. These encrypted IDs will not be utilized or analyzed as part of this project. This approach ensures that patient privacy is maintained and that the information used in this study is protected from unauthorized access and misuse.
(ii) Treatment means protection: The data collected from the hospital’s database and DoCare system are exclusively used to aid healthcare providers in enhancing patient treatment outcomes. The analysis process is considered part of the patient care method, similar to the collection of vital signs such as heart rate and blood pressure during a medical procedure. The hospital’s analysis results are solely kept and stored to ensure that patient privacy is not compromised. These data are used exclusively to support the medical care of patients and are not disclosed to any outside parties.
8. Conclusions
In this paper, we present DoseFormer, a graph-based dynamic system for predicting postoperative pain. To our knowledge, this is the first application of deep learning methods for evaluating intraoperative analgesia levels. We utilize the inherent properties of graph transformer networks to demonstrate the significance of the patient similarity information, and the DoseFormer system offers a cutting-edge solution to address the challenge of accurately regulating the administration of analgesics during general anesthesia procedures. Extensive evaluation of the model’s efficacy through real-world data set testing confirms our system’s practical significance and value.
Author Contributions
Conceptualization, C.Z., X.Z. and S.W.; methodology, C.Z., X.Z. and S.W.; software, X.Z.; validation, X.Z., Z.Z. and S.W.; formal analysis, C.Z.; investigation, C.Z., X.Z. and S.W.; resources, C.Z.; data curation, Z.Z. and X.L.; writing—original draft preparation, X.Z. and Z.Z.; writing—review and editing, S.W.; visualization, X.Z. and Z.Z.; supervision, C.Z. and S.W.; project administration, C.Z. and S.W. All authors have read and agreed to the published version of the manuscript.
Funding
This work was supported in part by the National Natural Science Foundation of China under Grant No. 61902066, the Natural Science Foundation of Jiangsu Province under Grant No. BK20190336, China National Key R&D Program 2018YFB2100302, and Fundamental Research Funds for the Central Universities under Grant No. 2242021R41068.
Informed Consent Statement
This project was approved by the ethics committee of the Fourth Affiliated Hospital of Zhejiang University School of Medicine (No. TK2022162) on 17 November 2022. This project has been registered with the Chinese Clinical Trial Registry (registration number: ChiCTR2200058466). This project is a retrospective study, and the patient data were anonymized. The ethics committee of the Fourth Affiliated Hospital of Zhejiang University School of Medicine reviewed and agreed to exempt patients from informed consent in this project.
Data Availability Statement
Conflicts of Interest
The authors declare no conflict of interest.
Appendix A
Appendix A.1. Implementation
We implement our method and baselines with Pytorch 1.13.0 in the Python 3.7 environment and train it with 128 GB memory and two GeForce RTX 3090 GPUs.
The hidden size is set to 160, and the threshold is set to which is searched in the space . We apply Adam optimizer, and the learning rate is set to 1 × 10.
The DoseFormer model and all the compared models have been trained using the same scheme on a uniform data set consisting of 999 patients from 1 January 2019 to 31 December 2020. To ensure robust evaluation, we have employed a 10-fold cross-validation method. The data set is partitioned into 10 subsets, each containing approximately 100 patients. Throughout each training process, eight subsets of data are selected as the training set, one subset as the validation set, and one subset as the test set. This procedure is iteratively repeated for all 10 folds, and the results are then averaged to yield a comprehensive and reliable performance assessment.
Appendix A.2. Differences between DoseFormer and DoseGuide
As shown in
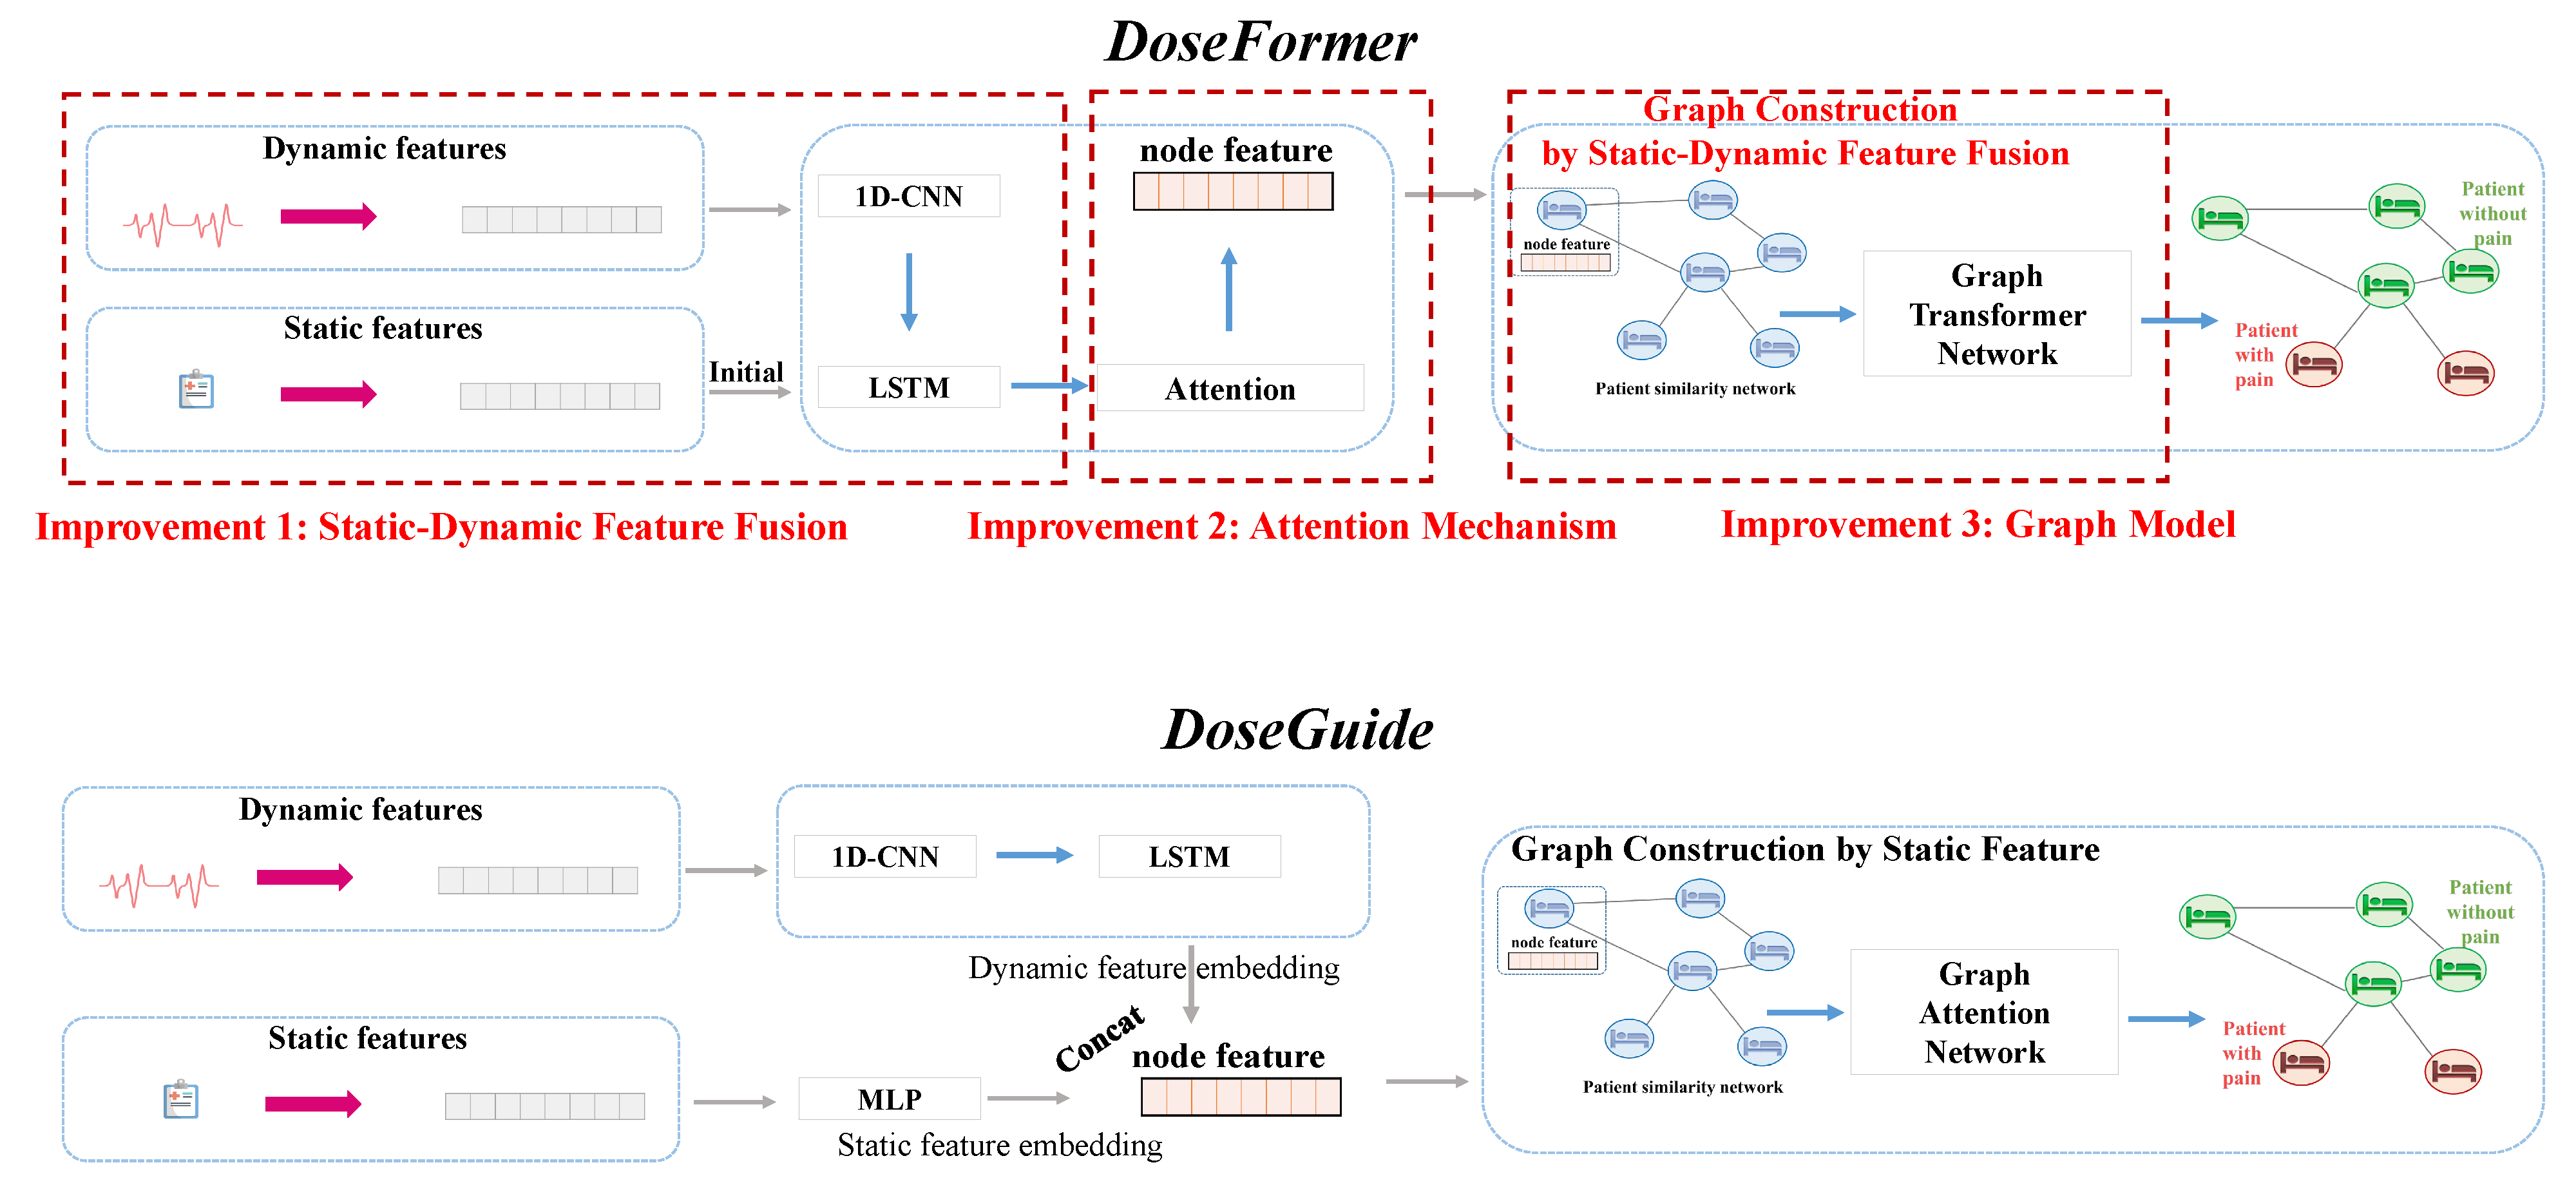
Figure A1, when comparing the
DoseFormer with our previous work
DoseGuide [
22], three improvements become evident, including (1) static–dynamic feature fusion, (2) attention mechanism, and (3) graph model.
Figure A1.
Differences between DoseFormer and DoseGuide.
Figure A1.
Differences between DoseFormer and DoseGuide.
Improvement 1: Static–Dynamic Feature Fusion. Through our observations, we noticed that anesthesiologists tend to consider static patient features, such as age and gender, before surgery. To capitalize on this valuable information, we have developed an alternative approach compared to DoseGuide. In DoseFormer, we do not concat static features and dynamic features directly. Instead, we employ the static information to initialize the temporal model LSTM. This improvement aims to capture the prior knowledge of anesthesiologists as they monitor the dynamic signs during surgery.
Improvement 2: Attention Mechanism. After consulting extensively with expert anesthesiologists, we acquired valuable insights into their practice of placing greater emphasis on specific periods, particularly when patients are being anesthetized at the start of surgery and when the procedure is concluding. Building on this understanding, we have devised a self-attention mechanism that complements the temporal model LSTM. This mechanism empowers us to capture the most vital signals during the surgical process, aligning precisely with the crucial moments that are of primary interest to anesthesiologists.
Improvement 3: Graph Model. In contrast to
DoseGuide, which solely relies on static features for constructing the patient similarity graph, our novel approach
DoseFormer employs a dynamic forward process that leverages fused static–dynamic embeddings to build the graph. This dynamic strategy significantly enhances the representation of patient data, resulting in substantial enhancements to the graph construction process within
DoseFormer. Moreover, in our continuous efforts to bolster the representation capabilities of the graph neural network, we have introduced the graph transformer network. This network adapts the dynamic forward process of graph construction, as previously proposed in the work by Yun et al. [
23], thereby further elevating the overall performance of our
DoseFormer model.
References
- Brown, E.N.; Lydic, R.; Schiff, N.D. General anesthesia, sleep, and coma. N. Engl. J. Med. 2010, 363, 2638–2650. [Google Scholar] [CrossRef]
- Franks, N.P.; Zecharia, A.Y. Sleep and general anesthesia. Can. J. Anesth. Can. Anesthésie 2011, 58, 139–148. [Google Scholar] [CrossRef]
- Bennett, C.; Voss, L.J.; Barnard, J.P.; Sleigh, J.W. Practical use of the raw electroencephalogram waveform during general anesthesia: The art and science. Anesth. Analg. 2009, 109, 539–550. [Google Scholar] [CrossRef] [PubMed]
- Hemmerling, T.M.; Le, N. Brief review: Neuromuscular monitoring: An update for the clinician. Can. J. Anesth. 2007, 54, 58–72. [Google Scholar] [CrossRef]
- Sahinovic, M.M.; Eleveld, D.J.; Kalmar, A.F.; Heeremans, E.H.; De Smet, T.; Seshagiri, C.V.; Absalom, A.R.; Vereecke, H.E.; Struys, M.M. Accuracy of the composite variability index as a measure of the balance between nociception and antinociception during anesthesia. Anesth. Analg. 2014, 119, 288–301. [Google Scholar] [CrossRef] [PubMed]
- Huiku, M.; Uutela, K.; Van Gils, M.; Korhonen, I.; Kymäläinen, M.; Meriläinen, P.; Paloheimo, M.; Rantanen, M.; Takala, P.; Viertiö-Oja, H.; et al. Assessment of surgical stress during general anaesthesia. Br. J. Anaesth. 2007, 98, 447–455. [Google Scholar] [CrossRef] [PubMed]
- Jeanne, M.; Logier, R.; De Jonckheere, J.; Tavernier, B. Validation of a graphic measurement of heart rate variability to assess analgesia/nociception balance during general anesthesia. Proc. IEEE Eng. Med. Biol. Soc. 2009, 2009, 1840–1843. [Google Scholar]
- Ben-Israel, N.; Kliger, M.; Zuckerman, G.; Katz, Y.; Edry, R. Monitoring the nociception level: A multi-parameter approach. J. Clin. Monit. Comput. 2013, 27, 659–668. [Google Scholar] [CrossRef]
- Boselli, E.; Bouvet, L.; Bégou, G.; Dabouz, R.; Davidson, J.; Deloste, J.Y.; Rahali, N.; Zadam, A.; Allaouchiche, B. Prediction of immediate postoperative pain using the analgesia/nociception index: A prospective observational study. Br. J. Anaesth. 2014, 112, 715–721. [Google Scholar] [CrossRef]
- Walker, E.; Bell, M.; Cook, T.; Grocott, M.; Moonesinghe, S. Patient reported outcome of adult perioperative anaesthesia in the United Kingdom: A cross-sectional observational study. BJA Br. J. Anaesth. 2016, 117, 758–766. [Google Scholar] [CrossRef]
- Gerbershagen, H.J.; Aduckathil, S.; van Wijck, A.J.; Peelen, L.M.; Kalkman, C.J.; Meissner, W. Pain intensity on the first day after surgery: A prospective cohort study comparing 179 surgical procedures. Anesthesiology 2013, 118, 934–944. [Google Scholar] [CrossRef] [PubMed]
- Dayoub, E.J.; Jena, A.B. Does Pain Lead to Tachycardia? Revisiting the Association between Self-Reported Pain and Heart Rate in a National Sample of Urgent Emergency Department Visits. In Proceedings of the Mayo Clinic Conference, Online, 1–6 July 2015; Elsevier: Amsterdam, The Netherlands, 2015; Volume 90, pp. 1165–1166. [Google Scholar]
- Martini, C.H.; Boon, M.; Broens, S.J.; Hekkelman, E.F.; Oudhoff, L.A.; Buddeke, A.W.; Dahan, A. Ability of the nociception level, a multiparameter composite of autonomic signals, to detect noxious stimuli during propofol–remifentanil anesthesia. Anesthesiology 2015, 123, 524–534. [Google Scholar] [CrossRef]
- Gruenewald, M.; Willms, S.; Broch, O.; Kott, M.; Steinfath, M.; Bein, B. Sufentanil administration guided by surgical pleth index vs standard practice during sevoflurane anaesthesia: A randomized controlled pilot study. Br. J. Anaesth. 2014, 112, 898–905. [Google Scholar] [CrossRef] [PubMed]
- Höcker, J.; Broch, O.; Gräsner, J.T.; Gruenewald, M.; Ilies, C.; Steinfath, M.; Bein, B. Surgical stress index in response to pacemaker stimulation or atropine. Br. J. Anaesth. 2010, 105, 150–154. [Google Scholar] [CrossRef] [PubMed]
- Tan, H.; Liu, N.; Sultana, R.; Han, N.R.; Tan, C.; Zhang, J.; Sia, A.; Sng, B. Prediction of breakthrough pain during labour neuraxial analgesia: Comparison of machine learning and multivariable regression approaches. Int. J. Obstet. Anesth. 2021, 45, 99–110. [Google Scholar] [CrossRef]
- Lundberg, S.M.; Nair, B.; Vavilala, M.S.; Horibe, M.; Eisses, M.J.; Adams, T.; Liston, D.E.; Low, D.K.W.; Newman, S.F.; Kim, J.; et al. Explainable machine-learning predictions for the prevention of hypoxaemia during surgery. Nat. Biomed. Eng. 2018, 2, 749–760. [Google Scholar] [CrossRef]
- Moghadam, M.C.; Abad, E.M.K.; Bagherzadeh, N.; Ramsingh, D.; Li, G.P.; Kain, Z.N. A machine-learning approach to predicting hypotensive events in ICU settings. Comput. Biol. Med. 2020, 118, 103626. [Google Scholar] [CrossRef]
- Afshar, S.; Boostani, R.; Sanei, S. A combinatorial deep learning structure for precise depth of anesthesia estimation from EEG signals. IEEE J. Biomed. Health Inform. 2021, 25, 3408–3415. [Google Scholar] [CrossRef]
- Chowdhury, M.R.; Madanu, R.; Abbod, M.F.; Fan, S.Z.; Shieh, J.S. Deep learning via ECG and PPG signals for prediction of depth of anesthesia. Biomed. Signal Process. Control. 2021, 68, 102663. [Google Scholar] [CrossRef]
- AlMeer, M.H.; Abbod, M.F. Deep Learning in Classifying Depth of Anesthesia (DoA). In Proceedings of the SAI Intelligent Systems Conference, London, UK, 21–22 September 2018; Springer: Berlin/Heidelberg, Germany, 2018; pp. 160–169. [Google Scholar]
- Zhou, Z.; Guo, B.; Zhang, C. DoseGuide: A Graph-based Dynamic Time-aware Prediction System for Postoperative Pain. In Proceedings of the 2021 IEEE 27th International Conference on Parallel and Distributed Systems (ICPADS), Beijing, China, 14–16 December 2021; pp. 474–481. [Google Scholar]
- Yun, S.; Jeong, M.; Kim, R.; Kang, J.; Kim, H.J. Graph transformer networks. Adv. Neural Inf. Process. Syst. 2019, 32, 177. [Google Scholar]
- Liu, Y.; Guo, B.; Song, X.; Wang, S.; He, T. Exploiting Intra-and Inter-Region Relations for Sales Prediction via Graph Convolutional Network. In Proceedings of the GLOBECOM 2022–2022 IEEE Global Communications Conference, Athens, Greece, 4–8 August 2022; pp. 3754–3759. [Google Scholar]
- Wang, S.; Zhu, X.; Wang, G.; Zhang, D.; Tu, L.; He, T. W2–Parking: A Data-Driven Win-Win Contract Parking Sharing Mechanism Under Both Supply and Demand Uncertainties. IEEE Trans. Knowl. Data Eng. 2022, 6, 913. [Google Scholar]
- Yan, H.; Wang, S.; Yang, Y.; Guo, B.; He, T.; Zhang, D. O2-siterec: Store site recommendation under the o2o model via multi-graph attention networks. In Proceedings of the 2022 IEEE 38th International Conference on Data Engineering (ICDE), Kuala Lumpur, Malaysia, 9–12 May 2022; pp. 525–538. [Google Scholar]
- Guo, B.; Zuo, W.; Wang, S.; Lyu, W.; Hong, Z.; Ding, Y.; He, T.; Zhang, D. Wepos: Weak-supervised indoor positioning with unlabeled wifi for on-demand delivery. Proc. Acm Interact. Mob. Wearable Ubiquitous Technol. 2022, 6, 1–25. [Google Scholar] [CrossRef]
- Liu, W.; Ding, Y.; Wang, S.; Yang, Y.; Zhang, D. Para-Pred: Addressing Heterogeneity for City-Wide Indoor Status Estimation in On-Demand Delivery. In Proceedings of the 28th ACM SIGKDD Conference on Knowledge Discovery and Data Mining, San Francisco, CA, USA, 14–18 August 2022; pp. 3407–3417. [Google Scholar]
- He, K.; Zhang, X.; Ren, S.; Sun, J. Deep residual learning for image recognition. In Proceedings of the IEEE Conference on Computer Vision and Pattern Recognition, Las Vegas, NV, USA, 28–30 June 2016; pp. 770–778. [Google Scholar]
- Hosmer, D.W., Jr.; Lemeshow, S.; Sturdivant, R.X. Applied Logistic Regression; John Wiley & Sons: Hoboken, NJ, USA, 2013; Volume 398. [Google Scholar]
- Joachims, T. Making Large-Scale SVM Learning Practical; Technical Report; Universität Dortmund: Dortmund, Germany, 1998. [Google Scholar]
- Keller, J.M.; Gray, M.R.; Givens, J.A. A fuzzy k-nearest neighbor algorithm. IEEE Trans. Syst. Man. Cybern. 1985, 1, 580–585. [Google Scholar] [CrossRef]
- Safavian, S.R.; Landgrebe, D. A survey of decision tree classifier methodology. IEEE Trans. Syst. Man. Cybern. 1991, 21, 660–674. [Google Scholar] [CrossRef]
- Breiman, L. Bagging predictors. Mach. Learn. 1996, 24, 123–140. [Google Scholar] [CrossRef]
- Svetnik, V.; Liaw, A.; Tong, C.; Culberson, J.C.; Sheridan, R.P.; Feuston, B.P. Random forest: A classification and regression tool for compound classification and QSAR modeling. J. Chem. Inf. Comput. Sci. 2003, 43, 1947–1958. [Google Scholar] [CrossRef] [PubMed]
- Geurts, P.; Ernst, D.; Wehenkel, L. Extremely randomized trees. Mach. Learn. 2006, 63, 3–42. [Google Scholar] [CrossRef]
- Chen, T.; Guestrin, C. Xgboost: A scalable tree boosting system. In Proceedings of the 22nd ACM SIGKDD International Conference on Knowledge Discovery and Data Mining, Long Beach, CA, USA, 6–10 August 2016; pp. 785–794. [Google Scholar]
- Troschinetz, A. ISO 13485: Medical devices and risk management. Quality 2010, 49, 44. [Google Scholar]
| Disclaimer/Publisher’s Note: The statements, opinions and data contained in all publications are solely those of the individual author(s) and contributor(s) and not of MDPI and/or the editor(s). MDPI and/or the editor(s) disclaim responsibility for any injury to people or property resulting from any ideas, methods, instructions or products referred to in the content. |
© 2023 by the authors. Licensee MDPI, Basel, Switzerland. This article is an open access article distributed under the terms and conditions of the Creative Commons Attribution (CC BY) license (https://creativecommons.org/licenses/by/4.0/).


