
Fusion Model for Classification Performance Optimization in a Highly Imbalance Breast Cancer Dataset

Abstract
:1. Introduction
2. Literature Review
2.1. Overview of Class-Imbalanced Issue in Breast Cancer Dataset
- Samples with low information and low training data density: The number of samples with a stable imbalance rate is crucial in determining the efficacy of a classifier model when dealing with the class imbalance problem. The main rules discovered in a small class are suspect. Modeling classification and separating minority from majority samples also benefit from more data and information [19]. Minority groups often have inadequate data due to data bias. One article claims that a decrease in the error rate attributable to class-imbalanced distribution can be attained by collecting sufficient samples from the minority class (correcting the imbalance rate);
- Class overlap: makes it challenging to apply separation rules, and it is challenging to categorize samples from underrepresented groups. Simple classifiers can learn correct classification without class overlap [20];
- Small disjuncts: occur when the minority group’s concept includes ancillary ideas. These auxiliary ideas, with their inequivalent class samples, further complicate the problem;
- Noisy data: When a classifier encounters a small cluster of minority classes, it may ignore them as noise [21]. The evaluation measures used to direct the learning process may be the source of the sample’s ignorance (assumed noise). Noisy samples are more likely to be found in the “safe” regions of the other classes, as defined by their labels [22];
- Borderline samples: These are discovered where the majority and minority classes intersect. Learning algorithms struggle when dealing with borderline and noisy samples. During the training process, most classification algorithms strive to learn the most accurate borderline of each class to achieve a better prediction. Borderline samples are more likely to be misdiagnosed than nonborderline samples, making them more important for classification [22]. The difficulties associated with medical datasets are shown in Figure 2. The literature review shows that many methods have been developed to deal with the issue of imbalanced data, as discussed in Section 2.3.
2.2. Overview of Techniques Handling Class-Imbalanced
2.2.1. Oversampling
- ADAptive SYNthetic Sampling (ADASYN): The main idea behind this method is to assign different values to different subsets of the minority group based on their relative degree of academic challenge. Synthetic data generation is more significant for harder-to-learn samples than simpler ones [29];
- Adjusting the Direction Of the synthetic Minority clasS examples (ADOMS): Synthetic samples are generated along the first principal component axis of geographically dispersed data [30];
- Agglomerative Hierarchical Clustering (AHC): Selects a subset category randomly and returns the made-up samples to serve as a prototype [31];
- Synthetic Minority Oversampling Techniques (SMOTE): Based on feature space similarities between minority class samples, the SMOTE algorithm generates synthetic data. The central idea is to draw representative samples from underrepresented groups by looking at their nearest neighbor. The feature vector of the considered sample is compared to those of its nearest neighbors, and the resulting difference is used to create new models [32];
- Borderline SMOTE (BLSMOTE): In improving their predictions, classified algorithms work hard to acquire the most accurate learning possible. Incorrectly classifying samples closer to the boundary is more costly than misclassifying samples further away. All K neighbors of a marginal sample are included in the majority class. This equivocal approach pre-samples the underrepresented demographic using the statistical methodology known as SMOTE [33];
- Random Oversampling (ROS): Ensures that both groups have an equal number of samples by randomly generating additional samples for the underrepresented group [34];
- Safe-Level-SMOTE (SL-SMOTE): Before creating synthetic samples, this method determines the SMOTE-recommended threshold for minority class samples. K-nearest-neighbors calculates an appropriate sample size for underrepresented groups. Then, each synthetic sample is placed close to the lowest possible level. Therefore, all artificial samples are produced within acceptable limits. The maximum tolerable value is considered close to K, while the minimum is believed to be close to zero [35].
2.2.2. Undersampling
- Condensed Nearest Neighbor (CNN): This method may be less useful for learning because it discards the vast majority of class samples on the cusp of a decision. We can make the dataset smaller by omitting some aspects from the original data set while leaving the classifier NN unchanged [36];
- Tomek Link (TL): Specifically, the method employs Tomek links x and y, where x is a member of the majority class, and y is a member of the minority class, and where their distance is smaller than that of any other sample, such as z. Tomek-linked samples are either at the class boundary or contain spurious information. Many studies have employed TL as a method of guided undersampling by excluding data from the dominant group [37];
- Condensed Nearest Neighbor–TL (CNN-TL): As with the OSS algorithm, this method combines CNN and TL. The mutually beneficial subset is identified in advance of applying TL. As described in Tomek’s linked article [38], the goal is to prune the data set by omitting particular elements using CNN, which significantly affects the performance of the NN classifier;
- Edited Nearest Neighbor (ENN): Another way to eliminate examples. Using k = 3 nearest neighbors, you can identify misclassified cases in a dataset and remove them from further analysis [38];
- Neighborhood Cleaning Rule (NCL): In this strategy, we eliminate the samples from the majority class by applying the ENN rule. Class labels of the eliminated samples differ from those of 3–5 neighbors [39];
- One-Sided Selection (OSS): For TL detection, 1-NN chooses all samples from the minority class and some misclassified samples from the majority class. Most of the Tomek link’s encapsulated class samples are omitted [40];
- Random Undersampling (RUS): In maintaining parity between groups, most class samples are purged randomly [41];
- Undersampling Based on Clustering (SBC): The theory assumes that any given data set will contain subsets with varying degrees of similarity. First, we cluster all of the training samples. The samples would then establish the purposes of the clusters. The functions of the clusters are equivalent regardless of whether the samples come from the minority or the majority. Similarly, the SBC method achieves class balance by randomly selecting a large number of samples from clusters belonging to the majority class based on the ratio of the two classes [42].
2.2.3. Hybrid Sampling
- SMOTE-ENN: This technique is a hybrid, built on the foundation of SMOTE by ENN, and filters out unwanted background noise. To further narrow down the sample space, ENN can filter out data that do not fit either classification. Mislabeled samples are weeded out by comparing them to their three nearest counterparts [38];
- SMOTE-TL: This hybrid approach employs SMOTE to eliminate data containing the Tomek link selectively. To create a Tomek connection, you need to find two samples nearest to each other but do not share the same category. Before detecting and eliminating Tomek links, SMOTE oversamples the original data set. Thus, a uniform dataset with clearly delineated class clusters is generated [38];
- Selective Processing of Imbalanced Data (SPIDER): This method employs intricate sample filtering on the majority group and oversampling the local minority group. Misclassified or noisy samples can be identified with the help of the K-nearest neighbor (KNN). Then, depending on what you choose (weak, firm, or relabeling), the noisy objects are either repeated or removed [39];
- Selective Processing of Imbalanced Data 2 (SPIDER2): Preprocessing samples from both the majority and the minority classes is the first step in this method. The majority class characteristics are defined, and then the noisy samples are found and either discarded or relabeled according to the relabeling options available (reclassified as the minority class). The same thing happens to the minority group, and their noisy samples are repeated after being uncovered [40].
2.3. Overview of Class-Imbalanced Issues in Breast Cancer Studies

| Study | Year | Proposed Resampling Technique | Resampling Type | Classifiers | Best Fusion Model with the Highest Accuracy |
|---|---|---|---|---|---|
| [43] | 2022 | SMOTE | Oversampling | LR, RF, SVM, MLP | SMOTE + RF |
| [44] | 2021 | SMOTE + feature selection (IG and GA) | Oversampling | SVM | SMOTE + GA + SVM |
| [45] | 2020 | Overlap-based undersampling (URNS) | Undersampling | KNN RF | URNS + RF |
| [46] | 2020 | Undersampling boosting (ECUBoost) | Undersampling | RF | ECUBoost + RF |
| [47] | 2020 | Hellinger distance undersampling (HDUS) | Undersampling | kNN, SVM, DT | HDUS + DT |
| [48] | 2021 | Undersampling using simulated annealing (SA) | Hybrid sampling | SVM, DT, kNN, and discriminant analysis (DA) | SA + kNN |
| [49] | 2021 | Cluster-based undersampling | Undersampling | Boosted C5.0 | Cluster-based undersampling + Boosted C5.0 |
| [50] | 2020 | Radial-based undersampling (RBU) | Undersampling | CART, kNN, NB, SVM | RBU + NB |
| [51] | 2019 | ROSE + K-means | Oversampling | SVM | ROSE + K-means + SVM |
| [52] | 2020 | SpreadSample + SMOTE | Hybrid sampling | C4.5, Bayesian network, and RF | SpreadSample + SMOTE + Bayesian network |
| [53] | 2022 | Engineered upsampling method (ENUS) | Oversampling | XGBoost tree (XGBTree), kNN, DT, RF, ANN, SVM | ENUS + XGBoost |
| [54] | 2022 | Salp swarm optimization-based undersampling technique (SSBUT) | Undersampling | C4.5, SVM, NB | SSBUT + C4.5 |
| [55] | 2022 | undersampling, random oversampling, SMOTE, ADASYN, SVM-SMOTE, SMOTEEN, and SMOTETOMEK. | Hybrid sampling | DT, KNN, LR, ANN, SVM, and NB | SMOTE-ENN + kNN |
| [56] | 2022 | SMOTE | Oversampling | NB, DT, RF, XGBoost, XGBoost-NB, XGBoost-DT, XGBoost-RF | SMOTE + XGBoost-RF |
| [57] | 2021 | SMOTE, ADASYN, CD, CDSMOTE | Oversampling | Boosting, SVM, RF | CDSMOTE + RF |
2.4. Research Contribution
- To reduce the imbalance ratio of the BCSC dataset, nine different state-of-the-art resampling techniques, which include Random undersampling (RUS), edited nearest neighbor undersampling (ENN), Tomek links undersampling (TL), random oversampling (ROS), SMOTE, borderline SMOTE (BLSMOTE), SMOTE + edited nearest neighbor undersampling (SMOTE-ENN), SMOTE + Tomek link undersampling (SMOTETomek) and SPIDER, are harnessed;
- We constructed 27 different fusion models via pretraining of three renowned classifiers, namely, extreme gradient boosting (XGBoost), artificial neural network (ANN), and support vector machine (SVM);
- In evaluating the efficiency and effectiveness of the models, the study deployed six performance metrics such as confusion matrix, accuracy, precision, recall, F-score, and “area under the curve” (AUC) of “receiver characteristic operator” (ROC) (AUC-ROC);
- Assessing the performance of the 27 fusion models by performing a comparative analysis between the proposed algorithm with the rest of the algorithms;
- To validate the results by analyzing the differences between all classifiers and indicating the best classifier;
- To compare the performance of the new proposed fusion model with the state-of-the-art predictive models applied to the BCSC dataset as a benchmark dataset for experimental validation.
3. Materials and Methods
3.1. Proposed Method
3.2. Dataset Acquisition
3.3. Data Preprocessing: Resampling of BCSC Dataset
3.4. Model Classification
- XGBoost: This algorithm is a highly efficient version of a gradient-boosted decision tree. By providing a wrapper class, XGBoost facilitates using models in the scikit-learn framework as either classifiers or regressors. XGBoost’s classification model goes by the name XGB Classifier. Since it was designed and developed with model performance and computational speed in mind, XGBoost is an efficient and accurate execution of gradient boosting machines that have confirmed to push the boundaries of computing power for upgraded tree algorithms. With the tree-boosting algorithm in mind, it was built to use all available memory and processing powerfully. XGBoost is popular because it can be applied to many machine learning and data mining problems. In 2015, for instance, 17 out of the 29 winning challenge solutions published on the ML competition site Kaggle all made use of XGBoost;
- ANN: The algorithm for artificial neural networks is inspired by the structure and function of real neurons, down to the minor details of the dendrites, somas, and axons. Each ANN comprises a network of artificial neurons, each of which performs an essential mathematical operation. An artificial neural network consists of input, hidden, and output layers, each a collection of linked neurons. This network acquires the ability to perform tasks by observing a large enough sample of similar instances. Classification and regression issues are well within the neural networks’ capabilities. Advanced perception versions of ANNs, called multilayer ANNs, can be used to tackle difficult classification and regression issues. When it comes to binary classification, perception ANNs are by far the most popular. In our classification work, we used a very similar set of ANNs. In an ANN, the number of neurons in the input layer is proportional to the number of features in the data set used for training. Even a network’s hidden layer can be considered an independent entity. The research uses an input layer with 31 neurons connected to the first hidden layer’s nine neurons. The links between the first and second secret layers have been mapped out to the extent of 9-9. It is a binary classification problem, so there’s only one neuron in the output layer;
- SVM: Using hyperplanes, SVM separates data for classification purposes. SVM is based on using hyperplanes to classify data into similar groups. Data with nonregularities and unknown distributions are ideal candidates for the SVM method. Our research uses the caret and kern lab packages to construct and tune the SVM model’s hyperparameters. Specifically, we used a grid search algorithm to determine the best values for our model’s hyperparameters.
3.5. Performance Metrics of Classifiers
- TP (true positive)—The number of observations that the model classified as ‘positive’ and that are actually ‘positive’;
- FP (false positive)—The number of observations that the model classified as ‘Positive’ but are actually ‘Negative’. It is also called a Type-1 error;
- TN (true negative)—The number of observations that the model classified as ‘Negative’ and are actually ‘Negative’;
- FN (false negative)—The number of observations that the model classified as ‘Negative’ but are actually ‘Positive’. It is also called a Type-2 error.
4. Results and Discussion
4.1. Model Classification Evaluation
| Undersampling | Oversampling | Hybrid Sampling | |||||||
|---|---|---|---|---|---|---|---|---|---|
| Metrics | RUS | ENN | TL | ROS | SMOTE | BLSMOTE | SMOTE-TL | SMOTE-ENN | SPIDER |
| Accuracy | 0.817 | 0.914 | 0.897 | 0.688 | 0.549 | 0.596 | 0.575 | 0.607 | 0.879 |
| Precision | 0.817 | 0.967 | 0.967 | 0.706 | 0.612 | 0.611 | 0.630 | 0.621 | 0.881 |
| Recall | 0.817 | 0.914 | 0.897 | 0.688 | 0.549 | 0.596 | 0.575 | 0.607 | 0.879 |
| F1-Score | 0.817 | 0.934 | 0.924 | 0.681 | 0.475 | 0.581 | 0.525 | 0.587 | 0.879 |
| ROC | 0.882 | 0.843 | 0.876 | 0.780 | 0.728 | 0.713 | 0.762 | 0.743 | 0.931 |
| Undersampling | Oversampling | Hybrid Sampling | |||||||
|---|---|---|---|---|---|---|---|---|---|
| Metrics | RUS | ENN | TL | ROS | SMOTE | BLSMOTE | SMOTE-TL | SMOTE-ENN | SPIDER |
| Accuracy | 0.934 | 0.996 | 0.996 | 0.999 | 0.994 | 0.997 | 0.994 | 0.997 | 0.983 |
| Precision | 0.935 | 0.996 | 0.996 | 0.999 | 0.994 | 0.997 | 0.994 | 0.997 | 0.983 |
| Recall | 0.934 | 0.996 | 0.996 | 0.999 | 0.994 | 0.997 | 0.994 | 0.997 | 0.983 |
| F1-Score | 0.934 | 0.996 | 0.996 | 0.999 | 0.994 | 0.997 | 0.994 | 0.997 | 0.983 |
| ROC | 0.980 | 0.984 | 0.984 | 1.000 | 1.000 | 1.000 | 1.000 | 1.000 | 0.998 |
| Undersampling | Oversampling | Hybrid Sampling | |||||||
|---|---|---|---|---|---|---|---|---|---|
| Metrics | RUS | ENN | TL | ROS | SMOTE | BLSMOTE | SMOTE-TL | SMOTE-ENN | SPIDER |
| Accuracy | 0.915 | 0.994 | 0.993 | 0.995 | 0.983 | 0.990 | 0.983 | 0.991 | 0.958 |
| Precision | 0.915 | 0.994 | 0.993 | 0.995 | 0.983 | 0.990 | 0.983 | 0.991 | 0.958 |
| Recall | 0.915 | 0.994 | 0.993 | 0.995 | 0.983 | 0.990 | 0.983 | 0.991 | 0.958 |
| F1-Score | 0.915 | 0.994 | 0.993 | 0.995 | 0.983 | 0.990 | 0.983 | 0.991 | 0.958 |
| ROC | 0.963 | 0.972 | 0.967 | 0.999 | 0.998 | 0.999 | 0.998 | 0.999 | 0.965 |
| Metric | Highest Value | Classifier | Resampling Strategy | The Best Fusion Model |
|---|---|---|---|---|
| Accuracy | 99.9% | XGBoost | ROS | ROS + XGBoost |
| Precision | 99.9% | XGBoost | ROS | ROS + XGBoost |
| Recall | 99.9% | XGBoost | ROS | ROS + XGBoost |
| F1-Score | 99.9% | XGBoost | ROS | ROS + XGBoost |
| ROC | 100% | XGBoost | ROS SMOTE BLSMOTE SMOTE-ENN SMOTE-TL | ROS + XGBoost SMOTE + XGBoost BLSMOTE + XGBoost SMOTE-ENN + XGBoost SMOTE-TL + XGBoost |
4.2. Confusion Matrix Analysis
4.3. ROC Analysis
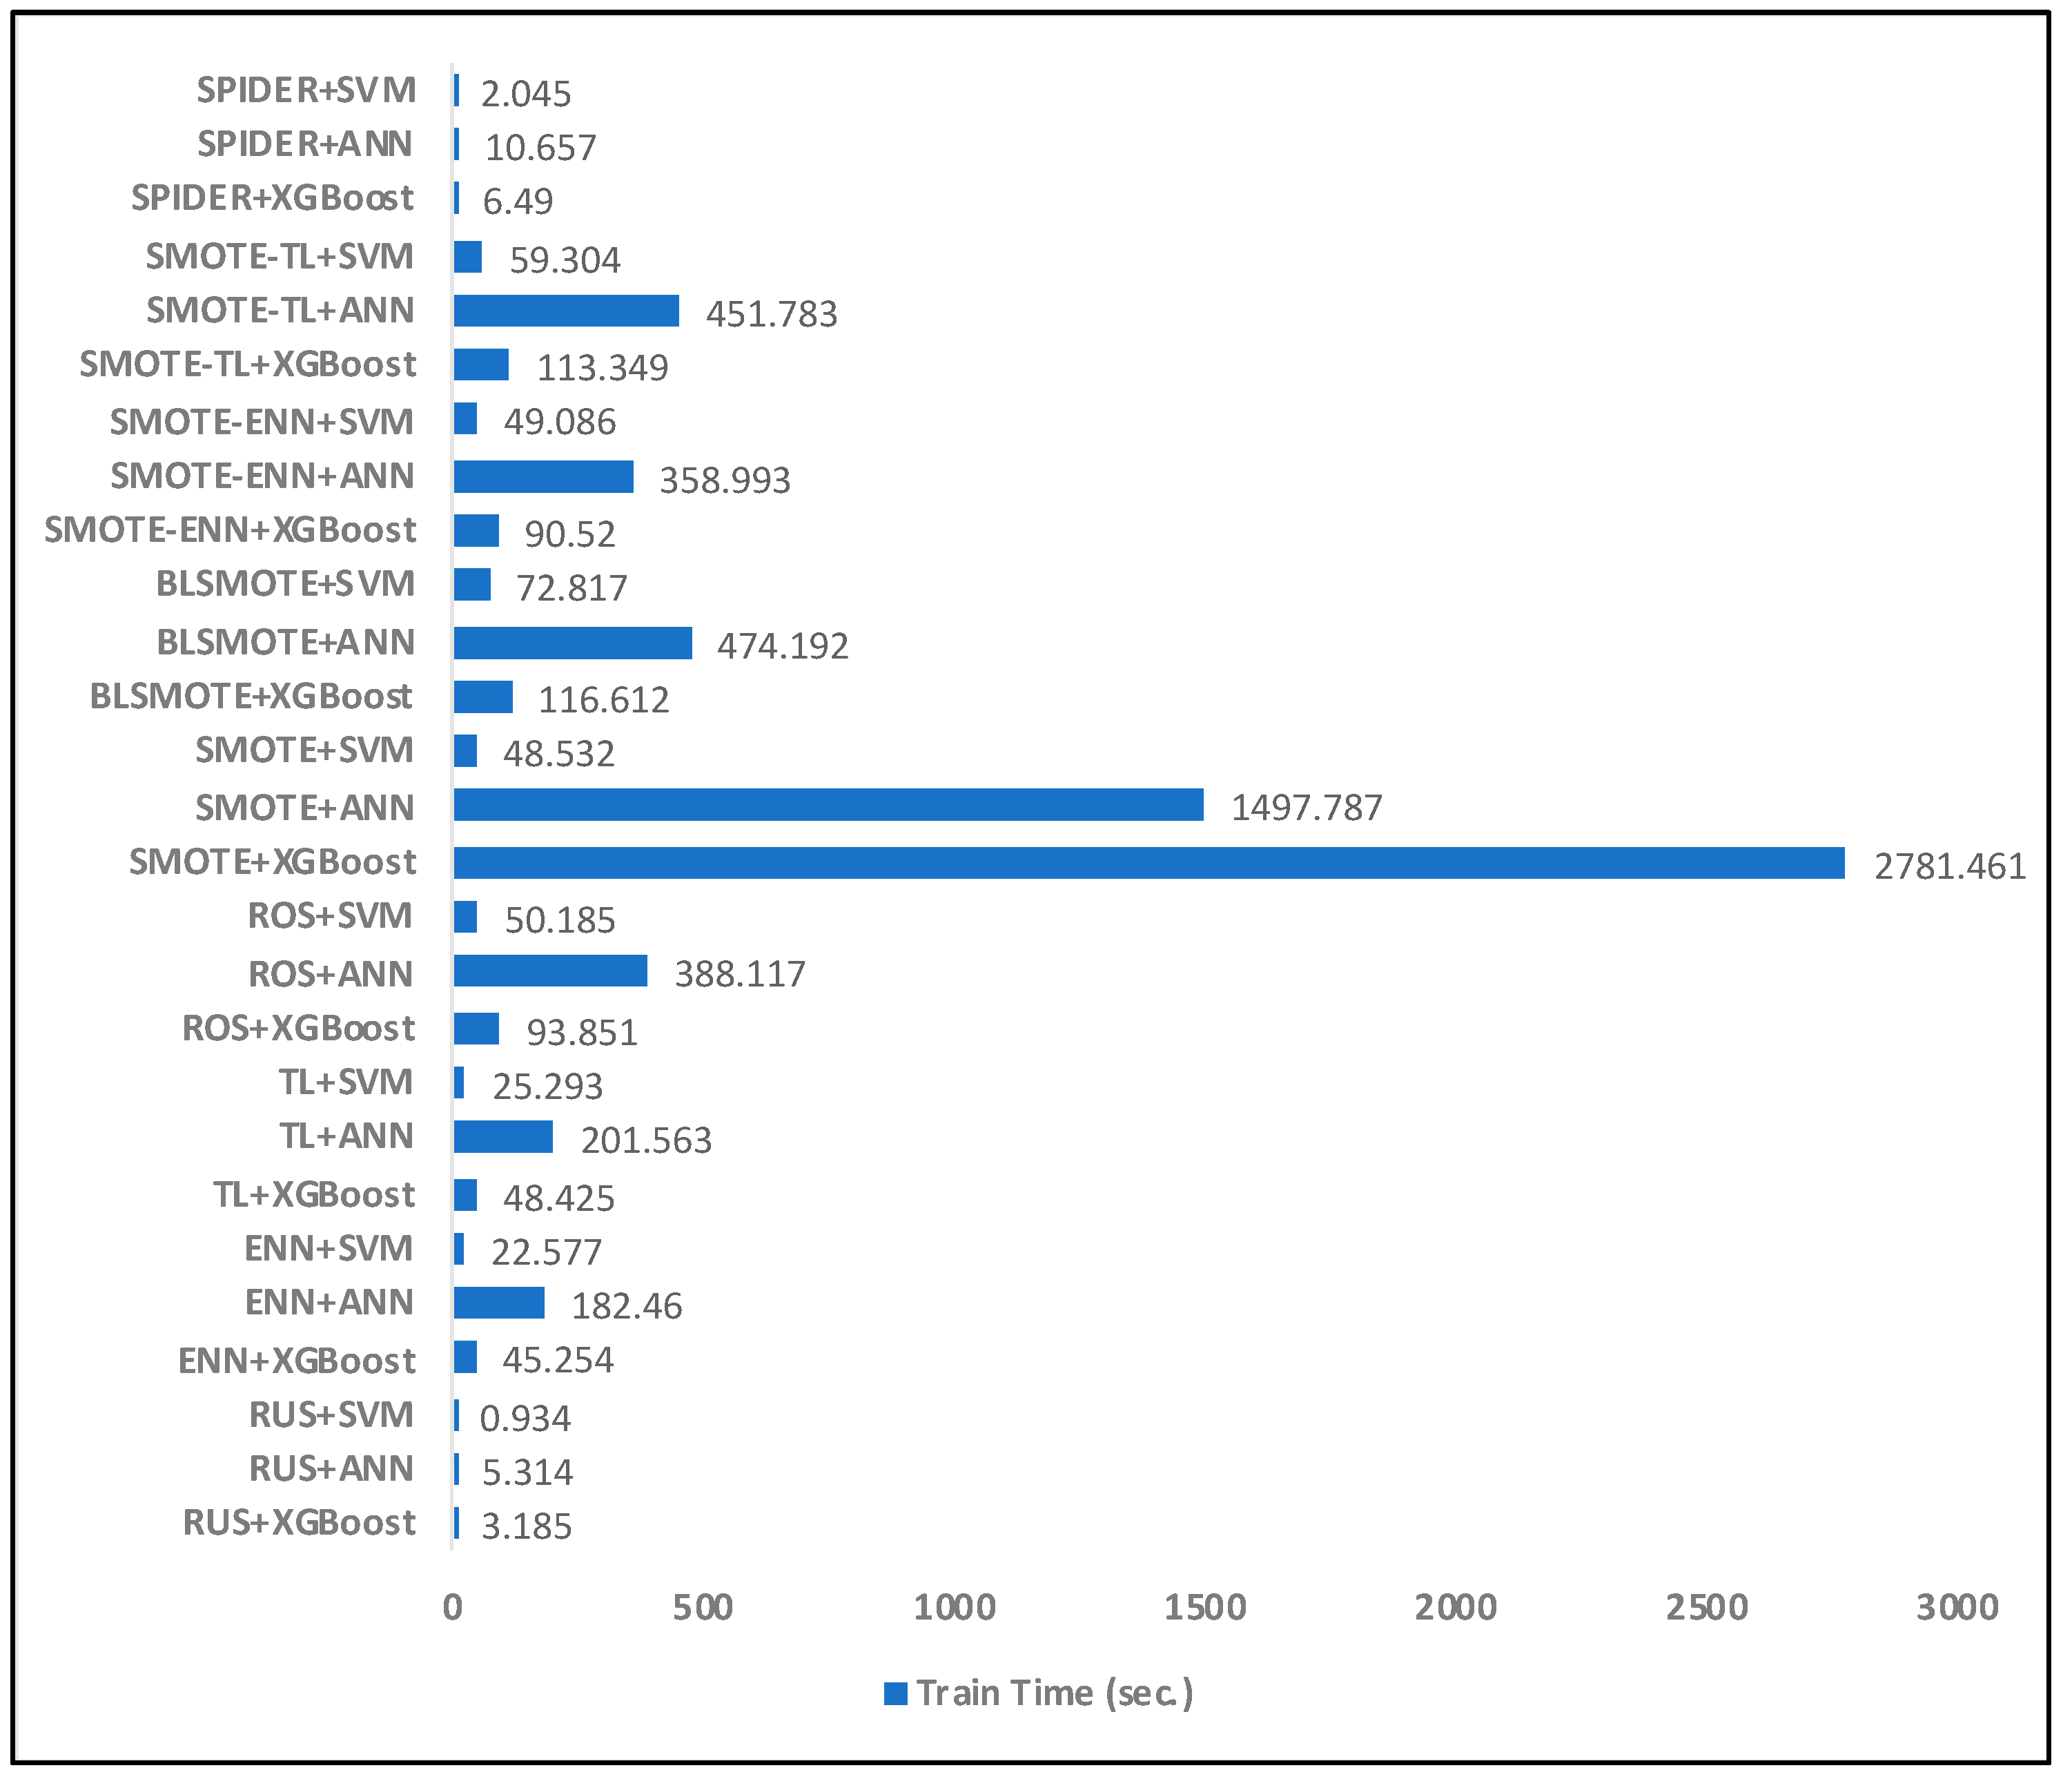
4.4. Model Efficiency
4.5. Comparative Analysis between the Fusion Models
5. Limitations
6. Conclusions and Future Work
Author Contributions
Funding
Informed Consent Statement
Acknowledgments
Conflicts of Interest
References
- Sung, H.; Ferlay, J.; Siegel, R.L.; Laversanne, M.; Soerjomataram, I.; Jemal, A.; Bray, F. Global Cancer Statistics 2020: GLOBOCAN Estimates of Incidence and Mortality Worldwide for 36 Cancers in 185 Countries. CA Cancer J. Clin. 2021, 71, 209–249. [Google Scholar] [CrossRef]
- Mandelblatt, J.S.; Stout, N.K.; Schechter, C.B.; Broek, J.J.V.D.; Miglioretti, D.L.; Krapcho, M.; Trentham-Dietz, A.; Munoz, D.; Lee, S.J.; Berry, D.A.; et al. Collaborative modeling of the benefits and harms associated with different U.S. Breast cancer screening strategies. Ann. Intern. Med. 2016, 164, 215–225. [Google Scholar] [CrossRef] [Green Version]
- Geller, B.M.; Bowles, E.J.A.; Sohng, H.Y.; Brenner, R.J.; Miglioretti, D.L.; Carney, P.A.; Elmore, J.G. Radiologists’ Performance and Their Enjoyment of Interpreting Screening Mammograms. AJR Am. J. Roentgenol. 2009, 192, 361. [Google Scholar] [CrossRef] [Green Version]
- Alqahtani, W.S.; Almufareh, N.A.; Domiaty, D.M.; Albasher, G.; Alduwish, M.A.; Alkhalaf, H.; Almuzzaini, B.; Al-Marshidy, S.S.; Alfraihi, R.; Elasbali, A.M.; et al. Epidemiology of cancer in Saudi Arabia thru 2010–2019: A systematic review with constrained meta-analysis. AIMS Public Health 2020, 7, 679. [Google Scholar] [CrossRef]
- Kaya Keleş, M. Breast cancer prediction and detection using data mining classification algorithms: A comparative study. Tehnicki Vjesnik 2019, 26, 149–155. [Google Scholar] [CrossRef]
- Yadavendra; Chand, M. A comparative study of breast cancer tumor classification by classical machine learning methods and deep learning method. Mach. Vision Appl. 2020, 31, 46. [Google Scholar] [CrossRef]
- Zhang, J.; Chen, L.; Abid, F. Prediction of breast cancer from imbalance respect using cluster-based undersampling method. J. Healthc. Eng. 2019, 2019, 7294582. [Google Scholar] [CrossRef] [Green Version]
- Guan, H.; Zhang, Y.; Xian, M.; Cheng, H.D.; Tang, X. SMOTE-WENN: Solving class imbalance and small sample problems by oversampling and distance scaling. Appl. Intell. 2021, 51, 1394–1409. [Google Scholar] [CrossRef]
- Fotouhi, S.; Asadi, S.; Kattan, M.W. A comprehensive data level analysis for cancer diagnosis on imbalanced data. J. Biomed. Inf. 2019, 90, 103089. [Google Scholar] [CrossRef]
- Ali, H.; Li, H.; Afele Retta, E.; Haq, I.U.; Guo, Z.; Han, X.; Feng, J. Representation of Differential Learning Method for Mitosis Detection. J. Healthc. Eng. 2021, 2021, 6688477. [Google Scholar] [CrossRef]
- Jayatilake, S.M.D.A.C.; Ganegoda, G.U. Involvement of machine learning tools in healthcare decision making. J. Healthc. Eng. 2021, 2021, 6679512. [Google Scholar] [CrossRef]
- Awan, M.J.; Mohd Rahim, M.S.; Salim, N.; Rehman, A.; Nobanee, H. Machine Learning-Based Performance Comparison to Diagnose Anterior Cruciate Ligament Tears. J. Healthc. Eng. 2020, 2022, 2550120. [Google Scholar] [CrossRef]
- Kang, Q.; Chen, X.S.; Li, S.S.; Zhou, M.C. A noise-filtered under-sampling scheme for imbalanced classification. IEEE Trans. Cybern. 2016, 47, 4263–4274. [Google Scholar] [CrossRef]
- Rodríguez-Torres, F.; Martínez-Trinidad, J.F.; Carrasco-Ochoa, J.A. An Oversampling Method for Class Imbalance Problems on Large Datasets. Appl. Sci. 2022, 12, 3424. [Google Scholar] [CrossRef]
- Jedrzejowicz, J.; Jedrzejowicz, P. GEP-based classifier for mining imbalanced data. Expert Syst. Appl. 2021, 164, 114058. [Google Scholar] [CrossRef]
- Zhou, F.; Gao, S.; Ni, L.; Pavlovski, M.; Dong, Q.; Obradovic, Z.; Qian, W. Dynamic self-paced sampling ensemble for highly imbalanced and class-overlapped data classification. Data Min. Knowl. Discov. 2022, 36, 1601–1622. [Google Scholar] [CrossRef]
- Zhao, J.; Jin, J.; Chen, S.; Zhang, R.; Yu, B.; Liu, Q. A weighted hybrid ensemble method for classifying imbalanced data. Knowl.-Based Syst. 2020, 203, 106087. [Google Scholar] [CrossRef]
- Triguero, I.; Del Río, S.; López, V.; Bacardit, J.; Benítez, J.M.; Herrera, F. ROSEFW-RF: The winner algorithm for the ECBDL’14 big data competition: An extremely imbalanced big data bioinformatics problem. Knowl.-Based Syst. 2015, 87, 69–79. [Google Scholar] [CrossRef] [Green Version]
- Chen, Z.; Duan, J.; Kang, L.; Qiu, G. Class-imbalanced deep learning via a class-balanced ensemble. IEEE Trans. Neural Netw. Learn. Syst. 2021, 33, 5626–5640. [Google Scholar] [CrossRef]
- Ebenuwa, S.H.; Sharif, M.S.; Alazab, M.; Al-Nemrat, A. Variance ranking attributes selection techniques for binary classification problem in imbalance data. IEEE Access 2019, 7, 24649–24666. [Google Scholar] [CrossRef]
- Krawczyk, B. Learning from imbalanced data: Open challenges and future directions. Progr. Artif. Intell. 2016, 5, 221–232. [Google Scholar] [CrossRef] [Green Version]
- Xie, Y.; Qiu, M.; Zhang, H.; Peng, L.; Chen, Z. Gaussian distribution based oversampling for imbalanced data classification. IEEE Trans. Knowl. Data Eng. 2020, 34, 667–679. [Google Scholar] [CrossRef]
- Du, G.; Zhang, J.; Jiang, M.; Long, J.; Lin, Y.; Li, S.; Tan, K.C. Graph-based class-imbalance learning with label enhancement. IEEE Trans. Neural Netw. Learn. Syst. 2021, 1–15. [Google Scholar] [CrossRef]
- Koziarski, M.; Woźniak, M.; Krawczyk, B. Combined cleaning and resampling algorithm for multi-class imbalanced data with label noise. Knowl.-Based Syst. 2020, 204, 106223. [Google Scholar] [CrossRef]
- Tsai, C.F.; Lin, W.C. Feature selection and ensemble learning techniques in one-class classifiers: An empirical study of two-class imbalanced datasets. IEEE Access 2021, 9, 13717–13726. [Google Scholar] [CrossRef]
- Mishra, S.; Mallick, P.K.; Jena, L.; Chae, G.S. Optimization of skewed data using sampling-based pre-processing approach. Front. Public Health 2020, 8, 274. [Google Scholar] [CrossRef]
- Jung, I.; Ji, J.; Cho, C. EmSM: Ensemble mixed sampling method for classifying imbalanced intrusion detection data. Electronics 2022, 11, 1346. [Google Scholar] [CrossRef]
- Guzmán-Ponce, A.; Valdovinos, R.M.; Sánchez, J.S.; Marcial-Romero, J.R. A new under-sampling method to face class overlap and imbalance. Appl. Sci. 2020, 10, 5164. [Google Scholar] [CrossRef]
- Alamri, M.; Ykhlef, M. Survey of Credit Card Anomaly and Fraud Detection Using Sampling Techniques. Electronics 2022, 11, 4003. [Google Scholar] [CrossRef]
- Yang, F.; Wang, K.; Sun, L.; Zhai, M.; Song, J.; Wang, H. A hybrid sampling algorithm combining synthetic minority over-sampling technique and edited nearest neighbor for missed abortion diagnosis. BMC Med. Inf. Decis. Mak. 2022, 22, 344. [Google Scholar] [CrossRef]
- Dos Santos, R.P.; Silva, D.; Menezes, A.; Lukasewicz, S.; Dalmora, C.H.; Carvalho, O.; Giacomazzi, J.; Golin, N.; Pozza, R.; Vaz, T.A. Automated healthcare-associated infection surveillance using an artificial intelligence algorithm. Infect. Prev. Pract. 2021, 3, 100167. [Google Scholar] [CrossRef]
- Tarawneh, A.S.; Hassanat, A.B.; Almohammadi, K.; Chetverikov, D.; Bellinger, C. Smotefuna: Synthetic minority over-sampling technique based on furthest neighbour algorithm. IEEE Access 2020, 8, 59069–59082. [Google Scholar] [CrossRef]
- Pei, X.; Mei, F.; Gu, J. The real-time state identification of the electricity-heat system based on Borderline-SMOTE and XGBoost. IET Cyber-Phys. Syst. Theory Appl. 2022, 1–11. [Google Scholar] [CrossRef]
- Lin, E.; Chen, Q.; Qi, X. Deep reinforcement learning for imbalanced classification. Appl. Intell. 2020, 50, 2488–2502. [Google Scholar] [CrossRef] [Green Version]
- De Freitas, R.C.; Naik, G.R.; Valença, M.J.S.; Bezerra, B.L.D.; de Souza, R.E.; dos Santos, W.P. Surface electromyography classification using extreme learning machines and echo state networks. Res. Biomed. Eng. 2022, 38, 477–498. [Google Scholar] [CrossRef]
- Solanki, Y.S.; Chakrabarti, P.; Jasinski, M.; Leonowicz, Z.; Bolshev, V.; Vinogradov, A.; Jasinska, E.; Gono, R.; Nami, M. A hybrid supervised machine learning classifier system for breast cancer prognosis using feature selection and data imbalance handling approaches. Electronics 2021, 10, 699. [Google Scholar] [CrossRef]
- Kraiem, M.S.; Sánchez-Hernández, F.; Moreno-García, M.N. Selecting the suitable resampling strategy for imbalanced data classification regarding dataset properties. an approach based on association models. Appl. Sci. 2021, 11, 8546. [Google Scholar] [CrossRef]
- Rasool, A.; Bunterngchit, C.; Tiejian, L.; Islam, M.R.; Qu, Q.; Jiang, Q. Improved machine learning-based predictive models for breast cancer diagnosis. Int. J. Environ. Res. Public Health 2022, 19, 3211. [Google Scholar] [CrossRef]
- Jadhav, A.; Mostafa, S.M.; Elmannai, H.; Karim, F.K. An Empirical Assessment of Performance of Data Balancing Techniques in Classification Task. Appl. Sci. 2022, 12, 3928. [Google Scholar] [CrossRef]
- Rendon, E.; Alejo, R.; Castorena, C.; Isidro-Ortega, F.J.; Granda-Gutierrez, E.E. Data sampling methods to deal with the big data multi-class imbalance problem. Appl. Sci. 2020, 10, 1276. [Google Scholar] [CrossRef] [Green Version]
- Tasci, E.; Zhuge, Y.; Camphausen, K.; Krauze, A.V. Bias and Class Imbalance in Oncologic Data—Towards Inclusive and Transferrable AI in Large Scale Oncology Data Sets. Cancers 2022, 14, 2897. [Google Scholar] [CrossRef]
- San Yee, W.; Ng, H.; Yap, T.T.V.; Goh, V.T.; Ng, K.H.; Cher, D.T. An Evaluation Study on the Predictive Models of Breast Cancer Risk Factor Classification. J. Logist. Inform. Serv. Sci. 2022, 9, 129–145. [Google Scholar] [CrossRef]
- Huang, M.W.; Chiu, C.H.; Tsai, C.F.; Lin, W.C. On combining feature selection and over-sampling techniques for breast cancer prediction. Appl. Sci. 2021, 11, 6574. [Google Scholar] [CrossRef]
- Vuttipittayamongkol, P.; Elyan, E. Neighbourhood-based undersampling approach for handling imbalanced and over-lapped data. Inf. Sci. 2020, 509, 47–70. [Google Scholar] [CrossRef]
- Wang, Z.; Cao, C.; Zhu, Y. Entropy and Confidence-Based Undersampling Boosting Random Forests for Imbalanced Problems. IEEE Trans. Neural Netw. Learn. Syst. 2020, 31, 5178–5191. [Google Scholar] [CrossRef]
- Al-Shamaa, Z.Z.R.; Kurnaz, S.; Duru, A.D.; Peppa, N.; Mirnezami, A.H.; Hamady, Z.Z.R. The Use of Hellinger Distance Un-dersampling Model to Improve the Classification of Disease Class in Imbalanced Medical Datasets. Appl. Bionics Biomech. 2020, 2020, 8824625. [Google Scholar] [CrossRef]
- Desuky, A.S.; Hussain, S. An Improved Hybrid Approach for Handling Class Imbalance Problem. Arab. J. Sci. Eng. 2021, 46, 3853–3864. [Google Scholar] [CrossRef]
- Zhang, J.; Chen, L.; Tian, J.X.; Abid, F.; Yang, W.; Tang, X.F. Breast cancer diagnosis using cluster-based undersampling and boosted C5. 0 algorithm. Int. J. Control Autom. Syst. 2021, 19, 1998–2008. [Google Scholar] [CrossRef]
- Koziarski, M. Radial-based undersampling for imbalanced data classification. Pattern Recognit. 2020, 102, 107262. [Google Scholar] [CrossRef]
- Zhang, J.; Chen, L. Clustering-based undersampling with random over sampling examples and support vector machine for imbalanced classification of breast cancer diagnosis. Comput. Assist. Surg. 2019, 24, 62–72. [Google Scholar] [CrossRef] [Green Version]
- Rajendran, K.; Jayabalan, M.; Thiruchelvam, V. Predicting breast cancer via supervised machine learning methods on class imbalanced data. Int. J. Adv. Comput. Sci. Appl. 2020, 11, 54–63. [Google Scholar] [CrossRef]
- Tran, T.; Le, U.; Shi, Y. An effective up-sampling approach for breast cancer prediction with imbalanced data: A machine learning model-based comparative analysis. PLoS ONE 2022, 17, e0269135. [Google Scholar] [CrossRef]
- IBRAHIM, M.H. A Salp Swarm-Based Under-Sampling Approach for Medical Imbalanced Data Classification. Avrupa Bilim ve Teknoloji Dergisi 2022, 34, 396–402. [Google Scholar] [CrossRef]
- Kumar, V.; Lalotra, G.S.; Sasikala, P.; Rajput, D.S.; Kaluri, R.; Lakshmanna, K.; Shorfuzzaman, M.; Alsufyani, A.; Uddin, M. Addressing binary classification over class imbalanced clinical datasets using computationally intelligent techniques. Healthcare 2022, 10, 1293. [Google Scholar] [CrossRef]
- Mahesh, T.R.; Vinoth Kumar, V.; Muthukumaran, V.; Shashikala, H.K.; Swapna, B.; Guluwadi, S. Performance Analysis of XGBoost Ensemble Methods for Survivability with the Classification of Breast. Cancer 2022, 2022, 4649510. [Google Scholar] [CrossRef]
- Elyan, E.; Moreno-Garcia, C.F.; Jayne, C. CDSMOTE: Class decomposition and synthetic minority class oversampling tech-nique for imbalanced-data classification. Neural Comput. Appl. 2020, 33, 2839–2851. [Google Scholar] [CrossRef]
- Werner de Vargas, V.; Schneider Aranda, J.A.; dos Santos Costa, R.; da Silva Pereira, P.R.; Victória Barbosa, J.L. Imbalanced data pre-processing techniques for machine learning: A systematic mapping study. Knowl Inf Syst 2023, 65, 31–57. [Google Scholar] [CrossRef]
- Kabir, M.F.; Ludwig, S. Classification of breast cancer risk factors using several resampling approaches. In Proceedings of the 2018 17th IEEE International Conference on Machine Learning and Applications (ICMLA), Orlando, FL, USA, 17–20 December 2018. [Google Scholar] [CrossRef]


| Class Imbalance Degree | IR (Majority–Minority) | The Proportion of Minority Class |
|---|---|---|
| Extremely Imbalanced (Extreme) | 10,000:1, 1000:1 | <1% of the dataset |
| Moderately Imbalanced (Moderate) | 100:1, 50:1, 10:1, 5:1 | 1–19% of the dataset |
| Mildly Imbalanced (Mild) | 4:1, 2:1 | 20–40% of the dataset |
| Dataset Name | #Instances | Class Distribution | #Attributes | Imbalance Ratio | Class Imbalance Degree |
|---|---|---|---|---|---|
| Breast Cancer | 286 | 0:201, 1:85 | 9 | 2.36 | Mild |
| Breast Cancer Wisconsin (Original) | 699 | 0:458, 1:241 | 10 | 1.9 | Mild |
| Breast Cancer Wisconsin (Prognostic) | 198 | 0:151, 1:47 | 34 | 3.21 | Mild |
| Breast Cancer Wisconsin (Diagnostic) | 569 | 0:357, 1:212 | 32 | 1.69 | Mild |
| Breast Cancer from OpenML | 286 | 0:201, 1:85 | 10 | 2.36 | Mild |
| Breast Cancer Coimbra | 116 | 0:52, 1:65 | 10 | 1.25 | Mild |
| SEER Breast Cancer Dataset | 4024 | Alive: 3408, Dead: 616 | 15 | 5.53 | Moderate |
| Breast Cancer Surveillance Consortium-Risk Factor | 180,465 | No Risk: 173,696, Risk: 6769 | 13 | 25.66 | Moderate |
| S# | Variable | Short Name |
|---|---|---|
| 1 | Menopausal status | menopause |
| 2 | Age group | agegrp |
| 3 | Breast density | density |
| 4 | Race | race |
| 5 | Hispanic | hispanic |
| 6 | Body mass index | bmi |
| 7 | Age at first birth | Agefirst |
| 8 | Number of first-degree relatives with breast cancer | nrelbc |
| 9 | Previous breast procedure | brstproc |
| 10 | Result of the last mammogram before the index mammogram | lastmm |
| 11 | Surgical menopause | surgmeno |
| 12 | Current hormone therapy | hrt |
| 13 | Diagnosis of invasive breast cancer within one year of the index screening mammogram | invasive |
| 14 | Diagnosis of invasive or ductal carcinoma in situ breast cancer within one year of the index screening mammogram | cancer |
| 15 | Training data | training |
| 16 | Frequency count of this combination of covariates and outcomes (all variables 1 to 14) | count |
| ROS + XGBoost |  |
| ROS + ANN |  |
| ROS + SVM |  |
| SMOTE + XGBoost |  |
| SMOTE + ANN |  |
| SMOTE + SVM |  |
| BLSMOTE + XGBoost |  |
| BLSMOTE + ANN |  |
| BLSMOTE + SVM |  |
| RUS + XGBoost |  |
| RUS + ANN |  |
| RUS + SVM |  |
| ENN + XGBoost |  |
| ENN + ANN |  |
| ENN + SVM |  |
| TL + XGBoost |  |
| TL + ANN |  |
| TL + SVM |  |
| SMOTE-ENN + XGBoost |  |
| SMOTE-ENN + ANN |  |
| SMOTE-ENN + SVM |  |
| SMOTE-TL + XGBoost |  |
| SMOTE-TL + ANN |  |
| SMOTE-TL + SVM |  |
| SPIDER + XGBoost |  |
| SPIDER + ANN |  |
| SPIDER + SVM |  |
 |  |  |
| BCSC-ROS dataset | BCSC-SMOTE dataset | BCSC-BLSMOTE dataset |
 |  |  |
| BCSC-RUS dataset | BCSC-ENN dataset | BCSC-TL dataset |
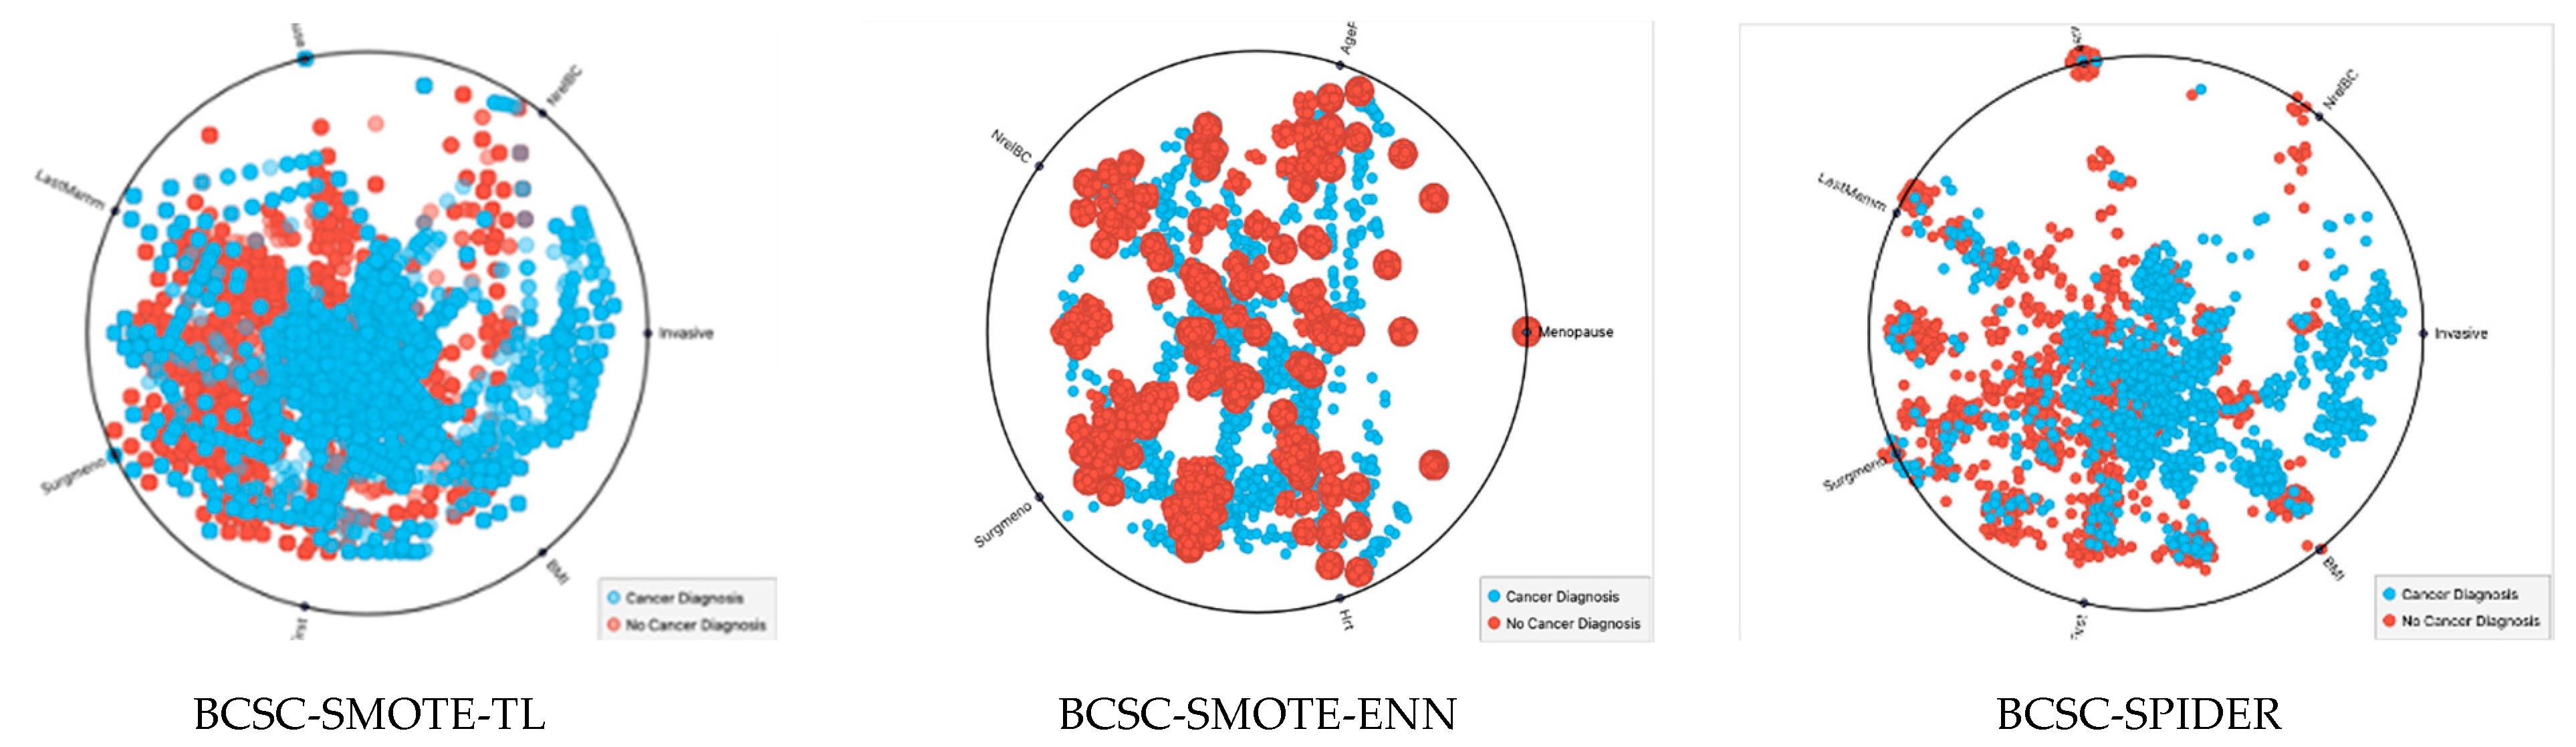
 |  |  |
| BCSC-SMOTE-ENN dataset | BCSC-SMOTE-TL dataset | BCSC-SPIDER dataset |
| Kabir and Ludwig [58] | Rajendran et al. [51] | San Yee et al. [42] | The Current Study | |
|---|---|---|---|---|
| Year | 2018 | 2020 | 2022 | 2023 |
| Resampling Techniques deployed | RUS, ROS, SMOTE, ENN, SMOTE-ENN, SMOTE-TL | SMOTE SpreadSubsampling | SMOTE | RUS, ENN, TL, ROS, SMOTE, BLSMOTE, SMOTE-ENN, SMOTE-TL, SPIDER |
| Classifiers deployed | DT, RF, XGBoost | Bayesian network, NB, LR, SVM, MLP | LR, RF, SVM, MLP | XGBoost, ANN, SVM |
| Best Fusion Model | ENN + XGBoost | SMOTE + Bayesian network | SMOTE + RF | ROS + XGBoost |
| Accuracy | 0.9149 | 0.9910 | 0.8200 | 0.9999 |
Disclaimer/Publisher’s Note: The statements, opinions and data contained in all publications are solely those of the individual author(s) and contributor(s) and not of MDPI and/or the editor(s). MDPI and/or the editor(s) disclaim responsibility for any injury to people or property resulting from any ideas, methods, instructions or products referred to in the content. |
© 2023 by the authors. Licensee MDPI, Basel, Switzerland. This article is an open access article distributed under the terms and conditions of the Creative Commons Attribution (CC BY) license (https://creativecommons.org/licenses/by/4.0/).
Share and Cite
Sakri, S.; Basheer, S. Fusion Model for Classification Performance Optimization in a Highly Imbalance Breast Cancer Dataset. Electronics 2023, 12, 1168. https://doi.org/10.3390/electronics12051168
Sakri S, Basheer S. Fusion Model for Classification Performance Optimization in a Highly Imbalance Breast Cancer Dataset. Electronics. 2023; 12(5):1168. https://doi.org/10.3390/electronics12051168
Chicago/Turabian StyleSakri, Sapiah, and Shakila Basheer. 2023. "Fusion Model for Classification Performance Optimization in a Highly Imbalance Breast Cancer Dataset" Electronics 12, no. 5: 1168. https://doi.org/10.3390/electronics12051168