Article

Quick Identification of Open/Closed State of GIS Switch Based on Vibration Detection and Deep Learning

China Southern Power Grid Company Limited, Guangzhou 510623, China
*
Author to whom correspondence should be addressed.
Electronics 2023, 12(14), 3204; https://doi.org/10.3390/electronics12143204
Submission received: 8 May 2023 / Revised: 29 June 2023 / Accepted: 5 July 2023 / Published: 24 July 2023
(This article belongs to the Special Issue Recent Advances in Applied Deep Neural Network)

Abstract

:
The rapid and accurate identification of the opening and closing state of the knife switch in a gas insulated switchgear (GIS) is very important for the timely detection of equipment faults and for the reduction of related accidents. However, existing technologies, such as image recognition, are vulnerable to weather or light intensity, while microswitch, attitude sensing and other methods are unable to induce equipment power failure with sufficient speed, which brings many new challenges to the operation and maintenance of a GIS. Therefore, this research designs a GIS shell vibration detection system for knife switch state discrimination, introduces a deep learning algorithm for knife switch vibration signal analysis, and proposes a fast convolutional neural network (FCNN) to identify the knife switch state. For the designed FCNN, a normalization layer and a nonlinear activation layer are used after each convolution layer to obviously reduce feature quantity and increase algorithm efficiency. In order to test the recognition performance based on the vibration detection system, this study carried out two kinds of knife switch opening and closing experiments. One group with artificial noise was added, the other group did not include artifical noise, and a corresponding data set was constructed. The experimental results show that the recognition accuracy for both datasets reaches 100%, and the FCNN algorithm is better than the five classical algorithms in terms of prediction efficiency. This study shows that the vibration detection technology based on deep learning can be used to effectively identify the opening and closing state of a GIS knife switch, and is expected to be promoted and applied.

1. Introduction

A Gas Insulated Switchgear (GIS) refers to a type of metal-made enclosed switching device that partially or completely uses a certain gas as the insulating medium. The gas is compressed to a pressure higher than the atmospheric pressure. The GIS is composed of a set of high-voltage electrical components such as a circuit switch, isolating switch, voltage transformer, lightning arrester, bus, cable terminal box or (and) outlet bushing, and is assembled according to the bus requirements. Since its invention in the 1960s, GIS technology has undergone continuous development. It has many advantages, such as a small footprint, reliable operation, long MTBR and easy maintenance [1]. Therefore, it has become popular among users and has been widely used in hydropower stations, urban network substations and nuclear power plants. Today, GIS technology is still rapidly developing and plays an increasingly important role in modern power systems [2]. However, it has some technical deficiencies regarding manufacturing, installation, operation and maintenance, online diagnosis, etc. If effective measures are not taken in time in the event of a GIS failure, an accident may happen that can cause casualties and asset loss.
As a huge and complex piece of equipment, a GIS is not only an electromechanical instrument, but is also a complex piece of mechanical equipment. One of the key components of a GIS is the switch, which is operated frequently. Therefore, its contacts will wear out constantly under the impact of the mechanical forces and the stresses between the contacts, resulting in a poor connection between the contacts [3]. The change in the contact status of the isolating switch of a GIS will cause an intense temperature increase and the generation of abnormal vibration signals inside the GIS [4]. The long-term occurrence of such problems may eventually lead to an accident. Therefore, it is particularly important to monitor the operating state of the GIS isolating switch online [5].
To sum up, GIS switches play a very important role in circuit conversion and in ensuring the safety of power outage maintenance work, and are one of the important factors affecting the safety of power grid operation. However, given that GIS switches are prone to faults caused by factors such as environment, operation and quality, it is necessary to pay attention to the detection and maintenance of the switches, so that they can continue to play their role effectively and stably, ensuring the safe and stable operation of the power system.
In order to effectively detect the state of the GIS switch, researchers have proposed a variety of technologies, including image recognition [6,7,8], attitude sensing [9], microswitch [10], magnetic induction [11], current and angular displacement [12], vibration sensing [13] and so on.
Among the above detection techniques, the image recognition technology used by some detection methods is influenced by the weather and light intensity, and, therefore, the image recognition accuracy is not ideal. Devices such as an attitude sensor, a microswitch and magnetic induction can be used to detect the open/closed state of the isolating switch. However, the installation and maintenance of such devices require a lengthy down time, which makes them difficult to check and calibrate. By comparison, a vibration sensor can be installed without cutting off the power supply. Furthermore, as its operation is not easily affected by the environmental conditions, it has a great potential for many applications. Therefore, it is necessary to develop switch state detection methods based on vibration detection so as to overcome or avoid the problems which arise during the practical application of the aforementioned methods.
The GIS switch will experience vibrations due to the actions of the electric and mechanical forces on it during operation of the GIS. Based on these phenomena, some researchers devised a method to evaluate the contact status of switch contacts by measuring and analyzing the vibration signals on the switch case, and demonstrated the feasibility of this method [14,15]. Most of the existing vibration-based detection methods evaluate the state of a switch by analyzing the frequency spectrum features of vibration signals in different switch states [16]. When the switch contacts are in the contact state, the signal spectrum is dominated by the fundamental frequency of 100 Hz. When the switch contacts are in a poor contact state, the signal amplitude will increase. In addition, a higher number of signal components whose frequencies are multiples of the fundamental frequency (200 Hz, 300 Hz, 600 Hz and so on) will appear [17,18,19]. However, this kind of feature needs to be extracted manually, and the number of usable features is considerably limited. Therefore, it is necessary to explore more usable features.
In order to overcome the disadvantages of the existing methods, we introduce and devise a pattern recognition method to identify the switch state, i.e., the Fast Convolutional Neural Network (FCNN) recognition algorithm. The main contributions of this study include: (1) A vibration detection system for GIS switch state detection is designed and built; (2) A vibration dataset for testing the algorithms is constructed; (3) A FCNN deep learning network is proposed, and its performance is verified for switch state detection. This network effectively reduces the time needed for feature extraction, network training and model convergence, while maintaining a high detection accuracy.

2. Related Works

In the past, several technologies including image recognition, attitude sensing, microswitch, magnetic induction and current and angular displacement have been commonly used for the detection of switch opening and closing status. For example, Wang et al. [6] devised a method of detecting the open/closed position of an isolation switch disk based on a technique that used deep convolution to generate a countermeasure network. This method improved the accuracy of detection of the open/closed position of the isolation switch based on the images. Chen et al. [9] designed an intelligent isolating switch position monitoring system based on attitude sensing, with the aim of achieving high accuracy for the detection of the open/closed position of the isolating switch. For monitoring the working conditions of the GIS high-voltage isolating switch operating mechanism online, an online monitoring method for the working status of the operating mechanism of disconnector, according to the double analysis method of current and angular displacement, was proposed to realize online monitoring of the GIS disconnector by Wang et al. [12]. With practicality in mind, Luo et al. [10] proposed a “double-confirmation” method that combined a microswitch with auxiliary contacts to improve the accuracy of detecting the open/closed position of the isolation switch. The method provided strong support for promoting the implementation of one-key sequential control of intelligent substations.
Although the aforementioned technologies have demonstrated promising results regarding the detection of switch opening and closing status, they are either susceptible to weather or difficult to install and maintain. In recent years, vibration-based methods, which can overcome the shortcomings of the above methods, have gradually received increased attention. For instance, experimental results by Zhong et al. [20] show that vibration analysis can detect mechanical defects such as poor contact in GIS switches. Qi et al. [21] used finite element analysis software to simulate GIS vibration, verifying the feasibility of the simulation. In addition to being used for detecting the opening and closing status of the switch, vibration signals are widely used in other fields. Ye et al. [22] proposed a deep morphological convolutional network for feature learning of vibration signals and applied it to gearbox fault diagnosis. Jia et al. [23] designed a novel denoising method for vibration signals of a hob spindle, based on EEMD and grey theory. Lim et al. [24] developed a deep learning-based detection technology for vortex-induced vibration of a ship’s propeller.
For machine learning or neural network methods [25,26,27], through literature research, we found that there are relatively few algorithms used for GIS switch opening and closing state recognition based on vibration signals. Consequently, this section mainly reviews algorithms used for vibration signal analysis in various fields. Wang et al. [28] proposed an attention-guided joint learning CNN method for bearing fault diagnosis and vibration signal denoising. Wang et al. [29] designed a multi-input and multi-task convolutional neural network for fault diagnosis based on bearing vibration signals. Four distinct classifiers: k-nearest-neighbor (k-NN), support vector machine (SVM), random forest and one-dimensional convolutional neural network were experimentally compared, under gradually increasingly difficult generalization tasks, using the proposed evaluation framework by Rauber et al. [30]. An extensive literature review suggested that most vibration-based research papers, particularly for the Case Western Reserve University Bearing Data, use similar patterns for training and testing, making their classification an easy task [30]. Inspired by this, we use vibration detection technology and propose the FCNN method for discrimination of the switch opening and closing status.

3. Experimental Details

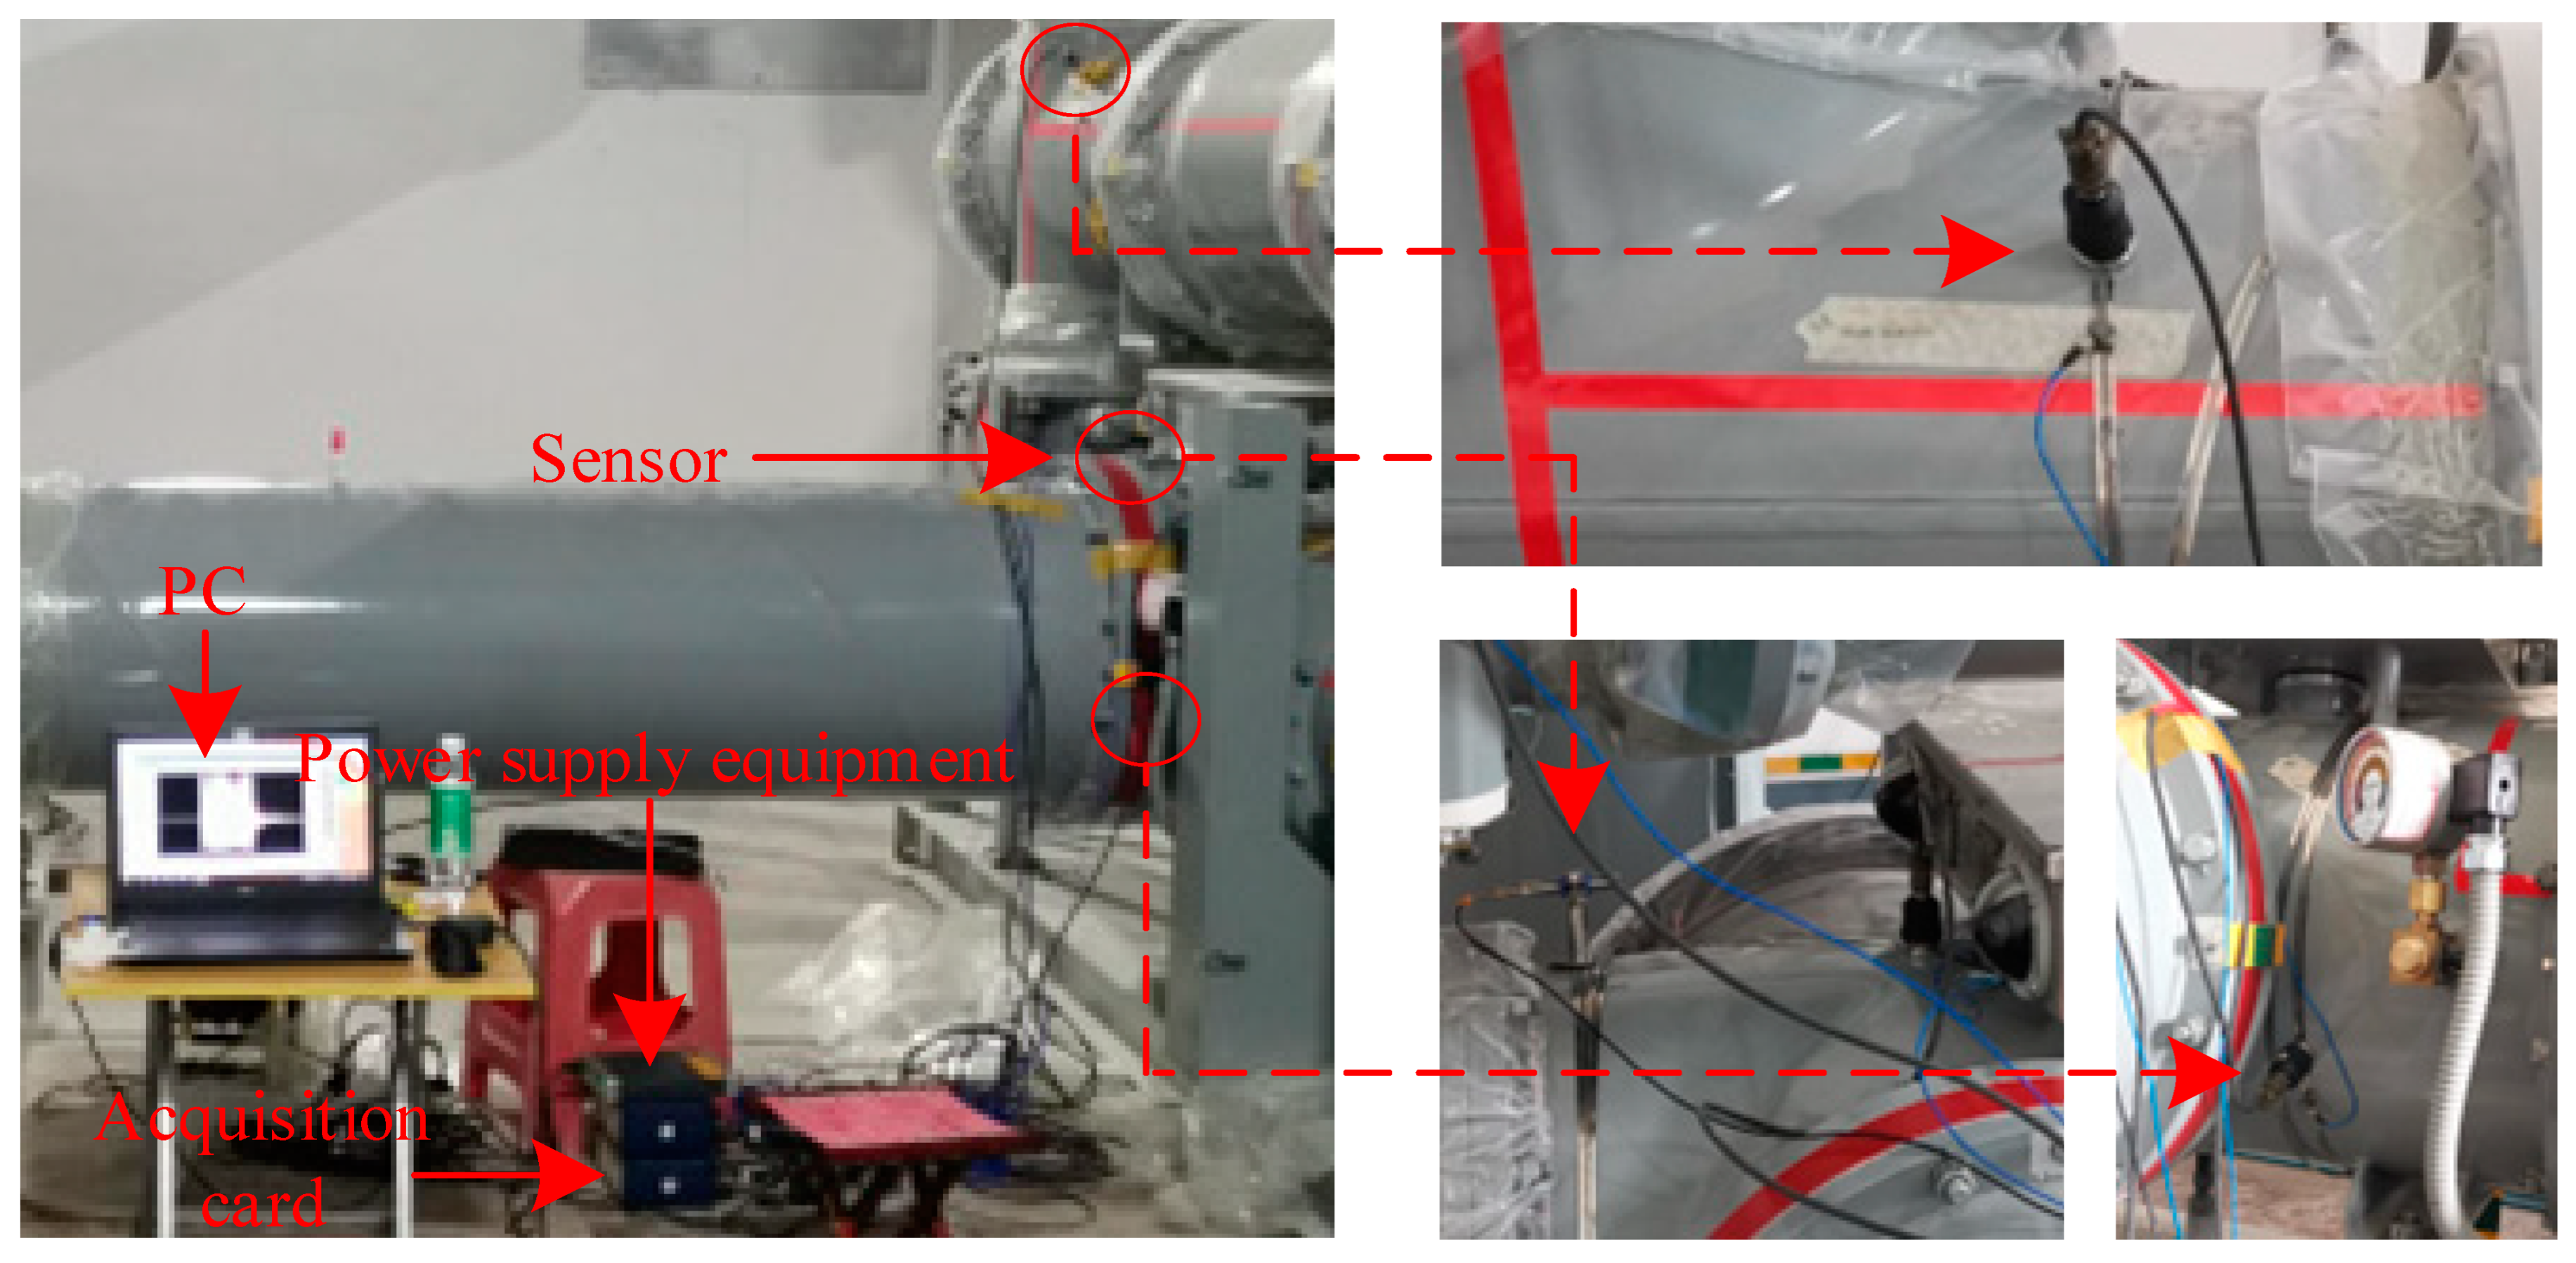
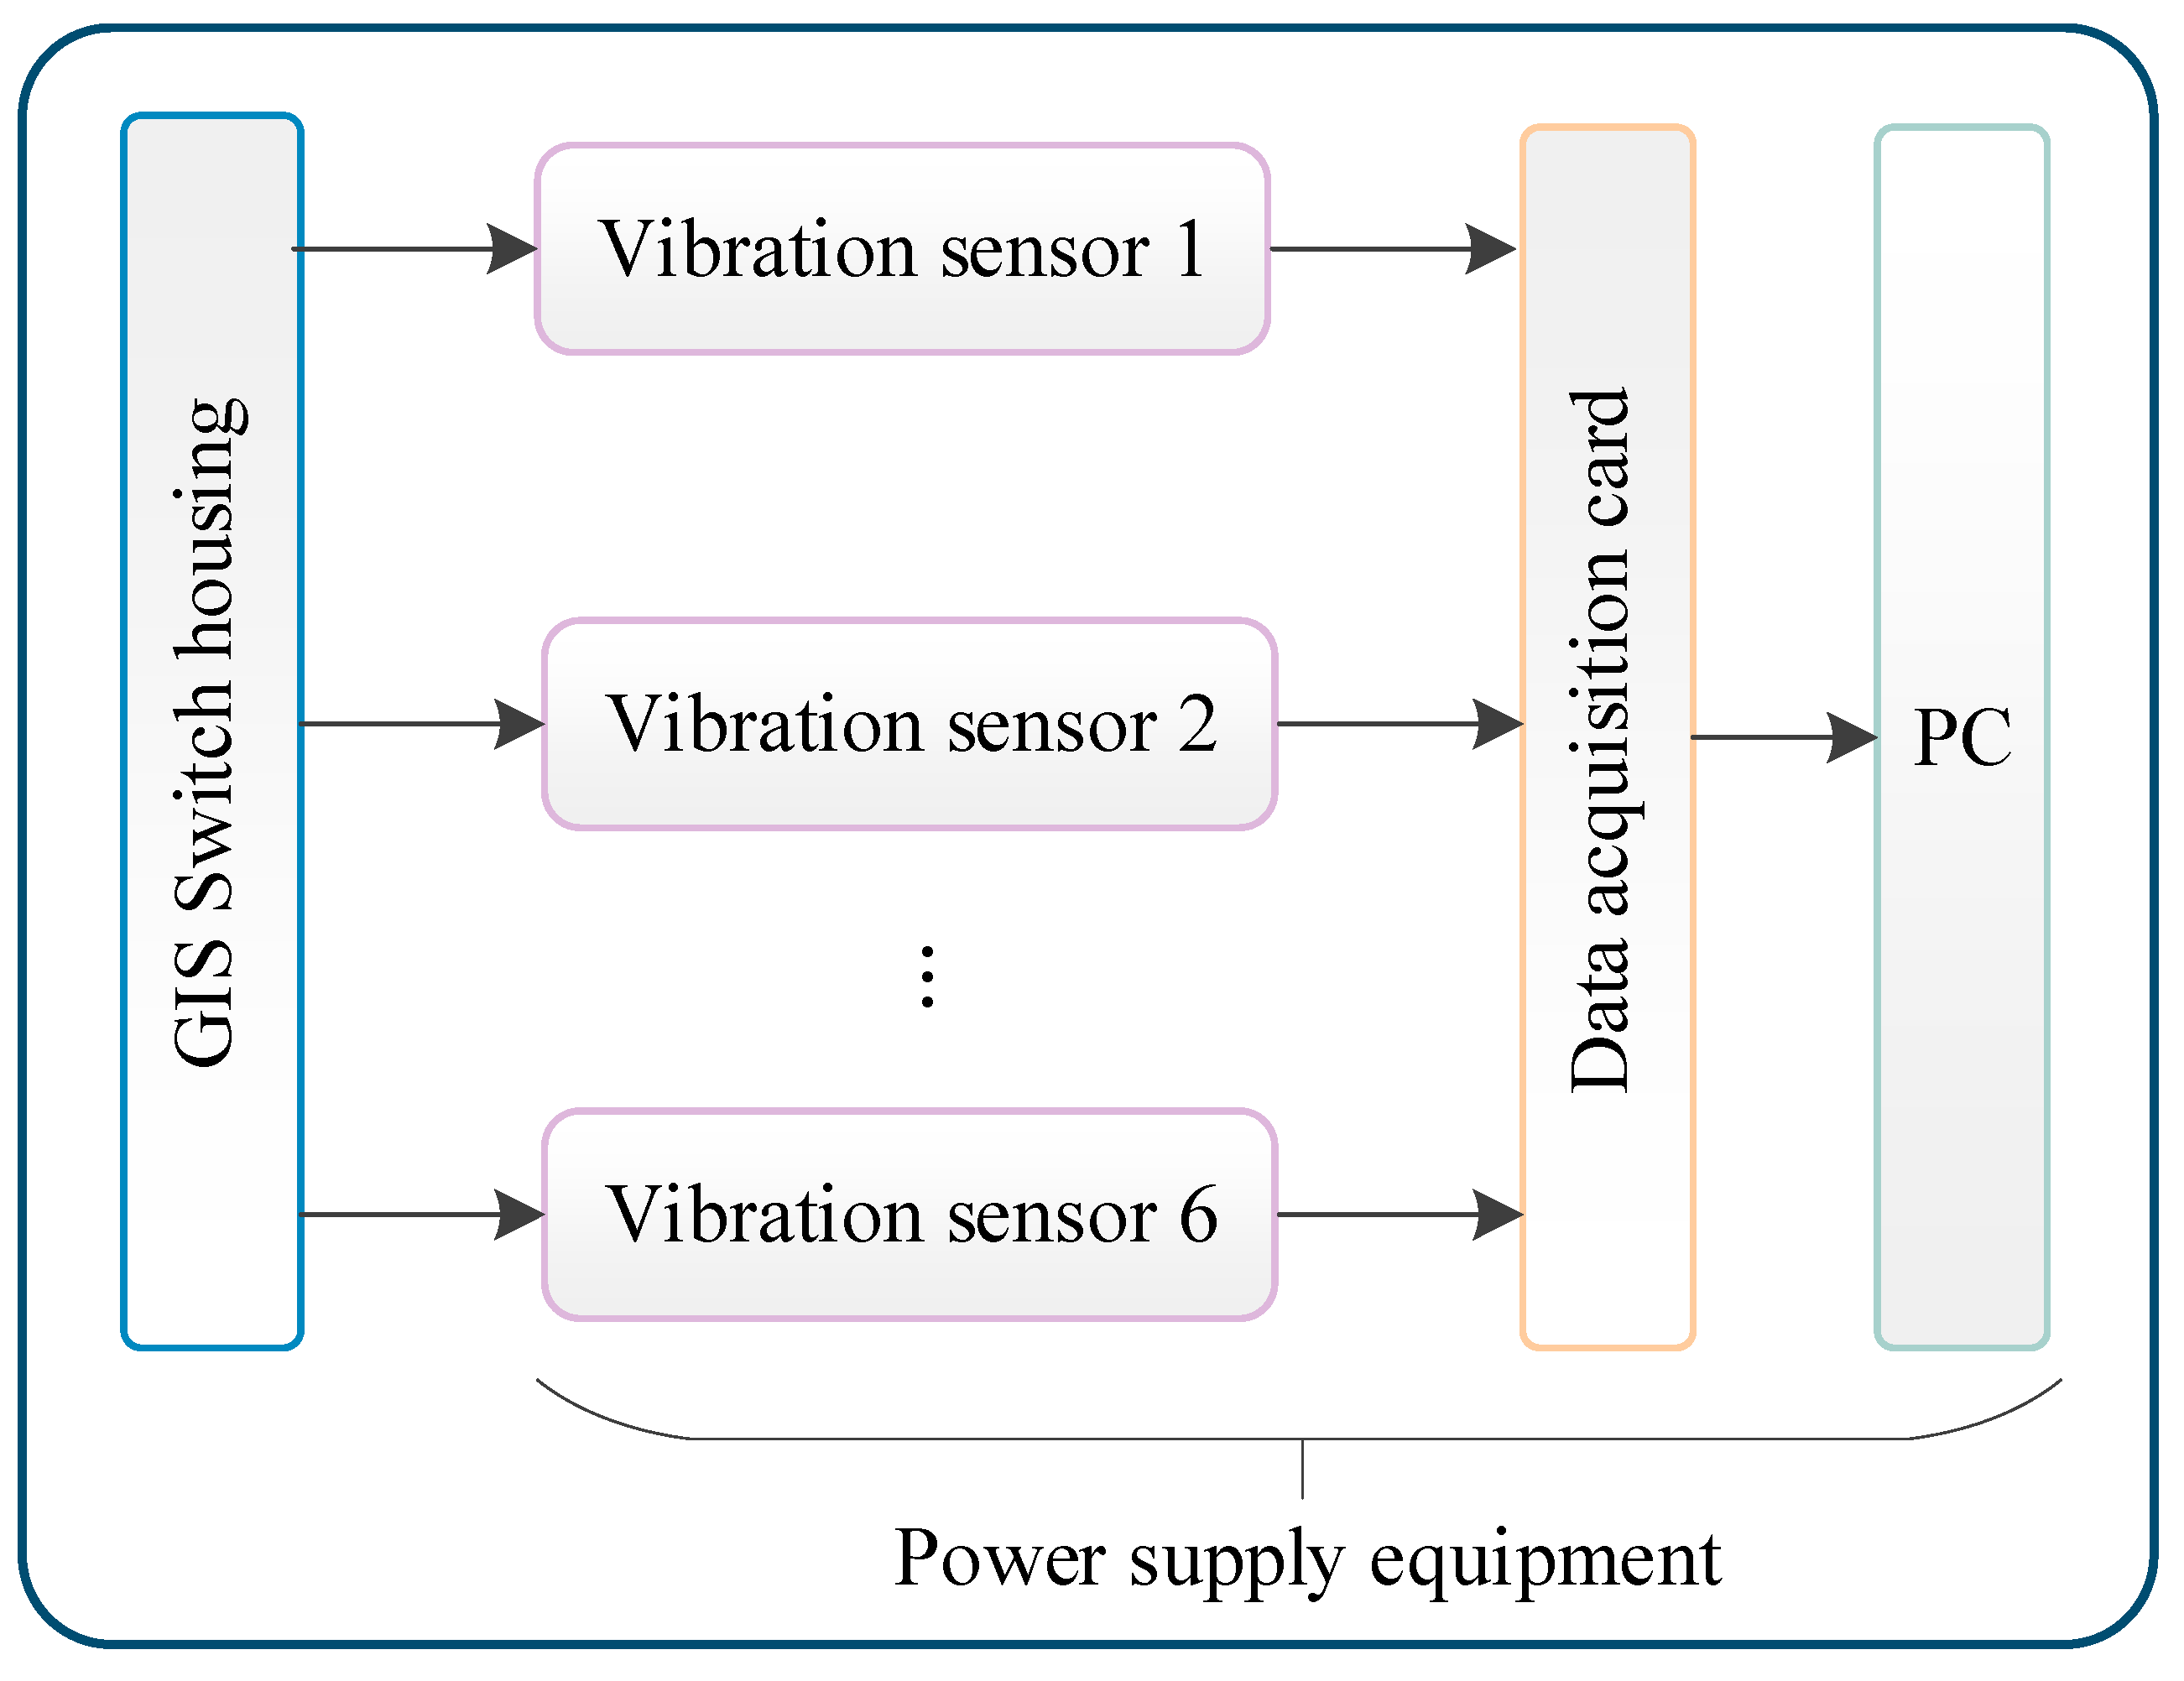
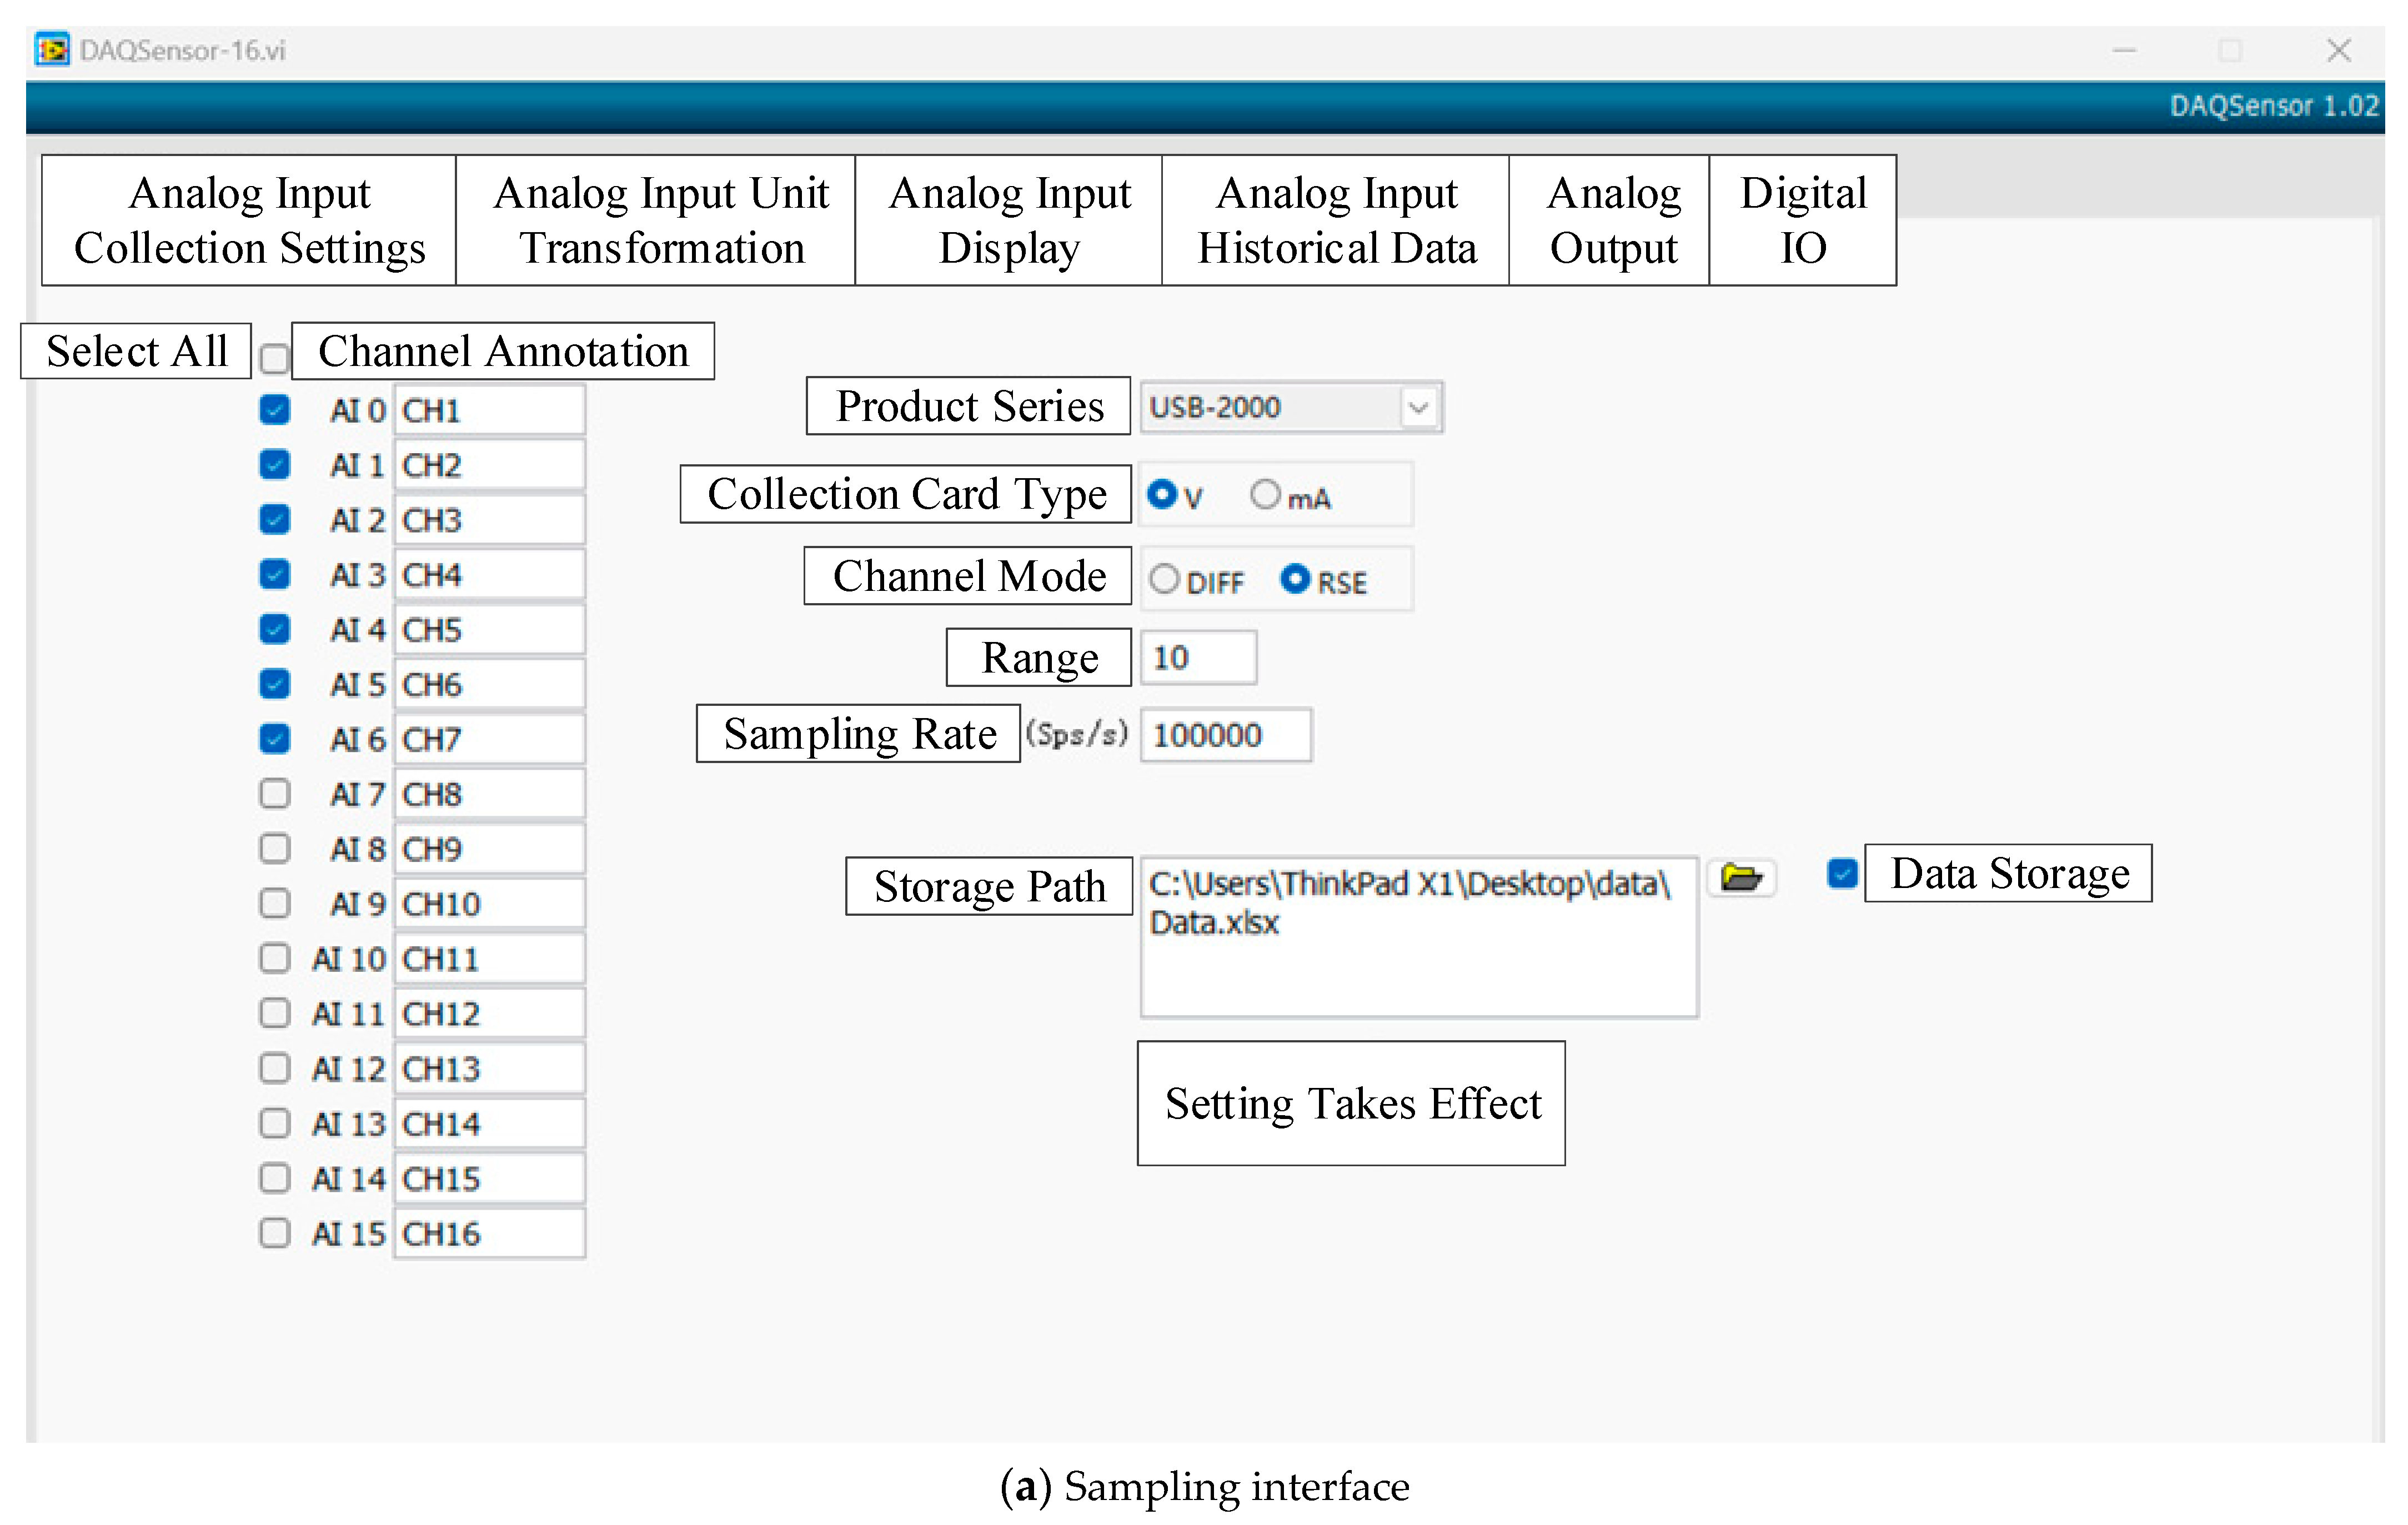
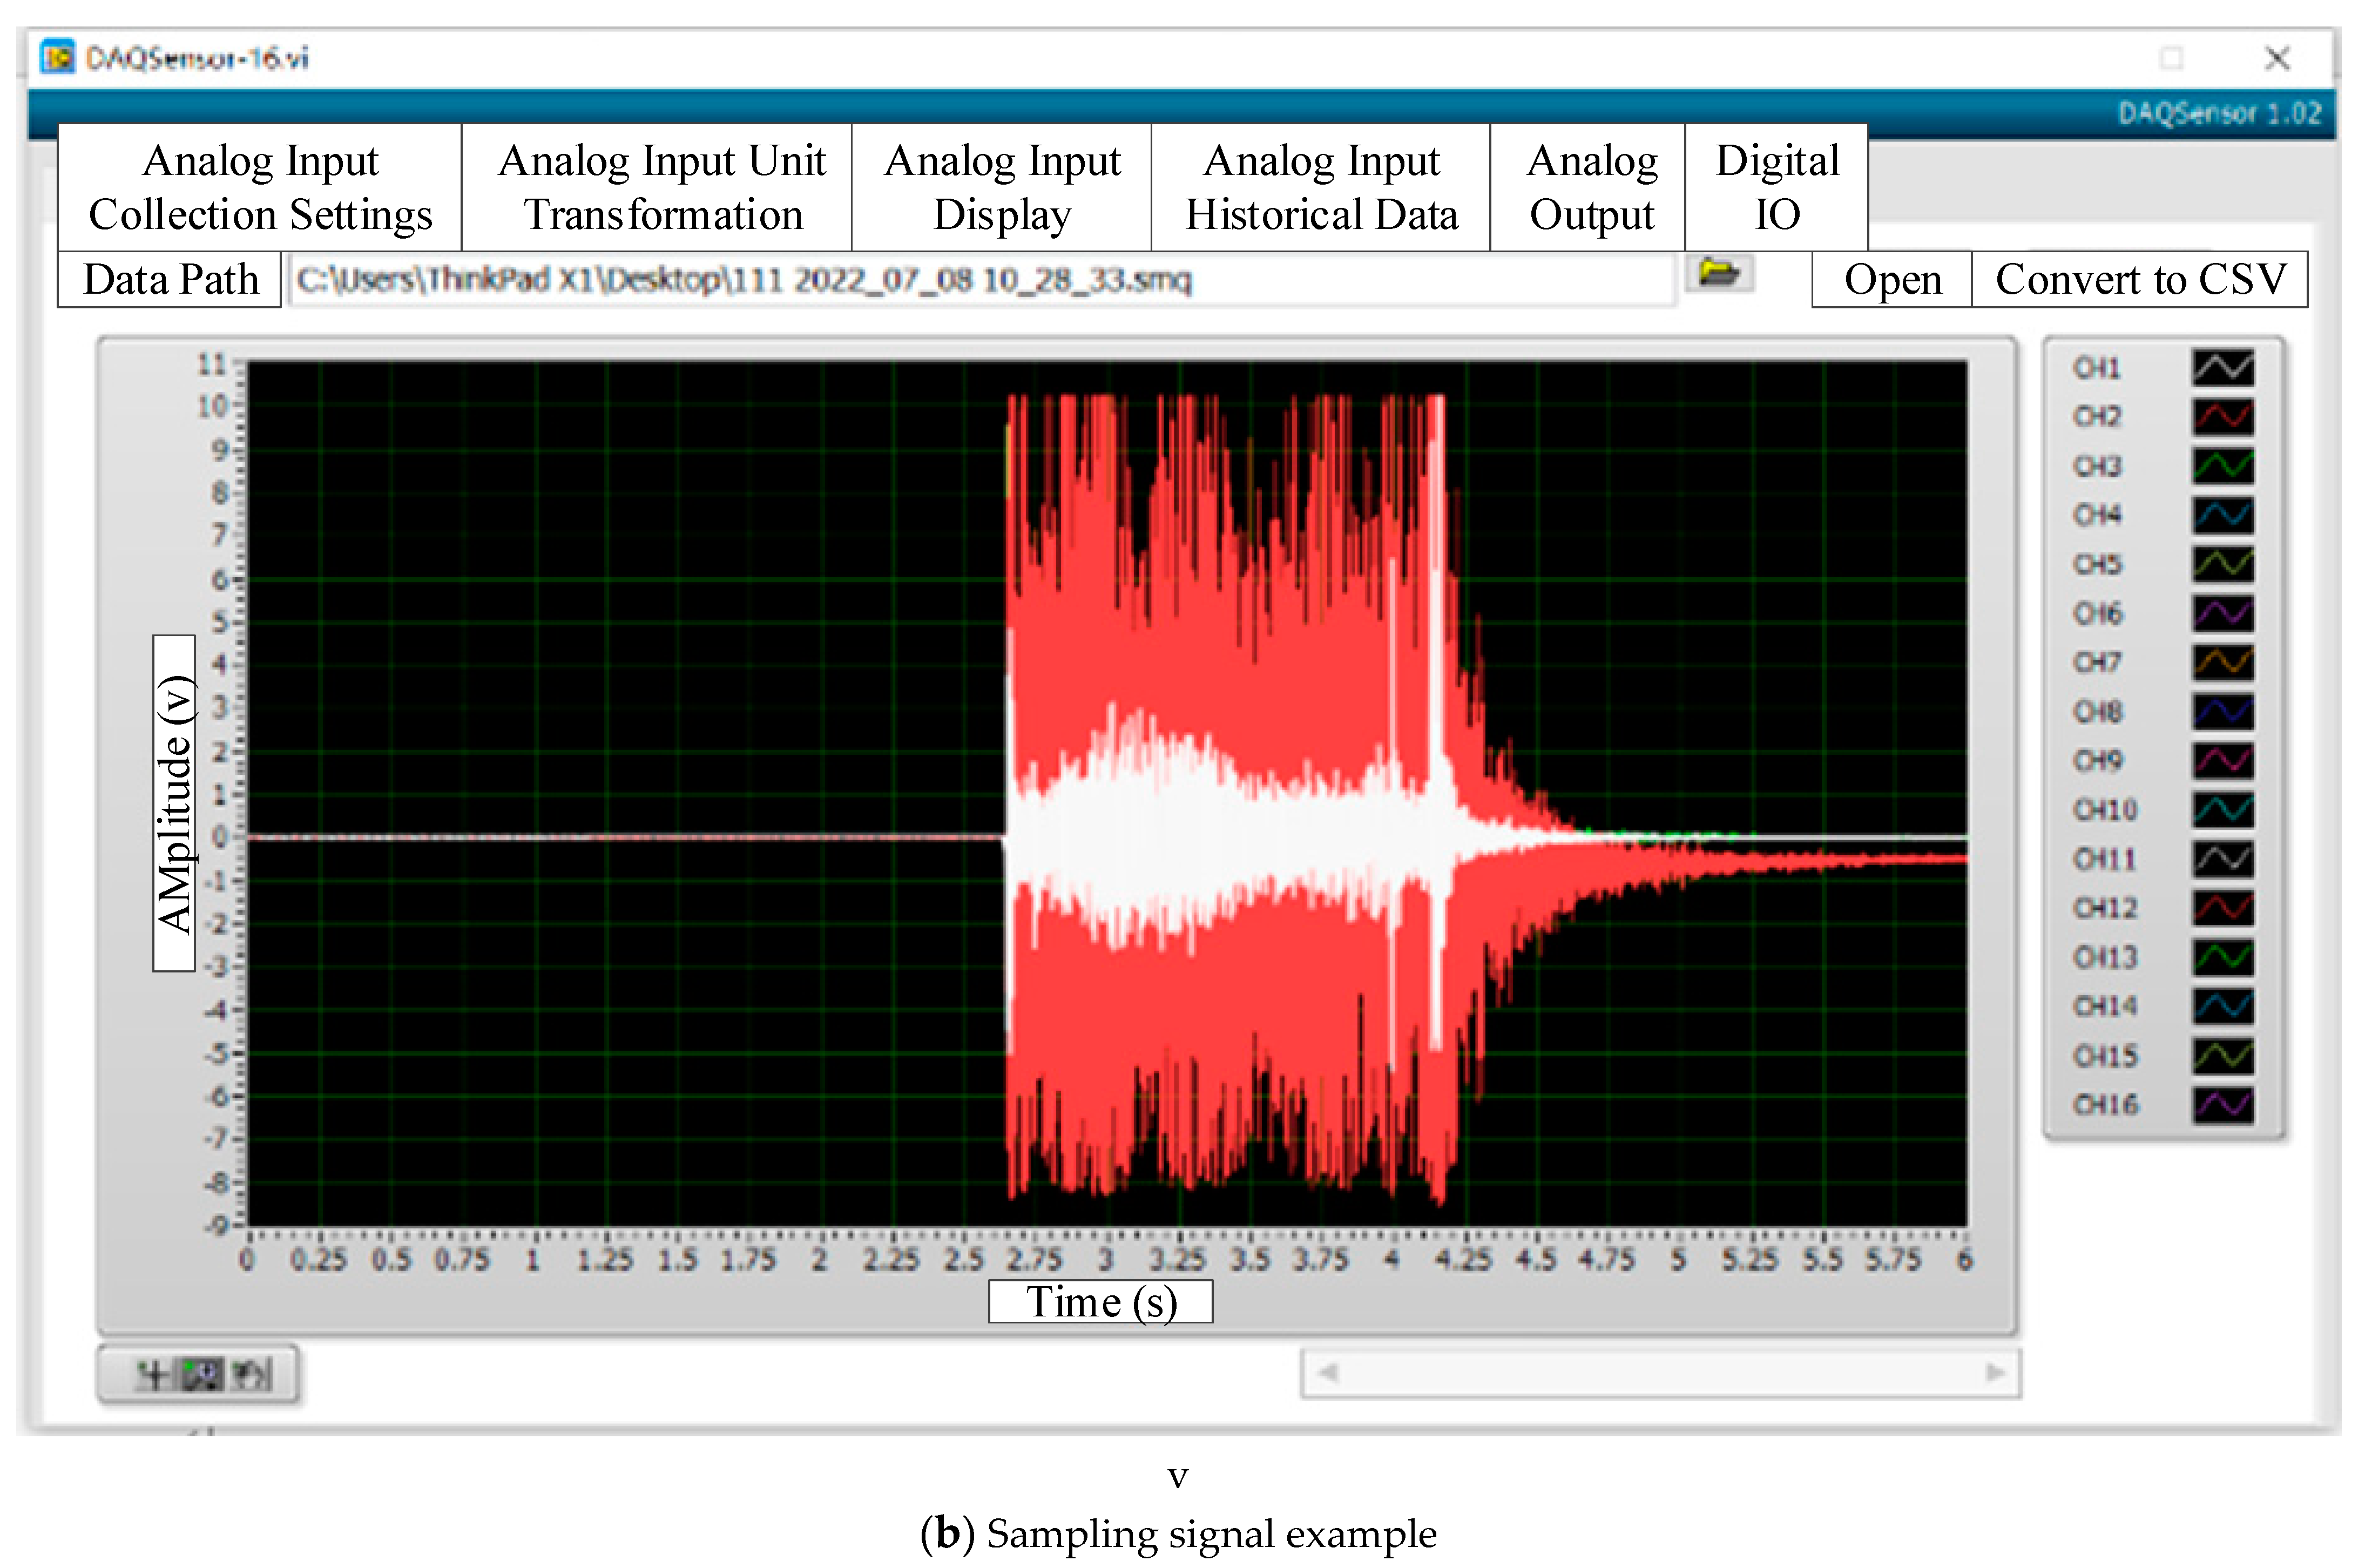
3.1. Vibration Detection System

The experiment in this study was carried out at the 110 kV Yungui Substation, and the GIS used in the experiment was ZF12B-126(L), supplied by Henan Pinggao Electric Co., Ltd. Figure 1 shows some photos of the vibration detection system, and Figure 2 shows its block diagram. The detection system built during the experiment mainly consisted of vibration sensors, including signal cables with BNC connectors, a constant current source, a data acquisition card and a PC. The constant current source supplied power to other devices in the system. The VK702 data acquisition card had eight vibration signal channels (six channels were actually used to collect vibration signals, one channel was used to collect acoustic signals), where the maximum sampling frequency could reach up to 500 KHz. The input of the acquisition card was the vibration signals with 6 channels, where the sampling accuracy up to 24 bits and the data was output to Excel table in floating point format. Then, the collected data were transmitted to a PC through a USB data cable. The models of all 6 of the vibration sensors are 393B12 (The corresponding parameters are shown as follows) and the sampling frequency of each sensor was set to 100 kHz (Figure 3). For vibration detection, potential noise sources include the interferences of vehicles on the road, thunder and on-site construction noise. These noises may interfere with vibration signals, which will be investigated in the next stage.
  • Sensitivity: (±10%) 10,000 mV/g (1019.4 mV/(m/s2))
  • Broadband resolution: 0.000008 g rms (0.00008 m/s2 rms)
  • Measurement range: 0.5 g pk (4.9 m/s2 pk)
  • Frequency range: (±5%) 0.15 to 1000 Hz
  • Electrical connector: 2-pin MIL-C-5015
  • Weight: 7.4 ounces (210 g)

3.2. Construction of GIS Switch Open/Closed State Dataset

During the experiment in this study, the switching of the open/closed state of the switch was manually controlled by the experimenter on the control cabinet. In order to ensure that the vibration sensors could acquire the vibration signal during the course of the switch closing/opening operation, the sampling was set to start before each switch action and to stop about 2 s after each switch action. The steps for acquiring the vibration signal are as follows:
  • Clean up the experimental site and fix the sensor bases onto the GIS shell, as shown in Figure 1;
  • Connect components of the vibration detection system and make sure that all devices are intact and in working condition;
  • Perform signal pre-collection to check whether the sensors experience a signal overload, and wait for the sensors to enter the stable working state;
  • Collect data according to the preset experimental targets and sample number. Subsequently, record the information including the time of data acquisition, type of the acquired signal, etc., and check the validity of the acquired signal using the computer;
  • Dismantle the devices after the experiment is completed.
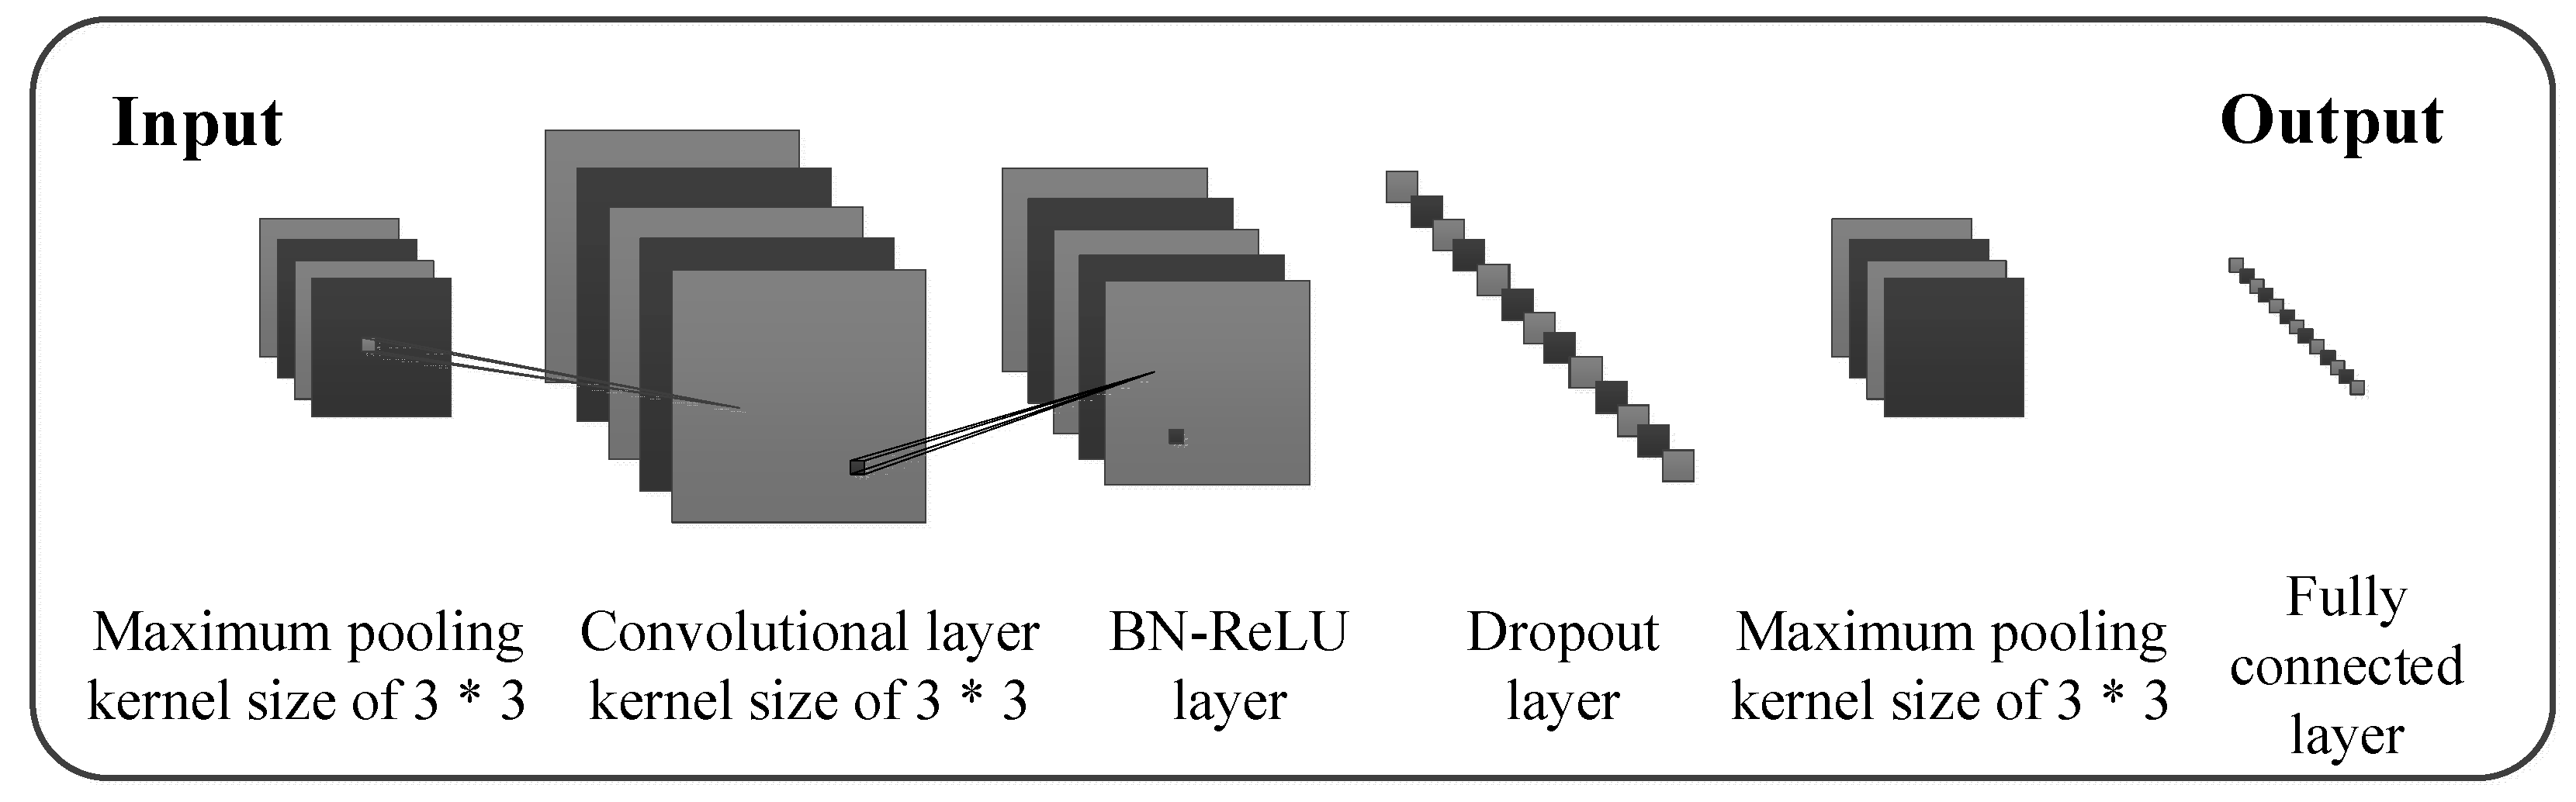
Two datasets were constructed that contained open/closed state data of the GIS switch obtained in the experiment. The data in first dataset were obtained with the presence of artificial noise, while the data in the second dataset were obtained without any artificial noise. The dataset with artificial noise contained 40 [=20 (number of samples/switch state) × 2 (number of switch states)] samples, while the dataset without artificial noise contained 200 [=100 (number of samples/switch state) × 2 (number of switch states)] samples.

4. FCNN Algorithm

During vibration signal detection, sensors may be affected by environmental noise or other mechanical vibrations, which cause instability of the sensor signals. Therefore, it is necessary to pre-process the original data before feature extraction. In order to eliminate interference, improve the reliability of sampling and reduce the influence of false information, we used the Savitzky–Golay smoothing filter to process the original data.
The Savitzky–Golay filter (abbreviated as the S–G filter) was first proposed by Savitzky and Golay in 1964, and has been widely used in data stream smoothing and denoising since then. It is a filtering method based on local polynomial least square fitting in the time domain. The most prominent feature of this filter is that it can keep the shape and width of the signal unchanged while filtering out noise. The core idea behind this filter is that it can perform k-order polynomial fitting on the data points in a window of a certain length and obtain the fitted result. After discretization, the filter is actually a weighted average algorithm based on a moving window. However, the weighting coefficient is not a simple constant window; rather, it is obtained by performing least square fitting on a given high-order polynomial in the sliding window.
On the basis of signal filtering and feature extraction, the next step identified signal features. In this study, we introduce deep learning for the state detection of the GIS switch. The idea behind deep learning is to establish a certain model based on the abstraction of the neural network of the human brain from the perspective of information processing, and then form different networks according to different connection modes. Consider a CNN as an example. The network is an operational model composed of a large number of interconnected nodes (or neurons). Each node represents a specific output function called the activation function. The connection between each node pair represents a weighted value of the signal passing through the connection, which is called a weight. This weight is equivalent to the CNN’s memory. The output of the network is jointly determined by the connection mode, weight value and incentive function of the network. The network itself is usually an approximation of an algorithm or a function in nature, or it may be an expression of a logical strategy.
In this study, an FCNN detection algorithm was designed based on a traditional CNN, as shown in Figure 4. The input variables of the FCNN were the features, obtained after normalization, and kernel principal component analysis (KPCA) for the frequency spectra signals of the sensor output signals. In order to fully extract different feature information from different types of training samples, we increased the number of neurons in the convolution layer. Specifically, the measures included: (1) The KPCA was performed on the experimental dataset to reduce the computational load and improve the detection efficiency; (2) The gradient optimization algorithm was applied with a multi-convolution kernel and batch normalization in order to improve the loss function of FCNN; (3) The exit mechanism was executed after the operation of each convolution layer to avoid or reduce over-fitting, and the retention rate was set to 0.8. When training the FCNN, a cross-entropy loss function was defined to measure the performance of the model. Then, the gradient descent optimization algorithm with backpropagation was used to automatically calculate the gradient of the loss function and to update each weight of the convolution kernel, so that the loss function is minimized. This process requires a great number of iterations until the performance of the model converges.
By using local connections and weight sharing mechanisms, the number of network parameters was reduced in order to decrease the network complexity. This is shown by Equation (1), as follows:
Y j l = δ ( C o n v ( X i 1 l 1 , W k + b i l ) ) ,
where i and j represent the input and output positions of the convolution, respectively, l represents the number of convolution layers, δ(·) represents the activation function, Wk represents the convolution kernel, b represents the offset value and X and Y represent the input and output features, respectively.
The main function of the pooling layer is to perform dimensionality reduction, which can also effectively prevent or reduce over-fitting. This operation is shown by Equation (2), as follows:
Z m l = f ( ω j l d o w n ( Y j l 1 ) + b j l ) ,
where m is the input position, down(·) represents the sub-sampling function, ω represents the weight and Z represents the output feature of the pooling layer.
During the training process of FCNN, the cross-entropy loss function shown by Equation (3) was used to calculate the errors in the forward and backward propagation processes, as given below:
L = 1 N n c = 1 Q y n c log ( p n c ) ,
where ync represents the symbolic function (0 or 1). If the true class of sample n is equal to c, its value is 1; otherwise, its value is 0. The number of classes is represented by Q, pnc represents the probability that the observed sample n is predicted to belong to class c, and N represents the number of samples.
In summary, the overall signal processing workflow is shown as follows: signal acquisition—feature extraction—FCNN algorithm recognition (Figure 4)—algorithm training—algorithm testing, providing the predicted results of the switch opening and closing status.

5. Results and Discussion

5.1. Evaluation Indicators

In this study, detection accuracy, precision, recall, F1 and calculation time are used to evaluate the algorithm performance. The detection results of the open/closed state of the switch can be grouped into opening (P) samples and closing (N) samples. If the detection result is p and the real value is also p, it is called a true positive (TP). If the detection result is p and the real value is n, it is called a false positive. Conversely, if the detection result and the real value are both n, it is called a true negative. If the recognition result is n and the true value is p, it is a false negative (FN).
A = 1 I i = 1 I A i ,
A i = T P i T P i + F N i ,
In the above equations, A represents the detection accuracy, TPi represents the number of TP samples, FNi represents the number of FN samples and Ai represents the detection accuracy of class i.
The F1 value is a comprehensive evaluation indicator, which is defined as the weighted harmonic mean of precision C and recall R.
F = ( a 2 + 1 ) × C × R a 2 ( C + R ) ,
where a is a parameter. When a is given a value of 1, the corresponding F1 value can be obtained.

5.2. Analysis of Results

The proposed FCNN model was verified using the experimental data. The model was tested separately on the datasets with and without artificial noise, and then further tested on the combination of the two datasets. Subsequently, the test results were analyzed. Details of the analysis and the conclusions obtained are provided below:

5.2.1. Feature Distribution

Taking vibration sensor 3 (393B12) as an example, Figure 5 and Figure 6 show the frequency spectra of the sensor output signals obtained without background noise and in the presence of thunderstorm noise, respectively. It can be seen that irrespective of whether the thunderstorm noise is added or not, there is a salient difference (e.g., the signals in red box) between the frequency domain information of the opening and closing states of the switch, which is conducive to the accurate detection of the two states.
The data acquired in feature extraction normally have high dimensionality, which can reach thousands or even tens of thousands of dimensions, making it impossible to classify and identify features. Therefore, it is necessary to reduce the number of feature dimensions or the dimensions of the acquired data. We performed KPCA on the vibration signals obtained under all possible combinations of the GIS switch state, i.e., open and closed, and noise conditions, i.e., thunderstorm noise and no noise. Figure 7 shows the feature distributions of the four vibration sensors obtained from the KPCA analysis. The following observations can be made:
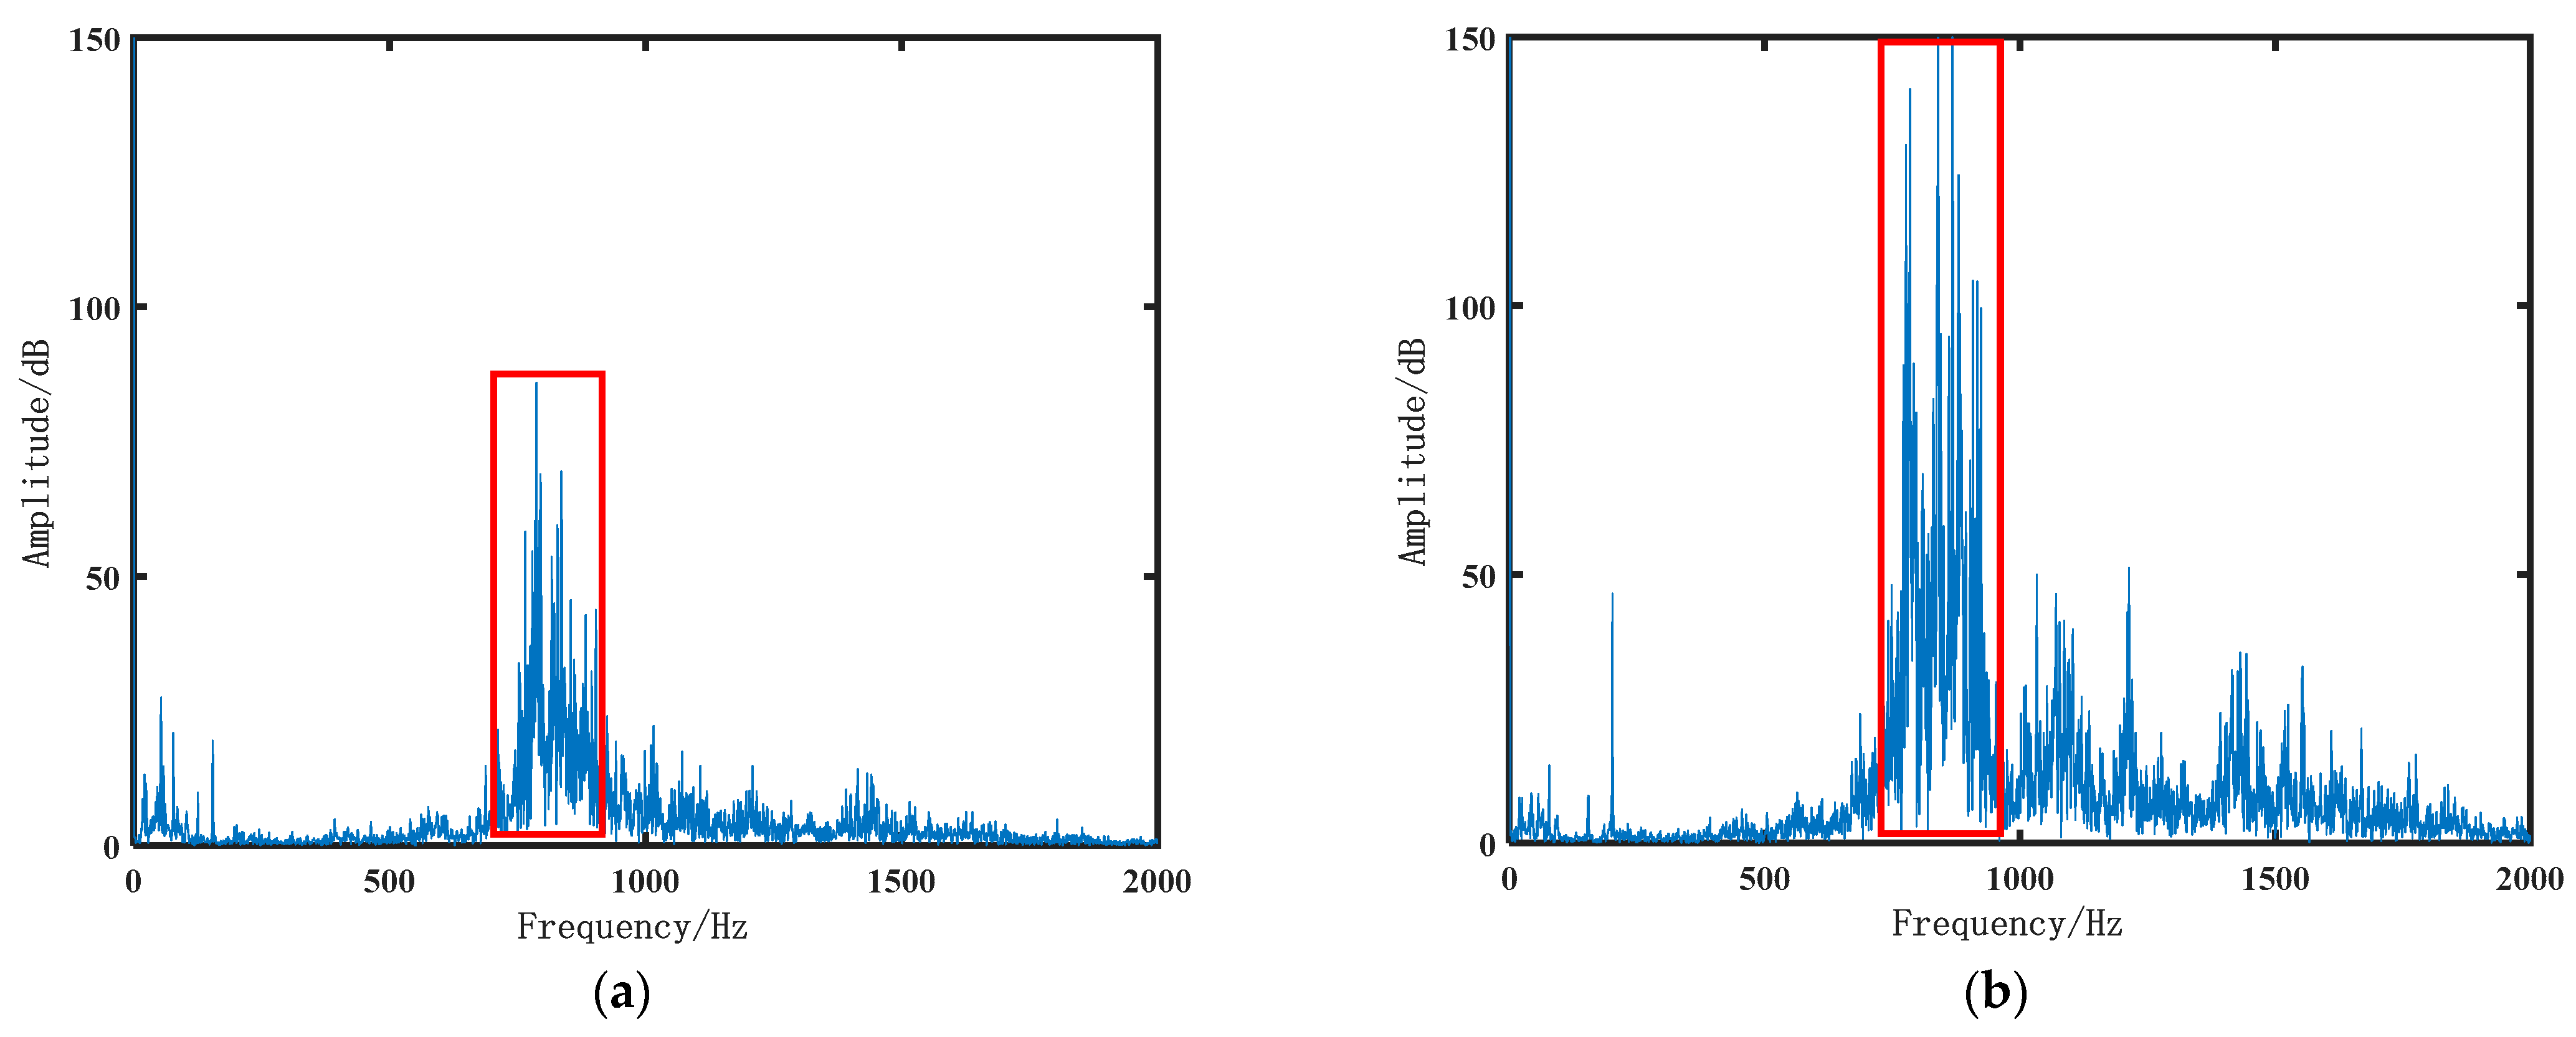
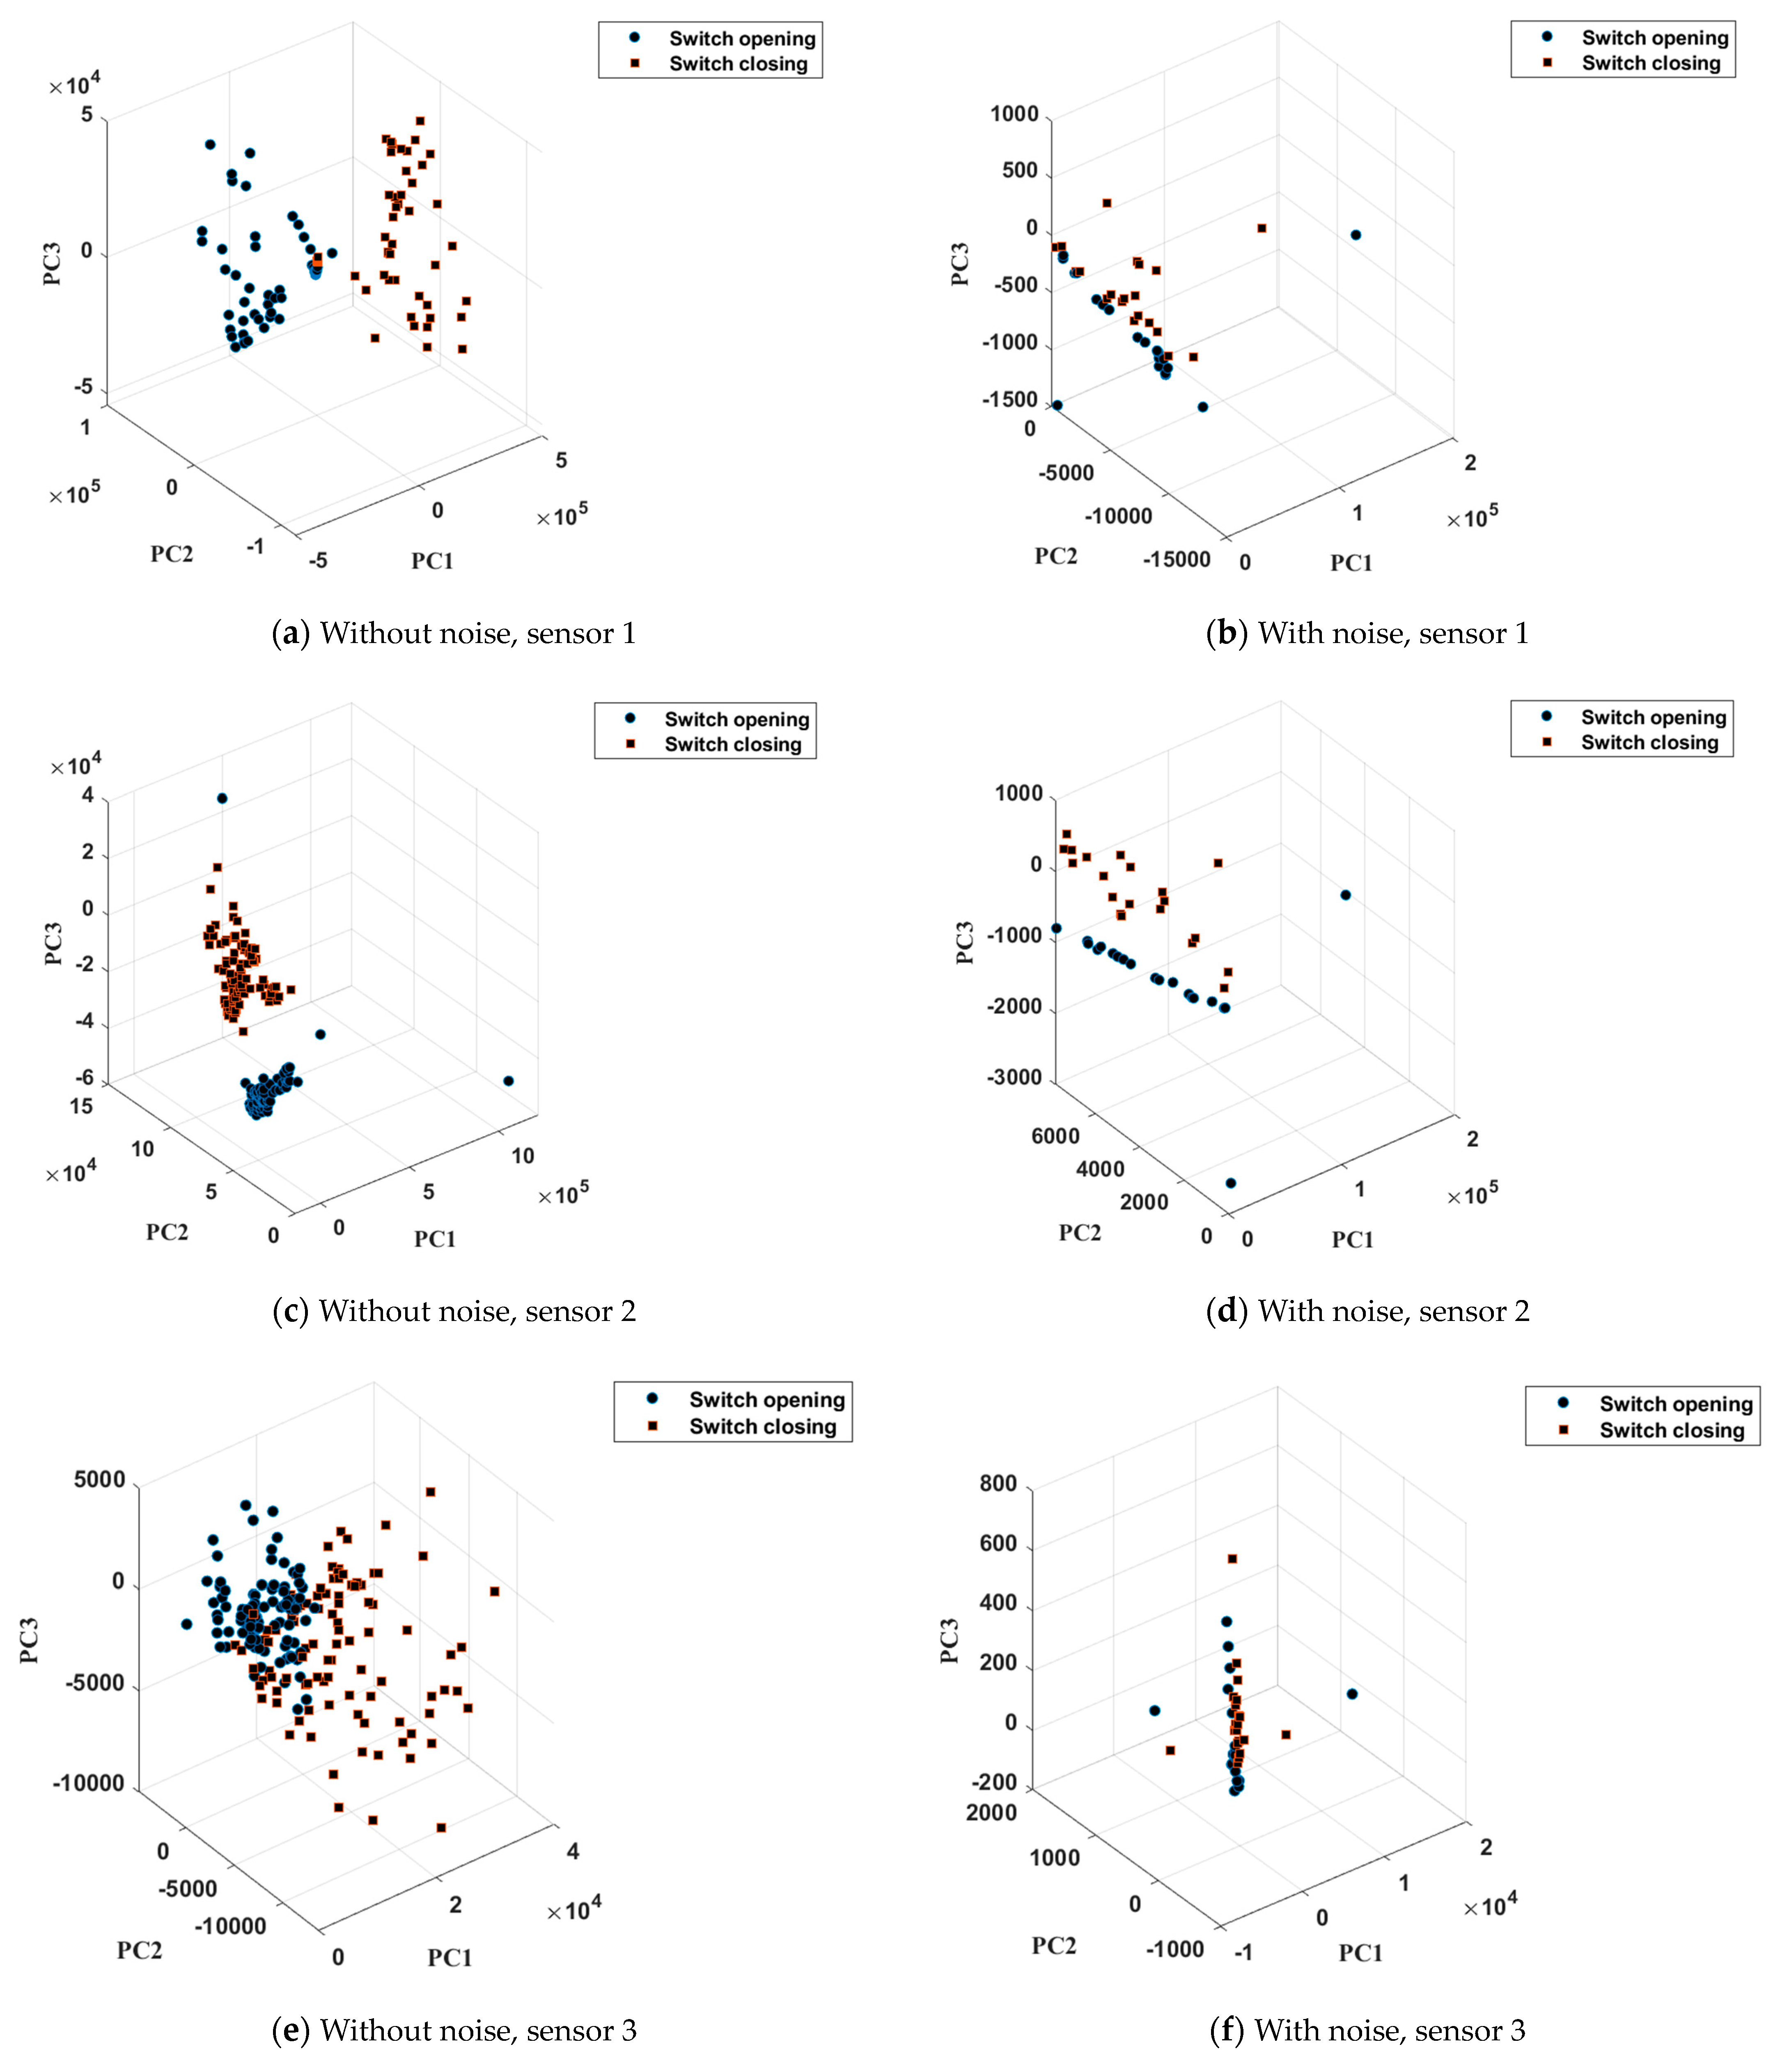
  • When there is no thunderstorm noise (Figure 7a), the KPCA feature distributions of the closed and open states of the switch exhibit a low level of overlapping. When the thunderstorm noise is introduced (Figure 7b), the overlapping level increases significantly, which presents a considerable challenge to the subsequent detection algorithm.
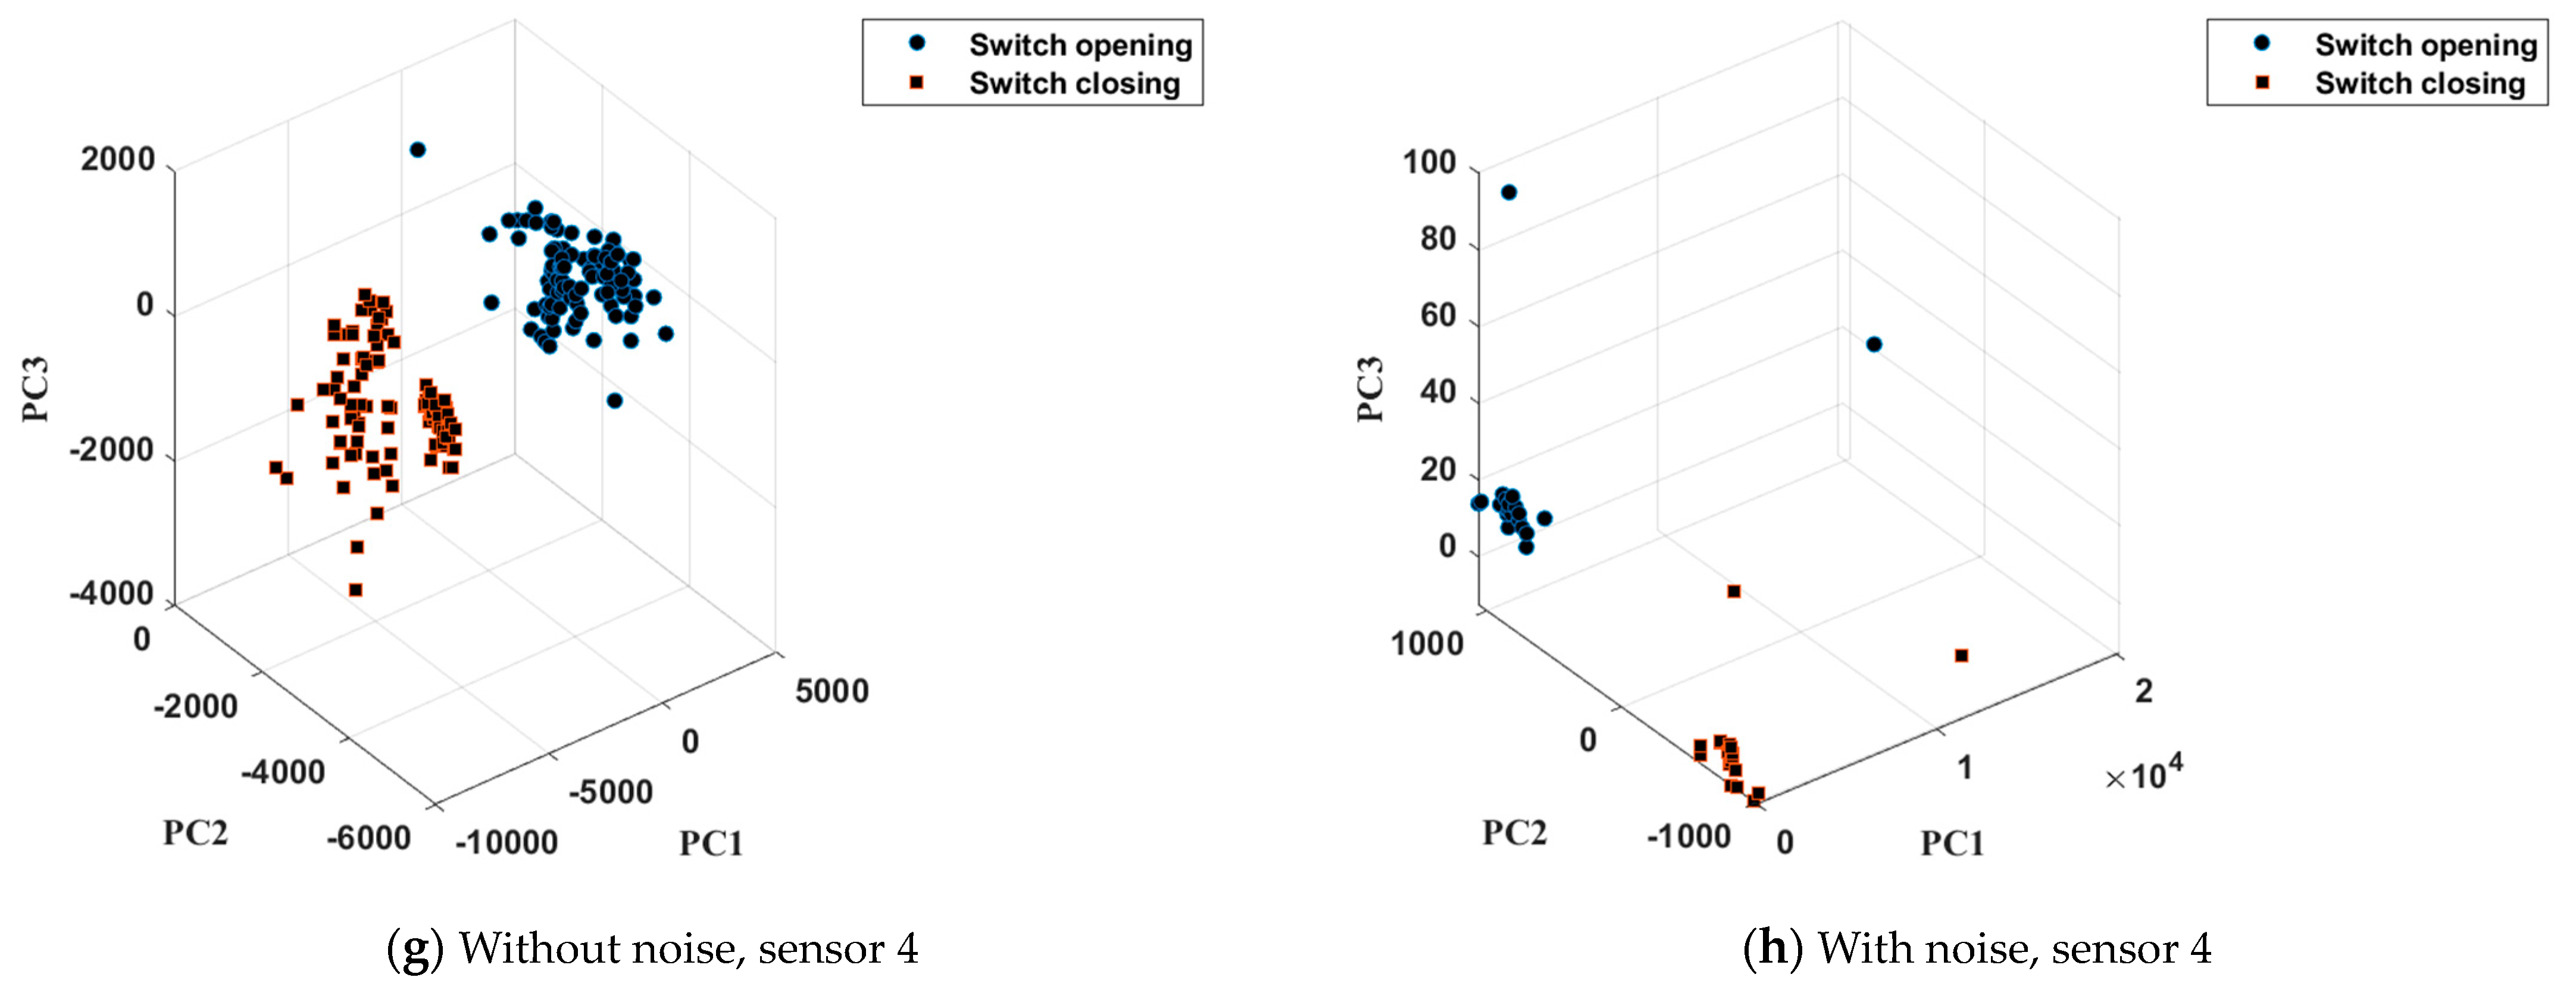
  • It can be observed from Figure 7c,d,g,h that irrespective of the presence of noise, the feature distribution overlapping levels of some vibration sensors are not very high. This behavior indicates that thunderstorm noise has a minor influence on the vibration signals at some sensing points.
  • The feature distribution overlapping level of sensor 3 (Figure 7e,f) is relatively high; therefore, the data acquired by this sensor can be discarded when evaluating the switch state.

5.2.2. Detection Result Analysis

Pattern recognition is a type of signal processing following signal preprocessing or feature extraction. In this study, the proposed FCNN algorithm is compared with five classical algorithms, namely, SVM, decision tree (DT), naive Bayes (NB), k-NN and extreme learning machine (ELM), in order to study the detection problems for each switch state.
We took some steps to make it easy for the algorithms to simultaneously deal with the dataset with noise, the dataset without noise and the mixed dataset. We selected 40 samples from the dataset with noise and 40 samples from the dataset without noise, where each sample group contained 20 samples from the closed switch state and 20 samples from the open switch state. We also made sure that the ratio of the data volume of the training samples to that of the test samples was 1:1. Table 1 (average result of 20 runs) compares the performance levels of the selected algorithms for detecting the closed/open state of switch. It can be observed that the proposed FCNN algorithm achieved 100% detection accuracy on all datasets. It is worth noting that the proposed FCNN algorithm required 21 ms to process the dataset with noise and the dataset without noise, and 26 ms to process the mixed dataset, which is obviously superior to other detection algorithms. This test result proves that the proposed FCNN algorithm can achieve high detection accuracy and efficiency on different datasets, and is adaptive to various datasets.
As shown in this study, the proposed FCNN algorithm could quickly reduce the data feature dimensions and effectively extract useful information automatically at the same time, which improved the accuracy of vibration-based detection of the switch state. Compared with the classical SVM, DT, NB, k-NN and ELM networks, the FCNN algorithm could recognize the switch state faster, improving the identification speed without sacrificing detection accuracy. In summary, the preliminary research in this study demonstrates that it is feasible to realize fast and accurate detection of the open/closed state of the GIS switch by introducing deep learning methods to analyze the vibration signal of the GIS shell.

5.3. Discussion

5.3.1. Discussion of Potential Limitations or Challenges in Implementing This Method in Real-World GIS Systems

Compared to technologies such as images and microswitches, vibration detection technology does not require the GIS to cooperate with power outages, which does not affect the normal operation and maintenance of GIS equipment and is not easily affected by environmental factors such as weather. In addition, the installation difficulty of the vibration detection system is relatively small. Therefore, it is our preliminary belief that vibration detection technology has relatively good scalability or robustness to different operating conditions. However, the limitations of the vibration detection system include the large volume of the equipment and the need for sufficient installation space.
Moreover, for vibration detection, potential noise sources include the interferences of vehicles on the road, thunder and on-site construction noise. Such noise may interfere with the vibration signals, which will be investigated in the next stage.

5.3.2. Discussion of Appling the Proposed Method in Real-World Applications

In order to apply the vibration detection system and the proposed method towards real-world applications, the following tasks need to be completed: (1) Building a vibration detection software and hardware system; (2) Embedding the designed recognition algorithm into the vibration detection system to achieve online detection and processing of vibration signals; (3) Developing an online debugging system, including software, hardware, and algorithm parameters; (4) Uploading the recognition results in real-time to the server. Note: the above operations do not require GIS equipment to be powered off.

6. Conclusions

In this study, a method for detecting the closed/open state of a GIS switch based on deep-learning-assisted analysis of the vibration signal of a GIS shell was introduced. An FCNN algorithm was proposed and verified. Compared with the traditional methods that relied on extracted signal features to determine the switch state, the proposed method could automatically extract the signal features and effectively reduce the feature dimensions. This improved the efficiency and accuracy of the switch state detection. An experimental dataset was constructed using experimental data obtained in the presence and absence of artificial noise. The proposed FCNN method was tested on the experimental dataset along with several other comparison methods. The experimental results showed that the proposed neural network outperformed the SVM, DT, NB, k-NN and ELM methods in terms of detection efficiency and accuracy, which verified its excellent performance in detecting the switch state. The high performance in detection accuracy and efficiency signified that the proposed FCNN method could be used in embedded vibration detection systems.
In the future, we will (1) further improve the FCNN algorithm and compare it with existing deep learning methods; (2) increase noise to verify the proposed method and promote the designed vibration detection system in practice.

Author Contributions

Conceptualization, K.Z. and Y.Z.; methodology, J.W.; software, Z.L.; validation, Y.Z.; formal analysis, Z.L.; investigation, K.Z.; resources, Y.Z.; data curation, Z.L.; writing—original draft preparation, K.Z.; writing—review and editing, K.Z.; visualization, J.W.; project administration, K.Z. All authors have read and agreed to the published version of the manuscript.

Funding

This research received no external funding.

Data Availability Statement

This review has no information related to it.

Conflicts of Interest

The authors declare no conflict of interest.

References

  1. Wang, C. Research on GIS mechanical fault vibration detection technology. Intern. Combust. Engine Parts 2020, 6, 139–140. [Google Scholar]
  2. Yang, Z.; Xing, J.; Gao, Y.; Chen, B. Research on the characteristics and detection system of abnormal noise and vibration signals of GIS equipment. J. Shandong Ind. Technol. 2015, 21, 216–218. [Google Scholar]
  3. Liu, Y.; Yang, J.G.; Jia, Y.Y.; Song, S.; Wu, B.; Li, J. Connection state diagnosis method of GIS disconnector based on mechanical vibration. High Volt. Eng. 2019, 45, 1591–1599. [Google Scholar]
  4. Ohshita, Y.; Hashimoto, A.; Kurosawa, Y. A diagnostic-technique to detect abnormal conditions of contacts measuring vibrations in metal enclosures of gas insulated switchgear. IEEE Trans. Power Deliv. 1989, 4, 2090–2094. [Google Scholar] [CrossRef]
  5. Feng, J.Z.; Sun, L.X.; Chen, W.W.; Su, Y.; Shu, Y.; Zhao, L. Vibration characteristics of GIS isolating switch under different operating conditions. High Volt. Eng. 2021, 47, 4314–4322. [Google Scholar]
  6. Wang, B.Z.; Jiang, Y.Z.; Wen, C. Method for breaking-closing position discrimination of isolation switch based on generative adversarial network and its application. Smart Power 2019, 47, 77–84. [Google Scholar]
  7. Wen, F.; Han, C.; Zhao, W.H.; Ji, K.; Chu, Z. Design of GIS switch state detection system based on wireless power transfer. Energy Rep. 2021, 7, 561–566. [Google Scholar] [CrossRef]
  8. Zhao, W.H.; Wen, F.; Han, C.; Chu, Z.; Yao, Q.; Ji, K. Development of GIS switch state judgment system based on image recognition. In Proceedings of the International Conference on Electron Devices and Applications, Nanjing, China, 14–16 August 2021. [Google Scholar]
  9. Chen, F.G.; Cai, M.; Yin, J.H.; Wang, C.Z.; E, S.P. Design and implementation of disconnect switch position monitoring system based on attitude sensor. Instrum. Tech. Sens. 2019, 3, 101–105. [Google Scholar]
  10. Luo, Y.L.; Wang, G.; Wang, B.Z. Identification method of opening and closing position of intelligent disconnector based on microswitch technology. Electr. Eng. 2021, 13, 129–130, 133. [Google Scholar]
  11. Liao, J.; Li, W.; Deng, W.; Liu, C.; Zhu, C.H.; Huang, J.A. Experimental study on mechanical action characteristics of GIS circuit breaker under double terminal grounding condition. Energy Rep. 2021, 7, 561–566. [Google Scholar]
  12. Wang, Z.Z.; Chen, G.; Zhang, J.B.; Huang, Q.; Ye, J.; Jiang, Y. Research and design of online monitoring device for operating state of GIS isolating switch operationg mechanism. In Proceedings of the IEEE 5th Conference on Energy Internet and Energy System Integration (EI2), Taiyuan, China, 22–24 October 2021. [Google Scholar]
  13. Ding, D.W.; He, L.; Long, W. Analysis on vibration mechanisms and detection diagnosis technology of GIS in operating condition. High Volt. Appar. 2019, 55, 93–99. [Google Scholar]
  14. Ding, C.; Peng, Q.; Yu, D.Q.; Ma, J.; Xu, F.; Xuan, J.; Wang, F. Condition monitoring of GIS for flexible multi-state switch based on SWT-KPCA. In Proceedings of the 17th Annual Conference of China Electrotechnical Society, Beijing, China, 17–18 September 2022. [Google Scholar]
  15. Hu, K.; Cui, W.; Chen, M.Y.; Shen, Q.; Li, S. GIS switch state detection based on coupling current and heterogeneous information fusion. In Proceedings of the IEEE 3rd International Conference on Power, Electronics and Computer Applications, Shenyang, China, 29–31 January 2023. [Google Scholar]
  16. Zhang, L.; Qu, B.; Wang, Y.N. GIS shell vibration mechanism and partial discharge optimization diagnosis. Electr. Power 2022, 55, 80–86. [Google Scholar]
  17. Zang, X.; Ma, H.Z.; Wu, J.L. Analysis and diagnosis of a GIS bus conductor loosening based on mechanical vibration. Power Syst. Prot. Control 2021, 49, 12–20. [Google Scholar]
  18. Huang, Q.; Wei, X.; Xu, J.G.; Zhou, Z.C. Research of GIS bus loose contact fault diagnosis techniques based on mechanical vibration. High Volt. Appar. 2017, 53, 99–104, 108. [Google Scholar]
  19. Ma, B.; Wu, X.T.; Li, X.G. Contact status live detection of GIS disconnector based on vibration signal. Smart Power 2019, 47, 73–77. [Google Scholar]
  20. Zhong, Y.; Hao, J.; Liao, R.J.; Wang, X.; Jiang, X.; Wang, F. Mechanical defect identification for gas-insulated switchgear equipment based on time-frequency vibration signal analysis. High Volt. 2020, 6, 531–542. [Google Scholar] [CrossRef]
  21. Qi, W.D.; Niu, B.; Hu, D.G.; Wu, B.; Li, J.; Chu, L.; Li, Y.; Fu, G. Research on Vibration Simulation of GIS Horizontal Bus Shell Based on Finite Element Method. High Volt. Appar. 2018, 54, 46–52. [Google Scholar]
  22. Ye, Z.; Yu, J.B. Deep morphological convolutional network for feature learning of vibration signals and its applications to gearbox fault diagnosis. Mech. Syst. Signal Process. 2021, 161, 107984. [Google Scholar] [CrossRef]
  23. Jia, Y.C.; Li, G.L.; Dong, X.; He, K. A novel denoising method for vibration signal of hob spindle based on EEMD and grey theory. Measurement 2021, 169, 108490. [Google Scholar] [CrossRef]
  24. Lim, D.H.; Kim, K.S. Development of deep learning-based detection technology for vortex-induced vibration of a ship’s propeller. J. Sound Vib. Vol. 2022, 520, 116629. [Google Scholar] [CrossRef]
  25. Pratap, A.; Sardana, N.; Utomo, S.; Ayeelyan, J.; Karthikeyan, P.; Hsiung, P.-A. A synergic approach of deep learning towards digital additive manufacturing: A review. Algorithms 2022, 15, 466. [Google Scholar] [CrossRef]
  26. Pratap, A.; Sardana, N.; Utomo, S.; John, A.; Karthikeyan, P.; Hsiung, P.A. Analysis of defect associated with powder bed fusion with deep learning and explainable AI. In Proceedings of the 2023 15th International Conference on Knowledge and Smart Technology (KST), Phuket, Thailand, 21–24 February 2023; pp. 1–6. [Google Scholar]
  27. Adimoolam, M.; Mohan, S.; Srivastava, G. A novel technique to detect and track multiple objects in dynamic video surveillance systems. Int. J. Interact. Multimed. Artif. Intell. 2022, 7, 112–120. [Google Scholar] [CrossRef]
  28. Wang, H.; Liu, Z.L.; Peng, D.D.; Cheng, Z. Attention-guided joint learning CNN with noise robustness for bearing fault diagnosis and vibration signal denoising. ISA Trans. 2022, 128, 470–484. [Google Scholar] [CrossRef]
  29. Wang, Y.; Yang, M.M.; Li, Y.; Xu, Z.; Wang, J.; Fang, X. A multi-input and multi-task convolutional neural network for fault diagnosis based on bearing bibration signal. IEEE Sens. J. 2021, 21, 20892477. [Google Scholar]
  30. Rauber, T.W.; Loca, A.L.d.S.; Boldt, F.d.A.; Rodrigues, A.L.; Varejão, F.M. An experimental methodology to evaluate machine learning methods for fault diagnosis based on vibration signals. Expert Syst. Appl. 2021, 167, 114022. [Google Scholar] [CrossRef]
Figure 1. Photos of vibration detection system.
Electronics 12 03204 g001
Figure 2. Block diagram of the vibration detection system.
Electronics 12 03204 g002
Figure 3. Sampling settings.
Electronics 12 03204 g003aElectronics 12 03204 g003b
Figure 4. Block diagram of the FCNN method.
Electronics 12 03204 g004
Figure 5. The spectrum of vibration signal obtained without background noise: (a) switch closing process; (b) switch opening process.
Electronics 12 03204 g005
Figure 6. The spectrum of vibration signal obtained in the presence of thunderstorm noise: (a) switch closing process; (b) switch opening process.
Electronics 12 03204 g006
Figure 7. Feature distributions of vibration signal without noise and with thunderstorm noise.
Electronics 12 03204 g007aElectronics 12 03204 g007b
Table 1. Comparison of various methods for detecting closed/open switch state.
DatasetDetection
Methods
Detection
Accuracy (%)
Precision
(%)
Recall (%)F1(%)Calculation
Time (ms)
Dataset without noiseFCNN10010010010021
SVM100100100100192
DT1001001001001489
NB10010010010038
k-NN10010010010025
ELM100100100100138
Dataset with thunderstorm noise backgroundFCNN10010010010021
SVM100100100100192
DT1001001001001489
NB959595.595.238
k-NN80.680.980.380.625
ELM90909090138
Mixed vibration datasetFCNN10010010010026
SVM100100100100227
DT1001001001001649
NB9594.8395.595.241
k-NN10010010010029
ELM100100100100159
Disclaimer/Publisher’s Note: The statements, opinions and data contained in all publications are solely those of the individual author(s) and contributor(s) and not of MDPI and/or the editor(s). MDPI and/or the editor(s) disclaim responsibility for any injury to people or property resulting from any ideas, methods, instructions or products referred to in the content.

