Article

Digital Twin 3D System for Power Maintenance Vehicles Based on UWB and Deep Learning

1
Sichuan Key Laboratory of Artificial Intelligence, Sichuan University of Science and Engineering, Yibin 644002, China
2
School of Mechanical and Electrical Engineering, Xichang University, Xichang 615000, China
3
International Joint Research Center for Robotics and Intelligence System of Sichuan Province, Chengdu University of Information Technology, Chengdu 610225, China
*
Authors to whom correspondence should be addressed.
Electronics 2023, 12(14), 3151; https://doi.org/10.3390/electronics12143151
Submission received: 18 June 2023 / Revised: 14 July 2023 / Accepted: 14 July 2023 / Published: 20 July 2023
(This article belongs to the Special Issue Advances in Computer Vision and Deep Learning and Its Applications)

Abstract

:
To address the issue of the insufficient safety monitoring of power maintenance vehicles during power operations, this study proposes a vehicle monitoring scheme based on ultra wideband (UWB) and deep learning. The UWB localization algorithm employs Chaotic Particle Swarm Optimization (CSPO) to optimize the Time Difference of Arrival (TDOA)/Angle of Arrival (AOA) locating scheme in order to overcome the adverse effects of the non-visual distance and multipath effects in substations and significantly improve the positioning accuracy of vehicles. To solve the problem of the a large aspect ratio and the angle in the process of power maintenance vehicle operation situational awareness in the mechanical arm of the maintenance vehicle, the arm recognition network is based on the You Only Look Once version 5 (YOLOv5) and modified by Convolutional Block Attention Module (CBAM). The long-edge definition method with circular smoothing label, SIoU loss function, and HardSwish activation function enhance the precision and processing speed for the arm state. The experimental results show that the proposed CPSO-TDOA/AOA outperforms other algorithms in localization accuracy and effectively attenuates the non-visual distance and multipath effects. The recognition accuracy of the YOLOv5-CSL-CBAM network is substantially improved; the mAP value of the vehicles arm reaches 85.04%. The detection speed meets the real-time requirement, and the digital twin of the maintenance vehicle is effectively realized in the 3D substation model.

1. Introduction

Irregular operations and a lack of safety awareness are the primary causes of safety accidents. With the rapid development of artificial intelligence, machine vision and wireless positioning technology have been effectively applied to the monitoring system, enabling object recognition, tracking, and safety warning.
Deep learning object recognition networks are currently a popular research topic and are widely employed in intelligent monitoring systems. Recognition networks can generally be classified into two categories: two-stage and single-stage targets. The two-stage [1] network achieves object detection via region box selection and position regression, which obtains high accuracy through tedious calculations and time consumption. For instance, Li et al. [2] used fast R-CNN to improve the detection of pedestrians and He et al. [3] used Mask R-CNN to enhance the detection of rail transit obstacles. Single-stage [4] networks directly extract the features by regression strategies and determine the location of the target. The representative algorithms are YOLO [5,6,7,8], RFBNet [9], and SSD [10,11,12,13]. In application, Lu [14] presented a method for detecting pedestrians using multiscale convolutional features and a three-layer pyramidal network to enhance pedestrian-target detection accuracy. Meanwhile, Lin [15] introduced a multi-scale feature cross-layer to improve YOLOv5 and enable the accurate identification of ultra-small targets in remote sensing images. Lin [16] proposed a traffic sign detection approach that utilized a lightweight multiscale feature fusion network, which significantly enhanced the detection performance of small targets and delivered better real-time results. Yang [17] proposed a YOLO network target tracking algorithm based on multi-feature fusion to track and localize operators’ helmets. Recently, Huang [18] utilized Alphapose with ResNet to achieve dressing detection for power operators, which can play a vital role in regulating their attire.
Ultra Wide Band (UWB) positioning technology [19] utilizes high-frequency radio pulses for triangulation positioning. It has the advantages of high accuracy, strong anti-interference performance, stable performance, and low energy consumption. Therefore, it is a popular choice for object positioning, indoor navigation, tracking, and surveillance applications. Lin [20] proposed a drift-free visual SLAM technique for mobile robot localization by integrating UWB, which resulted in a significant reduction in the overall drift error of robot navigation. Li [21] proposed a pseudo-GPS positioning system for underground coal mines consisting of noisy UWB ranging to achieve robust and accurate positioning estimation for CMR applications. Lee [22] proposed a marker-based hybrid indoor positioning system (HIPS) that performs hybrid positioning by using marker images and inertial measurement unit data from smartphones, enabling accurate navigation in subways.
The positioning of power maintenance vehicles and the state of the crank arm are the main causes of safety accidents. Vehicle supervision relies on manual monitoring, and the application of intelligent technology in vehicle monitoring is insufficient. Therefore, improving vehicle monitoring by utilizing deep learning techniques and wireless positioning technologies is an urgent problem.
This paper utilizes UWB to renew the location information of the power maintenance vehicle in a three-dimensional model of the substation and to determine whether they are within a prohibited area. Additionally, deep learning is employed to evaluate the arm status of the vehicle in a safe area, thus creating a digital twin of the vehicle in the three-dimensional substation model and facilitating safety monitoring. The innovative work of this paper is as follows:
  • A chaotic particle swarm optimization TDOA/AOA algorithm is proposed to improve the TDOA/AOA method in order to find the optimal method and improve positioning accuracy with less UWB stations and antennas.
  • An improved YOLOv5 state recognition network for vehicle arms has been designed. We used a long-edge definition method (LDM) and a circular smoothing labeling (CSL) complex model to achieve state recognition of rotating arms. Additionally, we introduced a CBAM attention mechanism to enhance feature extraction of the network, while employing the SIoU loss function to reduce loss value and enhance the nonlinear segmentation ability of the network. Comparative experimental results demonstrate the superiority of our method in achieving state-of-the-art performance.
  • A three-dimensional digital twin monitoring system is designed; the location of the vehicle and status of the arm are live updated in the twin monitoring system.

2. Digital Twinning Route

The three-dimensional model of a substation and vehicle is modeled and depicted in Figure 1. The UWB and deep learning methods are employed separately to locate the vehicle in the operational setting and evaluate the status of its arm. Virtual vehicle real-time update via the location and status information in the 3D model. The overall route of the system is shown in Figure 2.

2.1. CPSO + TDOA/AOA Algorithm

In UWB, the TDOA/AOA algorithm can improve the localization accuracy with less base stations. It measures AOA parameters at the base station and TDOA parameters at the mobile target to estimate target localization. Although positioning results can be obtained by using only two base stations in the unobstructed environment, actual environments are affected by non-line-of-sight propagation, multipath, and geometric accuracy, which can cause location errors. To improve the positioning accuracy, this paper adopts chaotic particle swarm algorithm to increase precision of TDOA/AOA.
Chaotic Particle Swarm Optimization (CPSO) is a combination of chaotic optimization algorithm (COA) and particle swarm algorithm (PSA). CPSO can enhance the search ability of particles and avoids falling into local optimal solutions. The proposed composite scheme TDOA/AOA with CPSO optimizing is depicted in Figure 3.
When the particles of the traditional particle swarm algorithm search in a complex environment, the flight directions all point to the global optimal solution. When one of the particles finds a local optimal solution during the flight, the search speed of the remaining particles will largely slow down to zero, causing the particles to fall into the local optimal solution, i.e., premature defects. The Chaotic Particle Swarm Optimization (CPSO) algorithm is a combination of chaotic optimization and particle swarm algorithm. Chaotic optimization has the characteristics of randomness and convenience, which can enhance the search ability of particles for targets at any position in space and avoid the algorithm optimization process to fall into local optimal solutions.
There are various chaos models, mainly Logistic mapping model, the Henon mapping model, and the Lorenz mapping model. Among them, the Logistic mapping model has a simple structure and better ergodicity compared to other mapping models, and the Logistic mapping model is used as the chaos model in this paper. The logistic mapping model is
Z i + 1 = μ Z i ( 1 Z i ) i = 0 , 1 , 2 , .
where μ ( 2 , 4 ] is the control parameter and the value of μ is proportional to the chaotic occupancy ratio. Z i ( 0 , 1 ) is the chaotic domain, capable of generating chaotic sequences Z 1 , Z 2 ,…, Z n .
The iterative processes of the particle swarm algorithm to find the optimal solution and the global optimal solution are
V i k = ω V i k 1 + c 1 r 1 ( P b i X i k 1 ) + c 2 r 2 ( G b i X i k 1 ) ,
X i k = X i k 1 + V i k 1 .
In Equations (2) and (3), i = 1 , 2 , , N , N is the number of particles in the particle swarm. As the value of N increases, the optimization ability of the algorithm gradually improves, but when the value of N exceeds a certain threshold, the optimization ability no longer improves and consumes more time. k is the number of current update iterations. ω is the inertia weight coefficient, and the value of ω is isotropically correlated with the global search ability of the particle and anisotropically correlated with the local search ability, which is usually performed by the dynamic ω method. c 1 and c 2 are learning factors, highlighting the proportion of “self-cognition” and “social experience” of particles. Usually, c 1 = c 2 [ 0 , 4 ] . When c 1 = 0 the group diversity of the algorithm disappears and the algorithm will fall into the local optimal solution. When c 2 = 0 , there is no information exchange between particles in the algorithm, and the convergence rate of the algorithm decreases. r 1 , r 2 are random numbers in the range [ 0 , 1 ] . P b i is the individual optimal position of the i-th particle, G b i is the global optimal position of the particle population at the k − 1th iteration, and V i k and X i k are the velocity and position of particle i at the k-th iteration, respectively.
The iterative process of the CPSO is based on the particle swarm algorithm and is implemented as follows:
Firstly, related parameters are initialized and processed. r 1 and r 2 of Equation (2) are set random values. The initial velocity and direction of each particle are irregular, some positions will be missed in the search process, which cannot ensure ergodicity and diversity. CPSO performs a chaotic mapping of the velocities and positions of each particle in the initial stage, replacing r 1 and r 2 with the chaotic sequence formed by Equation (1) to enhance to steadily search for the global optimal solution.
Secondly, update the particle parameters. According to Equation (3), the velocity and position vector of each particle are updated iteratively, and the range of velocity is [ V min , V max ] , and the positions are [ x min , x max ] and [ y min , y max ] . The inertia weighting factor ω is set dynamically. It is
ω = ω max k ( ω max ω min ) k max .
where ω max and ω min represent the maximum and minimum weight coefficients, respectively, and k and k max represent the current and maximum number of update iterations, respectively.
Thirdly, the fitness of each particle is calculated. The CPSO provides the search direction for the particles by fitness function, and the value of the fitness is anisotropically related to the particles to the function. In this paper, the fitness function is designed using the target coordinates to be measured, and its expressions is
F i t n e s s ( x , y ) = [ ( d i 1 d i + d 1 ) T ( d i 1 d i + d 1 ) + σ ε 2 n β 2 ( β arctan ( y y 1 x x 1 ) ) 2 ]
where i = 2 , 3 , 4 N , d i 1 denotes the distance difference between the target MS ( x , y ) to be located and the base station B S i and B S 1 , d i denotes the positioning distance error, n β denotes the AOA measurement noise, β is the observation angle between B S 1 and MS, σ ε 2 is the variance of the AOA view measurement error.
Fourthly, the value of the historical fitness is updated, and it is judged whether the particle with updated fitness is in stagnation. If the particle is in stagnation, its chaotic perturbation is performed using Equation (1).
Finally, when the number of iterations reaches the maximum, the global optimal position G b corresponding to the smallest value of the fitness function is determined as the optimal solution optimized by the algorithm. Otherwise, return to the second step and continue the iterations.

2.2. YOLOv5-CSL for Vehicle Arm Recognition

A novel YOLOv5-based network for vehicle arms recognition is proposed. The network uses long-edge definition method (LDM) and circular smooth label (CSL) to reduce cross loss. HardSwish is implanted in the convolutional layer to improve the feature extraction capability and CBAM built to improve recognition accuracy of the network.

2.2.1. YOLOv5-CSL with Attention Mechanism

The proposed network adopts R-YOLOv5 as backbone network to detect vehicle arm and calculate arm angle. The structure of modified R-YOLOv5 is presented in Figure 4.
Where BottleneckCSP1_X: CSP1_X structure, BottleneckCSP2_X: CSP2_X structure, SPPF: fast spatial pyramid pooling module, Upsample: upsampling module, Concat: connection module, Conv: convolution module, Backbone: backbone network, Neck: bottleneck network, Prediction: prediction module, CBAM: attention mechanism module.
The Backbone consists of the backbone network CSPDarkNet and the spatial pyramid pooling SPPF for feature extraction. CSP1_X is applied to CSPDarkNet to enhance the feature extraction ability of images. Compared with SPP, SPPF adds two CBS modules to enhance the training efficiency of the network. The structures are presented in Figure 5 and Figure 6.
Where Conv: convolution module, BN: Batch Normalization structure, SiLU: activation function, Resunit: residual module; add: tensor summation, Concat: tensor stitching, CBS: consists of a two-dimensional convolution layer + a Bn layer + a SiLU activation function.
Where MaxPool: maximum pooling, Cancat: tensor stitching, CBS: consists of a 2D convolutional layer + a Bn layer + a SiLU activation function.
The Neck part consists of a feature pyramid network and a discriminator. cSP2_X can enhance the feature fusion capability and make the network extract more detailed features, and the structure is shown in Figure 7. The prediction part implements the object detection function for three scales: large, medium, and small. The YOLOv5 network adds 180 angle classification channels in the prediction part to accomplish prediction of object rotation angle.
Where CBS: composed of a 2D convolutional layer + a BN layer + a SiLU activation function, Concat: tensor stitching.
The hybrid attention mechanism (CBAM) is a hybrid attention mechanism that combines both channel attention and spatial attention, which is typically represented by the convolutional block attention module [23]; the network structure is shown in Figure 8.
The channel attention module (CAM) performs pooling operation and compression in spatial dimensions on the feature map F1 extracted from the backbone network to obtain two dimensional 1 × 1 × C feature matrices, and then inputs them sequentially into the Multi-Layer Perceptron [24] (MLP) network, which is processed by the MLP network, and then inputs the Sigmoid activation function to acquire the channel attention module associated feature parameter Mc. Finally, Mc is dotted with the feature map F1 to output the feature map Fc of the CAM.
The spatial attention module (SAM) takes Fc as the new input feature map, pools it and obtains two feature matrices with same channel, then splices them in channel order to receive a new feature matrix, convolves them and inputs them into the Sigmoid activation function to obtain the relevant feature parameters Ms of the SAM. Finally, Ms is then combined with the feature map F2 and outputs the feature map of the whole CBAM by performing the corresponding operation.
The CBAM integrates the advantages of CAM and SAM, focuses on both channel features and spatial features, enhances the attention to important channels and focal regions of images, and improves the feature expression capability of the network. CAM and SAM in CBAM are both lightweight modules with fewer internal convolution operations, which reduce the computational effort and improve the performance of the network with a small increase in the number of network parameters.

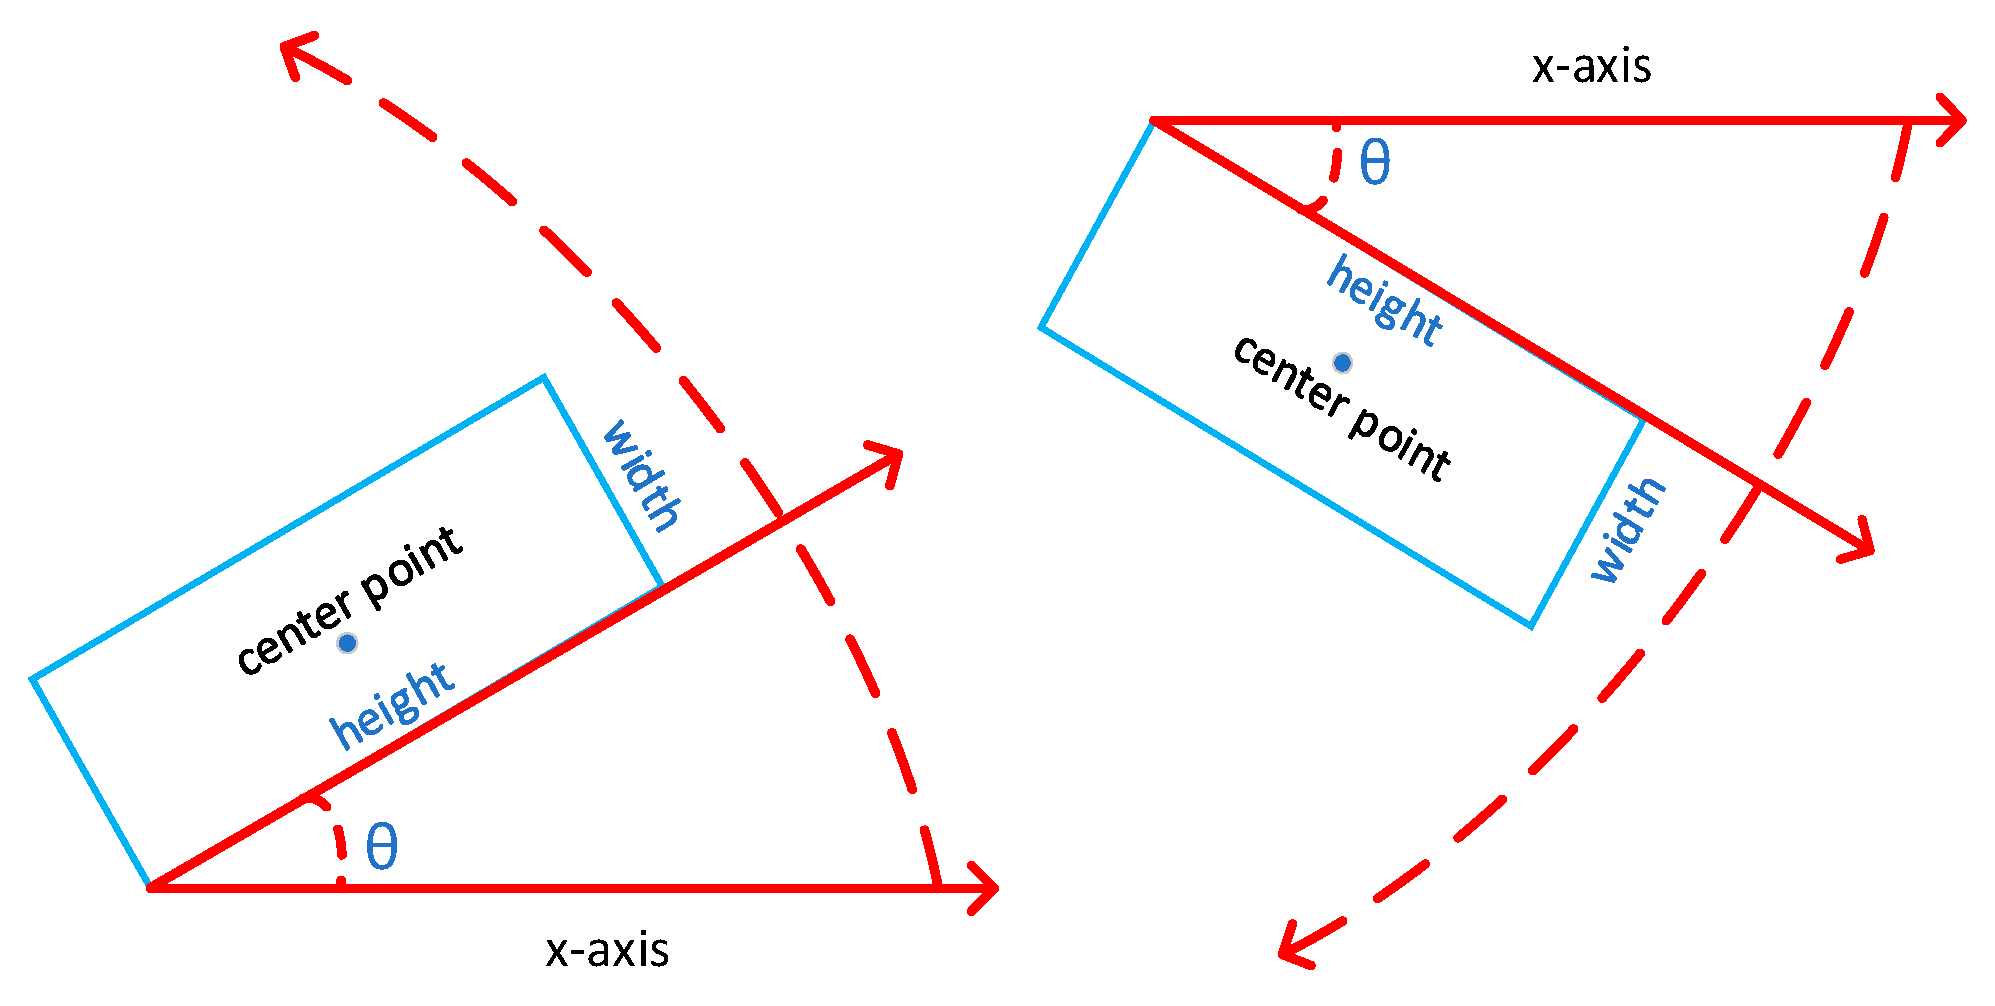
2.2.2. Long-Edge Definition Method with Circular Smoothing Label

The vehicle arm has a large aspect ratio and multiple rotation angle. Data labeling with the rotating method can reduce the redundant information, improve the detection accuracy, and increase training efficiency of the network; however, Exchangability of Edges (EoE) [25] and Periodicity of Angle (PoA) [26] problems occur during network training to reduce recognition accuracy.
In this study, we adopted a combination of LDM and CSL to solve the boundary problem of θ. Where LDM tackles the edge variation problem, and CSL settles the angle period problem.
LDM is a five-parameter labeling method, which is a novel angle definition method and avoids the edge exchangeability. LDM describes target as ([x, y, w, h, θ]), (x, y) is the rectangular center coordinate of the rotated box, w and h are the width and length of the rectangular box, respectively. θ is the angle between the length and the x-axis, where θ ∈ [−90°,90°). The LDM is demonstrated in Figure 9:
LDM can eliminate EoE. CSL transforms the regression problem of θ into a classification problem, divides angles in different ranges and categories, and discretizes the continuous problem to avoid PoA. However, the discretization process inevitably generates an accuracy loss. To evaluate the loss, the maximum loss and the average loss of accuracy (obeying uniform distribution) are calculated by the following formula:
M a x ( l o s s ) = ω / 2 ,
E ( l o s s ) = a b x × 1 b a d x = 0 ω / 2 x × 1 ω / 2 0 d x = ω / 4 .
where ω is the width of the rectangular box and the values of a, b are in the interval [ π 2 , π 2 ] .
The minimum precision of angle range is 1°, and the maximum loss and expected loss were separately set to 0.50 and 0.25. When two rotating rectangular frames with a 1:9 aspect ratio were used for the test, the intersection ratio of the two rotating rectangular frames decreased by 0.05 and 0.02, the accuracy loss of the method can be acceptable.
In order to make the classification, loss can be used to predict the distance between the result and the angle label, a One-hot coding method was designed, assuming that the real angle label is 0°, and the accuracy loss values were the same when the angle alter 1° to 90°. The One-hot coding method is in Figure 10. Based on One-hot label, CSL was introduced, and the CSL is presented in Figure 11.
The expressions for CSL are
C S L ( x ) = { g ( x ) θ r < x < θ + r 0 o t h e r w i s e ,
s . t . { g ( x ) = g ( x + k T ) , k N 0 g ( θ + ε ) = g ( θ ε ) 1 , | ε | < r 0 g ( θ ± ε ) g ( θ ± ς ) 1 , | ς | < | ε | < r g ( θ ) = 1 .
where g(x) is the window function with periodicity, monotonicity and symmetry. The radius r determines the size of the window. In this study, the Gaussian function is used as the window function with a radius of 6. The functional expression of g(x) is as following:
g ( x ) = a e ( x b ) 2 2 c 2 .
where a, b, and c are constants, and in this paper, a is set to 1, b to 0, c to 4, and x is the angle parameter.

2.2.3. HardSwish Convolution Module

In YOLOv5 network, Leaky ReLU and SiLU are frequently used activation functions. Leaky ReLU is updated form of Rectified Linear Unit (ReLU), which introduces a fixed slope to solve the problem of fixed parameters caused by Dead ReLU, but its performance is unstable. Sigmoid-weighted Linear Unit (SiLU) and HardSwish are other forms of Swish activation function. Swish function has no maximum value but a minimum value with smoothness and non-monotonicity. Its functions are
S w i s h ( x ) = x S i g m o i d ( β x ) ,
S i g m o i d ( β x ) = 1 1 + exp ( β x ) .
When the β is 1, the Swish function becomes the SiLU function, and it has better performance and effect than the Leaky ReLU.
HardSwish uses a strong nonlinear function and improves the accuracy of Swish. It is
H a r d S w i s h ( x ) = { 0 x 3 x x 3 x ( x + 3 ) 6 o t h e r s .
HardSwish has a stronger nonlinear capability. The SiLU of R-YOLOv5 is replaced by the HardSwish, and the improved network structure is shown in Figure 12.

3. Maintenance Vehicle State Identification and Three-Dimensional Reproduction

3.1. CPSO + TDOA/AOA Positioning Experiment

Taylor [27], Chan [28], TDOA/AOA [29], and PSO + TDOA/AOA [30] algorithms were utilized to conduct experimental comparisons. As presented in Figure 13, the experimental and computational results were compared in different environments, including various stations, communication radii, and AOA measurement errors.
The results of using the positioning algorithm designed in this paper to locate the power maintenance vehicle in the three-dimensional model of the substation with UWB positioning equipment are shown in Figure 14. Figure 14a,b represent the positioning results of the power maintenance vehicle at different operating positions, and it can be seen from the figures that the algorithm designed in this paper can accurately locate the maintenance vehicle.

3.2. Experiment of Crank Arm State Recognition

3.2.1. Experimental Environment and Evaluation Criteria

The experimental platform is PyCharm and Microsoft visual studio 2017, the computer operating system is Windows 10, the graphics card model is a NVIDIA TITAN XP with 12 G of video memory, and the deep learning framework is Pytorch.
Objective evaluation index the average precision (AP) of a single category, the mean average precision (mAP), Frames Per Second (FPS), and error detection rate (EDR) are used to evaluate metrics for model evaluation.

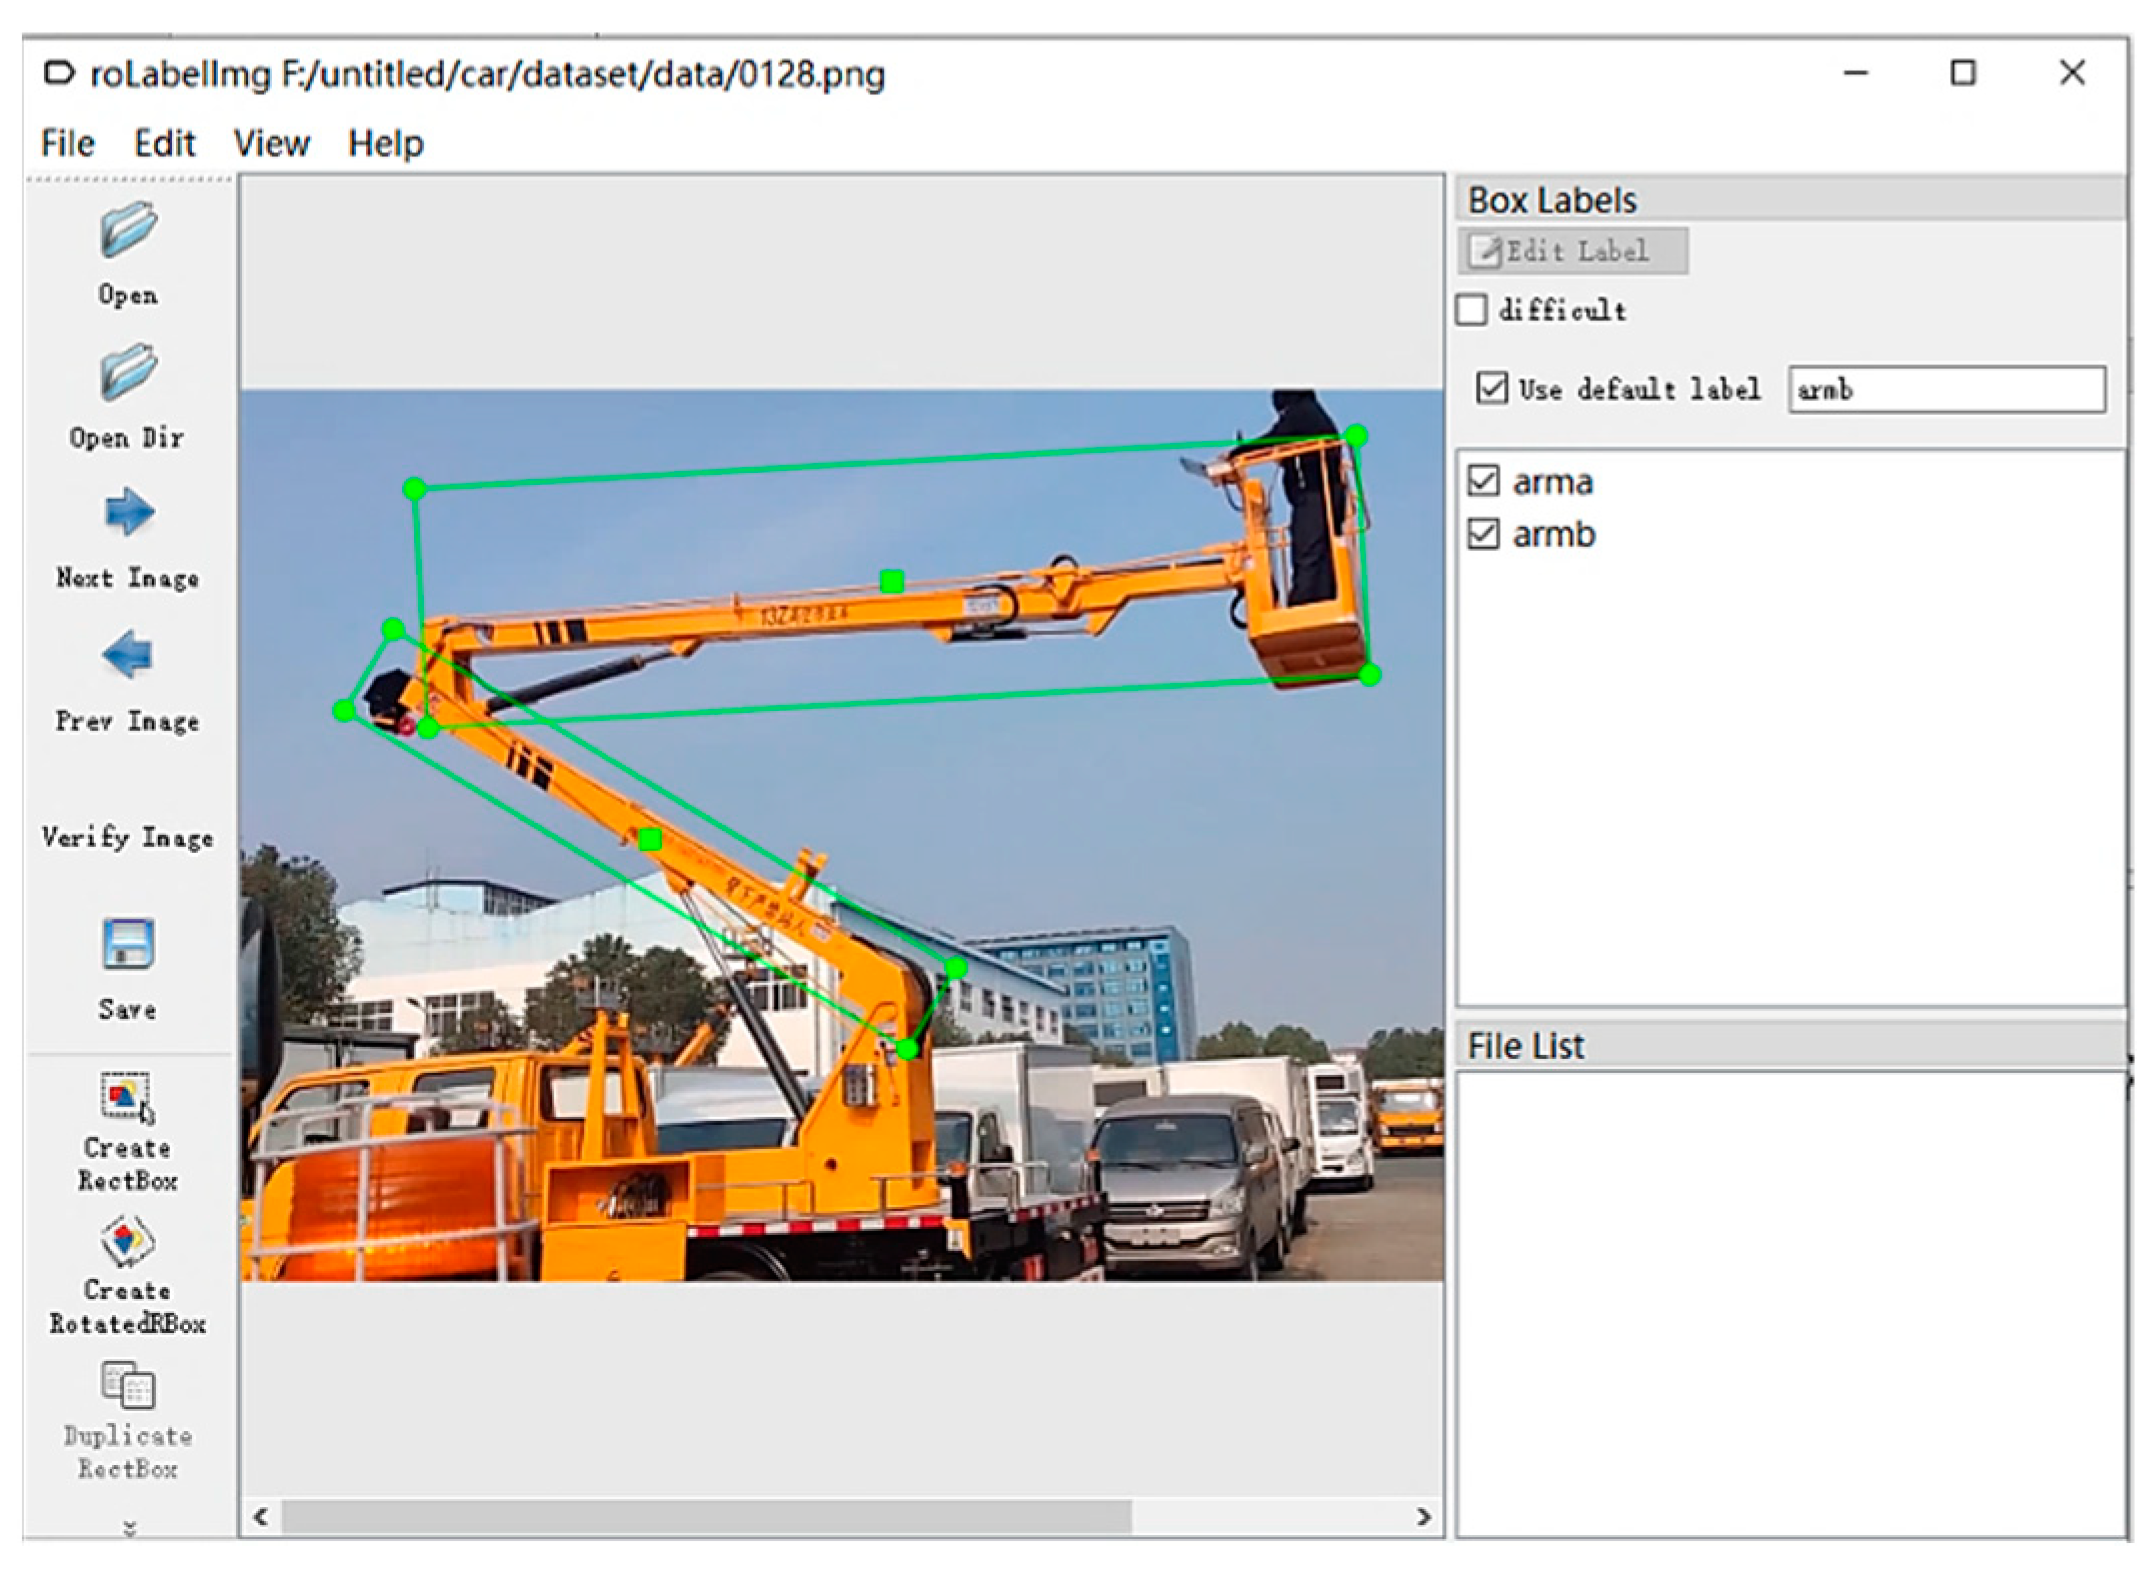
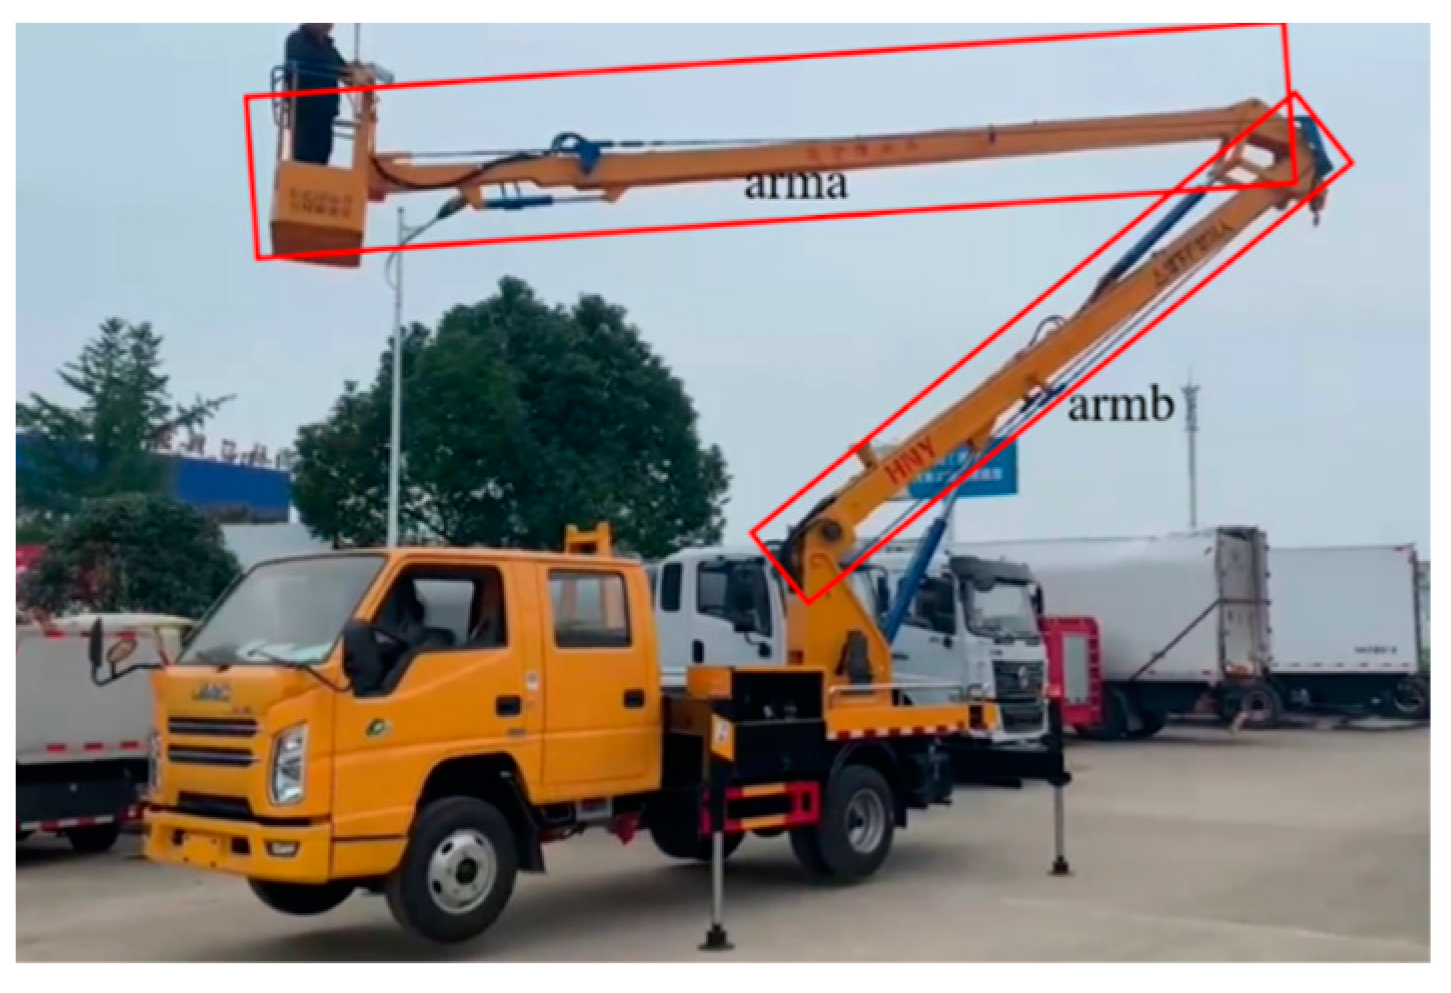
3.2.2. Experimental Data and Data Processing

We did not find any publicly available data sets related to the power maintenance vehicle after reviewing the relevant literature, so this paper uses a homemade dataset approach for the experiments. Firstly, the robotic arms of the power maintenance vehicle are calibrated in categories, and the upper and lower robotic arms are calibrated as arma and armb, respectively, as shown in Figure 15.
Since the rotating target detection algorithm used in this paper refers to the target detection algorithm in the field of remote sensing, the homemade dataset format refers to the annotation format of the remote sensing target detection dataset DOTA, and the RoLableImg annotation software is used to annotate the mechanical arm of the power maintenance vehicle in the dataset, and the annotation process is described in Figure 16.
The labeled results are saved and an .xml file is generated, which contains information about the position of the rotated rectangular box, converting the .xml file into a .txt file in the Dataset for Object Detection (DOTA) dataset.
In this paper, the homemade dataset has a total of 1200 images of curved-arm power maintenance vehicles, and the training set, validation set, and test set are set according to the ratio of 4:1:1. In the process of training a convolutional neural network, if the number of samples in the training set is small, the model obtained from the network training is largely poorly generalized. Therefore, although the sample numbers of category arma and armb in the dataset are basically in equilibrium, in order to enhance the diversity of the dataset and prevent the overfitting problem caused by too little data, we augmented the training and validation sets in the dataset by enlarging, cropping, and adjusting the contrast of the original images, thereby increasing the diversity of the dataset. The numbers of training set and validation set images before enhancement are 800 and 200, respectively, and the numbers of training set and validation set images after enhancement are 2979 and 762, respectively, and the enhanced images are presented in Figure 17.

3.2.3. Experimental Pretreatment

During training, the size of the input image was set to 608 × 608, the training period was 300 epochs, the initial value of the learning rate was 0.001, the optimizer selects Adam, the number of images per batch iteration batch size was setup to 16, the angle loss parameter angle loss was 0.8, angle BCELoss positive weight was set to 1.0. The confidence value threshold was 0.55 for all the inferred images for the experimental algorithm, and the IoU threshold was 0.45 for the NMS operation.

3.2.4. Experimental Comparison

YOLOv5-CSL-CBAM to perform the recognition. The trained network models are used for recognizing arms, and the resulting experimental data results are shown in Table 1.
In experiments, the upper and lower vehicle arms were calibrated as arma and armb. Table 1 shows that YOLOv5-CSL-CBAM has higher AP values for target arma and armb, with 89.88% and 80.20%, respectively, its mAP value is higher than R-Faster-RCNN, R-Reppoints, RoI Transformer, R-YOLOv5-Based, and R-YOLOv7-based by 5.86%, 9.39%, 4.10%, 5.03%, and 1.03%. This suggests that YOLOv5-CSL-CBAM has the best recognition performance for vehicle arm. By examining the parameter quantities of each network in Table 1, it becomes clear that YOLOv5-CSL-CBAM’s parameter quantity is 35.2 MB. Compared to R-YOLOv5-Based network, there is a slight increase in the parameter quantities, yet its complexity is lower than R-YOLOv7-based network. The network’s detection accuracy has improved, and the inference speed has reached 32.8 FPS, which is sufficient for real-time detection.
The error detection rate of YOLOv5-CSL-CBAM is 13.6%, whereas the compared networks have an error detection rate of more than 50%. Therefore, based on the above data, it is evident that the proposed YOLOv5 vehicle arm state recognition network can accurately recognize vehicle arms in substations and fulfill the demands of real-time detection.

3.2.5. Ablation Experiments

To further validate the efficiency of our proposed network, we performed ablation experiments to analyze the longitudinal performance. We pruned and modified the model using HardSwish, resulting in R-YOLOv5-HardSwish, employed SIoU loss function to produce R-YOLOv5-SIoU and integrated CBAM attention mechanism to create R-YOLOv5-CBAM. Table 2 presents the findings of these ablation experiments.
It shows that the R-YOLOv5-HardSwish network improved by 4.15% compared to the original network, indicating that the HardSwish can enhance the network’s nonlinearity. SIoU loss function can lessen the network training loss values and improve network performance, resulting in mAP of R-YOLOv5-SIoU increased by 4.85%. By introducing CBAM into the original network, the AP values of the arms in the R-YOLOv5-CBAM network, respectively, increased by 9.24% and 0.51%, while the mAP increased by 4.87%, indicating that CBAM can effectively extract image feature information and upgrade the network’s feature extraction capability. Compared to the original network, the mAP value of YOLOv5-CSL-CBAM increased by 5.03%. Thus, we can conclude that the YOLOv5-CSL-CBAM network designed in this paper can accurately detect vehicle arms.

3.3. Vehicle Arm Angle Measurement

To further test the recognition accuracy of vehicle arm angle, the RoLableImg annotation software was used to annotate the vehicle arm, and the vehicle arm angles are predicted by different network models. One of the test pictures is shown in Figure 18 and prediction results are presented in Table 3.
It is starkly reflected in Table 3, where the average error of the vehicle arm angle is 0.5 predicted by YOLOv5-CSL-CBAM. Compared with other networks, the angle prediction error is reduced by 0.5, 0.5, 4.5, 8.5, and 6.5, respectively. These findings demonstrate that the proposed network achieves the highest prediction accuracy.

3.4. Three-Dimensional Twin Implementation of the Vehicle

The vehicle safety operation monitoring and twin system consists of server, cameras, UWB base stations, and tags. In Figure 19, the cameras are applied to obtain images of the vehicle operation. The UWB achieved the location of the vehicle. In the 3D scene, the server completes the real-time presentation of the location and arm state of vehicle.
In the 3D model of the substation, the results of the positioning of the CPSO + TDOA/AOA method are in Figure 20. From the figure, it can be seen that the positioning algorithm designed in this paper achieves the real-time and accurate presentation of the position information of the vehicle. Figure 20a shows the result of the initial position positioning of the power maintenance vehicle, and Figure 20b shows the positioning result map after the vehicle position is changed and updated in real time in the 3D twin system.
In order to verify the reconfiguration of the power maintenance vehicle in the substation 3D model, the updated results of the operation status of the power maintenance vehicle in the substation 3D model in the actual power operation scenario are shown in Figure 21. Figure 21a shows the actual scene diagram of the operation process of the maintenance vehicle, and Figure 21b shows the updated results of the operation status of the maintenance vehicle in the 3D model.
As can be seen from Figure 21, the power maintenance vehicle in the actual operation power operation scene can realize the operation state update in the substation 3D model, and the operation state of the maintenance vehicle in the actual operation power operation scene and the substation 3D model is more matching. Therefore, the algorithm proposed in this paper successfully realizes the real-time twinning of vehicles in the 3D system.

4. Conclusions

This paper introduces a safety monitoring and digital twin scheme for power maintenance vehicles. The scheme employs UWB technology to acquire vehicle position information and machine vision technology to recognize the arm state of the vehicle, then update the status of vehicles in a 3D scene with the acquired information. In the locating algorithm, CPSO was applied to optimize global search for the initial position of the target and eliminate interference problems in the TDOA/AOA algorithm and improve positioning accuracy. CSL, HardSwish, and CBAM models are applied to YOLOv5 network to increase the accuracy of vehicle arm status. In the substation three-dimensional model, the status of virtual vehicle is real-time update and safety monitored.

5. Discussion

Our designed positioning algorithm and robotic arm state recognition algorithm have better positioning effect and recognition effect. However, there are still some shortcomings in the process of monitoring the operation safety of the electric power maintenance vehicle. Although the detection of the mechanical arm state recognition network of the electric power maintenance vehicle is more accurate and the detection speed can meet the requirements of real-time detection, there is still a large space for improving the detection speed. In the future, the network can be considered for light weight processing to further improve the detection speed while maintaining the detection accuracy.

Author Contributions

M.C. conceived the algorithmic model of this paper, wrote part of it, and conducted comparison experiments with representative algorithms and performed data analysis. T.L. conducted the ablation experiments and analyzed the data. J.Z. determined the research direction and wrote some of the content. X.X. wrote some chapters and made the final revisions. F.L. created the figures and performed the paper search. All authors have read and agreed to the published version of the manuscript.

Funding

This research was funded by Natural Science Foundation of Sichuan, China (2023NSFSC1987, 2022ZHCG0035); The Key Laboratory of Internet Information Retrieval of Hainan Province Research Found (2022KY03); the Opening Project of International Joint Research Center for Robotics and Intelligence System of Sichuan Province (JQZN2022-005); Sichuan University of Science & Engineering Postgraduate Innovation Fund Project, grant number Y2022130.

Institutional Review Board Statement

Not applicable.

Informed Consent Statement

Not applicable.

Data Availability Statement

Data are contained within the article. Our code link is gh repo clone 1997jinsongzhang/CPSO.

Conflicts of Interest

The authors declare no conflict of interest.

References

  1. Liu, C.; Liu, Y.; Zhang, Q.; Li, X.; Wu, T.; Li, Q. A two-stage classification algorithm for radar targets based on compressive detection. EURASIP J. Adv. Signal Process. 2021, 2021, 23. [Google Scholar] [CrossRef]
  2. Li, J.; Liang, X.; Shen, S.; Xu, T.; Feng, J.; Yan, S. Scale-aware fast R-CNN for pedestrian detection. IEEE Trans. Multimed. 2017, 20, 985–996. [Google Scholar] [CrossRef] [Green Version]
  3. He, D.; Qiu, Y.; Miao, J.; Zou, Z.; Li, K.; Ren, C.; Shen, G. Improved Mask R-CNN for obstacle detection of rail transit. Measurement 2022, 190, 110728. [Google Scholar] [CrossRef]
  4. Zhang, K.; Musha, Y.; Si, B. A Rich Feature Fusion Single-Stage Object Detector. IEEE Access 2020, 8, 204352–204359. [Google Scholar] [CrossRef]
  5. Chen, M.; Duan, Z.; Lan, Z.; Yi, S. Scene Reconstruction Algorithm for Unstructured Weak-Texture Regions Based on Stereo Vision. Appl. Sci. 2023, 13, 6407. [Google Scholar] [CrossRef]
  6. Redmon, J.; Farhadi, A. YOLO9000: Better, Faster, Stronger. In Proceedings of the IEEE Conference on Computer Vision & Pattern Recognition, Honolulu, HI, USA, 21–26 July 2017; pp. 6517–6525. [Google Scholar]
  7. Redmon, J.; Farhadi, A. Yolov3: An incremental improvement. In Proceedings of the Computer Vision and Pattern Recognition, Salt Lake City, UT, USA, 18–23 June 2018. [Google Scholar]
  8. Lawal, O.M. YOLOMuskmelon: Quest for Fruit Detection Speed and Accuracy Using Deep Learning. IEEE Access 2021, 9, 15221–15227. [Google Scholar] [CrossRef]
  9. Yuan, Z.; Liu, Z.; Zhu, C.; Qi, J.; Zhao, D. Object Detection in Remote Sensing Images via Multi-Feature Pyramid Network with Receptive Field Block. Remote Sens. 2021, 13, 862. [Google Scholar] [CrossRef]
  10. Liu, W.; Anguelov, D.; Erhan, D.; Szegedy, C.; Reed, S.; Fu, C.Y.; Berg, A.C. Ssd: Single shot multibox detector. In Proceedings of the Computer Vision–ECCV 2016, Amsterdam, The Netherlands, 11–14 October 2016; pp. 21–37. [Google Scholar]
  11. Zhai, S.P.; Shang, D.R.; Wang, S.H.; Dong, S.S. DF-SSD: An Improved SSD Object Detection Algorithm Based on DenseNet and Feature Fusion. IEEE Access 2020, 8, 24344–24357. [Google Scholar] [CrossRef]
  12. Zhou, S.R.; Qiu, J. Enhanced SSD with interactive multi-scale attention features for object detection. Multimed. Tools Appl. 2021, 80, 11539–11556. [Google Scholar] [CrossRef]
  13. Chen, M.; Liu, T.; Xiong, X.; Duan, Z.; Cui, A. A Transformer-Based Cross-Window Aggregated Attentional Image Inpainting Model. Electronics 2023, 12, 2726. [Google Scholar] [CrossRef]
  14. Lu, L.P.; Li, H.S.; Ding, Z.; Guo, Q.M. An improved target detection method based on multiscale features fusion. Microw. Opt. Technol. Lett. 2020, 62, 3051–3059. [Google Scholar] [CrossRef]
  15. Lin, Y.T.; Zhang, J.X.; Huang, J.M. Multiscale feature cross-layer fusion remote sensing target detection method. IET Signal Process. 2023, 17, e12194. [Google Scholar] [CrossRef]
  16. Lin, J.; Bai, D.; Xu, R.; Lin, H. TSBA-YOLO: An Improved Tea Diseases Detection Model Based on Attention Mechanisms and Feature Fusion. Forests 2023, 14, 619. [Google Scholar] [CrossRef]
  17. Yang, B.; Wang, J. An Improved Helmet Detection Algorithm Based on YOLO V4. Int. J. Found. Comput. Sci. 2022, 33, 887–902. [Google Scholar] [CrossRef]
  18. Huang, W.J.; Xu, W.F.; Zhang, C.F.; Dong, C.B.; Wan, L. A Dress Detection Model for Power Construction Personnel Combining Alphapose and ResNet. Power Inf. Commun. Technol. 2022, 20, 8. [Google Scholar]
  19. Hickerson, J.W.; Younkin, J.R. Investigation of the State and Uses of Ultra-Wide-Band Radio-Frequency Identification Technology. In Proceedings of the INMM 51st Annual Meeting, Baltimore, MD, USA, 11–15 July 2010. [Google Scholar]
  20. Lin, H.Y.; Yeh, M.C. Drift-Free Visual SLAM for Mobile Robot Localization by Integrating.UWB Technology. IEEE Access 2022, 10, 93636–93645. [Google Scholar] [CrossRef]
  21. Li, M.G.; Zhu, H.; You, S.Z.; Tang, C.Q. UWB-Based Localization System Aided With Inertial Sensor for Underground Coal Mine Applications. IEEE Sens. J. 2020, 20, 6652–6669. [Google Scholar] [CrossRef]
  22. Lee, G.; Kim, H. A Hybrid Marker-Based Indoor Positioning System for Pedestrian Tracking in Subway Stations. Appl. Sci. 2020, 10, 7421. [Google Scholar] [CrossRef]
  23. Woo, S.; Park, J.; Lee, J.Y.; Kweon, I.S. Cbam: Convolutional block attention module. In Proceedings of the European Conference on Computer Vision, Munich, Germany, 8–14 September 2018; pp. 3–19. [Google Scholar]
  24. Song, H.; Choi, K. Transportation Object Detection with Bag of Visual Words Model by PLSA and MLP. Mob. Netw. Appl. 2018, 23, 1103–1110. [Google Scholar] [CrossRef]
  25. Cai, D.; Campbell, T.; Broderick, T. Edge-exchangeable graphs and sparsity. In Proceedings of the Advances in Neural Information Processing Systems, Barcelona, Spain, 5–10 December 2016. [Google Scholar]
  26. Sridhar, V.V.; Ramaiah, G.K. Analysis of periodicity in angular data: A comprehensive review. J. Stat. Plan. Inference 2014, 145, 8–26. [Google Scholar]
  27. Ren, J.; Huang, S.; Song, W.; Han, J. A Novel Indoor Positioning Algorithm for Wireless Sensor Network Based on Received Signal Strength Indicator Filtering and Improved Taylor Series Expansion. Trait. Du Signal 2019, 36, 103–108. [Google Scholar] [CrossRef] [Green Version]
  28. Hua, C.; Zhao, K.; Dong, D.; Zheng, Z.; Yu, C.; Zhang, Y.; Zhao, T. Multipath Map Method for TDOA Based Indoor Reverse Positioning System with Improved Chan-Taylor Algorithm. Sensors 2020, 20, 3223. [Google Scholar] [CrossRef]
  29. Cao, L.; Chen, H.; Chen, Y.; Yue, Y.; Zhang, X. Bio-Inspired Swarm Intelligence Optimization Algorithm-Aided Hybrid TDOA/AOA-Based Localization. Biomimetics 2023, 8, 186. [Google Scholar] [CrossRef] [PubMed]
  30. Bi, J.; Zhao, M.; Yao, G.; Cao, H.; Feng, Y.; Jiang, H.; Chai, D. PSOSVRPos: WiFi indoor positioning using SVR optimized by PSO. Expert Syst. Appl. 2023, 222, 119778. [Google Scholar] [CrossRef]
Figure 1. Electricity operation scene three-dimensional model. (a) Substation model, (b) 3D model of maintenance vehicle.
Electronics 12 03151 g001
Figure 2. Overall system roadmap.
Electronics 12 03151 g002
Figure 3. Flowchart of chaotic particle swarm optimization location algorithm.
Electronics 12 03151 g003
Figure 4. The structure of YOLOv5-CSL with attention mechanism.
Electronics 12 03151 g004
Figure 5. The structure of CSP1_X.
Electronics 12 03151 g005
Figure 6. The structure of SPPF.
Electronics 12 03151 g006
Figure 7. Schematic diagram of CSP2_X structure.
Electronics 12 03151 g007
Figure 8. CBAM structure diagram.
Electronics 12 03151 g008
Figure 9. Long-side definition method.
Electronics 12 03151 g009
Figure 10. One-hot Lable schematic diagram.
Electronics 12 03151 g010
Figure 11. Circular Smooth Label schematic diagram.
Electronics 12 03151 g011
Figure 12. Schematic diagram of the improved convolution module.
Electronics 12 03151 g012
Figure 13. Influence of various factors. (a) Shows the Root Mean Square Error (RMSE) of different algorithms with different number of base stations within a radius 3000 m. (b) Shows the test results of different algorithms with a radius range of 500 to 3000 m and four base stations. (c) Shows the variance range of TDOA observation error caused by AOA errors of different algorithms under the same experimental conditions. From the figure, it can be seen that the TDOA/AOA optimized by the proposed CPSO has the best performance among all the algorithms.
Electronics 12 03151 g013
Figure 14. Positioning results map. (a,b) represent the results of the positioning of the power maintenance vehicle at different working positions, respectively.
Electronics 12 03151 g014
Figure 15. Mechanical arm calibration diagram.
Electronics 12 03151 g015
Figure 16. Mechanical arm annotation diagram.
Electronics 12 03151 g016
Figure 17. Data enhancement result diagram. (a) Original image, (b,c) Image enhancement.
Electronics 12 03151 g017
Figure 18. Sample Chart of Angle Prediction.
Electronics 12 03151 g018
Figure 19. Electric power maintenance vehicle safety operation monitoring system.
Electronics 12 03151 g019
Figure 20. Positioning result diagram real-time positioning results. (a,b) are the results of the initial position positioning of the maintenance vehicle and the positioning results after the real-time change of the vehicle position in the three-dimensional twin system, respectively.
Electronics 12 03151 g020
Figure 21. Scene diagram of electric power maintenance vehicle. (a,b) are the actual scene diagram of the maintenance vehicle operation process and the update results of the maintenance vehicle operation state in the three-dimensional model.
Electronics 12 03151 g021
Table 1. Horizontal comparison experiment results.
Network ModelAP/%mAP/%Parameters/MBFPSPerror/%
armaarmb
R-Faster-RCNN78.6279.4779.18314.08.638.0
R-Reppoints87.7066.6075.65280.014.174.4
RoI Transformer81.1280.7680.94421.06.259.2
R-YOLOv5-based80.5579.4780.0134.533.221.2
R-YOLOv7-based88.7880.2584.0142.530.512.9
YOLOv5-CSL-CBAM89.8880.2085.0435.232.813.6
Table 2. Ablation experiment results.
Network ModelHardSwishSIoUCBAMAP/%mAP/%
armaarmb
R-YOLOv5-Based×××80.5579.4780.01
R-YOLOv5-HardSwish××89.3079.0184.16
R-YOLOv5-SIoU××89.5080.4184.96
R-YOLOv5-CBAM××89.7979.9884.88
YOLOv5-CSL-CBAM89.8880.2085.04
Table 3. Prediction results from the perspective of each model.
Network Model θ Predicted Value/o θ Prediction Error/o Average Prediction Error/o
θ a r m a θ a r m b Δ θ a r m a Δ θ a r m b
R-Faster-RCNN528597.0
R-Reppoints12532169.0
RoI Transformer845285.0
R-YOLOv5-Based1035021.0
R-YOLOv7-based936111.0
YOLOv5-CSL-CBAM1038010.5
Disclaimer/Publisher’s Note: The statements, opinions and data contained in all publications are solely those of the individual author(s) and contributor(s) and not of MDPI and/or the editor(s). MDPI and/or the editor(s) disclaim responsibility for any injury to people or property resulting from any ideas, methods, instructions or products referred to in the content.

