
ESD-YOLOv5: A Full-Surface Defect Detection Network for Bearing Collars

Abstract
:1. Introduction
- (1)
- (2)
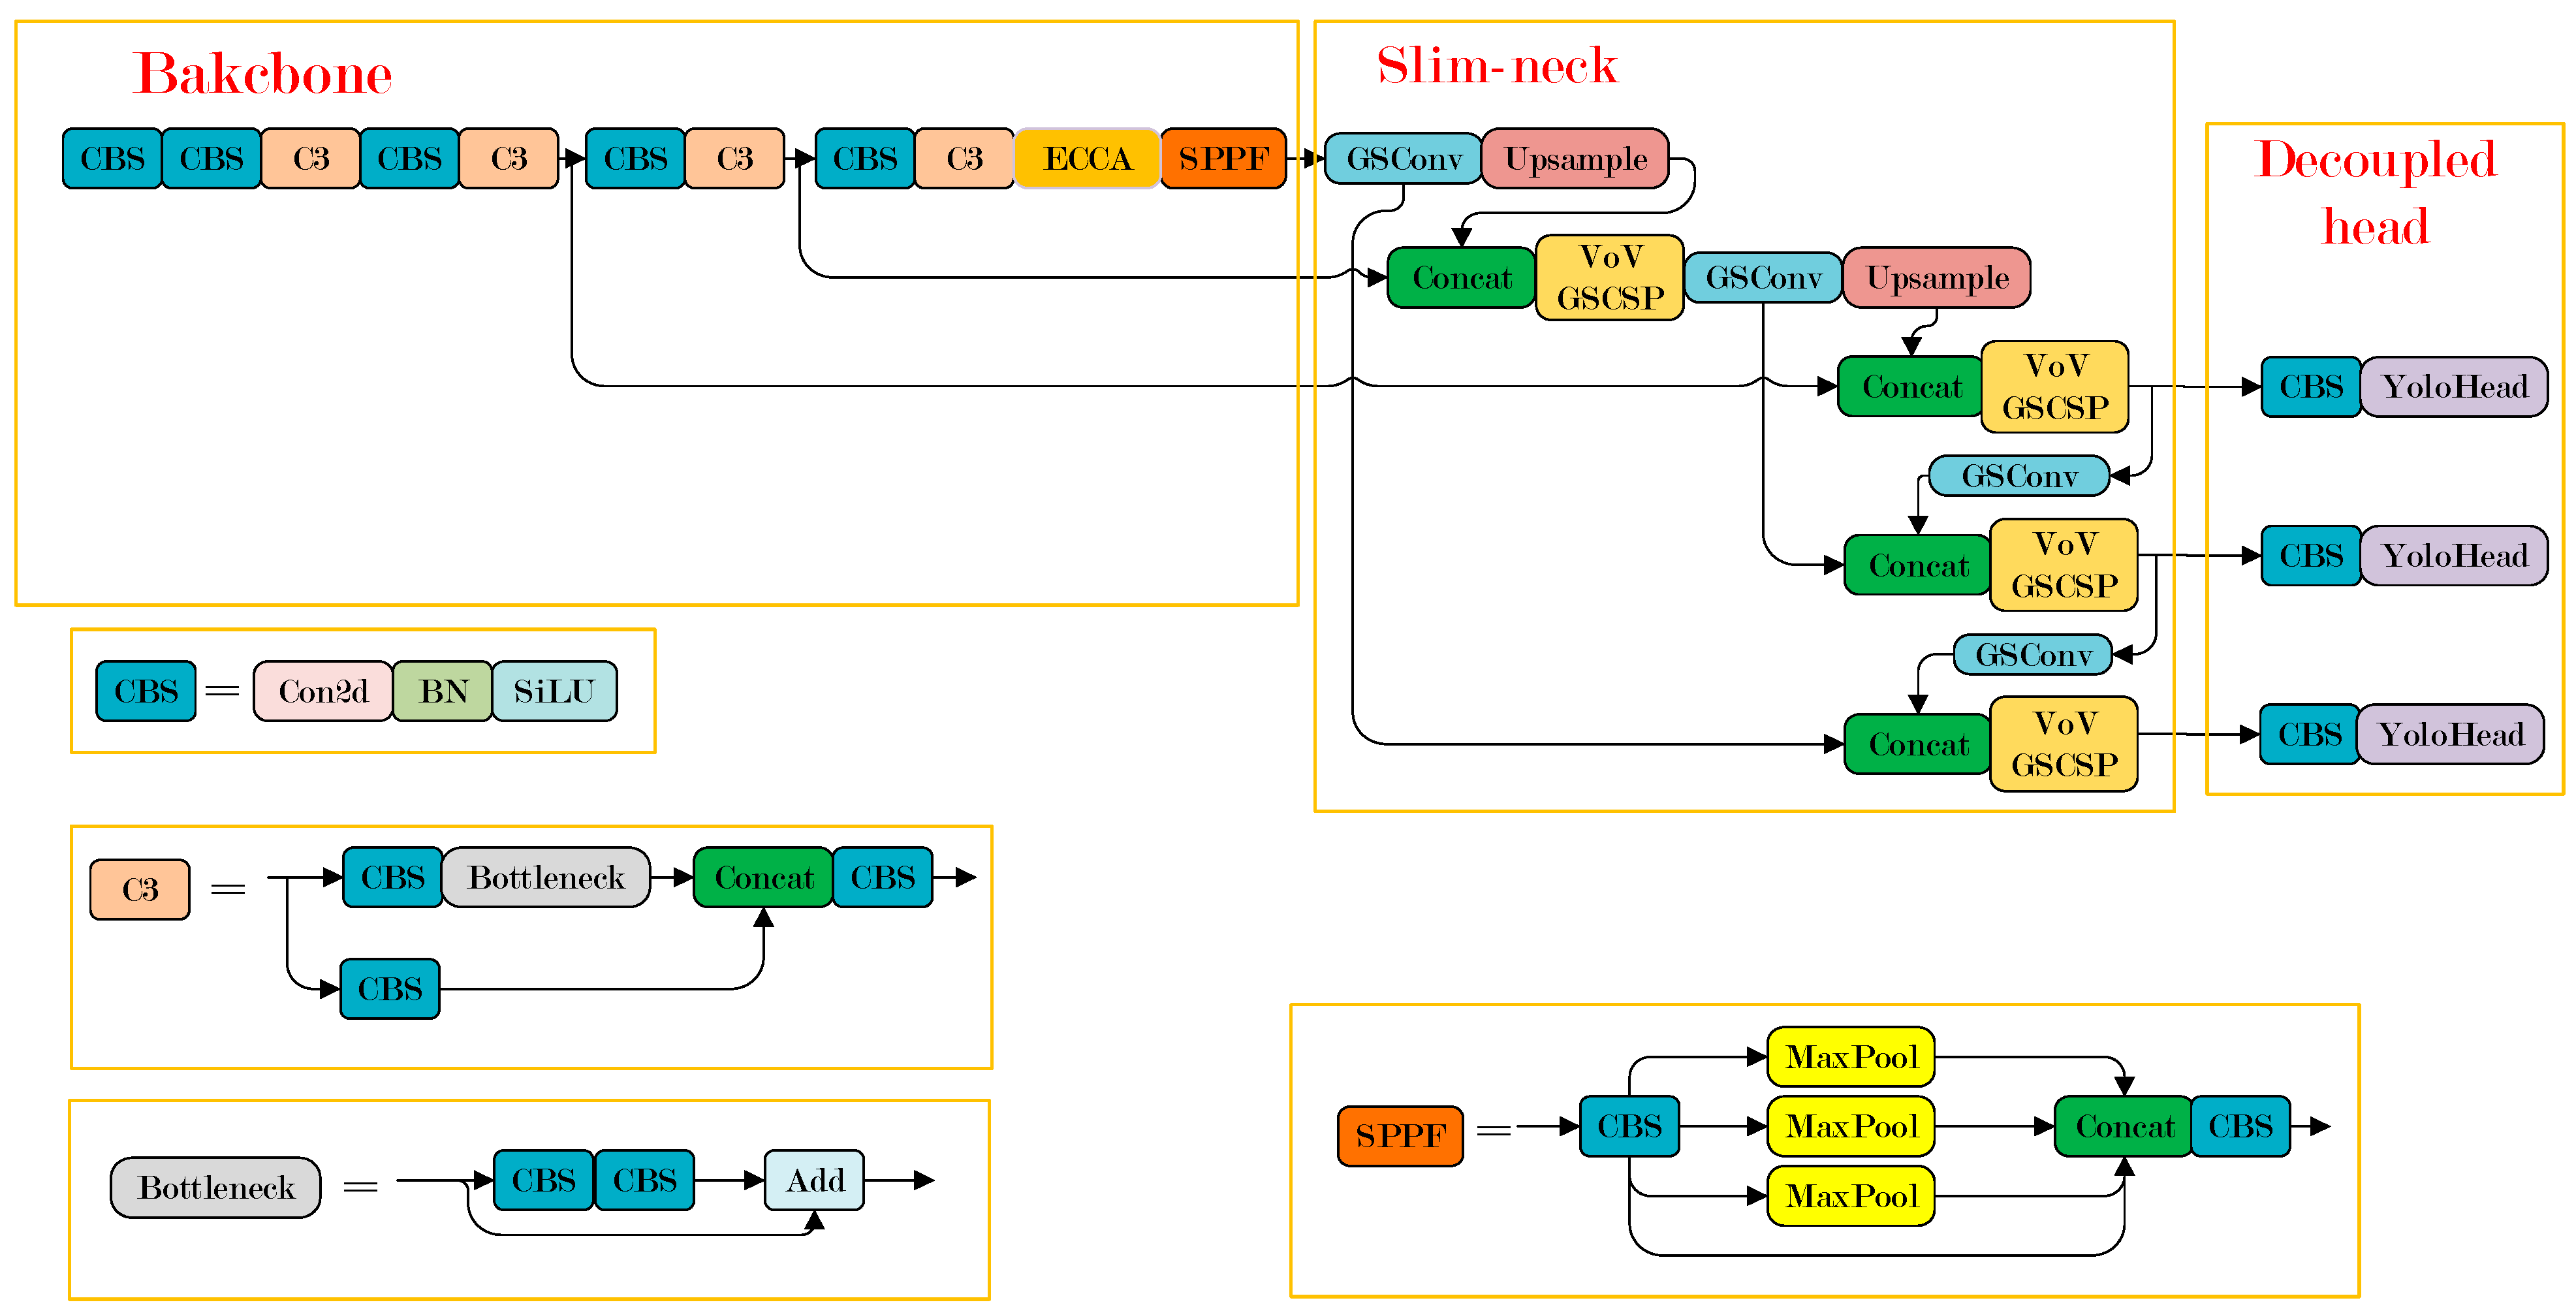
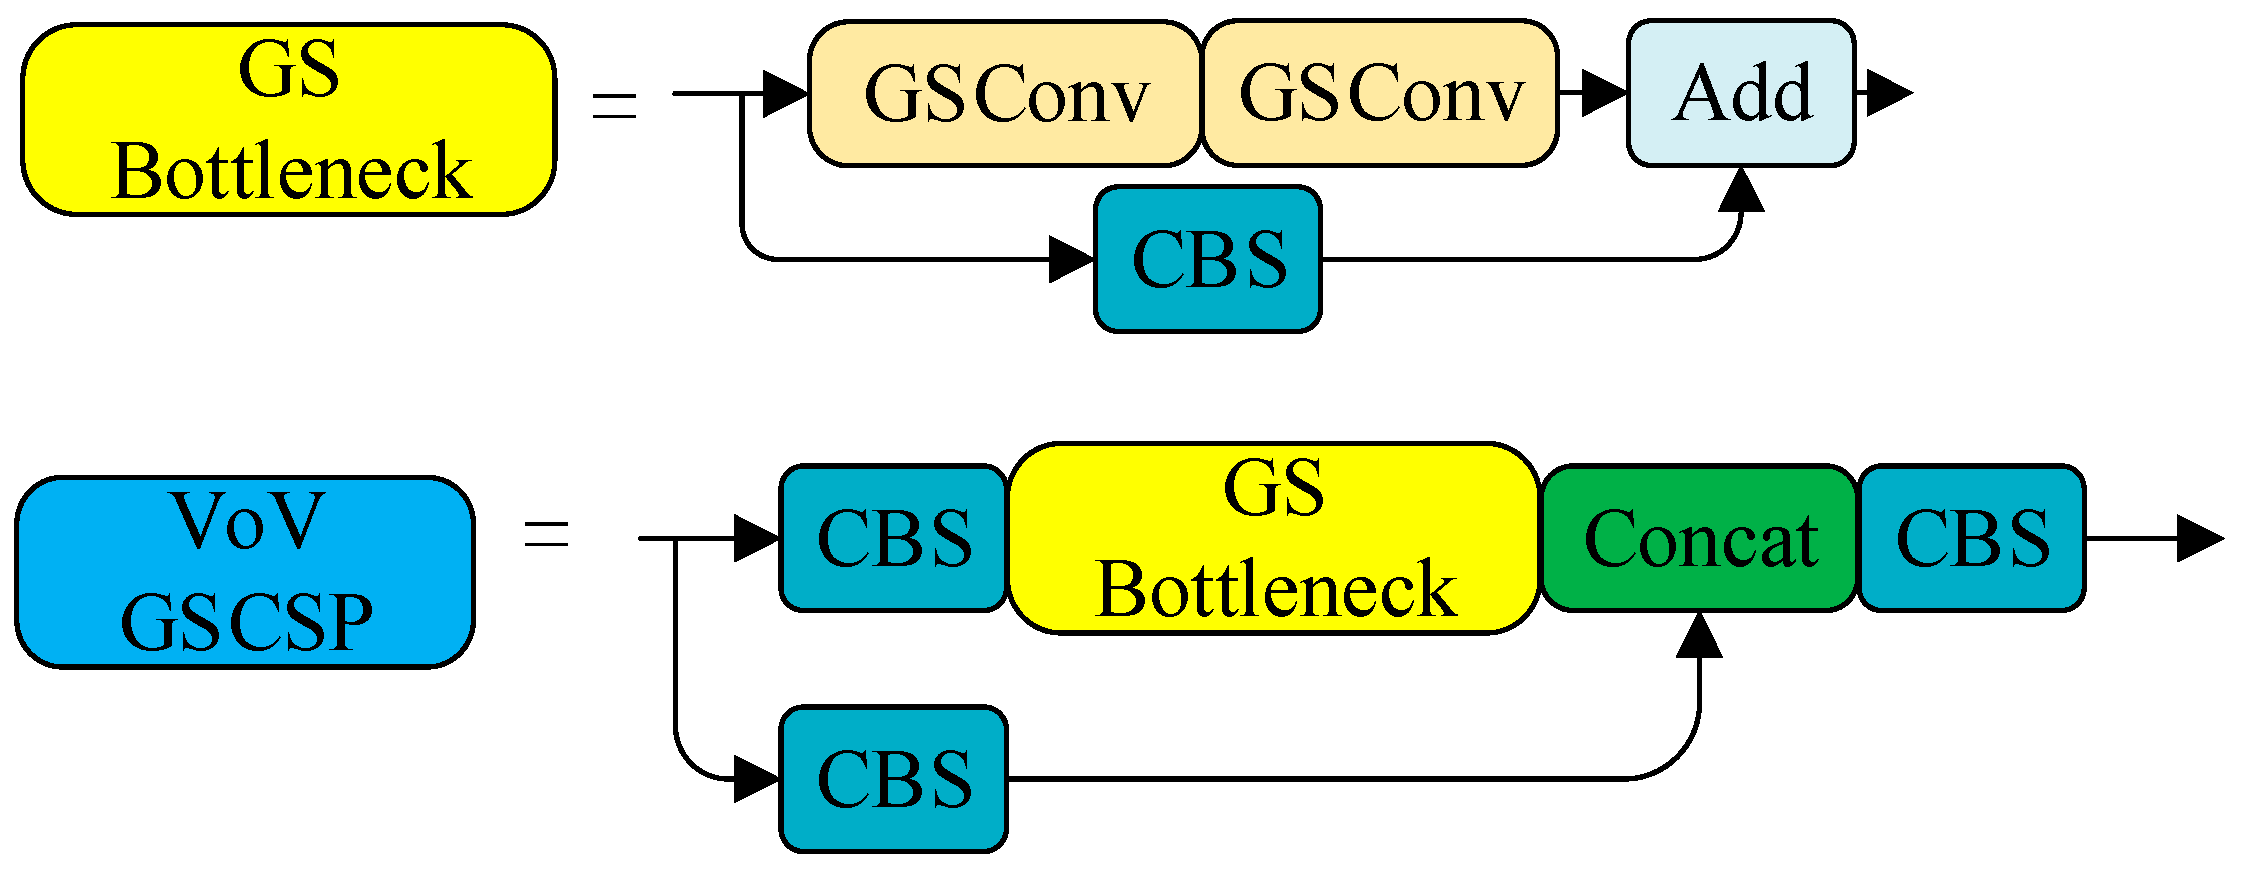
- The Slim-neck module [12], which combines GSConv and VoVGSCSP, was proposed to replace the Conv and C3 modules in the neck network of YOLOv5. This can effectively reduce the number of parameters while improving the detection capability for defects.
- (3)
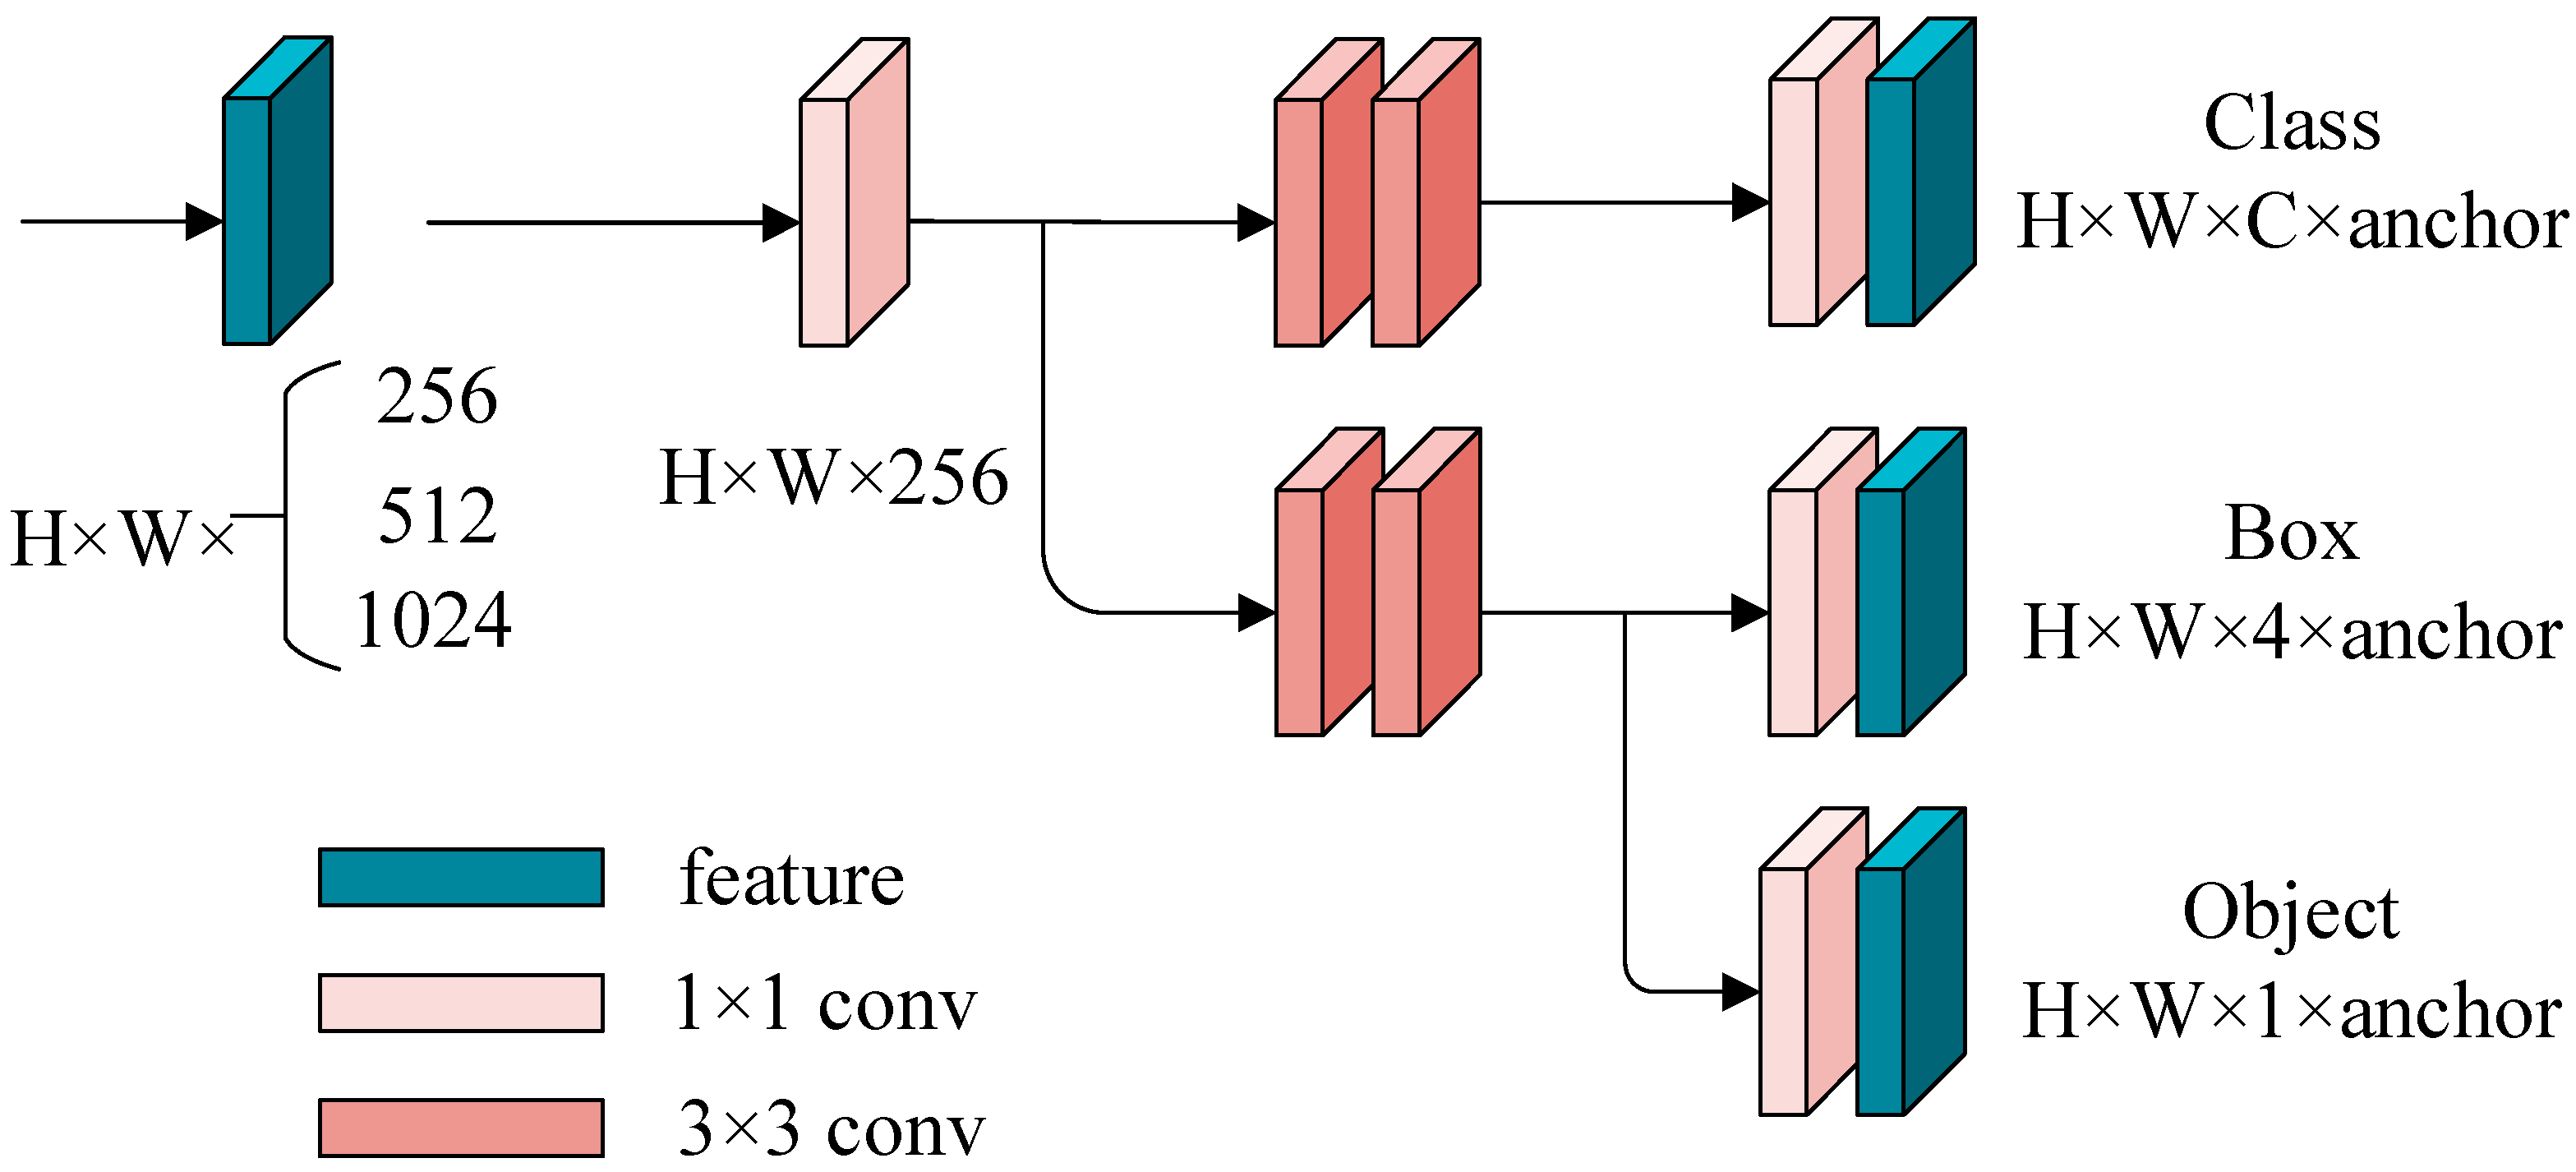
- The decoupled head from YOLOX [13] was utilized to replace the original head in order to separate the regression and classification tasks and improve the network’s ability to distinguish among the defect categories.
2. Related Work
2.1. Object Detection Algorithms
2.2. Bearing Collar Defect Detection
3. Bearing Collar Defect Detection System
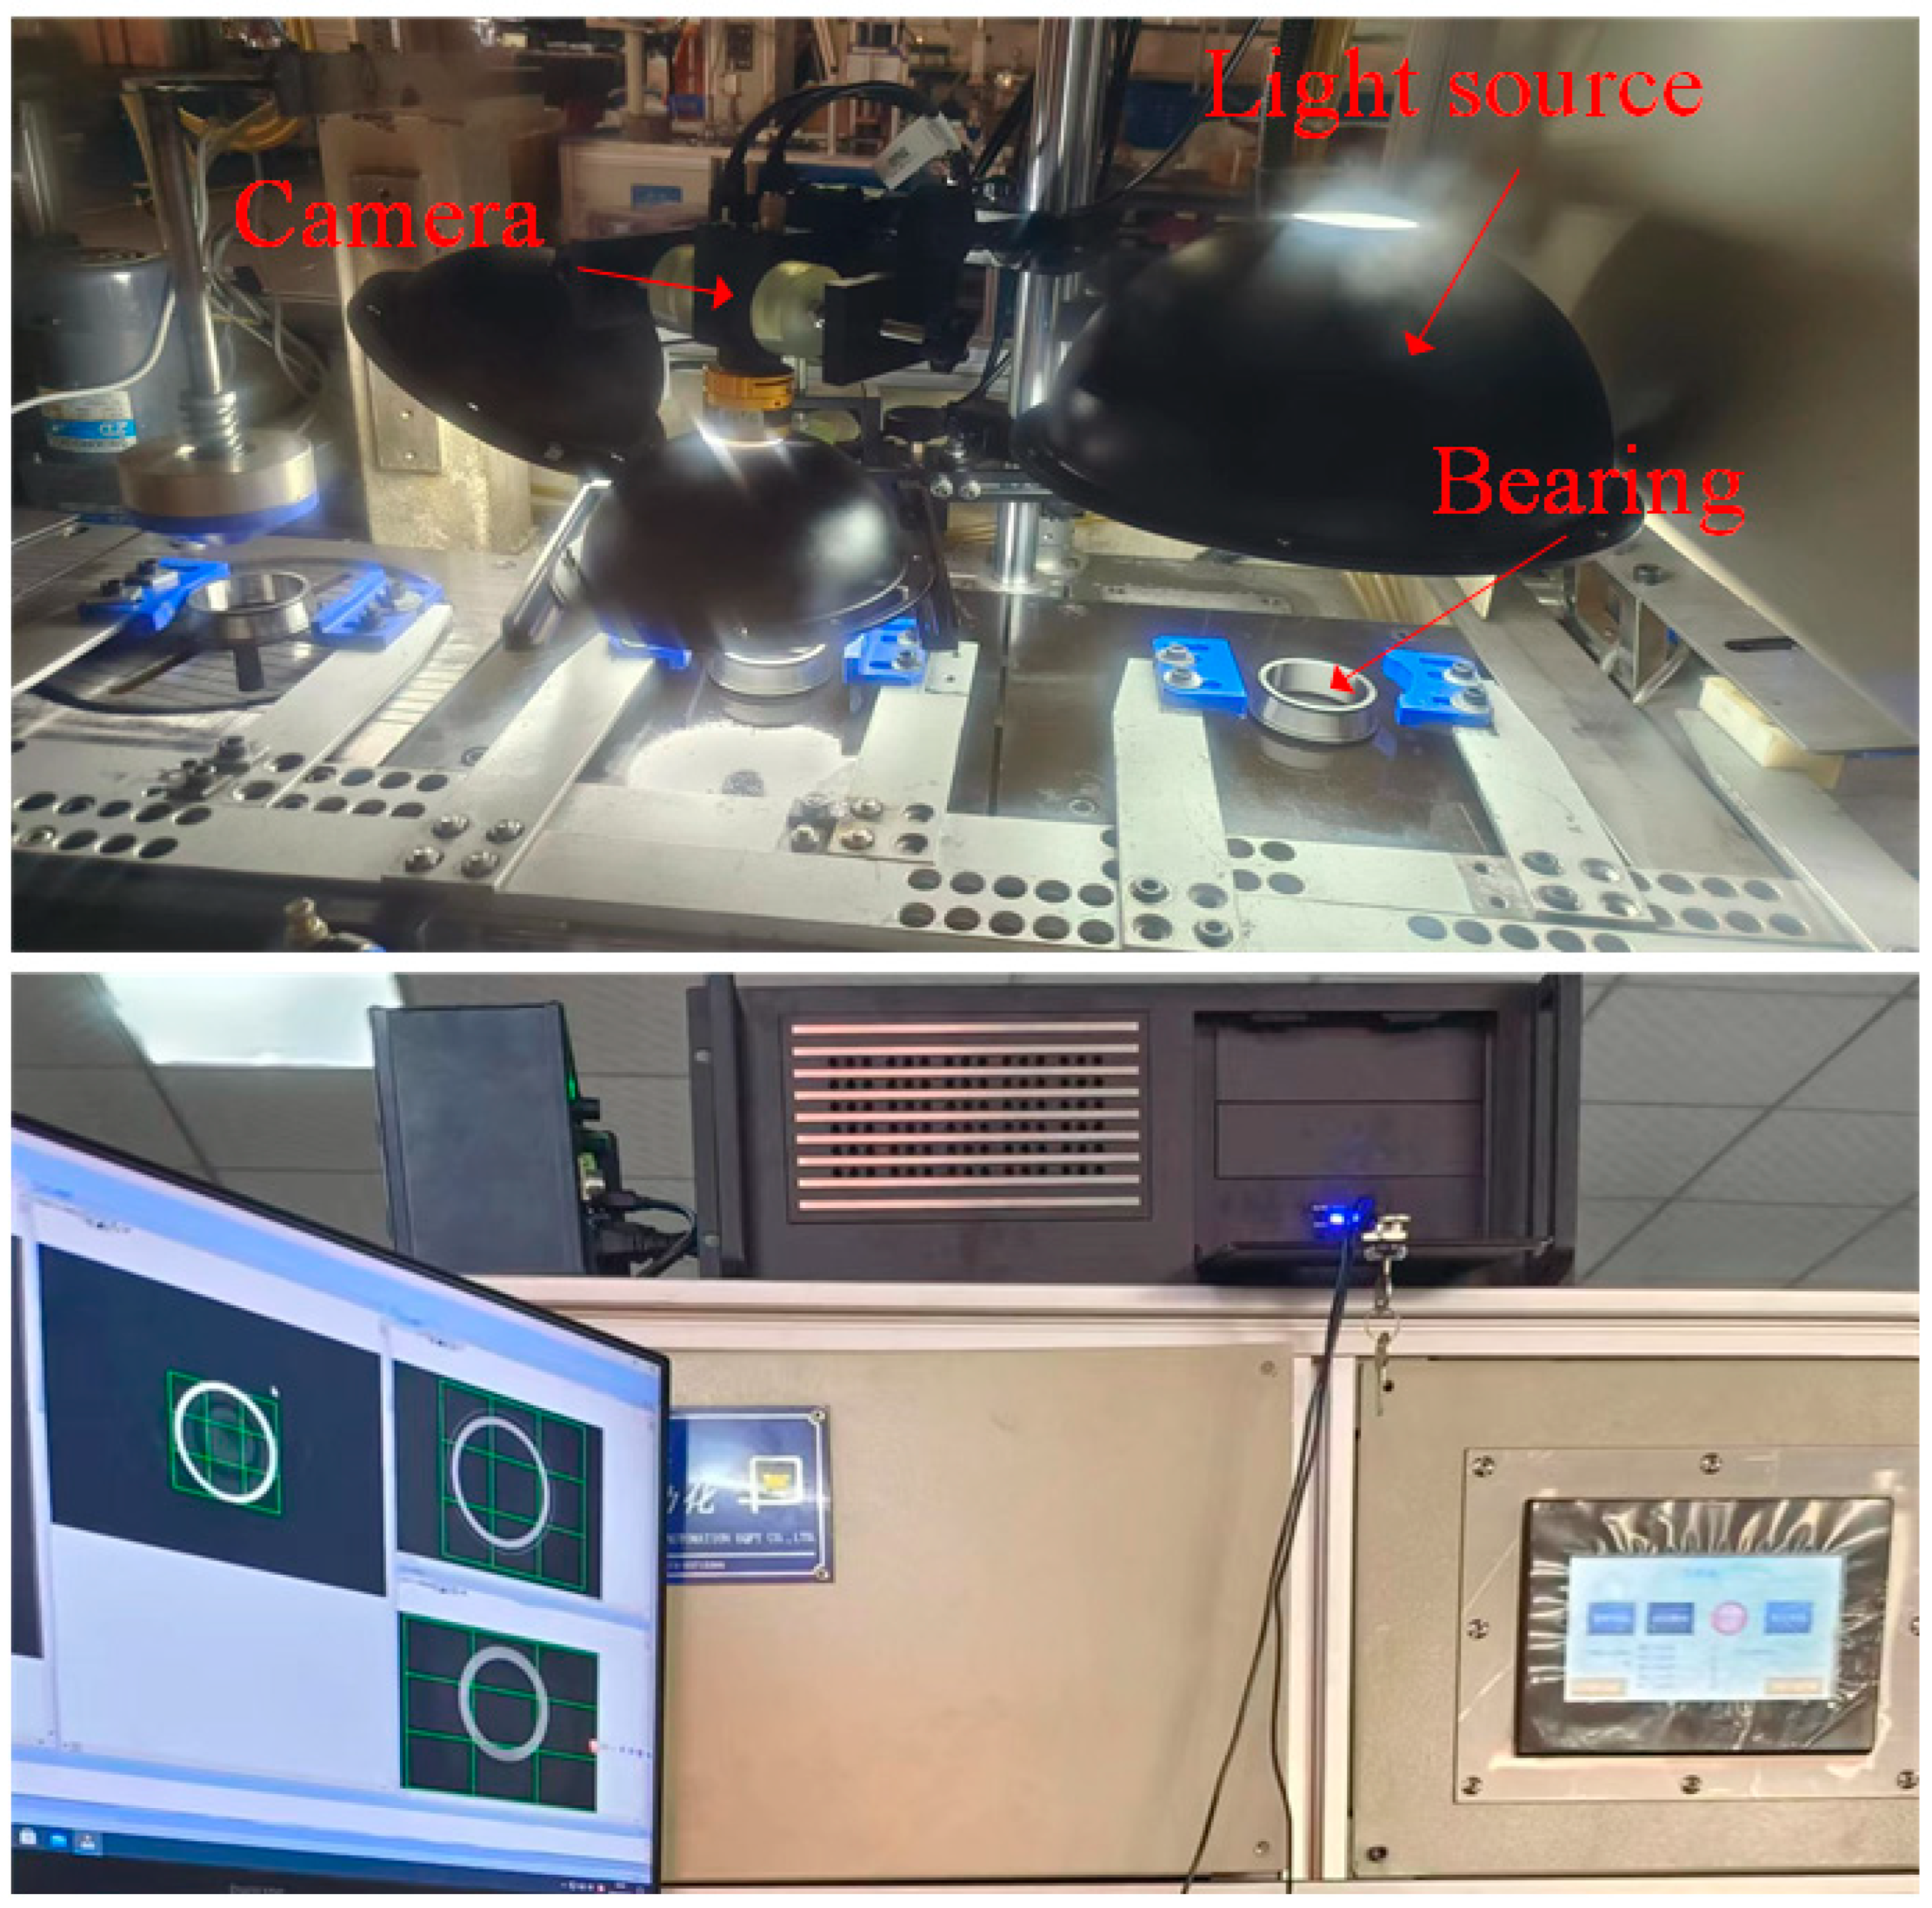
3.1. Bearing Collar Defect Detection Device
3.2. Bearing Collar Defects Imaging Analysis
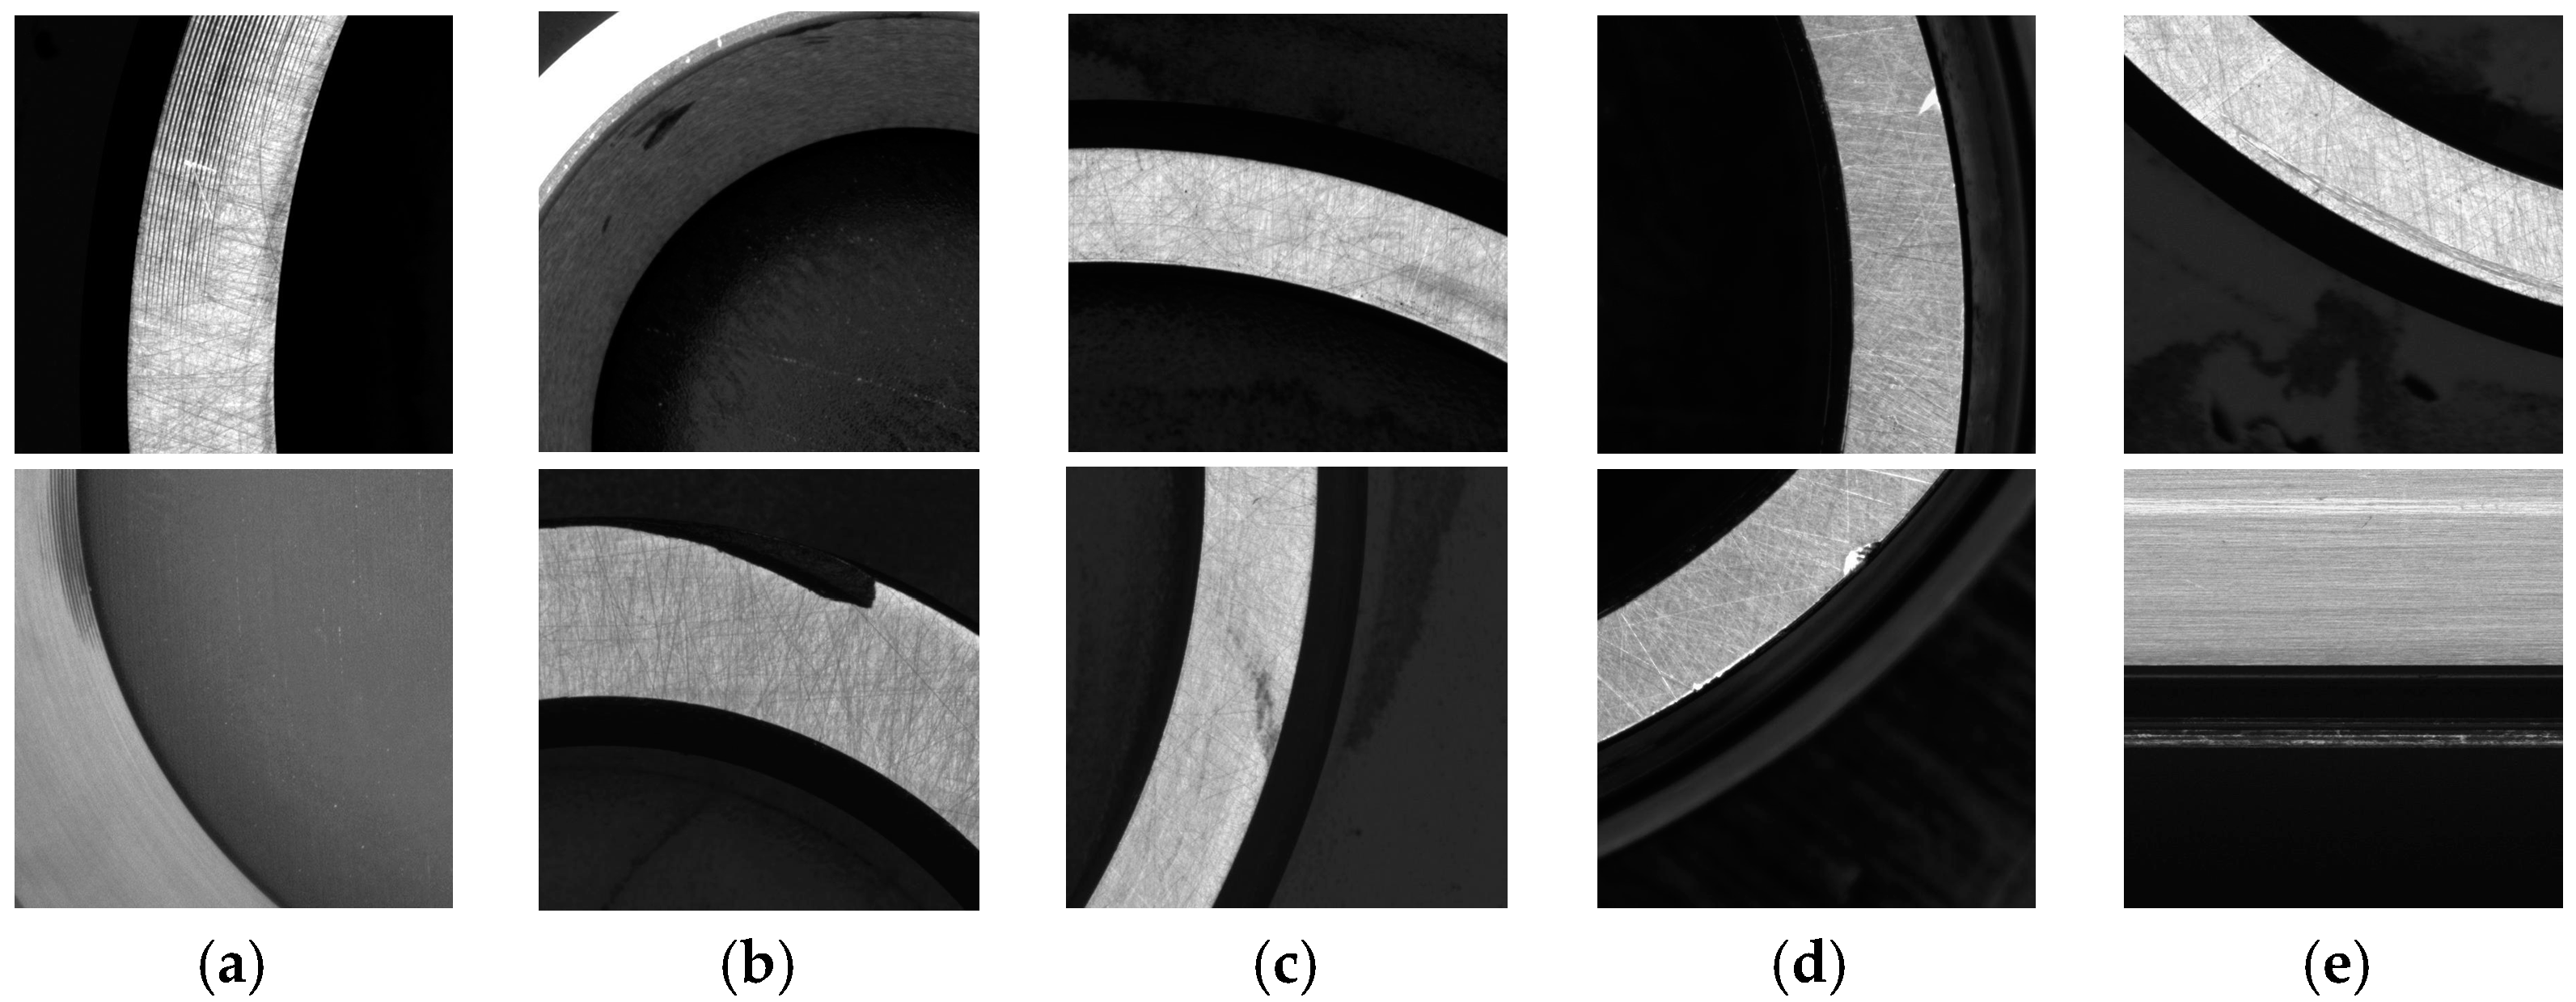
3.2.1. Bearing Collar Defect Imaging Features
- (1)
- Thread
- (2)
- Black spot
- (3)
- Wear
- (4)
- Dent
- (5)
- Scratch
3.2.2. Difficulties of Bearing Collar Defect Detection
- (1)
- As the bearing collar is ring-shaped, in this paper, sample images were obtained using a sliding window approach, which produced a somewhat complex background.
- (2)
- Dust and oil stains can appear on the surface of the bearing collar, and their imaging characteristics are very similar to those of defects, which can easily lead to misjudgments.
- (3)
- Black spot defects have the same color as the black background and can only be distinguished by their shape, which can lead to misjudgments.
- (4)
- The sizes of threads, black spots, and wear defects significantly differ, and the detection model needs to simultaneously have a good detection effect on multiscale targets.
4. ESD-YOLOv5
4.1. Network Structure of ESD-YOLOv5
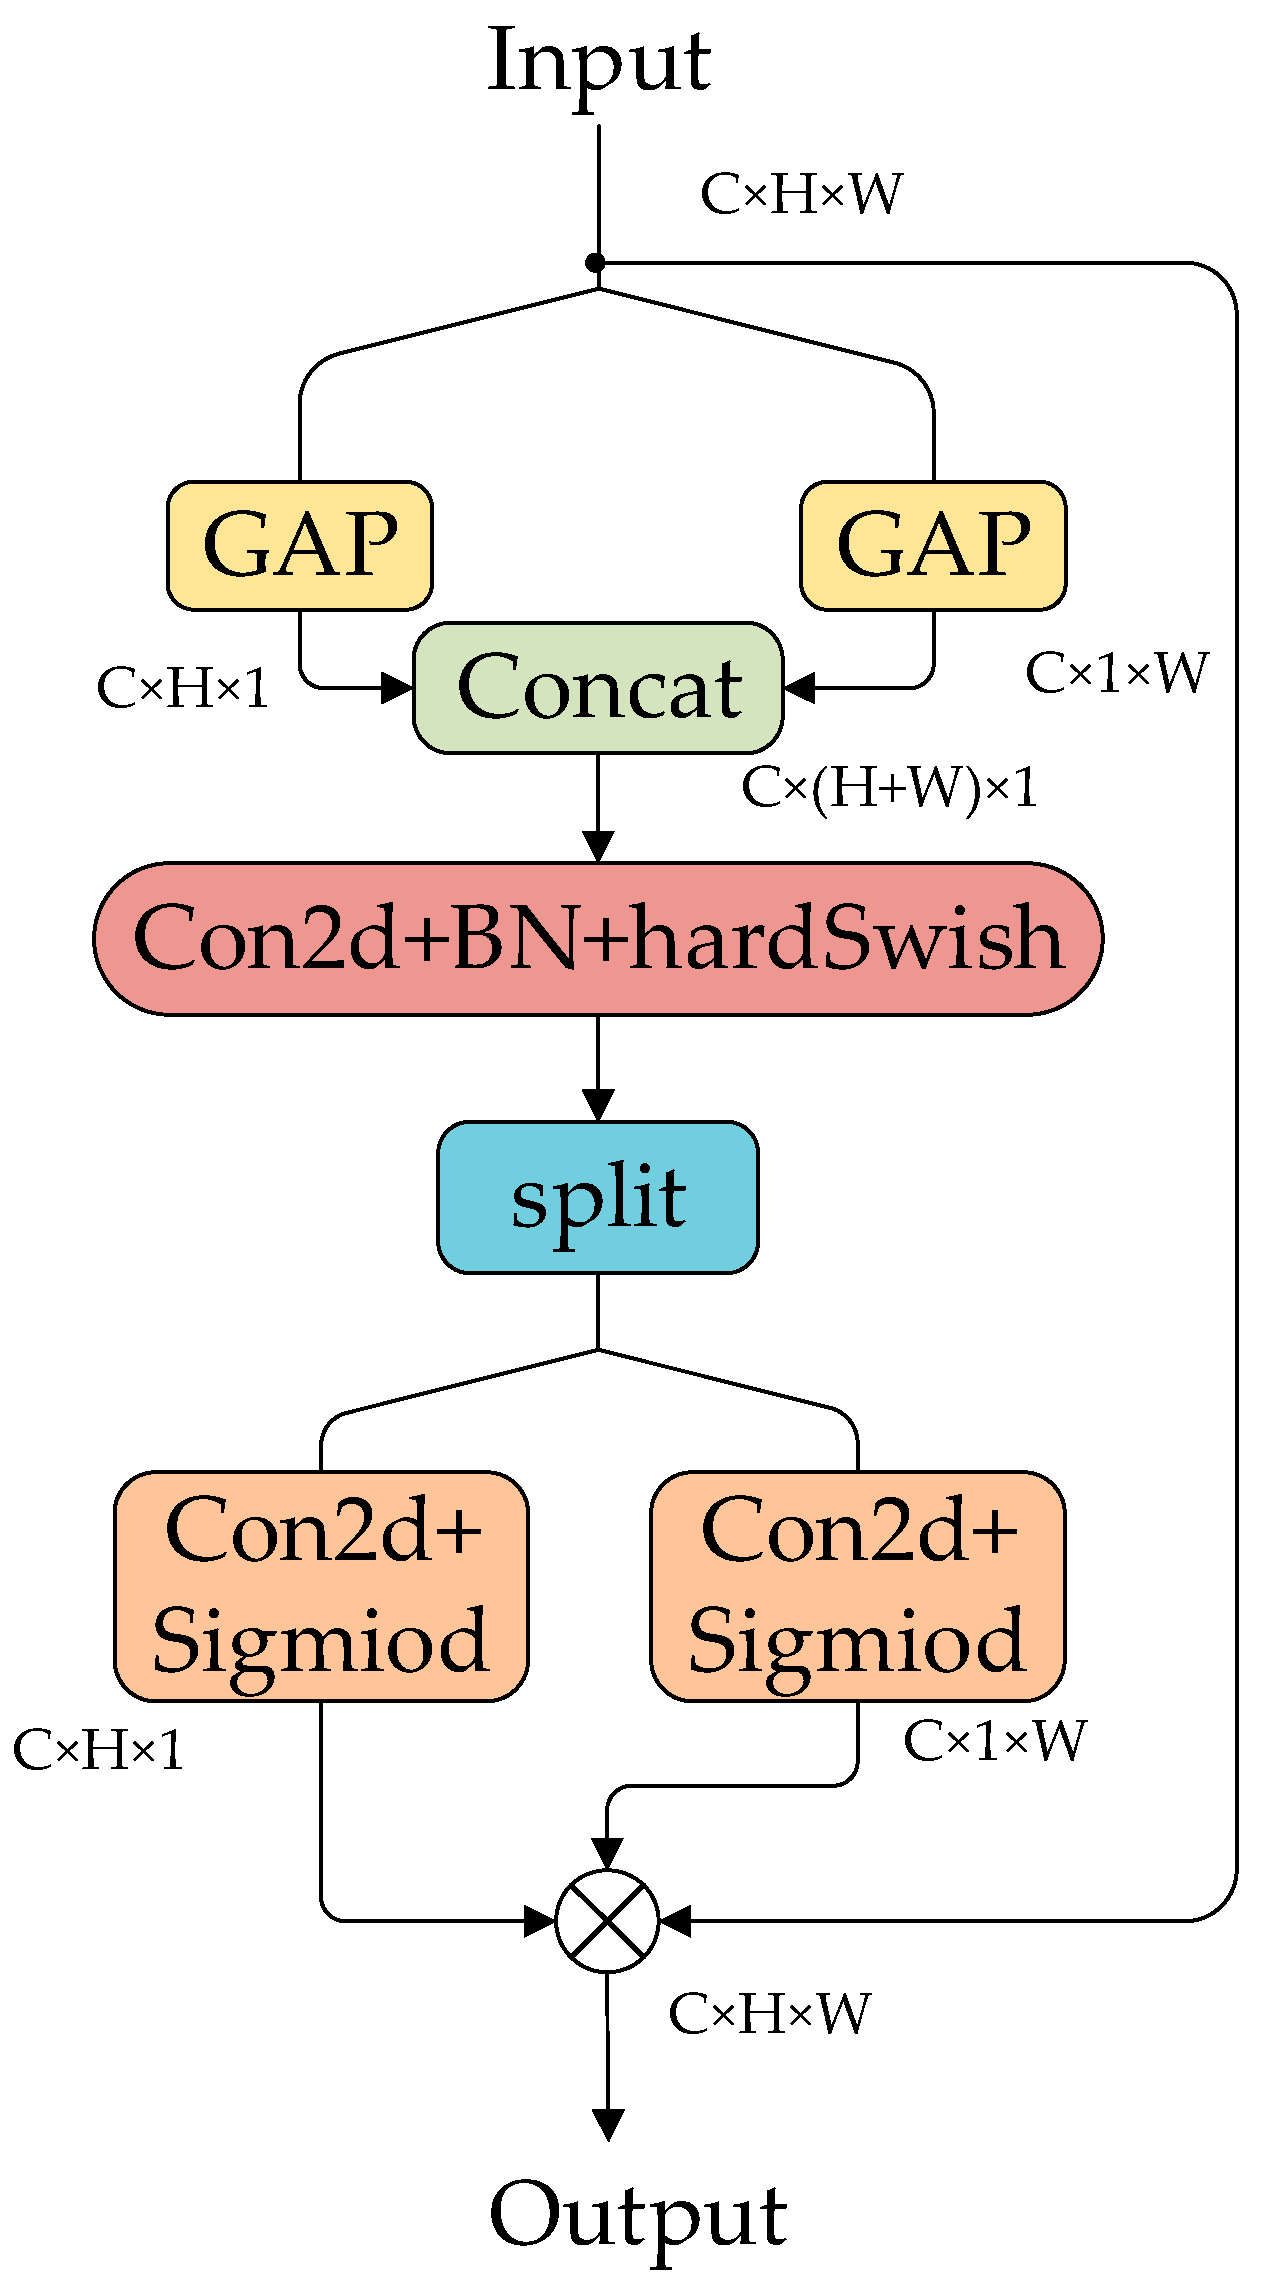
4.2. ECCA Module
4.2.1. CA
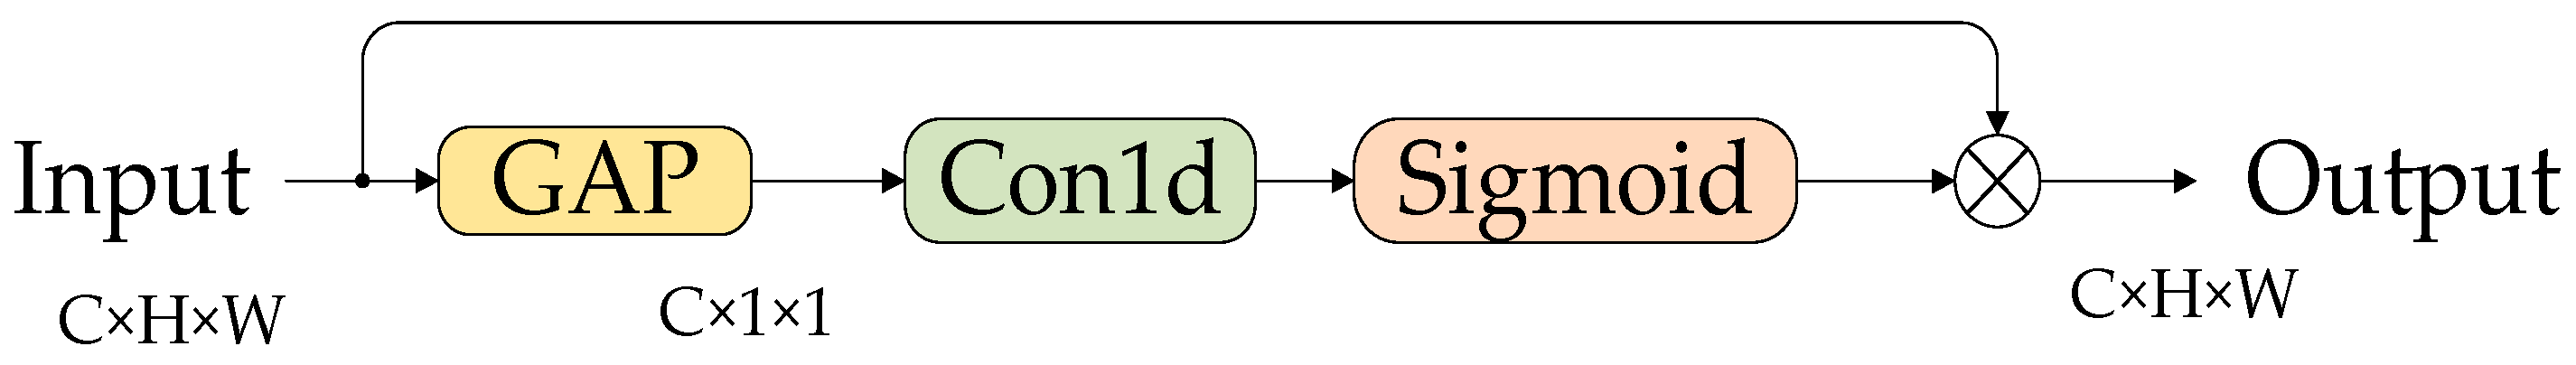
4.2.2. ECA
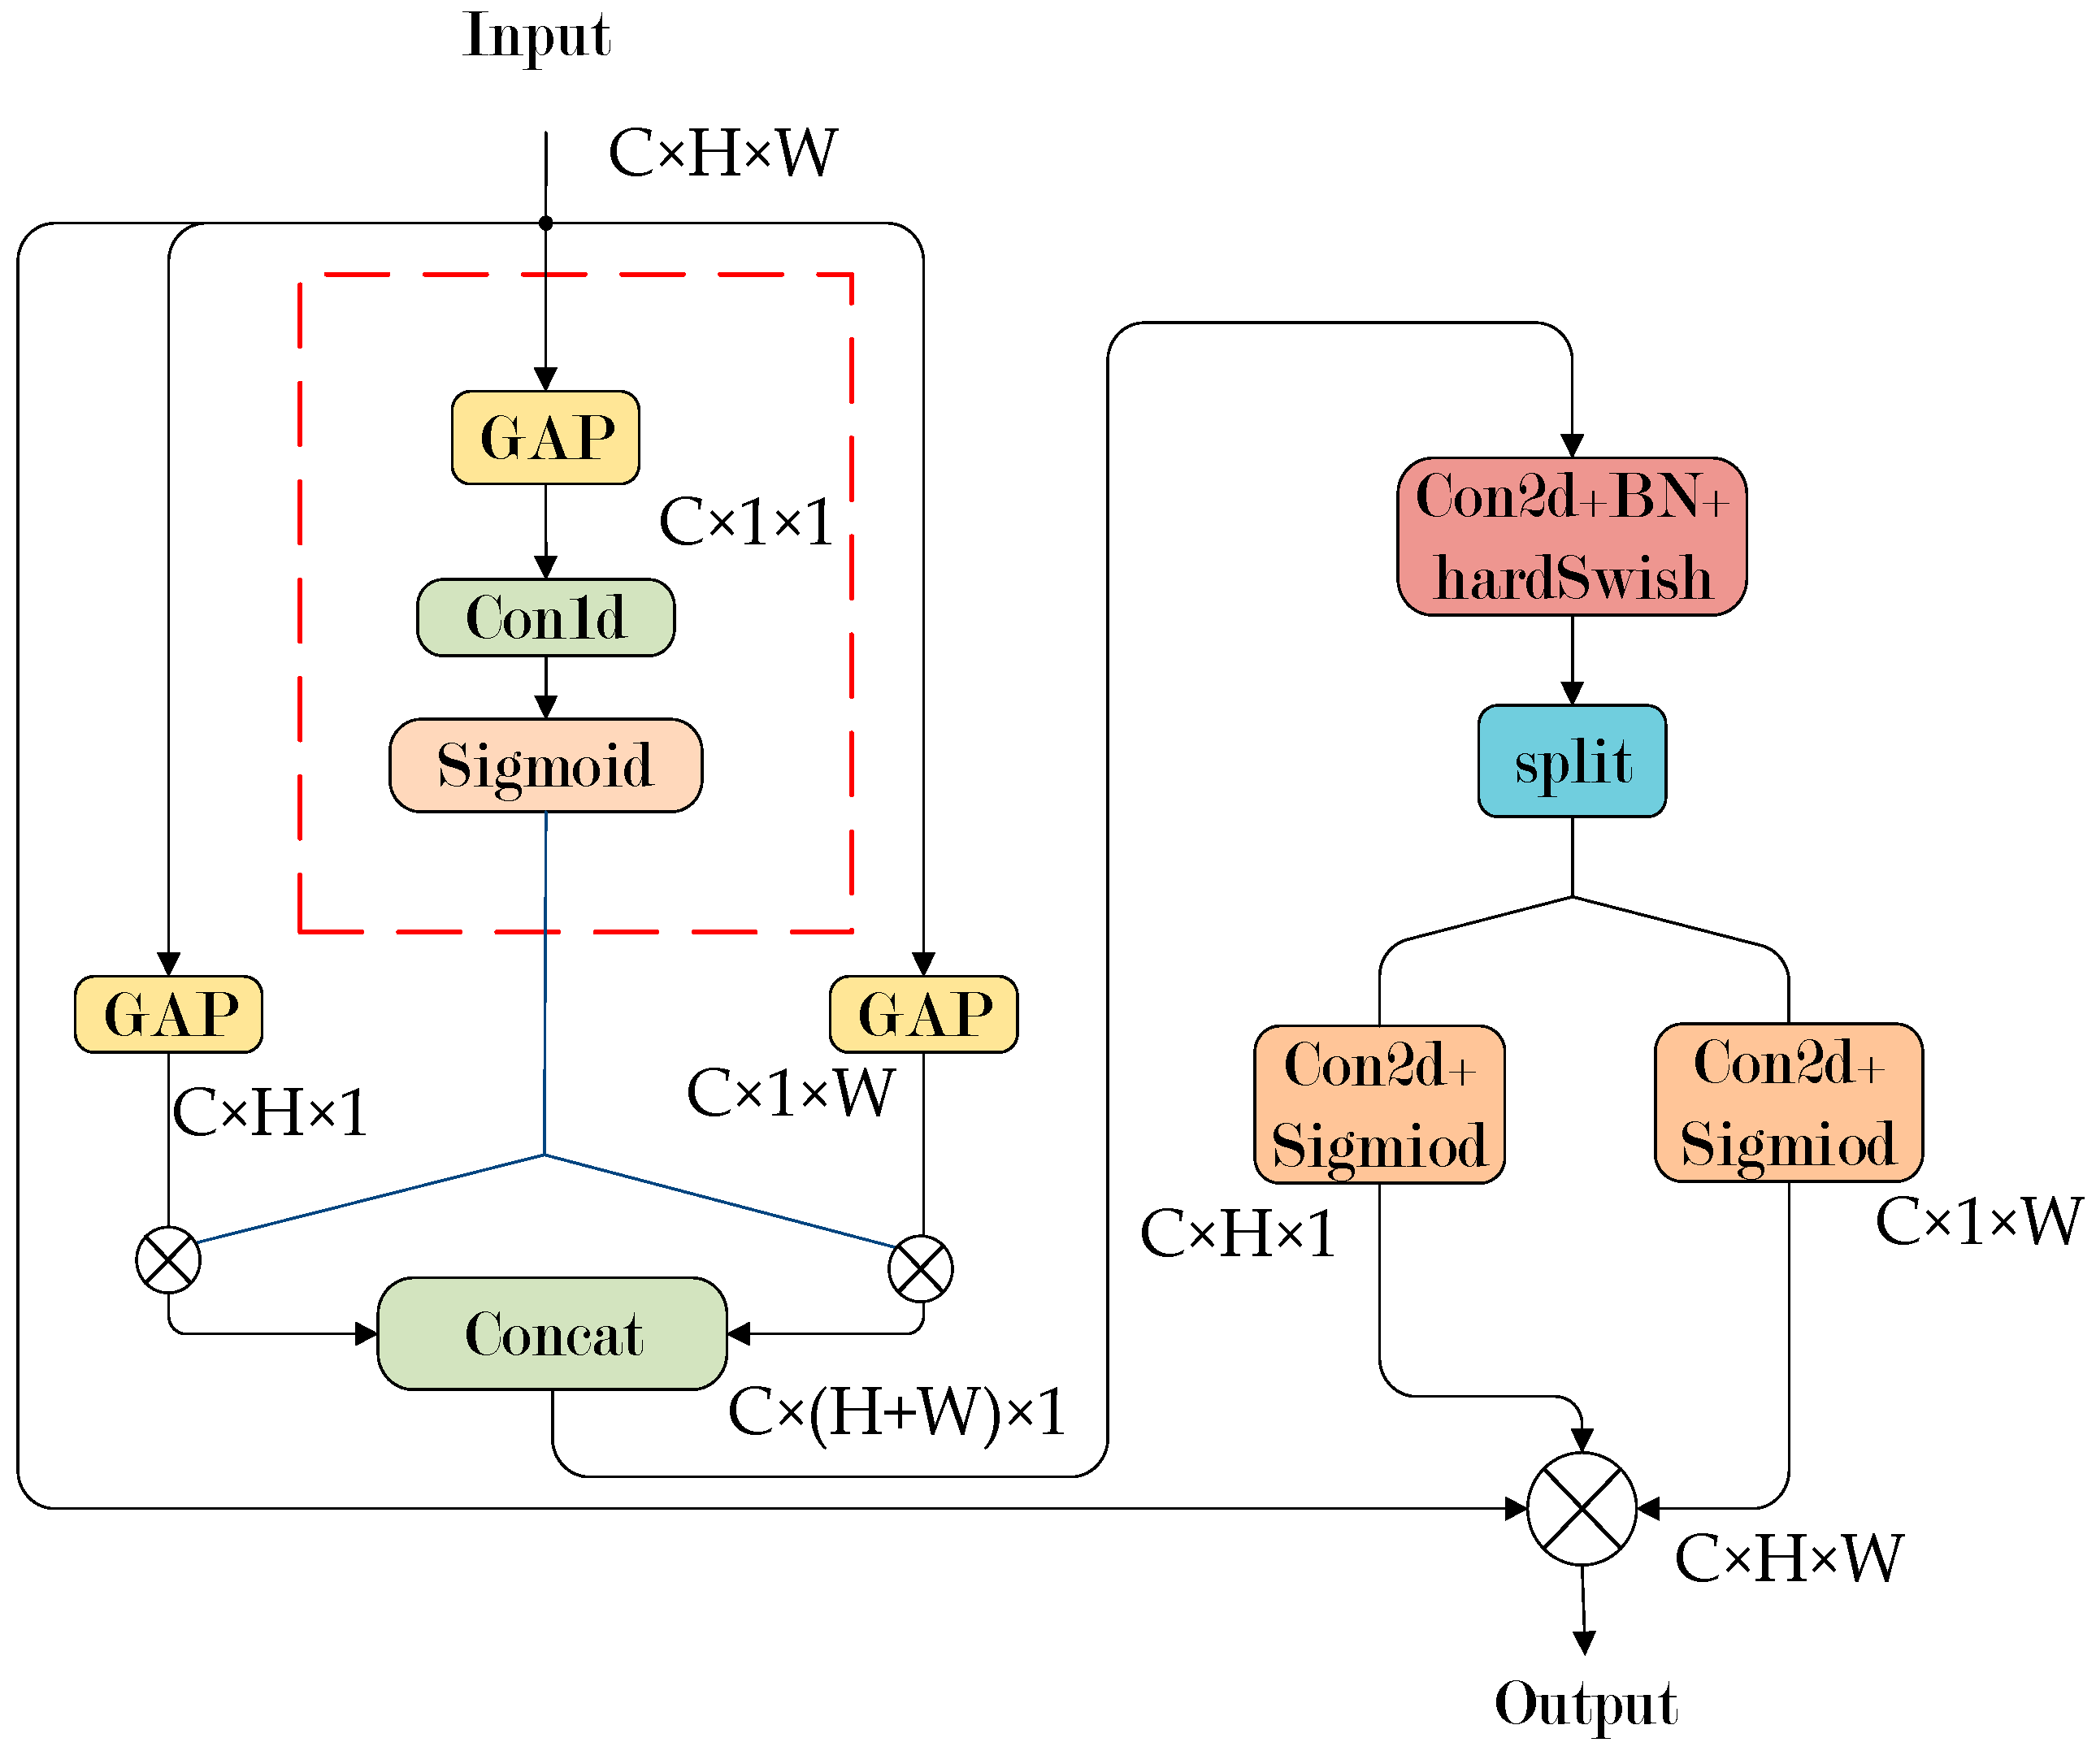
4.2.3. ECCA
4.3. Slim-Neck
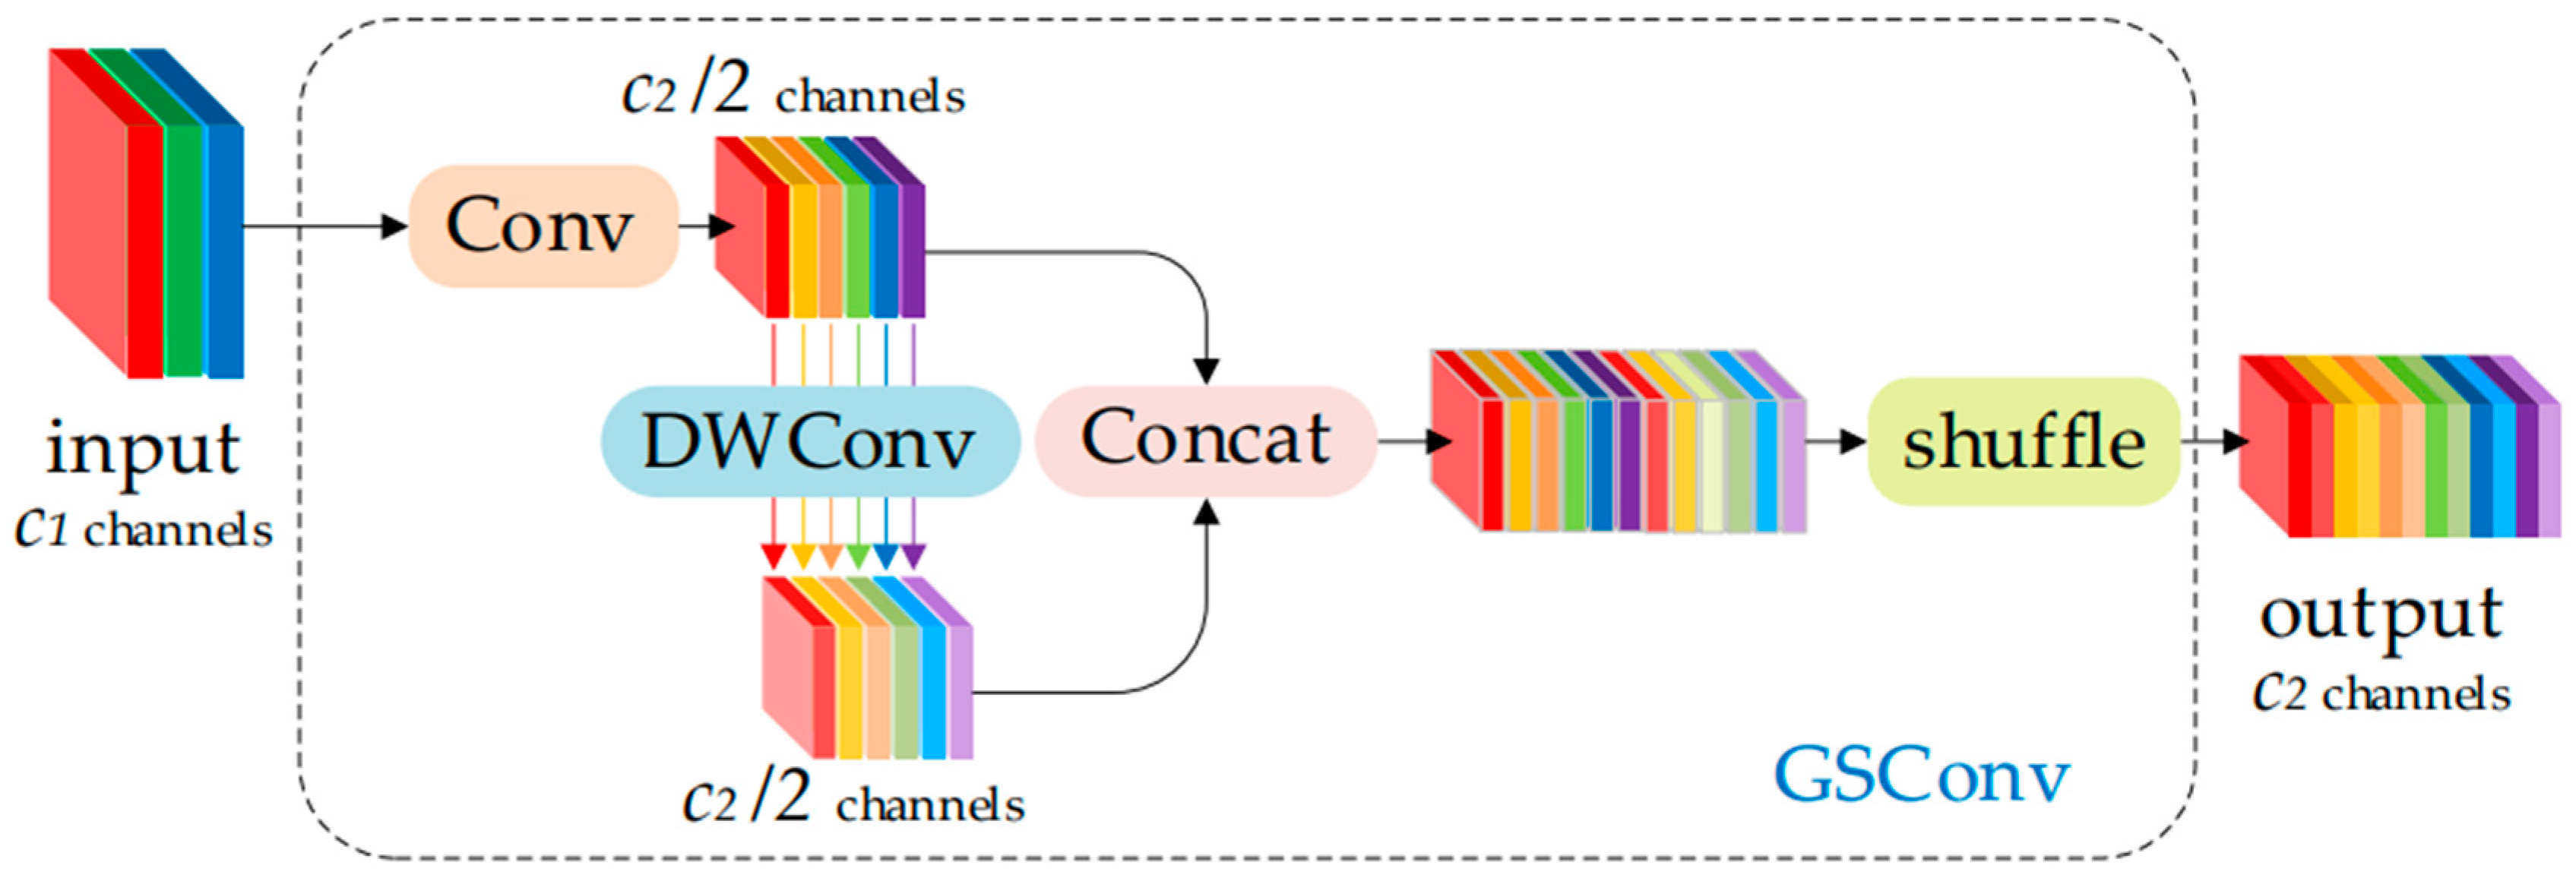
4.3.1. GSConv
4.3.2. VoVGSCSP
4.3.3. Slim-Neck
4.4. Decoupled Head
4.5. K-Means Algorithm and Loss Function
4.5.1. K-Means Algorithm
4.5.2. Loss Function
5. Experimental Verification
5.1. Bearing Collar Surface Defect Dataset
5.2. Experimental Setting
5.3. Performance Metrics
5.4. Ablation Experiments
5.5. Comparison Experiments
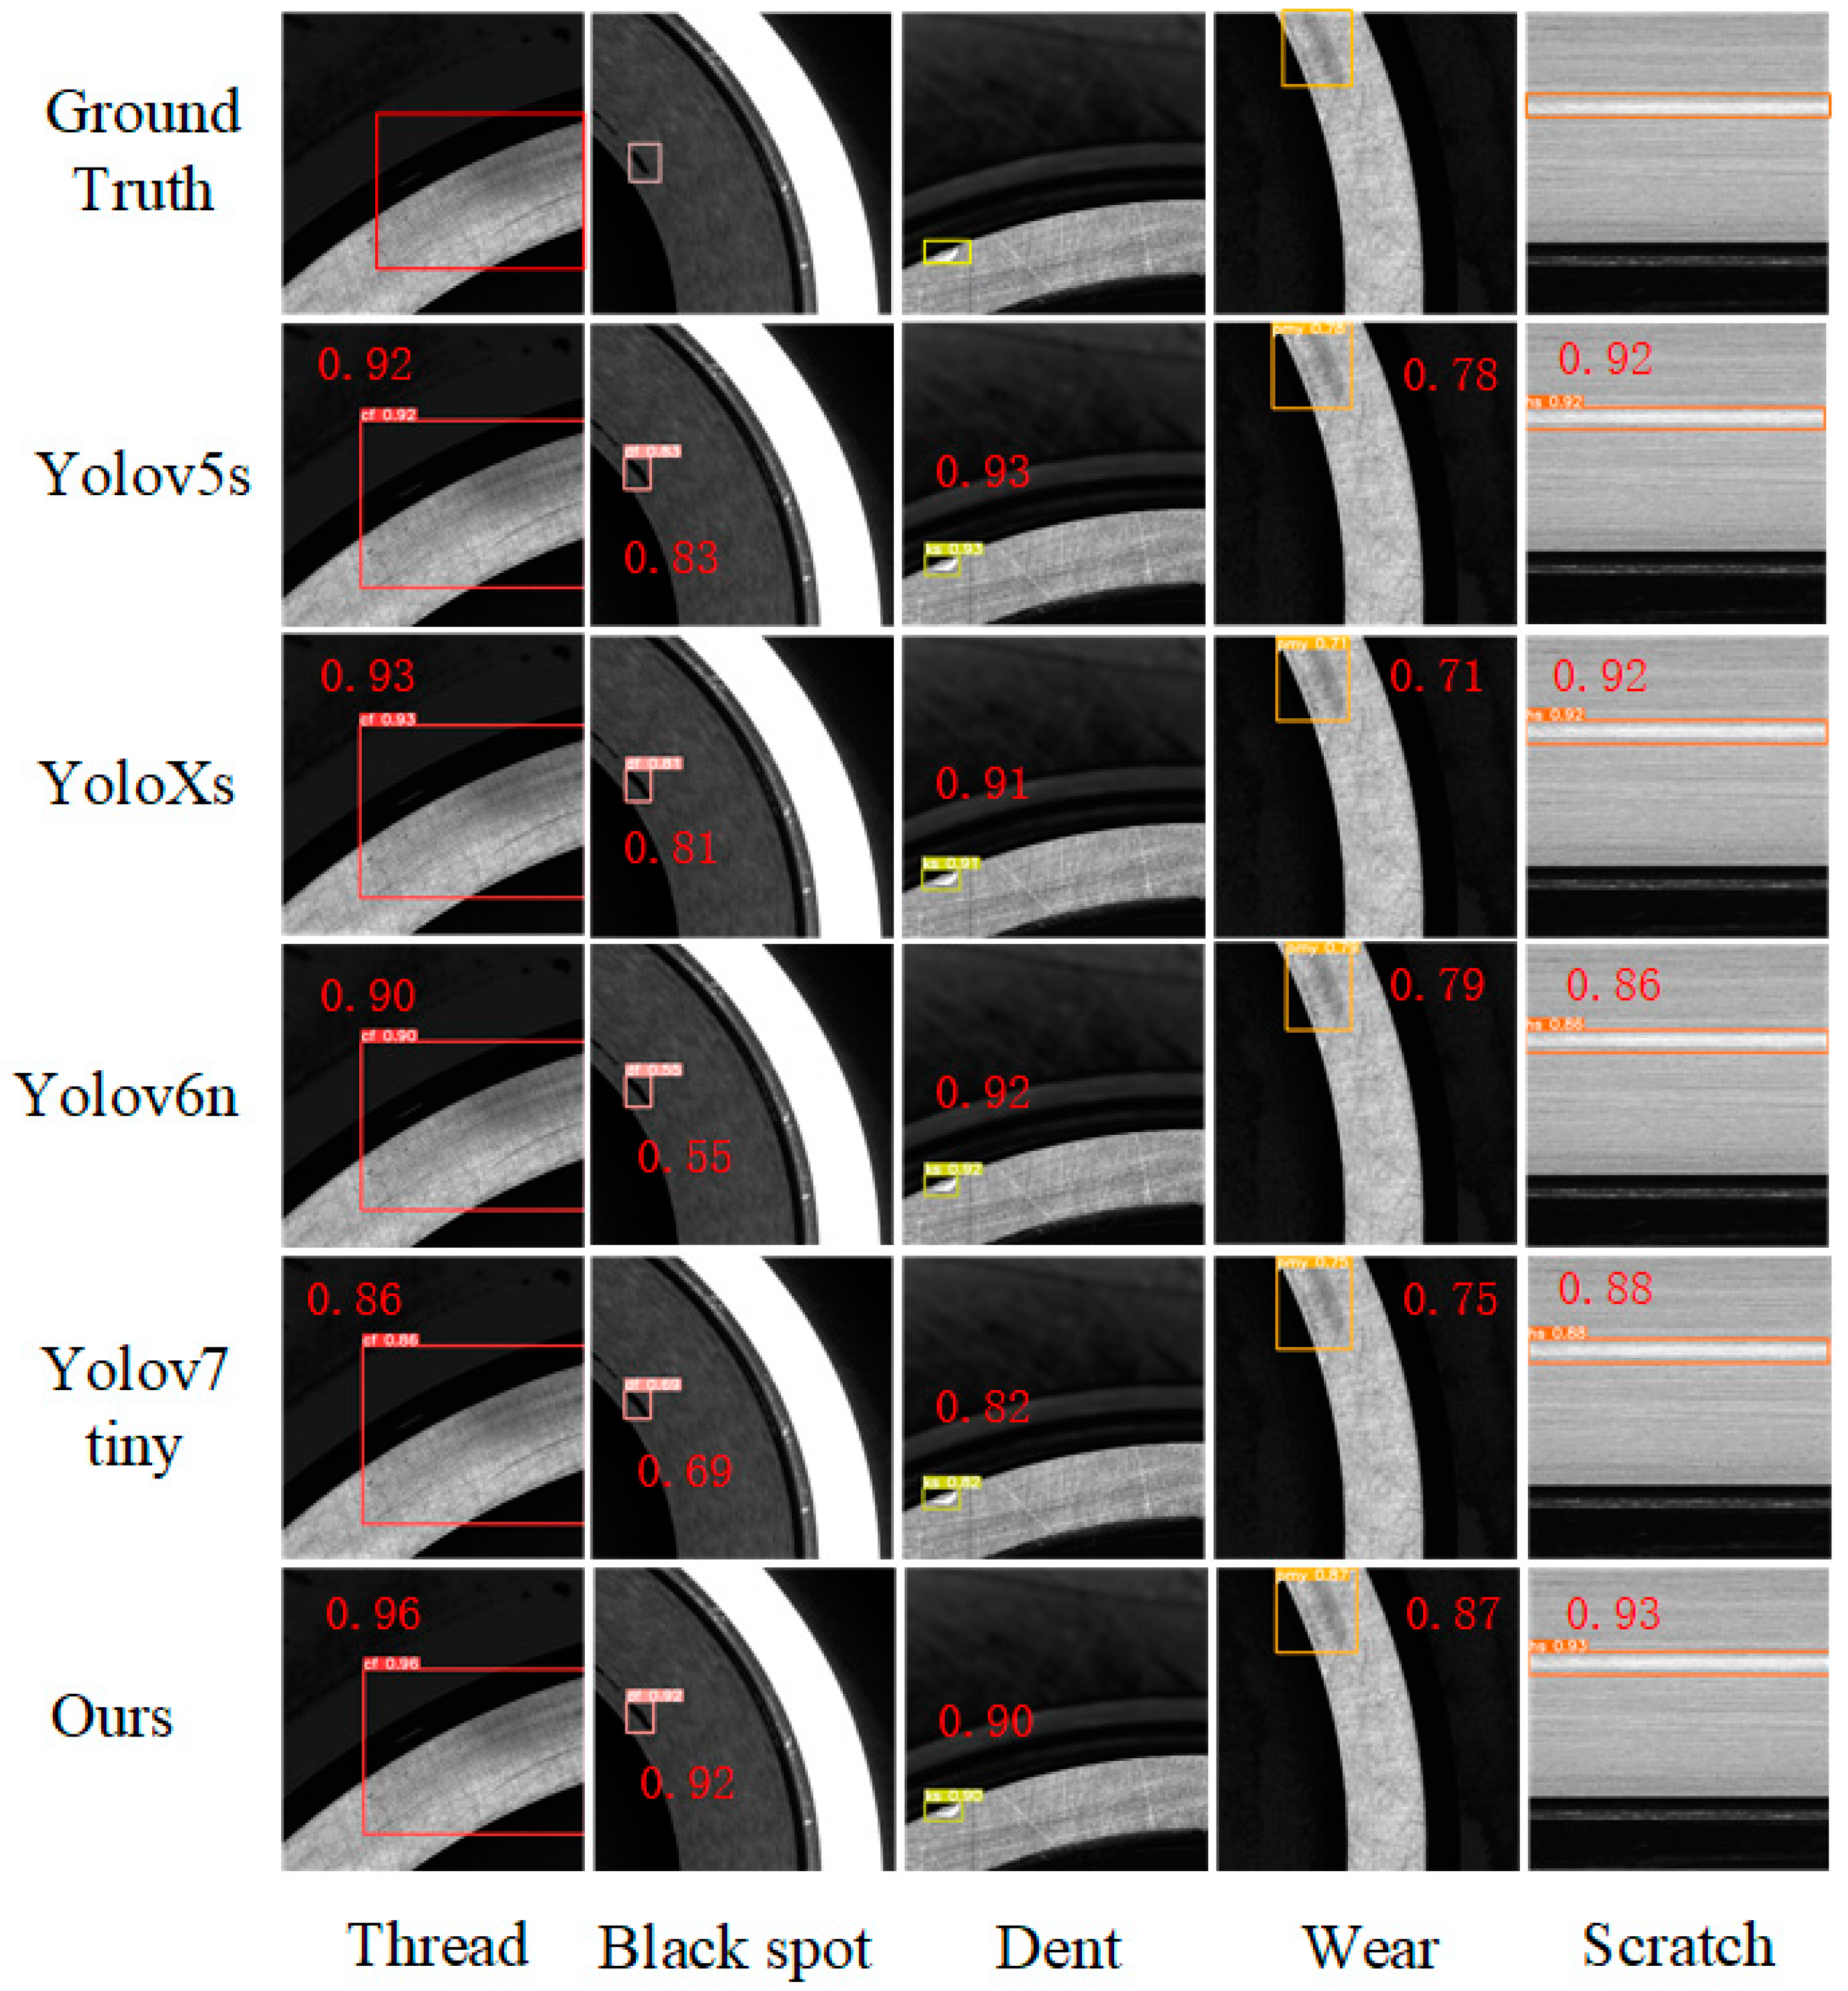
5.5.1. Experimental Results of Bearing Collar Surface Defect Detection
5.5.2. Experimental Results of Hot-Pressed LGP and Fabric Datasets
6. Discussion
- (1)
- By incorporating the ECCA module into the backbone network, the model’s capability to extract features related to defects has been enhanced.
- (2)
- Replacing the original neck of YOLOv5 with a slim neck has reduced the model’s parameter quantity and computational load, while simultaneously improving its feature fusion capacity.
- (3)
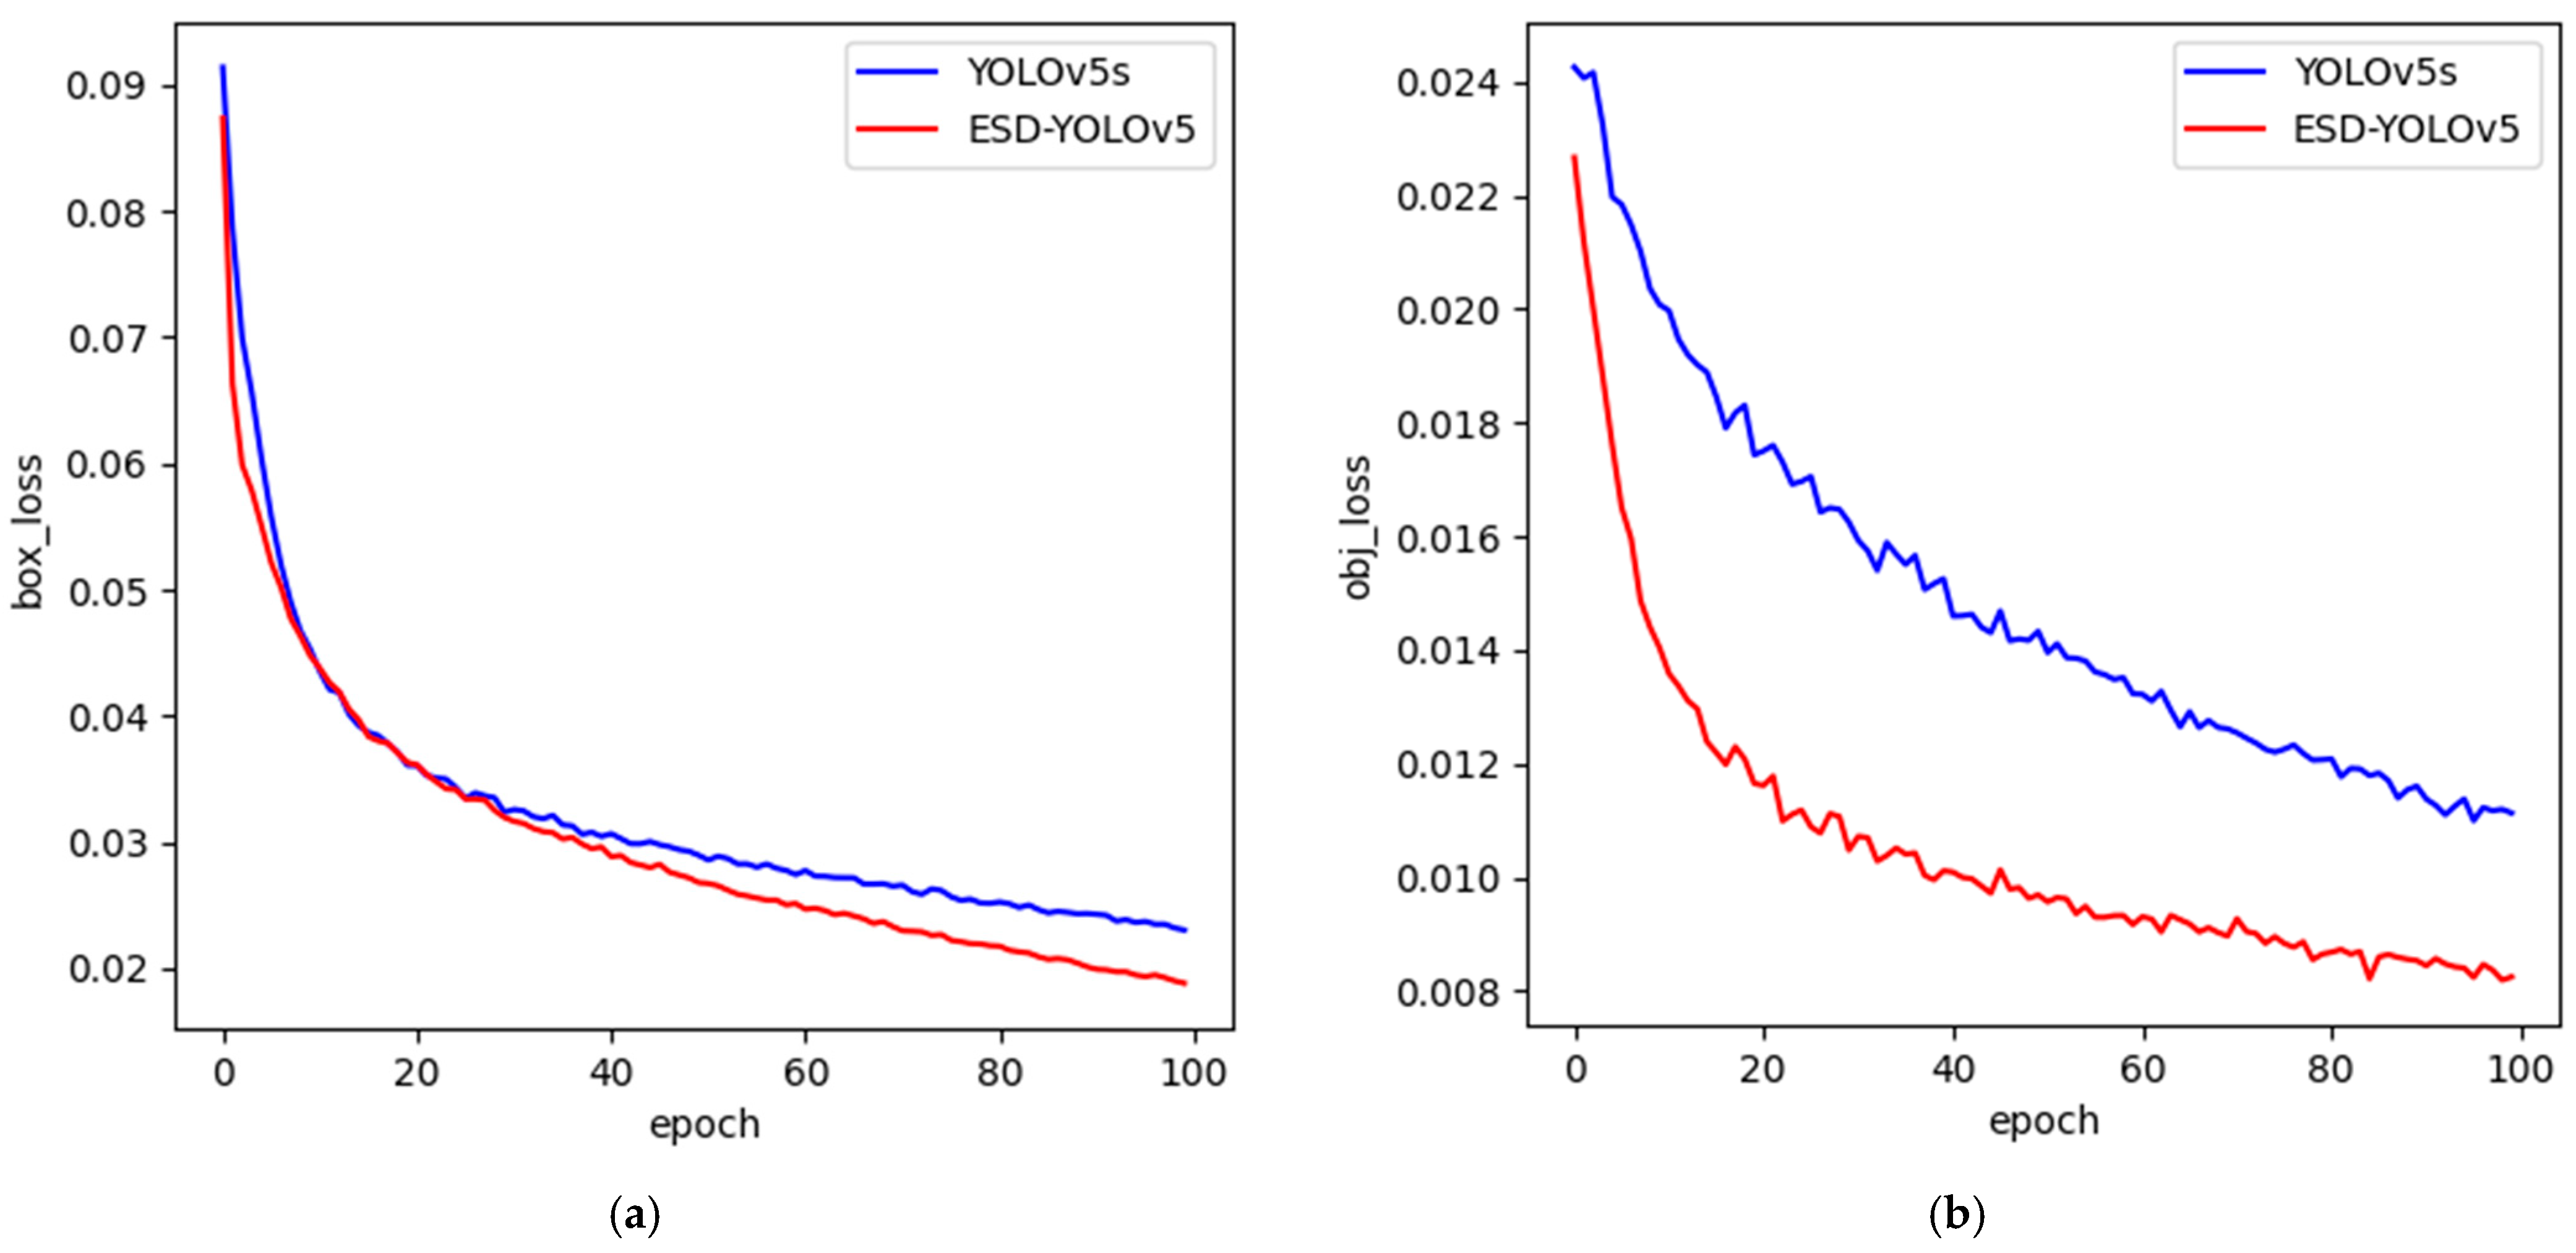
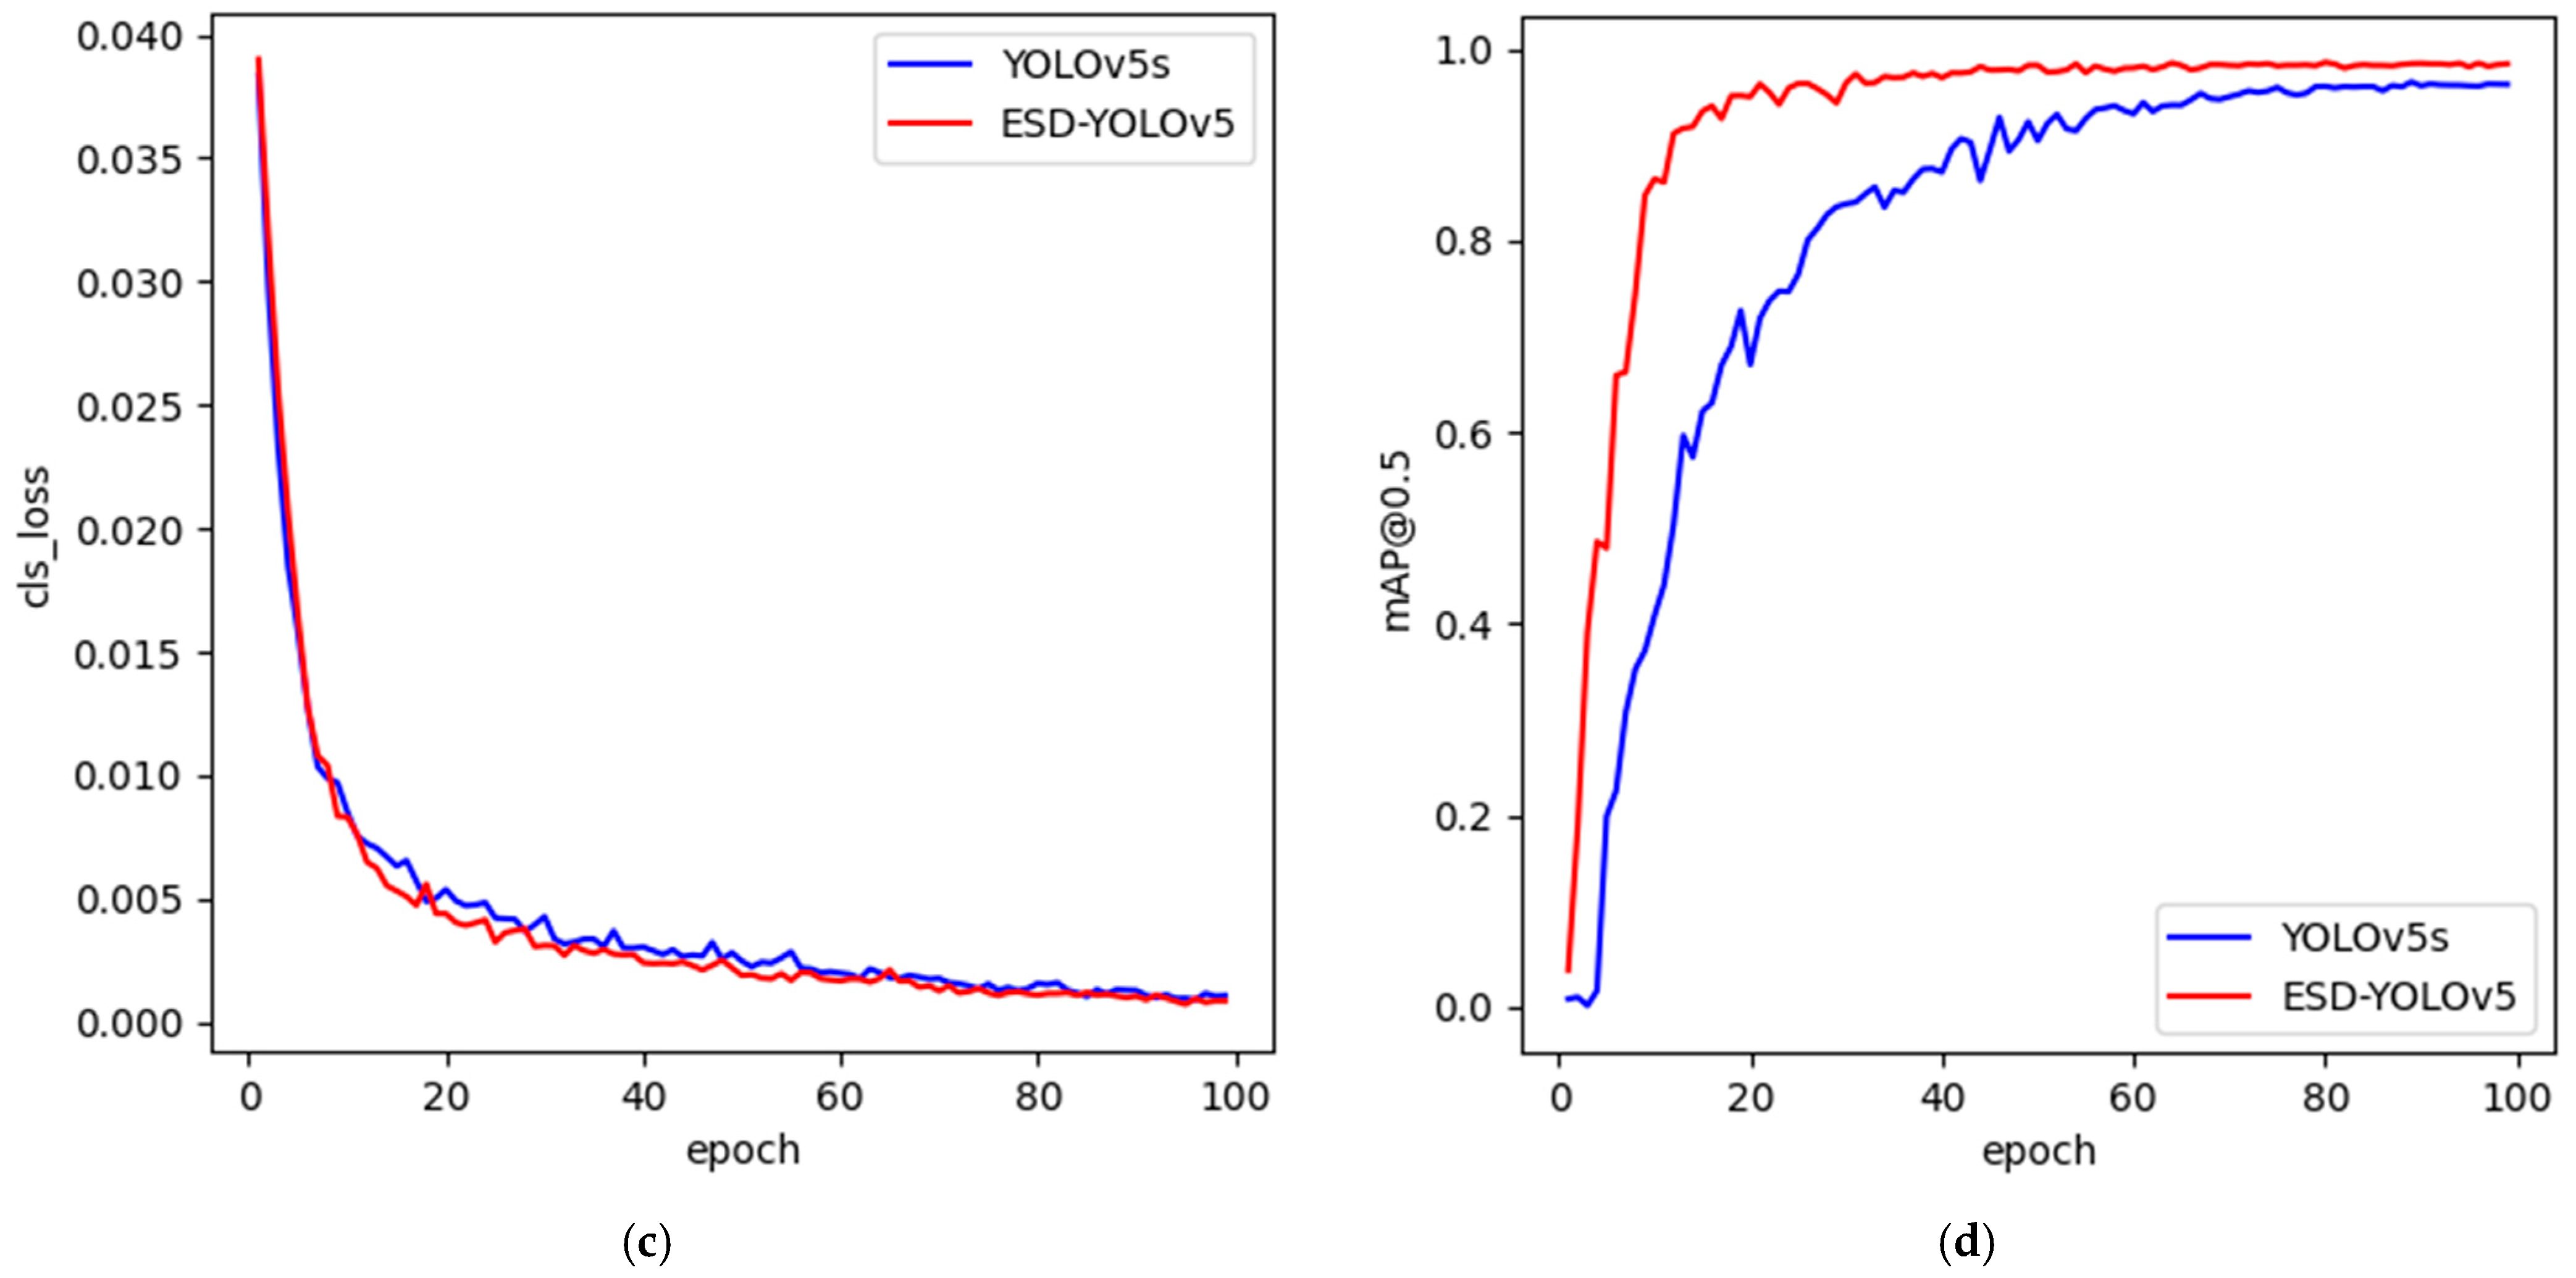
- The introduction of decoupled heads has significantly accelerated the convergence speed of the loss function and enhanced the detection accuracy.
- (4)
- The experiment revealed that ESD-YOLOv5 achieved a 2.3% improvement in mAP compared to YOLOv5s, and it outperformed the current mainstream one-stage object detection algorithms.
7. Conclusions
Author Contributions
Funding
Data Availability Statement
Conflicts of Interest
References
- Zheng, L.; Wang, X.; Wang, Q.; Wang, S.; Liu, X. A fabric defect detection method based on improved yolov5. In Proceedings of the 2021 7th International Conference on Computer and Communications (ICCC), Chengdu, China, 10–13 December 2021; IEEE: Washington, DC, USA. [Google Scholar]
- Yao, J.; Li, J. AYOLOv3-Tiny: An improved convolutional neural network architecture for real-time defect detection of PAD light guide plates. Comput. Ind. 2022, 136, 103588. [Google Scholar] [CrossRef]
- Li, W.; Zhang, H.; Wang, G.; Xiong, G.; Zhao, M.; Li, G.; Li, R. Deep learning based online metallic surface defect detection method for wire and arc additive manufacturing. Robot. Comput.-Integr. Manuf. 2023, 80, 102470. [Google Scholar] [CrossRef]
- Gao, R.; Cao, J.; Cao, X.; Du, J.; Xue, H.; Liang, D. Wind Turbine Gearbox Gear Surface Defect Detection Based on Multiscale Feature Reconstruction. Electronics 2023, 12, 3039. [Google Scholar] [CrossRef]
- Roy, A.M.; Bhaduri, J. DenseSPH-YOLOv5: An automated damage detection model based on DenseNet and Swin-Transformer prediction head-enabled YOLOv5 with attention mechanism. Adv. Eng. Inform. 2023, 56, 102007. [Google Scholar] [CrossRef]
- Available online: https://github.com/ultralytics/yolov5 (accessed on 7 December 2022).
- Bochkovskiy, A.; Wang, C.-Y.; Liao, H.-Y.M. Yolov4: Optimal speed and accuracy of object detection. arXiv 2020, arXiv:200410934. [Google Scholar]
- Li, C.; Li, L.; Jiang, H.; Weng, K.; Geng, Y.; Li, L.; Ke, Z.; Li, Q.; Cheng, M.; Nie, W.; et al. YOLOv6: A single-stage object detection framework for industrial applications. arXiv 2022, arXiv:220902976. [Google Scholar]
- Wang, C.-Y.; Bochkovskiy, A.; Liao, H.-Y.M. YOLOv7: Trainable bag-of-freebies sets new state-of-the-art for real-time object detectors. arXiv 2022, arXiv:220702696. [Google Scholar]
- Wang, Q.; Wu, B.; Zhu, P.; Li, P.; Zuo, W.; Hu, Q. ECA-Net: Efficient channel attention for deep convolutional neural networks. In Proceedings of the IEEE/CVF Conference on Computer Vision and Pattern Recognition, Seattle, WA, USA, 14–19 June 2020. [Google Scholar]
- Hou, Q.; Zhou, D.; Feng, J. Coordinate attention for efficient mobile network design. In Proceedings of the IEEE/CVF Conference on Computer Vision and Pattern Recognition, Nashville, TN, USA, 20–25 June 2021. [Google Scholar]
- Li, H.; Li, J.; Wei, H.; Liu, Z.; Zhan, Z.; Ren, Q. Slim-neck by GSConv: A better design paradigm of detector architectures for autonomous vehicles. arXiv 2022, arXiv:220602424. [Google Scholar]
- Ge, Z.; Liu, S.; Wang, F.; Li, Z.; Sun, J. Yolox: Exceeding yolo series in 2021. arXiv 2021, arXiv:210708430. [Google Scholar]
- Girshick, R.; Donahue, J.; Darrell, T.; Malik, J. Rich feature hierarchies for accurate object detection and semantic segmentation. In Proceedings of the IEEE Conference on Computer Vision and Pattern Recognition, Columbus, OH, USA, 23–28 June 2014. [Google Scholar]
- Girshick, R. Fast r-cnn. In Proceedings of the IEEE International Conference on Computer Vision, Santiago, Chile, 7–13 December 2015. [Google Scholar]
- Ren, S.; He, K.; Girshick, R.; Sun, J. Faster r-cnn: Towards real-time object detection with region proposal networks. Adv. Neural Inf. Process. Syst. 2015, 28, 1137–1149. [Google Scholar] [CrossRef] [PubMed] [Green Version]
- Liu, W.; Anguelov, D.; Erhan, D.; Szegedy, C.; Reed, S.; Fu, C.Y.; Berg, A.C. Ssd: Single shot multibox detector. In Proceedings of the Computer Vision–ECCV 2016: 14th European Conference, Amsterdam, The Netherlands, 11–14 October 2016; Part I 14. Springer: New York, NY, USA. [Google Scholar]
- Redmon, J.; Divvala, S.; Girshick, R.; Farhadi, A. You only look once: Unified, real-time object detection. In Proceedings of the IEEE Conference on Computer Vision and Pattern Recognition, Las Vegas, NV, USA, 27–30 June 2016. [Google Scholar]
- Redmon, J.; Farhadi, A. YOLO9000: Better, faster, stronger. In Proceedings of the IEEE Conference on Computer Vision and Pattern Recognition, Honolulu, HI, USA, 21–26 July 2017. [Google Scholar]
- Redmon, J.; Farhadi, A. Yolov3: An incremental improvement. arXiv 2018, arXiv:180402767. [Google Scholar]
- Available online: https://github.com/ultralytics/ultralytics (accessed on 20 July 2023).
- Simonyan, K. Very deep convolutional networks for large-scale image recognition. arXiv 2015, arXiv:1409.556. [Google Scholar]
- He, K.; Zhang, X.; Ren, S.; Sun, J. Deep residual learning for image recognition. In Proceedings of the IEEE Conference on Computer Vision and Pattern Recognition, Las Vegas, NV, USA, 27–30 June 2016. [Google Scholar]
- Howard, A.G.; Zhu, M.; Chen, B.; Kalenichenko, D.; Wang, W.; Weyand, T.; Andreetto, M.; Adam, H. Mobilenets: Efficient convolutional neural networks for mobile vision applications. arXiv 2017, arXiv:170404861. [Google Scholar]
- Sandler, M.; Howard, A.; Zhu, M.; Zhmoginov, A.; Chen, L.C. Mobilenetv2: Inverted residuals and linear bottlenecks. In Proceedings of the IEEE Conference on Computer Vision and Pattern Recognition, Salt Lake City, UT, USA, 18–23 June 2018. [Google Scholar]
- Howard, A.; Sandler, M.; Chu, G.; Chen, L.C.; Chen, B.; Tan, M.; Wang, W.; Zhu, Y.; Pang, R.; Vasudevan, V.; et al. Searching for mobilenetv3. In Proceedings of the IEEE/CVF International Conference on Computer Vision, Seoul, Republic of Korea, 27 October–2 November 2019. [Google Scholar]
- Zhang, X.; Zhou, X.; Lin, M.; Sun, J. Shufflenet: An extremely efficient convolutional neural network for mobile devices. In Proceedings of the IEEE Conference on Computer Vision and Pattern Recognition, Salt Lake City, UT, USA, 18–23 June 2018. [Google Scholar]
- Ma, N.; Zhang, X.; Zheng, H.T.; Sun, J. Shufflenet v2: Practical guidelines for efficient cnn architecture design. In Proceedings of the European Conference on Computer Vision (ECCV), Munich, Germany, 8–14 September 2018. [Google Scholar]
- Han, K.; Wang, Y.; Tian, Q.; Guo, J.; Xu, C.; Xu, C. Ghostnet: More features from cheap operations. In Proceedings of the IEEE/CVF Conference on Computer Vision and Pattern Recognition, Seattle, WA, USA, 13–19 June 2020. [Google Scholar]
- Tang, Y.; Han, K.; Guo, J.; Xu, C.; Xu, C.; Wang, Y. GhostNetV2: Enhance Cheap Operation with Long-Range Attention. arXiv 2022, arXiv:221112905. [Google Scholar]
- Lin, T.Y.; Dollár, P.; Girshick, R.; He, K.; Hariharan, B.; Belongie, S. Feature pyramid networks for object detection. In Proceedings of the IEEE Conference on Computer Vision and Pattern Recognition, Honolulu, HI, USA, 21–26 July 2017. [Google Scholar]
- Liu, S.; Qi, L.; Qin, H.; Shi, J.; Jia, J. Path aggregation network for instance segmentation. In Proceedings of the IEEE Conference on Computer Vision and Pattern Recognition, Salt Lake City, UT, USA, 18–23 June 2018. [Google Scholar]
- Hu, J.; Shen, L.; Sun, G. Squeeze-and-excitation networks. In Proceedings of the IEEE Conference on Computer Vision and Pattern Recognition, Salt Lake City, UT, USA, 18–23 June 2018. [Google Scholar]
- Woo, S.; Park, J.; Lee, J.Y.; Kweon, I.S. Cbam: Convolutional block attention module. In Proceedings of the European Conference on Computer Vision (ECCV), Munich, Germany, 8–14 September 2018. [Google Scholar]
- Wang, X.; Yang, X.; Zhang, S.; Li, Y.; Feng, L.; Fang, S.; Lyu, C.; Chen, K.; Zhang, W. Consistent-Teacher: Towards Reducing Inconsistent Pseudo-Targets in Semi-Supervised Object Detection. In Proceedings of the IEEE/CVF Conference on Computer Vision and Pattern Recognition, Vancouver, BC, Canada, 18–22 June 2023; pp. 3240–3249. [Google Scholar]
- Xu, B.; Chen, M.; Guan, W.; Hu, L. Efficient Teacher: Semi-Supervised Object Detection for YOLOv5. arXiv 2023, arXiv:2302.07577. [Google Scholar]
- Jiang, B.; Chen, S.; Wang, B.; Luo, B. MGLNN: Semi-supervised learning via multiple graph cooperative learning neural networks. Neural Netw. 2022, 153, 204–214. [Google Scholar] [CrossRef]
- Zheng, Z.; Zhao, J.; Li, Y. Research on detecting bearing-cover defects based on improved YOLOv3. IEEE Access 2021, 9, 10304–10315. [Google Scholar] [CrossRef]
- Lei, L.; Sun, S.; Zhang, Y.; Liu, H.; Xie, H. Segmented embedded rapid defect detection method for bearing surface defects. Machines 2021, 9, 40. [Google Scholar] [CrossRef]
- Xu, J.; Zuo, Z.; Wu, D.; Li, B.; Li, X.; Kong, D. Bearing Defect Detection with Unsupervised Neural Networks. Shock. Vib. 2021, 2021, 9544809. [Google Scholar] [CrossRef]
- Liu, B.; Yang, Y.; Wang, S.; Bai, Y.; Yang, Y.; Zhang, J. An automatic system for bearing surface tiny defect detection based on multi-angle illuminations. Optik 2020, 208, 164517. [Google Scholar] [CrossRef]
- Fu, X.; Li, K.; Liu, J.; Li, K.; Zeng, Z.; Chen, C. A two-stage attention aware method for train bearing shed oil inspection based on convolutional neural networks. Neurocomputing 2020, 380, 212–224. [Google Scholar] [CrossRef]
- Chollet, F. Xception: Deep learning with depthwise separable convolutions. In Proceedings of the IEEE Conference on Computer Vision and Pattern Recognition, Honolulu, HI, USA, 21–26 July 2017. [Google Scholar]
- Li, J.; Yang, Y. HM-YOLOv5: A fast and accurate network for defect detection of hot-pressed light guide plates. Eng. Appl. Artif. Intell. 2023, 117, 105529. [Google Scholar] [CrossRef]
- Guo, Y.; Kang, X.; Li, J.; Yang, Y. Automatic Fabric Defect Detection Method Using AC-YOLOv5. Electronics 2023, 12, 2950. [Google Scholar] [CrossRef]


| Type | Size | Stride | Filters | Output |
|---|---|---|---|---|
| Convolutional | 6 × 6 | 2 | 64 | 320 × 320 × 32 |
| Convolutional | 3 × 3 | 2 | 128 | 160 × 160 × 64 |
| C3 | - | - | 128 | 160 × 160 × 64 |
| Convolutional | 3 × 3 | 2 | 256 | 80 × 80 × 128 |
| C3 | - | - | - | 80 × 80 × 128 |
| Convolutional | 3 × 3 | 2 | 512 | 40 × 40 × 256 |
| C3 | - | - | 40 × 40 × 256 | |
| Convolutional | 3 × 3 | 2 | 1024 | 20 × 20 × 512 |
| C3 | - | - | - | 20 × 20 × 512 |
| ECCA | - | - | - | 20 × 20 × 512 |
| SPPF | 5 × 5 | - | 1024 | 20 × 20 × 512 |
| Step 1 | K objects are randomly selected from the data as the initial cluster centers. |
| Step 2 | The distance between each data object and the cluster center is computed, and the data object is assigned to the cluster corresponding to the closest cluster center. |
| Step 3 | The mean of data objects in each cluster is calculated to obtain new cluster centers. |
| Step 4 | Steps 2 and 3 are repeated until the cluster centers no longer change or until the maximum number of iterations is reached. |
| Defect | Thread | Black Spot | Wear | Dent | Scratch | Total |
|---|---|---|---|---|---|---|
| Number | 926 | 1152 | 1218 | 812 | 1250 | 5358 |
| Configurations | |
|---|---|
| Operating system: Ubuntu 18.04 | |
| Hardware | CPU: Intel(R) Xeon(R) Platinum 8358P |
| GPU: RTX A5000 | |
| Python: 3.9 | |
| Software | CUDA: 11.1 |
| Pytorch: 1.10.0 |
| Prediction | Positive | Negative | |
|---|---|---|---|
| Real | |||
| True | TP | FN | |
| False | FP | TN | |
| Method | Params (M) | FLOPs (G) | mAP@0.5 | FPS |
|---|---|---|---|---|
| YOLOv5s | 7.03 | 15.8 | 96.3% | 137 |
| YOLOv5s + ECA | 7.03 | 15.8 | 96.7% | 137 |
| YOLOv5s + CA | 7.05 | 16.0 | 97.0% | 135 |
| YOLOv5s + ECCA | 7.05 | 16.0 | 97.8% | 135 |
| YOLOv5s + ECCA + Slim-neck | 6.88 | 14.1 | 98.1% | 148 |
| ESD-YOLOv5 | 14.20 | 54.3 | 98.6% | 91 |
| Model | Params (M) | FLOPs (G) | mAP@0.5 | FPS |
|---|---|---|---|---|
| YOLOv5s | 7.0 | 15.8 | 96.3% | 137 |
| YOLOXs | 8.7 | 26.4 | 95.8% | 124 |
| YOLOv6n | 4.6 | 11.3 | 93.7% | 223 |
| YOLOv7tiny | 6.0 | 13.2 | 94.8% | 204 |
| YOLOv8s | 11.14 | 28.7 | 96.3% | 117 |
| YOLOv5m | 20.9 | 48.3 | 97.5% | 96 |
| Ours | 14.2 | 54.3 | 98.6% | 91 |
| Model | mAP@0.5 | |
|---|---|---|
| Hot-Pressed LGP | Fabric | |
| YOLOv5s | 97.8% | 98.2% |
| YOLOXs | 95.3% | 98.0% |
| YOLOv6n | 93.2% | 96.8% |
| YOLOv7tiny | 93.6% | 97.4% |
| Ours | 99.2% | 99.1% |
Disclaimer/Publisher’s Note: The statements, opinions and data contained in all publications are solely those of the individual author(s) and contributor(s) and not of MDPI and/or the editor(s). MDPI and/or the editor(s) disclaim responsibility for any injury to people or property resulting from any ideas, methods, instructions or products referred to in the content. |
© 2023 by the authors. Licensee MDPI, Basel, Switzerland. This article is an open access article distributed under the terms and conditions of the Creative Commons Attribution (CC BY) license (https://creativecommons.org/licenses/by/4.0/).
Share and Cite
Li, J.; Pan, H.; Li, J. ESD-YOLOv5: A Full-Surface Defect Detection Network for Bearing Collars. Electronics 2023, 12, 3446. https://doi.org/10.3390/electronics12163446
Li J, Pan H, Li J. ESD-YOLOv5: A Full-Surface Defect Detection Network for Bearing Collars. Electronics. 2023; 12(16):3446. https://doi.org/10.3390/electronics12163446
Chicago/Turabian StyleLi, Jiale, Haipeng Pan, and Junfeng Li. 2023. "ESD-YOLOv5: A Full-Surface Defect Detection Network for Bearing Collars" Electronics 12, no. 16: 3446. https://doi.org/10.3390/electronics12163446